Technical Memorandum
DATE: May 15, 2014
TO: Boston Region Metropolitan Planning Organization
FROM: Beth Isler, PE/PTP
RE: Bicycle Network Evaluation
Local, regional, and state agencies in the Boston metropolitan region have been actively working for decades to improve its bicycling infrastructure. As a result of these efforts, a regional network of on- and off-road facilities is evolving. Traditionally however, bicycle facilities in the US have been built primarily as recreational accommodations rather than as part of the bicycle transportation network. Often, the result is a fragmented system of paths that do not connect key origins and destinations and are not always usable for utilitarian trips.
Although the Boston region has made strides towards a bicycle network that serves all trips and connects to the larger transportation system (the Minuteman Commuter Bikeway is a prime example of such an approach), there are gaps because of a lack of coordinated planning, funding, and right-of-way (ROW); as well as physical obstructions, such as waterways, bridges, roadways, and railroads. The objective of this project is to enhance bicycle connectivity and safety by identifying and prioritizing regionally significant gaps within the existing bicycle network between major regional origin and destination points.
This bicycle-network evaluation uses technical analysis based on a diverse set of criteria to envision a more cohesive network within the MPO region. The study uses Geographic Information Systems (GIS) to evaluate network gaps according to how well they would support bicycle connectivity and maximize safe access throughout the region. This analysis can be applied as a tool to assess additional gaps. Recommendations for advancing the 11 highest-priority gaps are included.
This project advances the goals of the Boston Region MPO Regional Bicycle Plan1 developed with the Metropolitan Area Planning Council (MAPC); furthers the mobility goals discussed in the Long-Range Transportation Plan (LRTP) Paths to a Sustainable Region;2 assists in implementing the Massachusetts Department of Transportation (MassDOT) Bicycle Transportation Plan and the Bay State Greenway;3 encourages the shared use of infrastructure recommended in the youMove Massachusetts Report;4 and builds upon the ongoing work of the MPO’s Congestion Management Process. Moreover, it supports the MassDOT secretary of Transportation’s Healthy Transportation Compact5, GreenDOT6, and Mode Shift goals.
A steering committee of bicycle representatives from MassDOT and MAPC guided this project. At the outset of the study, staff presented its approach and methodology to the Massachusetts Bicycle and Pedestrian Advisory Board for feedback. Reviewers from Livable Streets Alliance and Northeastern University also provided valuable input.
This report documents existing conditions, the evaluation methodology, identified network gaps, analysis results, and recommended potential connections for the highest-priority ‘gaps’ along with their potential ‘connections’ (see definition in Methodology section on next page).
The purpose of this project is to 1) identify gaps in the regional bicycle network; 2) prioritize them; and 3) analyze the top-ranking network gaps in terms of potential construction projects, or other remedial actions, which may be considered for design and funding in the Transportation Improvement Program (TIP). This study does not address expansions outside of the network.
The steps in this project are:
For this project, there is a critical difference between what constitutes a gap and how it is evaluated. Although technically a gap could be a lack of access based on an operational issue, socio-demographic barrier, or physical obstruction, for the purposes of this study, a gap is defined as a lack of a physical connection between bicycle facilities or between a bicycle facility and a regional transit station (commuter rail, rapid transit, key bus route). In contrast, important criteria such as access to activity centers, employment, schools, etc., are taken into account during the evaluation phase of the project, which is described in the Evaluation Methodology Section below.
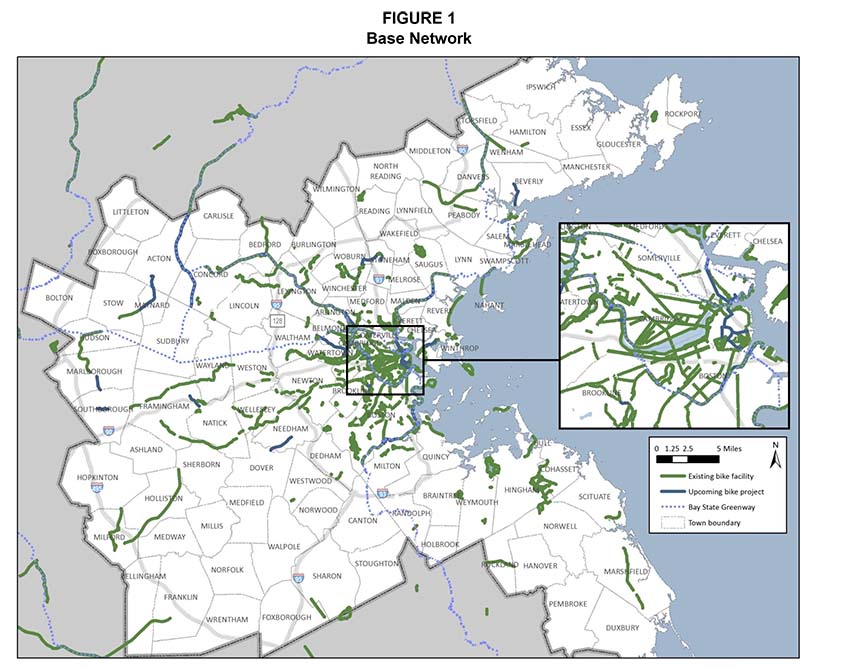
It is important to take a systematic approach to the inventory of facilities that comprise the regional bicycle network evaluated in this study. Therefore, the base network is defined as existing and upcoming:
Upcoming projects are defined as those listed in the Federal Fiscal Years (FFYs) 2014-17 TIP or with an MPO status of “Advertised.” Shared lanes, roadways with sharrows, and on-road routes that do not include marked bike lanes (for example, the Claire Saltonstall Bikeway) are not included in this study.
The starting point for the base network map (Figure 1) was the MAPC’s 2012 Greater Boston Cycling and Walking Map. Staff used GIS for the analysis in this study.
As stated above, this study defines as a gap as a lack of a physical connection7 between bicycle facilities or between a bicycle facility and a regional transit station (commuter rail, rapid transit, key bus route). Although technically a gap could be a lack of access based on an operational issue, socio-demographic barrier, or physical obstruction, these criteria are considered during the evaluation of the gaps in order to identify which ones are most significant. Where appropriate (given the parameters of this study), gaps were overlaid on conceptual alignments to evaluate how well they would function as actual connections in the overall transportation system (for example, the Upper Charles Trail in Sherborn). Generally, isolated facilities such as the bike trails in Pond Meadow Park in Braintree or Breakheart Reservation in Saugus were not considered to serve the regional bicycle network, so potential connections linking them to the rest of the network were not evaluated.
In order to identify the relative efficacy of potential connections in creating a more cohesive, continuous network within the Boston MPO region, staff developed a scoring methodology (Table 1). Staff employed GIS analysis to determine whether the gaps/potential connections would address the selected evaluation criteria, and then calculated a final score. Appendix A walks through the methodology step-by-step using the North Shore Task Force subregion as an example. Gaps were identified by sketching ellipses to show the general location of the gap, and then the evaluation criteria were overlaid to indicate the strength of the potential connection.
To assure consistency with other regional plans, points were assigned to gaps for which another plan already has identified a need or a potential connection. These plans provide data and insight about existing network gaps:
Moreover, the processes that were used to develop these plans solicited public input and have been vetted by the Massachusetts bicycling public. For example, the 2008 Massachusetts Bicycle Transportation Plan outlines a long-term vision for a statewide bicycle network, the Bay State Greenway. Although only approximately 200 miles of this 750-plus mile on- and off-road network have been constructed, its long-term goal and the work that has been completed in support of it is valuable and therefore is folded into this evaluation.
TABLE 1
Evaluation Criteria and Methodology
| Does it provide access to… | |
| An underserved community/Environmental-Justice population? | |
| Minority Census Block Group | 1 point |
| Low-Income Census Block Group | 1 point |
| English Isolation Census Block Group | 1 point |
| Employment? | |
| <100 employees/0.5 square mile | 0 points |
| 100-500 employees/0.5 square mile | 1 point |
| 501-5000 employees/0.5 square mile | 2 points |
| >5000 employees/0.5 square mile | 3 points |
| A municipal center? | |
| Town hall or public library | 1 point |
| Central business district? | |
| Primary use code (per zoning) is central business | 1 point |
| School? | |
| K-12, public, private, charter, collaborative, and special | 1 point |
| University or college? | |
| Total enrollment > 1500 | 1 point |
| A park or open space? | |
| Public open space (including National Park Service sites) or state parks | 1 point |
| Does it serve a TAZ that is forecasted to have more than the mean (2200) bike/pedestrian trips in 2035?1 | |
| Yes/no | 1 point |
| Would new facility provide an opportunity to address an existing safety issue? | |
| Does it intersect or provide an alternate route from a MassDOT Crash Cluster (2009-2011)?2 | |
| Crash cluster (931 within region) | 2 points |
| Bike crash cluster (46) | 3 points |
| Top 200 statewide crash cluster (129 within region) | 3 points |
| Is it consistent with recommendations from previous significant plans? | |
| Bay State Greenway Network | 1 point |
| Livable Streets Alliance Green Routes | 1 point |
| MPO Long-Range Transportation Plan (LRTP) Needs Assessment | 1 point |
| MPO/MAPC Regional Bicycle Plan | 1 point |
| Northeastern University Regional Bicycle Plan | 1 point |
1The CTPS regional transportation model was used to provide future (20 years, or 2035) bicycle and pedestrian trip tables. These data were calculated at the level of disaggregated geographic areas known as traffic analysis zones (TAZs). The trip tables include bicycle and pedestrian trip productions and trip attractions for all trip purposes based on existing and future year demographic and socioeconomic data. The model calculates the number of trip productions within a TAZ using generation rates obtained from travel surveys and the number of trip attractions using land use data. These are estimated as a function of household size, workers per household, vehicles per household, income, household location, households, basic employment, retail employment, college employment, school employment, and service employment. Forecasts in the model were developed by MAPC based on its MetroFuture scenario. 2"The 'Top High Crash Intersection Locations' are based on a clustering of crashes that have been submitted to the statewide crash system at the Registry of Motor Vehicles and located to a geographical point. They have been ranked based on the weighting of the number and severity of crashes. This should only be used as an initial evaluation tool. To obtain details on the methodology used, the limitations of the data and/or a listing of textual data for the top crash locations please contact CrashDataRequest@mhd.state.ma.us or call 617-973-8484. It should be noted that the Top Crash Locations data was compiled under the authority of United States Code Title 23, Section 148(g) (4) which states that such data 'shall not be subject to discovery or admitted into evidence in a Federal or State court proceeding or considered for other purposes in any action for damages arising from any occurrence at a location identified or addressed in such reports, surveys, schedules, lists, or other data." Source: http://services.massdot.state.ma.us/maptemplate/TopCrashLocations/.
Note: The following limitations should be noted regarding the use of the regional model to derive bicycle and pedestrian trip tables:
1) The model combines bike trips with pedestrian trips. 2) The model does not consider factors that affect bicycle mode choice, such as safety, availability of bicycle infrastructure, or geographical preferences for bicycling. 3) -The model is calibrated at the regional level rather than the TAZ level. 4) However, using the regional model to estimate bicycle demand is advantageous because it generates trip tables through a systematic and comprehensive process where numerous data on existing and future bicycle traffic generators is taken into consideration.
The methodology includes an inherent bias towards longer gaps since they have more opportunities to encounter the defined criteria and score more points.8 Therefore, results are organized by distance to identify the long, medium, and short connections with the strongest potential. Results were first organized into groups by gap length, and then divided into high, medium, and low priority. Figure 2 summarizes the number of gaps in each distance category. Table 2 summarizes the overall scoring metrics.
TABLE 2
Overall Scoring Metrics
Maximum possible points |
25 |
Number of gaps identified |
234 |
Highest score |
24 (Somerville Community Path) |
Lowest score |
2 (various) |
Mean |
9 |
Median |
8 |
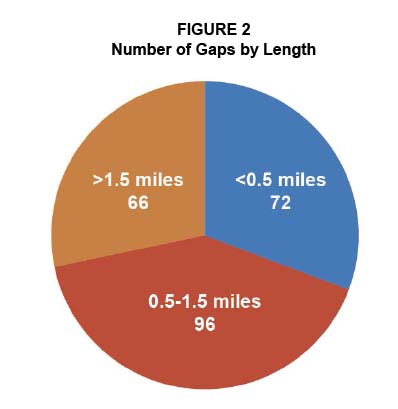
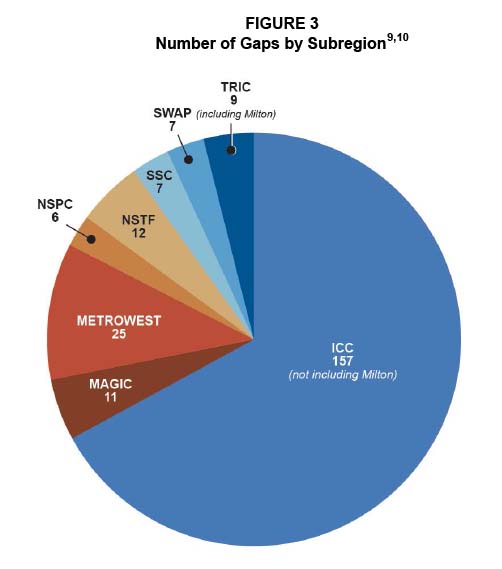
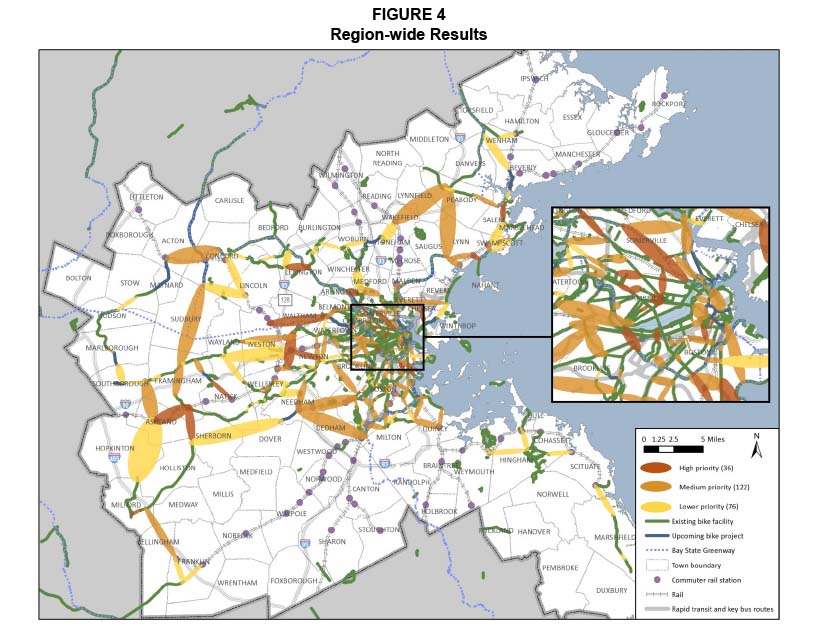
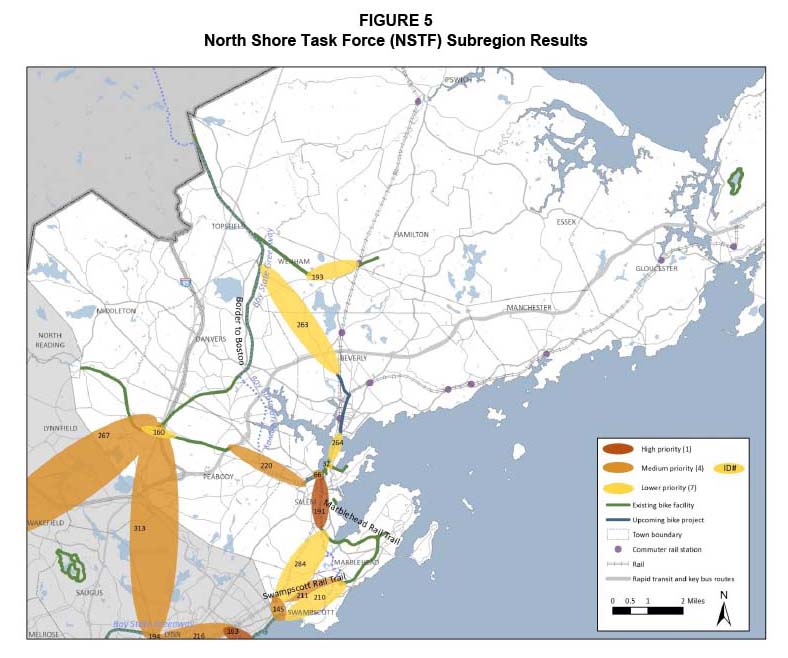
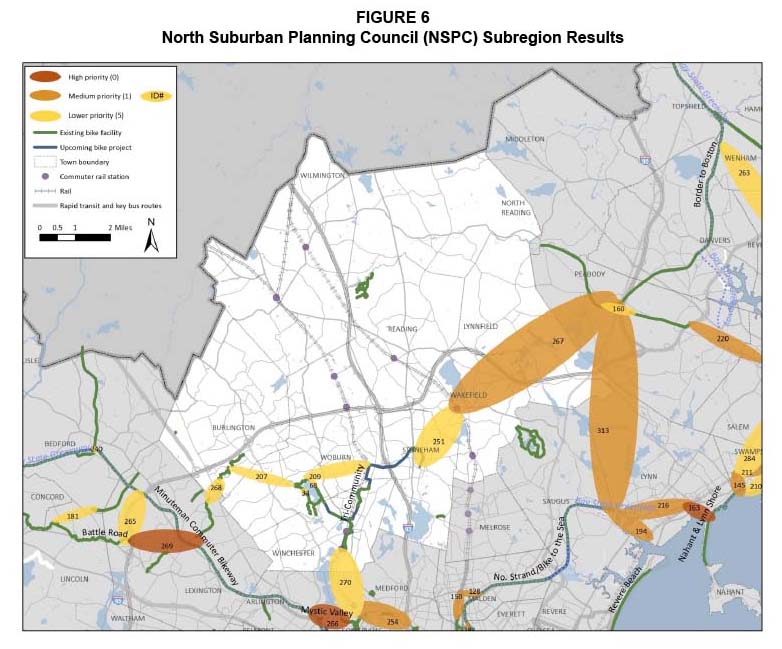
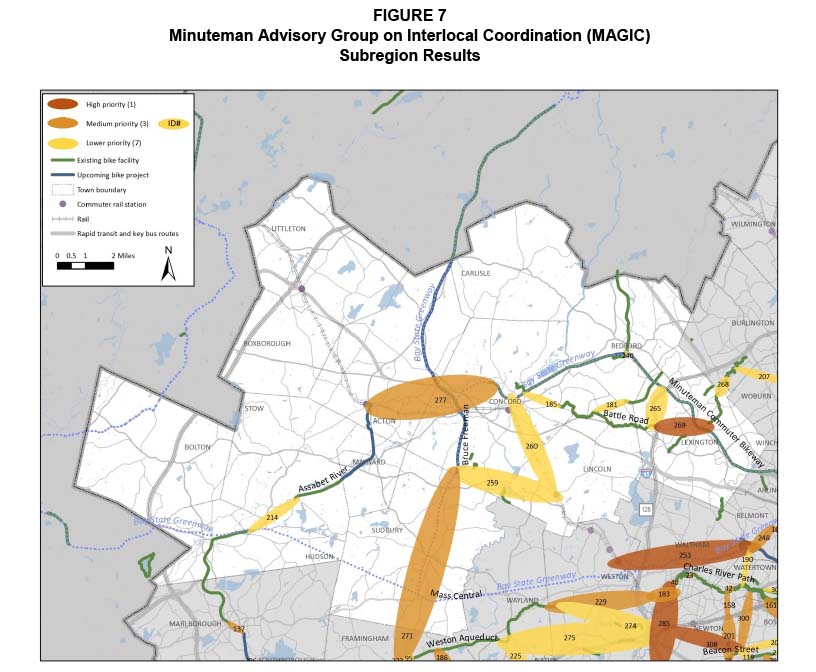
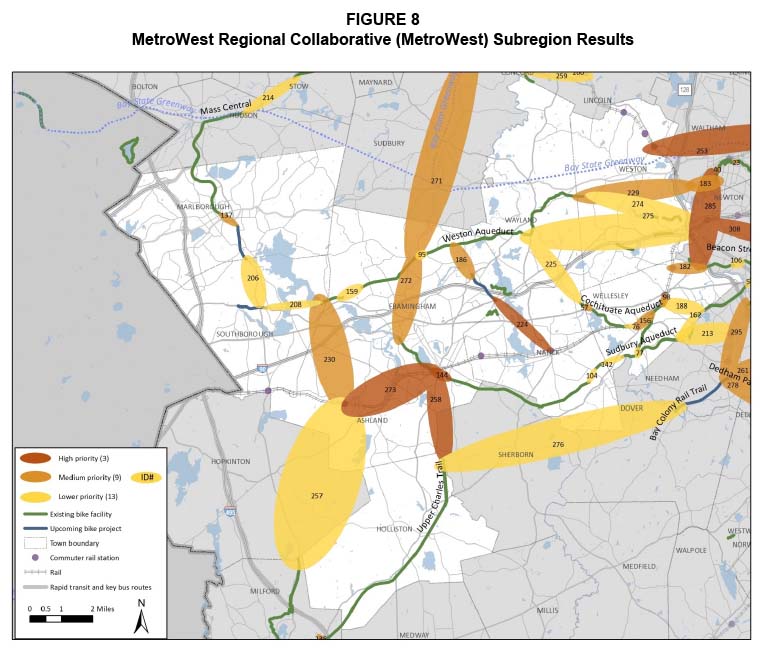
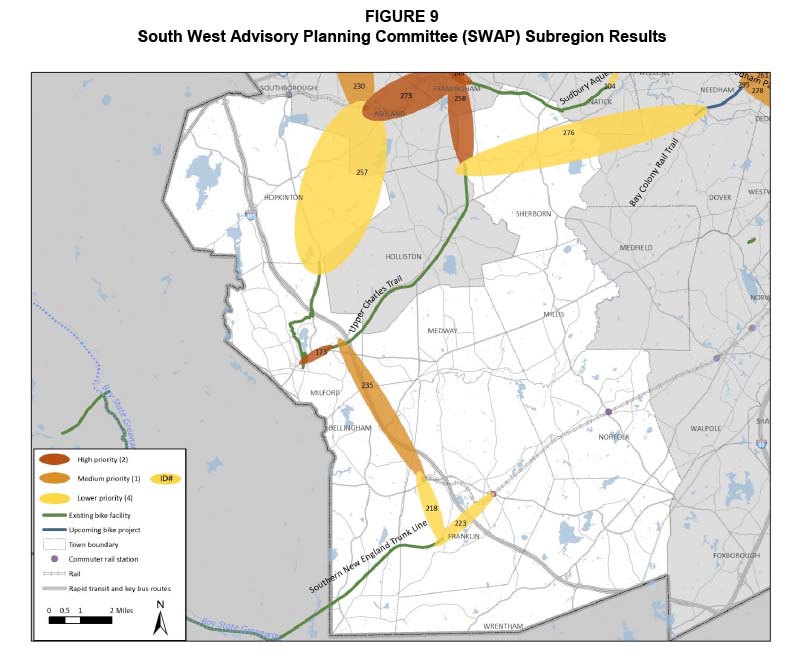
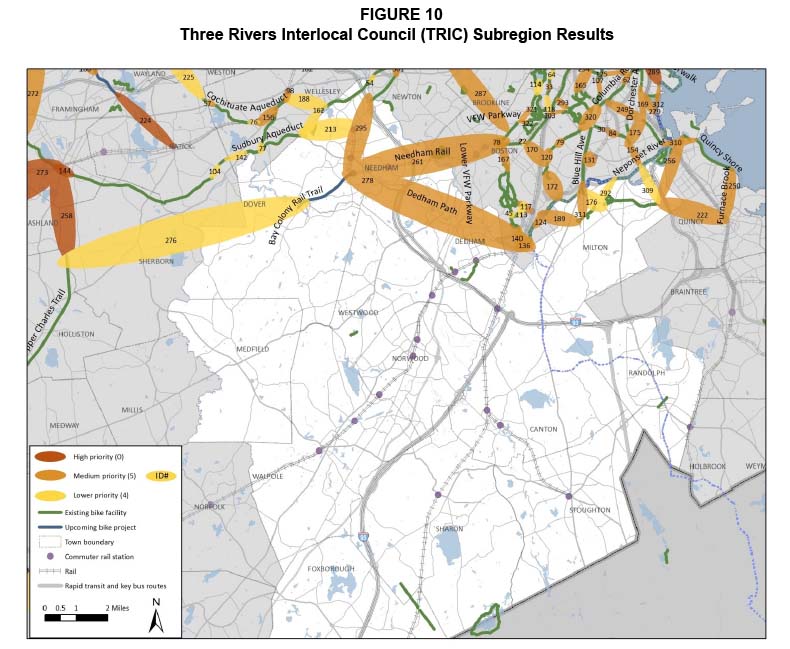
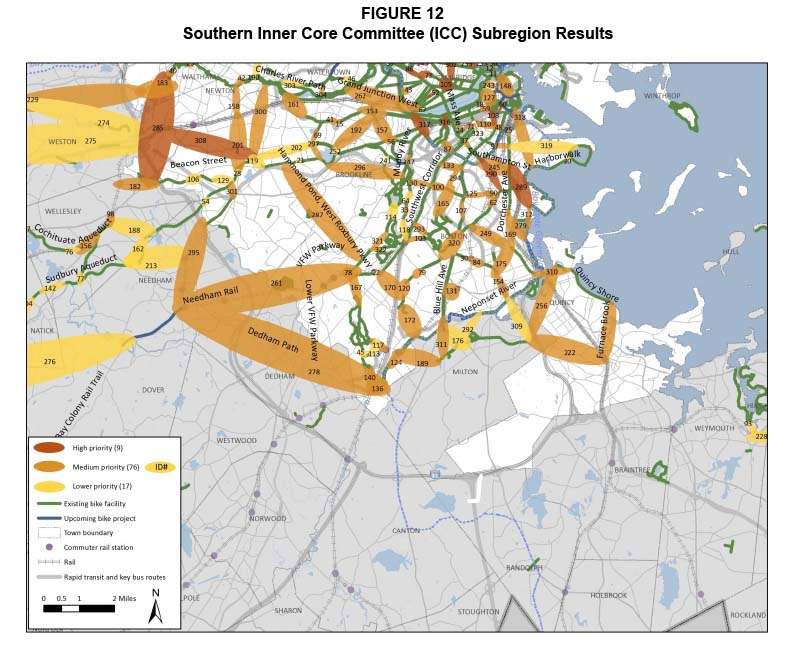
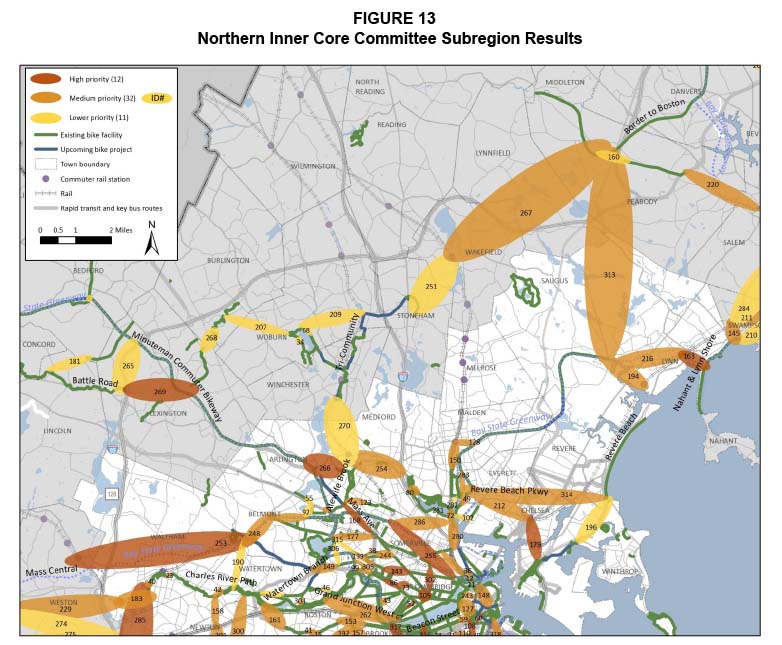
Figure 3 shows that the majority of gaps are in or close to Boston, in the Inner Core Committee (ICC); and Figure 4 on the next page shows the results for the entire Boston region. Figures 5 through 13 show the results for each MAPC subregion. Appendix B provides the complete table of scoring results. Section 5 goes into greater detail on the highest priority gaps.910
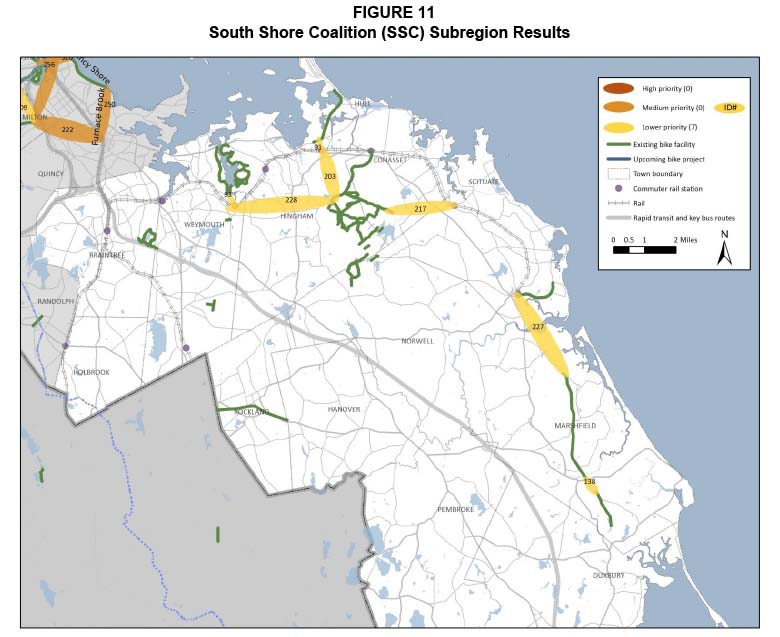
Besides the gaps identified in this study, there are areas within the region (such as TRIC and SSC) with so few bicycle facilities (on-road lanes, protected lanes, or off-road paths) that they do not meet the definition of a gap for this study. Connecting these areas to the rest of the regional network would involve outward expansions of the existing network (for example, extending the Bay Colony Rail Trail south). However, this does not mean that there are not existing desire lines or needs for facilities in those areas. They should be considered in subsequent updates to this study.
In addition, many bike lanes are not continuous, disappearing for a block or through an intersection. For example, the bike lanes on Purchase Street and Atlantic Avenue adjacent to the Rose Kennedy Greenway in Boston are intermittent in spots. Although these gaps do not show up in this regional-scale analysis, they can be significant barriers and should be addressed on the corridor or project level.
One-way streets, such as Dartmouth Street in Boston, also can prove to be a significant block in a bicyclist’s route. Although technically there is a bicycle facility on that street, the one-way direction presents restrictions. So, even when motor vehicle travel is only one-way, when feasible, contraflow lanes and other design opportunities should be pursued to maximize bicycle connectivity.
This section recommends potential improvements and identifies next steps for addressing the 11 highest-priority gaps across the distance categories. The section is organized into three categories of connections:
"
|
|
ID # |
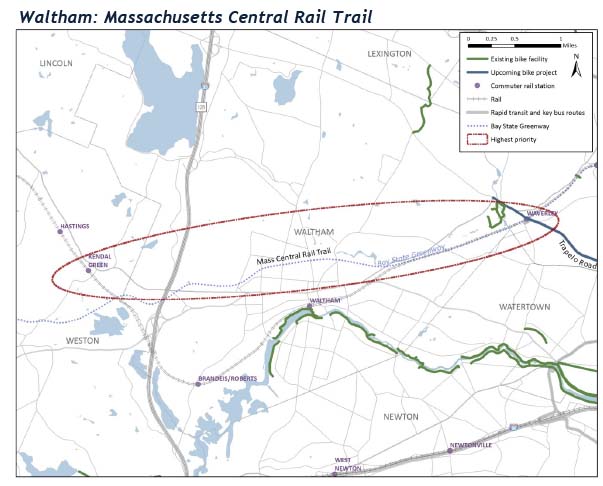
253 |
Town |
Waltham, Weston, Belmont |
Location |
Wayside Rail Trail/Massachusetts Central Rail Trail between Waverly and Kendall Green Commuter Rail stations; connects Trapelo Road in Belmont to Kendall Green in Weston |
Distance |
Long (>1.5 miles) |
Existing Conditions |
MBTA ROW (abandoned); Feasibility study completed by CTPS in 1997 determined that it is feasible to build the trail |
Proposed Improvements |
Shared-use path along the alignment of the former Massachusetts Central Railroad |
Potential Challenges |
Land ownership |
Potential Funding Sources and/or Partners |
MassDOT, Massachusetts Central Rail Trail Coalition, MBTA, City of Waltham, Department of Conservation and Recreation (DCR) |
Next Steps |
Address land-ownership/ROW issues, assign maintenance responsibilities; DCR has already secured a lease from MBTA, and funding for preliminary planning |
|
||
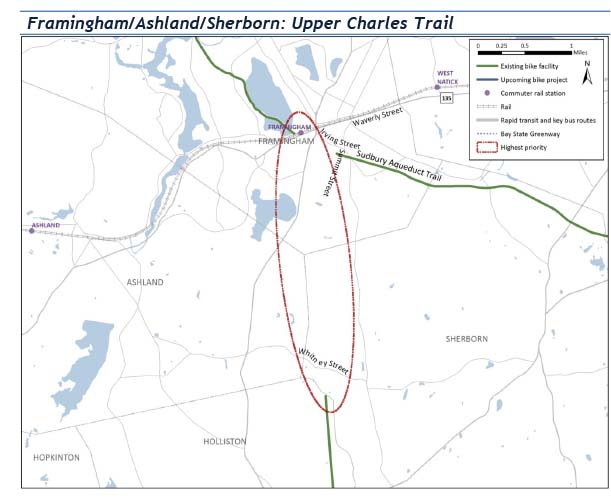
ID # |
258 |
|
Town |
Framingham, Ashland, Sherborn |
|
Location |
Upper Charles Trail between Framingham Commuter Rail station and existing trail in Holliston; connects Waverly Street in Framingham and Whitney Street in Sherborn |
|
Distance |
Long (>1.5 miles) |
|
Existing Conditions |
CSX Corporation ROW (out of service); Feasibility study completed by MAPC in 1997 determined that it is feasible to build the trail |
|
Proposed Improvements |
Shared-use path along out of service CSX ROW |
|
Potential Challenges |
Negotiations with CSX |
|
Potential Funding Sources and/or Partners |
MassDOT, Framingham, Ashland, Sherborn |
|
Next Steps |
Continue negotiations with CSX |
|
|
|
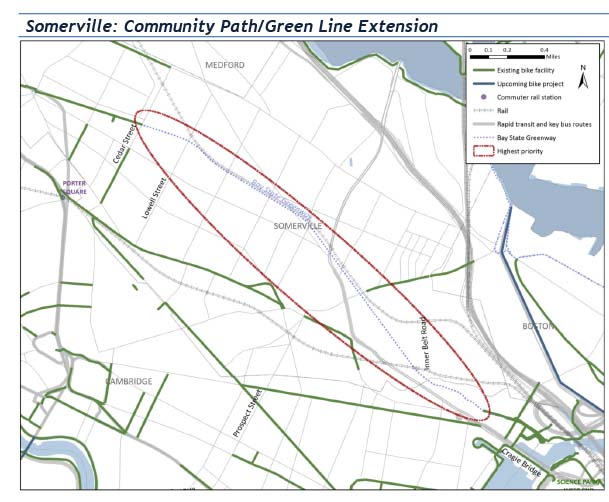
ID # |
255 |
Town |
Cambridge, Somerville |
Location |
From Charles River/Museum of Science/Cragie Bridge northwest to Lowell Street, as part of proposed Somerville Community Path/Green Line Extension |
Distance |
Long (>1.5 miles) |
Existing Conditions |
Section between Lowell Street and Inner Belt Road (north of Lechmere) to be constructed with Green Line Extension Project; Cedar Street to Lowell Street section (connecting with existing Community Path) currently under construction by MassDOT (Project ID 604331) |
Proposed Improvements |
Rail-with-trail |
Potential Challenges |
Space constraints |
Potential Funding Sources and/or Partners |
MassDOT, MBTA, City of Cambridge, City of Somerville, DCR |
Next Steps |
Identify construction funds |
|
|
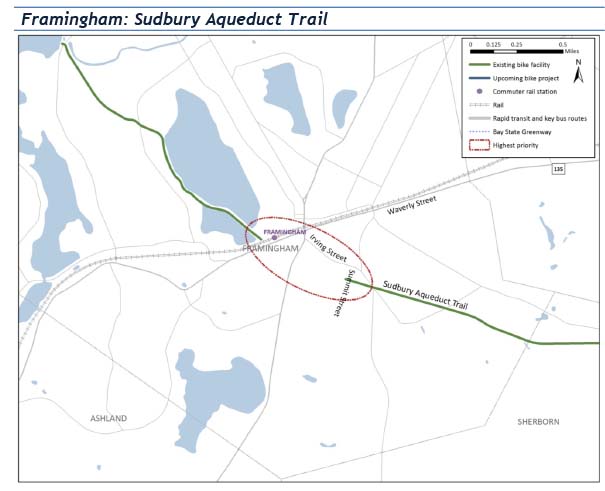
ID # |
144 |
Town |
Framingham |
Location |
Sudbury Aqueduct Trail between Framingham Commuter Rail station and existing trail at Summit Street |
Distance |
Medium (>1/2 mile) |
Existing Conditions |
Undeveloped ROW through densely-settled urban area |
Proposed Improvements |
MAPC has supported exploration of trail improvements with MA Water Resources Authority (MWRA); on-road connection along Irving Street to connect commuter rail in downtown Framingham to aqueduct |
Potential Challenges |
Maintenance responsibilities; constrained ROW because of encroachment |
Potential Funding Sources and/or Partners |
MWRA, Town of Framingham, MassDOT, DCR |
Next Steps |
Investigate feasibility of Irving Street or other on-road connection |
|
|
ID # |
289 |
Town |
Boston |
Location |
Through Preble Circle along Old Colony Avenue/Morrissey Blvd. to Dorchester Harborwalk |
Distance |
Medium (>1/2 mile) |
Existing Conditions |
On-road route; no defined bicycle facilities |
Proposed Improvements |
Cycle track on Morrissey Boulevard |
Potential Challenges |
Morrissey Blvd rotary (Kosciuszko Circle) |
Potential Funding Sources and/or Partners |
MassDOT, City of Boston, UMASS, MBTA, DCR |
Next Steps |
Investigate feasibility of cycle track or other facility on or adjacent to Morrissey Boulevard |
|
|
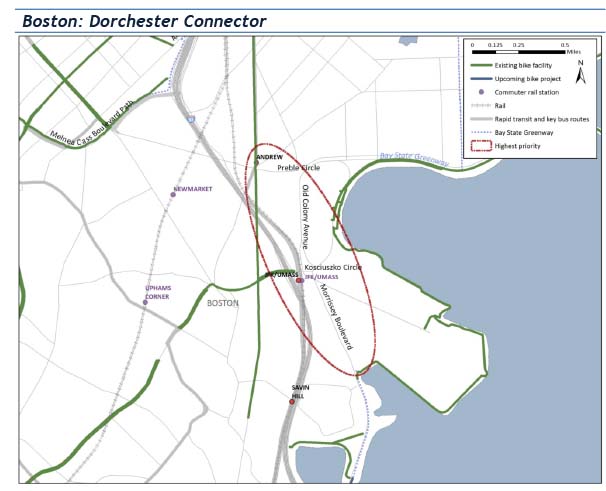
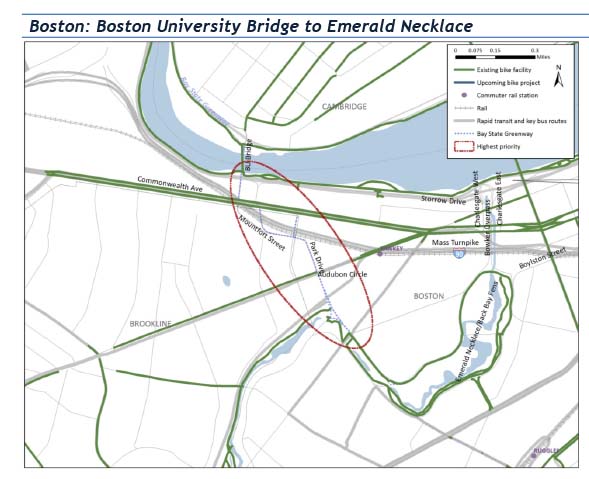
ID # |
317 |
Town |
Boston |
Location |
From BU Bridge along Mountfort Street and Park Drive to the Fenway |
Distance |
Medium (>1/2 mile) |
Existing Conditions |
On-road route; no defined bicycle facilities |
Proposed Improvements |
Connect from Emerald Necklace to Commonwealth Avenue bike lanes; Boston Bike Plan includes this connection in its build-out plan; on-street lanes on Park Drive and other streets (possibly contraflow where applicable) |
Potential Challenges |
Audubon Circle, Massachusetts Turnpike |
Potential Funding Sources and/or Partners |
MassDOT, City of Boston, City of Cambridge, Emerald Necklace Conservancy, DCR |
Next Steps |
Investigate feasibility |
|
|
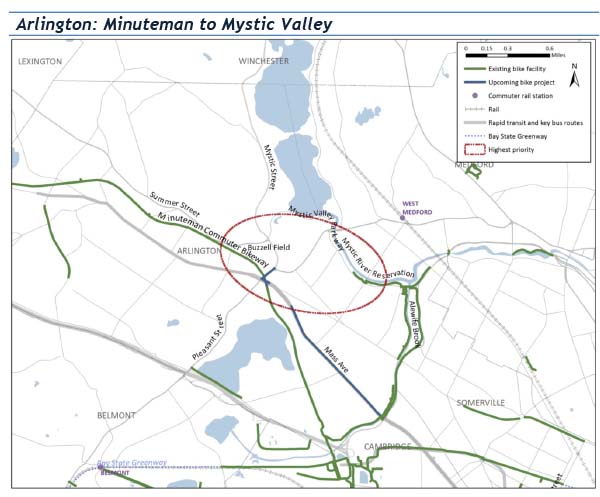
ID # |
266 |
Town |
Arlington |
Location |
Mystic Valley Parkway/Summer Street corridor between Minuteman Commuter Bikeway and Mystic Valley Parkway Bike Path |
Distance |
Medium (>1/2 mile) |
Existing Conditions |
On-road route; no defined bicycle facilities. |
Proposed Improvements |
Extension/rehabilitation of the existing Mystic Valley Parkway bike path; connection between Mystic Valley Parkway bike path and the Minuteman Commuter Bikeway via existing path on Summer Street (at Buzzell Field) |
Potential Challenges |
|
Potential Funding Sources and/or Partners |
MassDOT, Town of Arlington |
Next Steps |
Rehabilitation of existing paths on Mystic Valley Parkway and Summer Street |
|
|
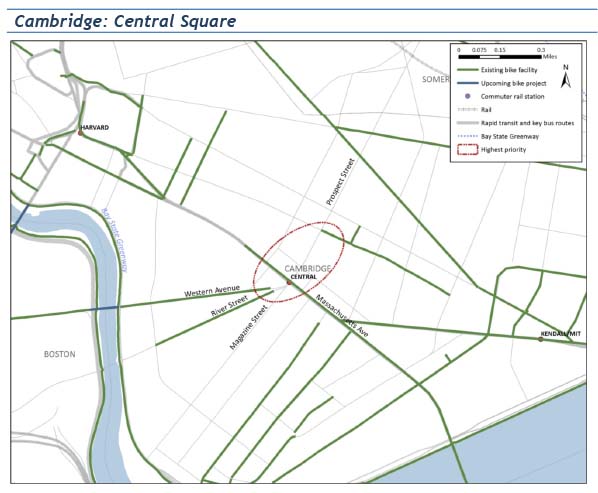
ID # |
73 |
Town |
Cambridge |
Location |
Central Square – Intersections of Massachusetts and Western Avenues, River, Prospect and Magazine Streets |
Distance |
Short (<1/2 mile) |
Existing Conditions |
On-road route; no defined bicycle facilities |
Proposed Improvements |
On-road connection along Prospect Street to connect Western Avenue across Massachusetts Avenue and to the northeast |
Potential Challenges |
Constrained ROW, space limitations |
Potential Funding Sources and/or Partners |
MassDOT, City of Cambridge |
Next Steps |
Investigate feasibility of on-street connections through Central Square |
|
|
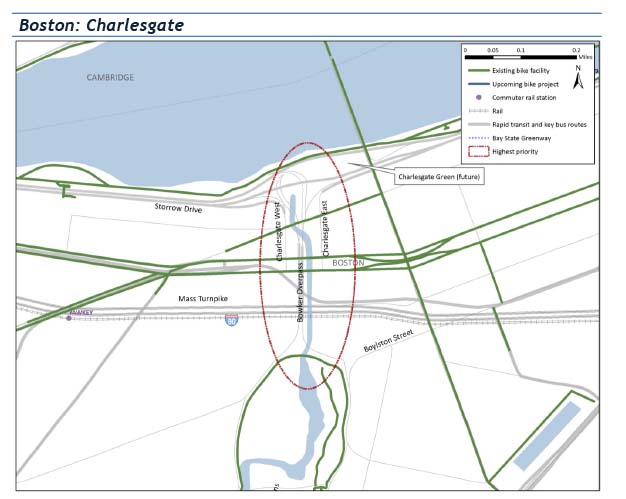
ID # |
316 |
Town |
Boston |
Location |
Charlesgate East and West between Storrow Drive and Boylston Street, including the Bowker Overpass |
Distance |
Short (<1/2 mile) |
Existing Conditions |
On-road route; no defined bicycle facilities; gap in historic Emerald Necklace between Back Bay Fens and Esplanade/Charles River Path |
Proposed Improvements |
MassDOT has committed to constructing Charlesgate Green, which would connect Beacon Street and Charles River Path; Boston Bike Plan recommends path along east side of Charlesgate to complete the connection, Northeastern University plan (below) suggests path along west side, along with realigning median on Bowker Overpass over the Massachusetts Turnpike |
Continued next page |
|
“Northeastern University’s Civil Engineering Transportation Design Capstone: Charlesgate Connection” (2008) suggests a shared-use path (in yellow, left) over Commonwealth Avenue on the west side of the Bowker Overpass, and then continuing the path on to the overpass to cross the Massachusetts Turnpike (in green, below left and yellow, below right). 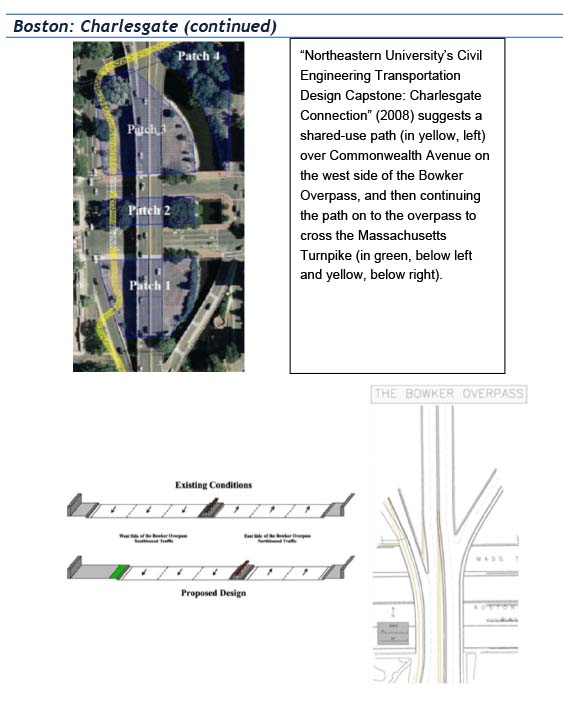 |
|
|
|
Potential Challenges |
Massachusetts Turnpike, Bowker Overpass |
Potential Funding Sources and/or Partners |
MassDOT, City of Boston, Emerald Necklace Conservancy, DCR |
Next Steps |
Investigate feasibility of various proposed plans |
|
|
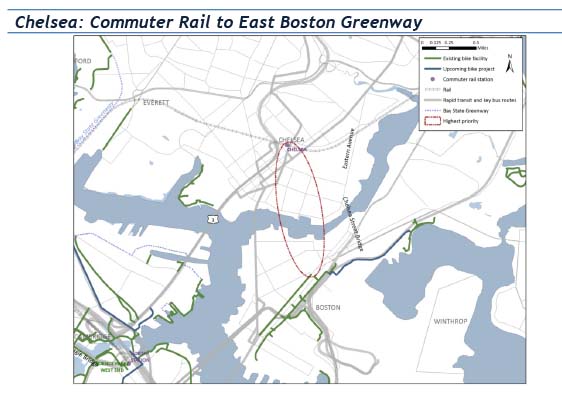
ID # |
179 |
Town |
Chelsea, Boston |
Location |
From Chelsea Commuter Rail station along proposed Chelsea Greenway over the Chelsea Street Bridge to the East Boston Greenway |
Distance |
Medium (>1/2 mile) |
Existing Conditions |
MassDOT-owned railroad ROW (abandoned) between Chelsea Station and Eastern Avenue; on-road route: no defined bicycle facilities between Chelsea Street Bridge and East Boston Greenway |
Proposed Improvements |
MassDOT Silver Line Gateway project includes a shared use path, the Chelsea Greenway, between downtown Chelsea and Eastern Avenue; connection between Eastern Ave and East Boston Greenway would need to be addressed |
Potential Challenges |
Land ownership |
Potential Funding Sources and/or Partners |
MassDOT, Massport, City of Boston, City of Chelsea |
Next Steps |
Work with MassDOT to advance Chelsea Greenway via the Silver Line Gateway project; explore feasibility of off-road (preferable) or on-road connection from Chelsea Greenway to East Boston Greenway |
|
|
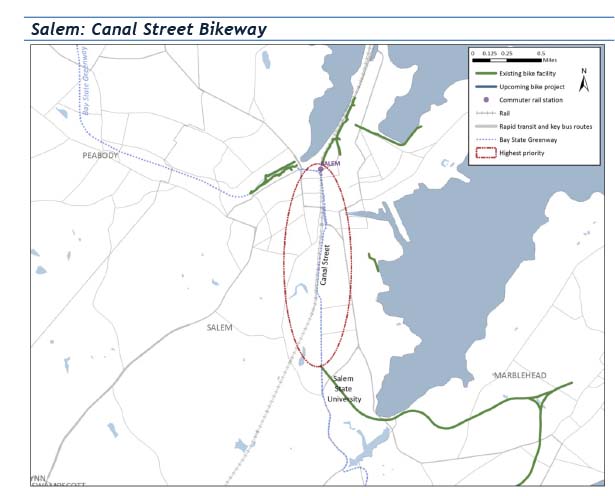
ID # |
191 |
Towns |
Salem, Marblehead |
Location |
Salem Commuter Rail station to Marblehead Rail Trail |
Distance |
Medium (>1/2 mile) |
Existing Conditions |
On-road route; no defined bicycle facilities |
Proposed Improvements |
Canal Street Bikeway (rail with trail), TIP ID 1311, would be built as part of MassDOT Project ID 605146: Reconstruction of Canal Street between Washington Street/Mill Street and Loring Avenue/Jefferson Avenue. |
Potential Challenges |
Land ownership |
Potential Funding Sources and/or Partners |
MassDOT, MBTA, Salem State University, City of Salem, Town of Marblehead |
Next Steps |
Advance project in the TIP |
This bicycle network evaluation uses technical analysis, based on a diverse set of criteria, to arrive at recommendations that would create a more cohesive regional network. The study uses GIS to evaluate network gaps according to how well they would support bicycle connectivity and maximize access to the regional transportation system. This analysis can be applied as a tool for assessing additional gaps. Recommendations for addressing the 11 highest-priority gaps are included in this study.
This study is an ongoing endeavor, which should be updated periodically. The regional bike plan also should be updated to support this project and to create a comprehensive direction for bicycle planning in the region.
Note that the Inner Core Committee subregion is denser and more complex than the rest of the region’s bicycle network, and may warrant its own evaluation. The study found many gaps in this area that were not regionally significant, but are important aspects of subregional bicycle corridors, and should be addressed.
BI/bi
cc: J. Lehman and P. Sutton, MassDOT
D. Loutzenheiser, MAPC
1 Boston Region Metropolitan Planning Organization, “Regional Bicycle Plan,” prepared by the Metropolitan Area Planning Council, March 2007.
2 Boston Region Metropolitan Planning Organization, “Long-Range Transportation Plan: Paths to a Sustainable Region,” Central Transportation Planning Staff, September 2011.
3 Massachusetts Department of Transportation, Massachusetts Bicycle Transportation Plan, September 2008.
4 Massachusetts Department of Transportation, “youMove Massachusetts Phase 1 Report,” Office of Transportation Planning, February 2009.
5 Massachusetts Department of Transportation, “Healthy Transportation Policy Directive,” Policy P-13-0001, September 9, 2013.
6 Massachusetts Department of Transportation, “GreenDOT Policy Directive,” Policy P-10-002, June 2, 2010.
7 That is, on-road lanes, protected lanes, or off-road paths.
8 Points were assigned if a gap intersected a criterion rather than the number of times the gap intersected the criterion.
9 ICC=Inner Core Committee; MAGIC=Minuteman Advisory Group on Interlocal Coordination; METROWEST=MetroWest Regional Collaborative; MSPC=North Suburban Planning Council; NSTF=North Shore Task Force; SSC=South Shore Coalition; SWAP=South West Advisory Planning Committee; TRIC=Three Rivers Interlocal Council.
10 If a gap lies across the boundary of two subregions, it is counted as being in the subregion within which the majority of the gap lies.
This appendix presents an example of how the methodology was applied to evaluate the gaps, using the North Shore Task Force subregion as an example. The appendix is comprised of eight slides of maps from GIS and one slide of a scanned in image of the Excel spreadsheet used to compile the results.
Slide 1: Step 1
Slide 2: Step 2
Slide 3: Step 3
Slide 4: Step 4
Slide 5: Step 5
Slide 6: Step 6
Slide 7: Step 7
Slide 8: Step 8
Slide 9: Step 9
This appendix presents the spreadsheet used to total the number of intersections and calculate a score for each gap. It summarizes the results of each step of the methodology described in Appendix A for each of the 234 gaps.
| Bicycle Network Evaluation Results by Gap Length | |||||||||||||||
| ID | Total Score | Sub-region | Town | Does it provide access to an underserved/ Environmental Justice community | Does it provide access to employment | Does it provide access to a town center | Does it provide access to a Central Business District (CBD) | Does it provide access to a school | Does it provide access to a university or college | Does it provide access to a park or open space | Does it serve a TAZ that is forecasted to have >2200 bike/ped trips in 2035? | Does it intersect or provide an alternate route from a MassDOT Crash Cluster (2009-2011)? | Is it consistent with recommendations from previous significant plans? | Gap Length | |
| 276 | 5 | SWAP | SHERBORN | 0 | 1 | 1 | 0 | 1 | 0 | 1 | 0 | 0 | 1 | Long | |
| 271 | 10 | MAGIC | SUDBURY | 0 | 2 | 1 | 0 | 1 | 0 | 1 | 0 | 2 | 3 | Long | |
| 278 | 14 | TRIC | DEDHAM | 2 | 2 | 1 | 1 | 1 | 0 | 1 | 1 | 2 | 3 | Long | |
| 257 | 5 | SWAP | HOPKINTON | 0 | 2 | 0 | 0 | 1 | 0 | 1 | 0 | 0 | 1 | Long | |
| 275 | 6 | METROWEST | WESTON | 0 | 2 | 0 | 0 | 1 | 0 | 1 | 0 | 2 | 0 | Long | |
| 313 | 12 | CORE | LYNN | 2 | 2 | 0 | 0 | 1 | 0 | 1 | 0 | 5 | 1 | Long | |
| 267 | 10 | NSPC | LYNNFIELD | 0 | 2 | 1 | 1 | 1 | 0 | 1 | 0 | 2 | 2 | Long | |
| 261 | 10 | TRIC | NEEDHAM | 1 | 2 | 0 | 0 | 1 | 0 | 1 | 1 | 2 | 2 | Long | |
| 253 | 20 | CORE | WALTHAM | 1 | 2 | 1 | 0 | 1 | 1 | 1 | 1 | 8 | 4 | Long | |
| 235 | 9 | SWAP | BELLINGHAM | 0 | 2 | 0 | 0 | 0 | 0 | 1 | 0 | 5 | 1 | Long | |
| 277 | 9 | MAGIC | ACTON | 1 | 2 | 0 | 0 | 0 | 0 | 1 | 0 | 2 | 3 | Long | |
| 255 | 24 | CORE | SOMERVILLE | 3 | 3 | 1 | 1 | 1 | 0 | 1 | 1 | 8 | 5 | Long | |
| 259 | 5 | MAGIC | LINCOLN | 0 | 2 | 0 | 0 | 1 | 0 | 1 | 0 | 0 | 1 | Long | |
| 230 | 11 | METROWEST | ASHLAND | 1 | 2 | 0 | 0 | 1 | 0 | 1 | 0 | 5 | 1 | Long | |
| 260 | 8 | MAGIC | CONCORD | 0 | 2 | 1 | 0 | 1 | 0 | 1 | 0 | 2 | 1 | Long | |
| 229 | 9 | METROWEST | WESTON | 1 | 2 | 1 | 0 | 1 | 0 | 1 | 1 | 0 | 2 | Long | |
| 314 | 14 | CORE | CHELSEA | 3 | 2 | 0 | 0 | 1 | 0 | 1 | 1 | 5 | 1 | Long | |
| 263 | 7 | NSTF | BEVERLY | 0 | 3 | 0 | 0 | 1 | 0 | 1 | 0 | 2 | 0 | Long | |
| 274 | 6 | METROWEST | WESTON | 0 | 2 | 0 | 0 | 0 | 0 | 1 | 0 | 2 | 1 | Long | |
| 273 | 17 | METROWEST | ASHLAND | 3 | 3 | 1 | 1 | 1 | 0 | 1 | 1 | 5 | 1 | Long | |
| 228 | 5 | SSC | HINGHAM | 0 | 2 | 0 | 0 | 1 | 0 | 1 | 0 | 0 | 1 | Long | |
| 287 | 10 | CORE | BROOKLINE | 1 | 2 | 0 | 0 | 1 | 0 | 1 | 0 | 2 | 3 | Long | |
| 285 | 17 | CORE | NEWTON | 2 | 2 | 0 | 0 | 1 | 0 | 1 | 0 | 8 | 3 | Long | |
| 258 | 19 | SWAP | SHERBORN | 3 | 3 | 0 | 1 | 0 | 0 | 1 | 1 | 8 | 2 | Long | |
| 227 | 3 | SSC | MARSHFIELD | 0 | 1 | 0 | 0 | 0 | 0 | 1 | 0 | 0 | 1 | Long | |
| 272 | 10 | METROWEST | FRAMINGHAM | 1 | 2 | 0 | 0 | 1 | 1 | 1 | 0 | 2 | 2 | Long | |
| 308 | 17 | CORE | NEWTON | 1 | 2 | 1 | 0 | 1 | 0 | 1 | 0 | 8 | 3 | Long | |
| 225 | 4 | METROWEST | WAYLAND | 0 | 2 | 0 | 0 | 1 | 0 | 1 | 0 | 0 | 0 | Long | |
| 295 | 15 | TRIC | NEEDHAM | 1 | 2 | 1 | 1 | 1 | 0 | 1 | 1 | 5 | 2 | Long | |
| 224 | 17 | METROWEST | NATICK | 2 | 3 | 0 | 0 | 0 | 0 | 1 | 1 | 8 | 2 | Long | |
| 284 | 8 | NSTF | SALEM | 1 | 2 | 0 | 0 | 1 | 0 | 1 | 1 | 2 | 0 | Long | |
| 223 | 6 | SWAP | FRANKLIN | 1 | 2 | 0 | 0 | 1 | 0 | 1 | 0 | 0 | 1 | Long | |
| 222 | 16 | CORE | QUINCY | 2 | 3 | 1 | 1 | 1 | 0 | 1 | 1 | 5 | 1 | Long | |
| 220 | 13 | NSTF | PEABODY | 2 | 2 | 0 | 1 | 1 | 0 | 1 | 1 | 2 | 3 | Long | |
| 218 | 4 | SWAP | FRANKLIN | 0 | 2 | 0 | 0 | 0 | 0 | 1 | 0 | 0 | 1 | Long | |
| 217 | 3 | SSC | COHASSET | 0 | 1 | 0 | 0 | 0 | 0 | 1 | 0 | 0 | 1 | Long | |
| 251 | 7 | NSPC | STONEHAM | 0 | 2 | 1 | 1 | 1 | 0 | 1 | 0 | 0 | 1 | Long | |
| 256 | 10 | CORE | QUINCY | 1 | 2 | 0 | 1 | 1 | 0 | 1 | 1 | 2 | 1 | Long | |
| 270 | 7 | CORE | MEDFORD | 1 | 2 | 0 | 0 | 1 | 0 | 1 | 0 | 0 | 2 | Long | |
| 296 | 9 | CORE | BROOKLINE | 1 | 2 | 0 | 0 | 1 | 0 | 1 | 1 | 0 | 3 | Long | |
| 269 | 17 | MAGIC | LEXINGTON | 1 | 2 | 1 | 1 | 1 | 0 | 1 | 1 | 8 | 1 | Long | |
| 216 | 16 | CORE | LYNN | 3 | 3 | 1 | 1 | 1 | 0 | 1 | 1 | 2 | 3 | Long | |
| 214 | 2 | MAGIC | STOW | 0 | 0 | 0 | 0 | 0 | 0 | 1 | 0 | 0 | 1 | Long | |
| 213 | 8 | TRIC | NEEDHAM | 1 | 2 | 0 | 0 | 1 | 0 | 1 | 0 | 2 | 1 | Long | |
| 300 | 10 | CORE | NEWTON | 1 | 2 | 0 | 0 | 1 | 0 | 1 | 0 | 2 | 3 | Long | |
| 212 | 13 | CORE | EVERETT | 3 | 3 | 1 | 0 | 1 | 0 | 1 | 1 | 2 | 1 | Long | |
| 262 | 15 | CORE | BOSTON | 2 | 3 | 0 | 0 | 1 | 0 | 1 | 1 | 5 | 2 | Long | |
| 211 | 11 | NSTF | SWAMPSCOTT | 0 | 2 | 0 | 0 | 1 | 0 | 1 | 1 | 5 | 1 | Long | |
| 210 | 7 | NSTF | SWAMPSCOTT | 0 | 2 | 0 | 0 | 1 | 0 | 1 | 0 | 0 | 3 | Long | |
| 319 | 8 | CORE | BOSTON | 3 | 2 | 0 | 0 | 1 | 0 | 1 | 1 | 0 | 0 | Long | |
| 209 | 7 | NSPC | WOBURN | 1 | 2 | 0 | 1 | 1 | 0 | 1 | 0 | 0 | 1 | Long | |
| 254 | 12 | CORE | MEDFORD | 2 | 2 | 1 | 0 | 1 | 0 | 1 | 0 | 2 | 3 | Long | |
| 208 | 2 | METROWEST | SOUTHBOROUGH | 0 | 1 | 0 | 0 | 0 | 0 | 1 | 0 | 0 | 0 | Long | |
| 207 | 6 | NSPC | WOBURN | 1 | 2 | 0 | 0 | 0 | 0 | 1 | 0 | 0 | 2 | Long | |
| 206 | 5 | METROWEST | SOUTHBOROUGH | 0 | 2 | 1 | 0 | 1 | 0 | 1 | 0 | 0 | 0 | Long | |
| 203 | 5 | SSC | HINGHAM | 0 | 0 | 0 | 0 | 1 | 0 | 1 | 0 | 2 | 1 | Long | |
| 202 | 8 | CORE | NEWTON | 1 | 2 | 0 | 0 | 1 | 0 | 1 | 1 | 0 | 2 | Long | |
| 201 | 11 | CORE | NEWTON | 0 | 2 | 1 | 0 | 1 | 0 | 1 | 0 | 5 | 1 | Long | |
| 318 | 14 | CORE | BOSTON | 3 | 3 | 0 | 0 | 1 | 0 | 1 | 1 | 2 | 3 | Long | |
| 265 | 4 | MAGIC | LEXINGTON | 1 | 2 | 0 | 0 | 0 | 0 | 1 | 0 | 0 | 0 | Long | |
| 286 | 13 | CORE | SOMERVILLE | 2 | 2 | 0 | 0 | 1 | 0 | 1 | 1 | 5 | 1 | Long | |
| 250 | 16 | CORE | QUINCY | 1 | 3 | 1 | 1 | 1 | 0 | 1 | 1 | 5 | 2 | Long | |
| 196 | 8 | CORE | BOSTON | 2 | 2 | 0 | 0 | 1 | 0 | 1 | 0 | 0 | 2 | Long | |
| 194 | 10 | CORE | SAUGUS/LYNN | 2 | 3 | 0 | 0 | 0 | 0 | 1 | 1 | 2 | 1 | Long | |
| 193 | 6 | NSTF | WENHAM | 0 | 2 | 1 | 0 | 1 | 0 | 1 | 0 | 0 | 1 | Long | |
| 192 | 14 | CORE | BOSTON | 3 | 2 | 0 | 0 | 0 | 0 | 1 | 1 | 5 | 2 | Long | |
| 191 | 20 | NSTF | SALEM | 3 | 3 | 1 | 0 | 1 | 0 | 1 | 1 | 8 | 2 | Medium | |
| 190 | 6 | CORE | WATERTOWN | 1 | 2 | 0 | 0 | 1 | 0 | 1 | 0 | 0 | 1 | Medium | |
| 189 | 8 | CORE/TRIC | MILTON | 2 | 2 | 0 | 0 | 0 | 0 | 1 | 0 | 2 | 1 | Medium | |
| 188 | 5 | METROWEST | WELLESLEY | 1 | 2 | 0 | 0 | 0 | 0 | 1 | 0 | 0 | 1 | Medium | |
| 186 | 7 | METROWEST | FRAMINGHAM | 1 | 3 | 0 | 0 | 1 | 0 | 1 | 0 | 0 | 1 | Medium | |
| 185 | 3 | MAGIC | CONCORD | 0 | 2 | 0 | 0 | 0 | 0 | 1 | 0 | 0 | 0 | Medium | |
| 309 | 5 | CORE/TRIC | MILTON | 1 | 2 | 0 | 0 | 0 | 0 | 1 | 0 | 0 | 1 | Medium | |
| 289 | 16 | CORE | BOSTON | 3 | 2 | 0 | 0 | 1 | 0 | 1 | 1 | 5 | 3 | Medium | |
| 266 | 17 | CORE | ARLINGTON | 2 | 2 | 1 | 1 | 1 | 0 | 1 | 1 | 5 | 3 | Medium | |
| 249 | 9 | CORE | BOSTON | 3 | 2 | 0 | 0 | 1 | 0 | 1 | 1 | 0 | 1 | Medium | |
| 183 | 10 | CORE | WALTHAM | 2 | 2 | 0 | 0 | 0 | 0 | 1 | 1 | 2 | 2 | Medium | |
| 248 | 11 | CORE | BELMONT | 1 | 2 | 1 | 0 | 1 | 0 | 1 | 0 | 0 | 5 | Medium | |
| 182 | 12 | METROWEST | WELLESLEY | 1 | 2 | 0 | 0 | 1 | 0 | 1 | 0 | 5 | 2 | Medium | |
| 181 | 6 | MAGIC | LINCOLN | 1 | 2 | 0 | 0 | 0 | 0 | 1 | 1 | 0 | 1 | Medium | |
| 292 | 6 | CORE/TRIC | MILTON | 1 | 2 | 0 | 0 | 0 | 0 | 1 | 0 | 0 | 2 | Medium | |
| 179 | 17 | CORE | CHELSEA | 3 | 3 | 1 | 0 | 1 | 0 | 1 | 1 | 5 | 2 | Medium | |
| 311 | 8 | CORE/TRIC | MILTON | 1 | 2 | 0 | 0 | 1 | 0 | 1 | 0 | 0 | 3 | Medium | |
| 177 | 12 | CORE | CAMBRIDGE | 1 | 2 | 0 | 0 | 1 | 0 | 1 | 1 | 5 | 1 | Medium | |
| 176 | 6 | CORE/TRIC | MILTON | 1 | 2 | 0 | 0 | 1 | 0 | 1 | 0 | 0 | 1 | Medium | |
| 175 | 7 | CORE | BOSTON | 2 | 2 | 0 | 0 | 0 | 0 | 1 | 1 | 0 | 1 | Medium | |
| 173 | 14 | SWAP | MILFORD | 2 | 2 | 1 | 0 | 1 | 0 | 1 | 1 | 5 | 1 | Medium | |
| 172 | 7 | CORE | BOSTON | 2 | 2 | 0 | 0 | 0 | 0 | 1 | 0 | 0 | 2 | Medium | |
| 170 | 9 | CORE | BOSTON | 2 | 2 | 0 | 0 | 1 | 0 | 1 | 0 | 2 | 1 | Medium | |
| 169 | 8 | CORE | BOSTON | 3 | 2 | 0 | 0 | 0 | 0 | 1 | 1 | 0 | 1 | Medium | |
| 310 | 10 | CORE | QUINCY | 1 | 2 | 0 | 0 | 0 | 0 | 1 | 1 | 2 | 3 | Medium | |
| 168 | 15 | CORE | CAMBRIDGE | 1 | 2 | 0 | 0 | 0 | 0 | 1 | 1 | 8 | 2 | Medium | |
| 320 | 10 | CORE | BOSTON | 3 | 2 | 0 | 0 | 0 | 0 | 1 | 1 | 0 | 3 | Medium | |
| 290 | 15 | CORE | BOSTON | 2 | 3 | 0 | 0 | 0 | 0 | 1 | 1 | 5 | 3 | Medium | |
| 245 | 13 | CORE | BOSTON | 2 | 3 | 0 | 0 | 0 | 0 | 0 | 1 | 5 | 2 | Medium | |
| 167 | 10 | CORE | BOSTON | 3 | 2 | 0 | 0 | 1 | 0 | 1 | 0 | 0 | 3 | Medium | |
| 165 | 10 | CORE | BOSTON | 3 | 2 | 0 | 0 | 1 | 0 | 1 | 1 | 0 | 2 | Medium | |
| 164 | 12 | CORE | BELMONT | 1 | 2 | 1 | 0 | 1 | 0 | 1 | 1 | 0 | 5 | Medium | |
| 163 | 14 | CORE | LYNN | 3 | 3 | 0 | 1 | 0 | 0 | 1 | 1 | 2 | 3 | Medium | |
| 162 | 5 | METROWEST | WELLESLEY | 1 | 2 | 0 | 0 | 0 | 0 | 1 | 0 | 0 | 1 | Medium | |
| 161 | 8 | CORE | NEWTON | 1 | 2 | 0 | 0 | 0 | 0 | 1 | 0 | 2 | 2 | Medium | |
| 160 | 6 | NSTF | PEABODY | 1 | 2 | 0 | 0 | 0 | 0 | 1 | 0 | 0 | 2 | Medium | |
| 159 | 2 | METROWEST | FRAMINGHAM | 0 | 0 | 0 | 0 | 0 | 0 | 1 | 0 | 0 | 1 | Medium | |
| 158 | 10 | CORE | NEWTON | 0 | 2 | 0 | 0 | 1 | 0 | 1 | 0 | 5 | 1 | Medium | |
| 157 | 12 | CORE | BROOKLINE | 2 | 3 | 0 | 0 | 1 | 0 | 1 | 1 | 3 | 1 | Medium | |
| 156 | 10 | METROWEST | WELLESLEY | 0 | 2 | 1 | 0 | 1 | 0 | 1 | 1 | 2 | 2 | Medium | |
| 279 | 10 | CORE | BOSTON | 3 | 2 | 0 | 0 | 0 | 0 | 1 | 1 | 2 | 1 | Medium | |
| 280 | 12 | CORE | BOSTON | 1 | 2 | 0 | 0 | 0 | 0 | 1 | 1 | 2 | 5 | Medium | |
| 268 | 4 | MAGIC | LEXINGTON | 1 | 2 | 0 | 0 | 0 | 0 | 1 | 0 | 0 | 0 | Medium | |
| 155 | 9 | CORE | SOMERVILLE | 1 | 3 | 0 | 0 | 0 | 0 | 0 | 1 | 2 | 2 | Medium | |
| 154 | 7 | CORE | BOSTON | 3 | 2 | 0 | 0 | 0 | 0 | 1 | 0 | 0 | 1 | Medium | |
| 283 | 10 | CORE | EVERETT | 1 | 2 | 0 | 0 | 0 | 0 | 1 | 1 | 2 | 3 | Medium | |
| 153 | 12 | CORE | BOSTON | 2 | 3 | 0 | 0 | 1 | 0 | 1 | 1 | 3 | 1 | Medium | |
| 264 | 4 | NSTF | SALEM | 0 | 1 | 0 | 0 | 1 | 0 | 1 | 1 | 0 | 0 | Medium | |
| 317 | 17 | CORE | BOSTON | 2 | 3 | 0 | 0 | 1 | 0 | 1 | 1 | 5 | 4 | Medium | |
| 150 | 12 | CORE | MALDEN | 3 | 2 | 0 | 1 | 0 | 0 | 1 | 1 | 2 | 2 | Medium | |
| 149 | 7 | CORE | CAMBRIDGE | 1 | 2 | 0 | 0 | 0 | 0 | 1 | 0 | 2 | 1 | Medium | |
| 148 | 11 | CORE | BOSTON | 1 | 3 | 1 | 0 | 0 | 0 | 1 | 1 | 2 | 2 | Medium | |
| 145 | 10 | NSTF | SWAMPSCOTT | 2 | 2 | 1 | 0 | 1 | 0 | 1 | 0 | 2 | 1 | Medium | |
| 144 | 18 | METROWEST | FRAMINGHAM | 3 | 2 | 0 | 1 | 0 | 0 | 1 | 1 | 8 | 2 | Medium | |
| 143 | 14 | CORE | CAMBRIDGE | 1 | 3 | 1 | 0 | 1 | 0 | 1 | 1 | 5 | 1 | Medium | |
| 142 | 2 | METROWEST | WELLESLEY | 0 | 0 | 0 | 0 | 0 | 0 | 1 | 0 | 0 | 1 | Medium | |
| 294 | 10 | CORE | BOSTON | 3 | 2 | 0 | 0 | 0 | 0 | 1 | 1 | 0 | 3 | Medium | |
| 140 | 8 | CORE | BOSTON | 1 | 2 | 0 | 0 | 1 | 0 | 1 | 0 | 0 | 3 | Medium | |
| 139 | 10 | CORE | CAMBRIDGE | 1 | 3 | 0 | 0 | 1 | 0 | 1 | 1 | 3 | 0 | Medium | |
| 138 | 3 | SSC | MARSHFIELD | 0 | 2 | 0 | 0 | 0 | 0 | 1 | 0 | 0 | 0 | Medium | |
| 137 | 10 | METROWEST | MARLBOROUGH | 2 | 2 | 1 | 0 | 1 | 0 | 1 | 1 | 2 | 0 | Medium | |
| 136 | 8 | CORE | BOSTON | 2 | 2 | 0 | 0 | 0 | 0 | 1 | 0 | 0 | 3 | Medium | |
| 133 | 11 | CORE | BOSTON | 3 | 2 | 0 | 0 | 1 | 0 | 1 | 1 | 0 | 3 | Medium | |
| 312 | 11 | CORE | BOSTON | 2 | 2 | 0 | 0 | 0 | 0 | 1 | 1 | 0 | 5 | Medium | |
| 131 | 10 | CORE | BOSTON | 2 | 2 | 0 | 0 | 1 | 0 | 1 | 0 | 2 | 2 | Medium | |
| 130 | 8 | CORE | BOSTON | 3 | 2 | 0 | 0 | 0 | 0 | 1 | 1 | 0 | 1 | Medium | |
| 129 | 4 | CORE | NEWTON | 0 | 2 | 0 | 0 | 0 | 0 | 1 | 0 | 0 | 1 | Medium | |
| 128 | 13 | CORE | MALDEN | 3 | 2 | 1 | 1 | 1 | 0 | 1 | 1 | 2 | 1 | Medium | |
| 127 | 11 | CORE | BOSTON | 2 | 3 | 0 | 0 | 1 | 0 | 1 | 1 | 2 | 1 | Medium | |
| 125 | 9 | CORE | BOSTON | 3 | 2 | 0 | 0 | 1 | 0 | 1 | 1 | 0 | 1 | Medium | |
| 124 | 11 | CORE | BOSTON | 2 | 2 | 0 | 0 | 0 | 0 | 1 | 0 | 2 | 4 | Medium | |
| 303 | 5 | CORE | WATERTOWN | 1 | 2 | 0 | 0 | 0 | 0 | 0 | 0 | 0 | 2 | Medium | |
| 321 | 7 | CORE | BOSTON | 1 | 2 | 0 | 0 | 1 | 0 | 1 | 0 | 2 | 0 | Medium | |
| 123 | 12 | CORE | SOMERVILLE | 2 | 2 | 0 | 0 | 1 | 1 | 1 | 1 | 3 | 1 | Medium | |
| 315 | 6 | CORE | CAMBRIDGE | 1 | 2 | 0 | 0 | 0 | 0 | 1 | 1 | 0 | 1 | Medium | |
| 302 | 14 | CORE | CAMBRIDGE | 2 | 3 | 0 | 0 | 0 | 0 | 1 | 1 | 5 | 2 | Medium | |
| 120 | 8 | CORE | BOSTON | 1 | 2 | 0 | 0 | 0 | 0 | 1 | 0 | 2 | 2 | Medium | |
| 119 | 6 | CORE | NEWTON | 0 | 2 | 0 | 0 | 1 | 0 | 1 | 0 | 2 | 0 | Medium | |
| 118 | 6 | CORE | BOSTON | 1 | 2 | 0 | 0 | 0 | 0 | 1 | 1 | 0 | 1 | Medium | |
| 117 | 7 | CORE | BOSTON | 2 | 2 | 0 | 0 | 1 | 0 | 1 | 0 | 0 | 1 | Medium | |
| 297 | 7 | CORE | BOSTON | 1 | 1 | 0 | 0 | 0 | 0 | 1 | 1 | 0 | 3 | Medium | |
| 306 | 6 | CORE | CAMBRIDGE | 1 | 2 | 0 | 0 | 0 | 0 | 1 | 1 | 0 | 1 | Medium | |
| 305 | 10 | CORE | CAMBRIDGE | 1 | 3 | 0 | 0 | 0 | 0 | 1 | 1 | 3 | 1 | Medium | |
| 114 | 6 | CORE | BOSTON | 0 | 2 | 0 | 0 | 0 | 0 | 1 | 0 | 0 | 3 | Medium | |
| 113 | 6 | CORE | BOSTON | 1 | 2 | 0 | 0 | 0 | 0 | 1 | 0 | 0 | 2 | Medium | |
| 244 | 10 | CORE | CAMBRIDGE | 1 | 3 | 0 | 0 | 0 | 1 | 1 | 1 | 3 | 0 | Medium | |
| 110 | 11 | CORE | BOSTON | 3 | 3 | 0 | 0 | 1 | 0 | 1 | 1 | 0 | 2 | Medium | |
| 108 | 14 | CORE | BOSTON | 3 | 3 | 0 | 0 | 1 | 1 | 1 | 1 | 2 | 2 | Medium | |
| 107 | 7 | CORE | BOSTON | 2 | 2 | 0 | 0 | 0 | 0 | 1 | 1 | 0 | 1 | Medium | |
| 301 | 7 | CORE | NEWTON | 1 | 2 | 0 | 0 | 0 | 0 | 1 | 0 | 2 | 1 | Medium | |
| 106 | 5 | CORE | NEWTON | 0 | 2 | 0 | 0 | 1 | 0 | 1 | 0 | 0 | 1 | Medium | |
| 105 | 14 | CORE | CAMBRIDGE | 2 | 3 | 0 | 0 | 0 | 0 | 1 | 1 | 5 | 2 | Medium | |
| 104 | 4 | METROWEST | NATICK | 0 | 2 | 0 | 0 | 1 | 0 | 0 | 0 | 0 | 1 | Medium | |
| 103 | 10 | CORE | BOSTON | 2 | 2 | 0 | 0 | 0 | 0 | 1 | 0 | 2 | 3 | Medium | |
| 102 | 6 | CORE | EVERETT | 1 | 2 | 0 | 0 | 0 | 0 | 1 | 0 | 0 | 2 | Medium | |
| 293 | 8 | CORE | BOSTON | 1 | 2 | 0 | 0 | 1 | 0 | 1 | 1 | 0 | 2 | Medium | |
| 246 | 13 | CORE | BOSTON | 3 | 2 | 0 | 0 | 0 | 0 | 1 | 1 | 2 | 4 | Short | |
| 100 | 8 | CORE | BOSTON | 3 | 2 | 0 | 0 | 0 | 0 | 1 | 1 | 0 | 1 | Short | |
| 99 | 11 | CORE | CAMBRIDGE | 1 | 3 | 0 | 0 | 0 | 0 | 1 | 1 | 3 | 2 | Short | |
| 98 | 6 | METROWEST | WELLESLEY | 1 | 2 | 0 | 0 | 0 | 0 | 1 | 0 | 0 | 2 | Short | |
| 97 | 7 | CORE | BOSTON | 3 | 2 | 0 | 0 | 0 | 0 | 0 | 1 | 0 | 1 | Short | |
| 95 | 3 | METROWEST | FRAMINGHAM | 0 | 1 | 0 | 0 | 0 | 0 | 1 | 0 | 0 | 1 | Short | |
| 93 | 3 | SSC | WEYMOUTH | 0 | 1 | 0 | 0 | 0 | 0 | 1 | 0 | 0 | 1 | Short | |
| 92 | 5 | CORE | BELMONT | 1 | 2 | 0 | 0 | 0 | 0 | 1 | 1 | 0 | 0 | Short | |
| 91 | 3 | SSC | HINGHAM | 0 | 1 | 0 | 0 | 0 | 0 | 1 | 0 | 0 | 1 | Short | |
| 90 | 8 | CORE | BOSTON | 3 | 2 | 0 | 0 | 0 | 0 | 1 | 1 | 0 | 1 | Short | |
| 87 | 9 | CORE | BOSTON | 2 | 3 | 0 | 0 | 0 | 0 | 1 | 1 | 0 | 2 | Short | |
| 86 | 12 | CORE | CAMBRIDGE | 2 | 3 | 0 | 0 | 0 | 0 | 1 | 1 | 5 | 0 | Short | |
| 84 | 7 | CORE | BOSTON | 2 | 2 | 0 | 0 | 0 | 0 | 1 | 1 | 0 | 1 | Short | |
| 316 | 17 | CORE | BOSTON | 3 | 3 | 0 | 0 | 0 | 0 | 1 | 1 | 5 | 4 | Short | |
| 80 | 7 | CORE | MEDFORD | 1 | 2 | 0 | 0 | 0 | 0 | 1 | 0 | 0 | 3 | Short | |
| 79 | 7 | CORE | BOSTON | 1 | 2 | 0 | 0 | 1 | 0 | 1 | 0 | 0 | 2 | Short | |
| 78 | 8 | CORE | BOSTON | 1 | 2 | 0 | 0 | 1 | 0 | 1 | 0 | 0 | 3 | Short | |
| 77 | 2 | METROWEST | WELLESLEY | 0 | 1 | 0 | 0 | 0 | 0 | 1 | 0 | 0 | 0 | Short | |
| 76 | 5 | METROWEST | WELLESLEY | 0 | 2 | 0 | 0 | 0 | 0 | 0 | 1 | 0 | 2 | Short | |
| 73 | 14 | CORE | CAMBRIDGE | 2 | 3 | 1 | 0 | 1 | 0 | 1 | 1 | 5 | 0 | Short | |
| 72 | 7 | CORE | SOMERVILLE/MEDFORD | 1 | 2 | 0 | 0 | 0 | 0 | 1 | 1 | 0 | 2 | Short | |
| 71 | 8 | CORE | BOSTON | 1 | 3 | 0 | 0 | 0 | 0 | 1 | 1 | 2 | 0 | Short | |
| 243 | 7 | CORE | BOSTON | 2 | 3 | 0 | 0 | 0 | 0 | 1 | 1 | 0 | 0 | Short | |
| 69 | 6 | CORE | BOSTON | 1 | 2 | 0 | 0 | 0 | 0 | 1 | 1 | 0 | 1 | Short | |
| 68 | 5 | NSPC | WOBURN | 0 | 2 | 0 | 0 | 1 | 0 | 1 | 0 | 0 | 1 | Short | |
| 67 | 10 | CORE | CAMBRIDGE | 1 | 3 | 0 | 0 | 0 | 0 | 1 | 0 | 3 | 2 | Short | |
| 66 | 9 | NSTF | SALEM | 0 | 2 | 0 | 0 | 0 | 0 | 1 | 1 | 2 | 3 | Short | |
| 322 | 6 | CORE | BOSTON | 0 | 2 | 0 | 0 | 0 | 0 | 1 | 0 | 0 | 3 | Short | |
| 64 | 4 | CORE | BOSTON | 1 | 2 | 0 | 0 | 1 | 0 | 0 | 0 | 0 | 0 | Short | |
| 323 | 10 | CORE | BOSTON | 3 | 3 | 0 | 0 | 0 | 0 | 1 | 1 | 0 | 2 | Short | |
| 62 | 7 | CORE | BOSTON | 2 | 2 | 0 | 0 | 0 | 0 | 0 | 1 | 0 | 2 | Short | |
| 60 | 12 | CORE | BOSTON | 3 | 3 | 0 | 0 | 0 | 0 | 1 | 1 | 2 | 2 | Short | |
| 59 | 7 | CORE | BOSTON | 0 | 3 | 0 | 0 | 0 | 0 | 1 | 1 | 0 | 2 | Short | |
| 57 | 6 | METROWEST | WELLESLEY | 0 | 2 | 0 | 0 | 0 | 0 | 1 | 0 | 2 | 1 | Short | |
| 56 | 9 | CORE | BROOKLINE | 1 | 3 | 0 | 0 | 0 | 0 | 1 | 1 | 3 | 0 | Short | |
| 55 | 4 | CORE | ARLINGTON | 1 | 2 | 0 | 0 | 0 | 0 | 1 | 0 | 0 | 0 | Short | |
| 54 | 5 | CORE | NEWTON | 1 | 2 | 0 | 0 | 0 | 0 | 1 | 0 | 0 | 1 | Short | |
| 52 | 12 | CORE | CAMBRIDGE | 1 | 3 | 0 | 0 | 0 | 0 | 0 | 1 | 5 | 2 | Short | |
| 49 | 10 | CORE | EVERETT | 1 | 2 | 0 | 0 | 0 | 0 | 1 | 0 | 2 | 4 | Short | |
| 282 | 5 | CORE | MEDFORD | 1 | 2 | 0 | 0 | 0 | 0 | 0 | 0 | 0 | 2 | Short | |
| 48 | 11 | CORE | BOSTON | 3 | 3 | 0 | 0 | 0 | 0 | 0 | 1 | 2 | 2 | Short | |
| 46 | 4 | CORE | WATERTOWN | 1 | 2 | 0 | 0 | 0 | 0 | 1 | 0 | 0 | 0 | Short | |
| 45 | 5 | CORE | BOSTON | 1 | 1 | 0 | 0 | 0 | 0 | 1 | 0 | 0 | 2 | Short | |
| 247 | 11 | CORE | BROOKLINE | 3 | 3 | 0 | 0 | 1 | 0 | 1 | 1 | 0 | 2 | Short | |
| 43 | 6 | CORE | CAMBRIDGE | 1 | 2 | 0 | 0 | 0 | 0 | 1 | 0 | 2 | 0 | Short | |
| 42 | 6 | CORE | NEWTON | 1 | 2 | 0 | 0 | 0 | 0 | 1 | 0 | 0 | 2 | Short | |
| 41 | 6 | CORE | BOSTON | 1 | 3 | 0 | 0 | 1 | 0 | 1 | 0 | 0 | 0 | Short | |
| 241 | 5 | CORE | BROOKLINE | 1 | 2 | 0 | 0 | 0 | 0 | 1 | 1 | 0 | 0 | Short | |
| 40 | 8 | CORE | WALTHAM | 2 | 2 | 0 | 0 | 0 | 0 | 1 | 1 | 0 | 2 | Short | |
| 39 | 7 | CORE | ARLINGTON | 1 | 2 | 0 | 0 | 0 | 0 | 1 | 1 | 0 | 2 | Short | |
| 38 | 9 | CORE | CAMBRIDGE | 1 | 3 | 0 | 0 | 0 | 0 | 0 | 1 | 3 | 1 | Short | |
| 37 | 8 | CORE | BOSTON | 2 | 3 | 0 | 0 | 0 | 0 | 1 | 1 | 0 | 1 | Short | |
| 36 | 8 | CORE | BOSTON | 0 | 3 | 0 | 0 | 0 | 0 | 0 | 1 | 2 | 2 | Short | |
| 34 | 2 | NSPC | WOBURN | 0 | 0 | 0 | 0 | 0 | 0 | 1 | 0 | 0 | 1 | Short | |
| 304 | 7 | CORE | WATERTOWN | 1 | 2 | 0 | 0 | 0 | 0 | 1 | 0 | 0 | 3 | Short | |
| 33 | 6 | CORE | BOSTON | 1 | 2 | 0 | 0 | 1 | 0 | 1 | 1 | 0 | 0 | Short | |
| 252 | 4 | CORE | BOSTON | 0 | 2 | 0 | 0 | 0 | 0 | 1 | 1 | 0 | 0 | Short | |
| 32 | 4 | NSTF | SALEM | 0 | 1 | 0 | 0 | 0 | 0 | 1 | 1 | 0 | 1 | Short | |
| 30 | 9 | CORE | BOSTON | 3 | 2 | 0 | 0 | 1 | 0 | 1 | 1 | 0 | 1 | Short | |
| 28 | 4 | CORE | NEWTON | 0 | 2 | 0 | 0 | 0 | 0 | 0 | 0 | 0 | 2 | Short | |
| 240 | 4 | MAGIC | BEDFORD | 0 | 2 | 0 | 0 | 0 | 0 | 1 | 0 | 0 | 1 | Short | |
| 25 | 7 | CORE | BOSTON | 0 | 3 | 0 | 0 | 0 | 0 | 0 | 1 | 0 | 3 | Short | |
| 24 | 9 | CORE | BOSTON | 1 | 3 | 0 | 0 | 0 | 0 | 1 | 1 | 2 | 1 | Short | |
| 23 | 9 | CORE | WALTHAM | 2 | 2 | 0 | 0 | 0 | 0 | 1 | 1 | 0 | 3 | Short | |
| 22 | 5 | CORE | BOSTON | 1 | 2 | 0 | 0 | 0 | 0 | 1 | 0 | 0 | 1 | Short | |
| 21 | 3 | CORE | NEWTON | 0 | 1 | 0 | 0 | 0 | 0 | 0 | 1 | 0 | 1 | Short | |
| 20 | 3 | CORE | BOSTON | 0 | 1 | 0 | 0 | 0 | 0 | 1 | 0 | 0 | 1 | Short | |
| 18 | 9 | CORE | BOSTON | 0 | 3 | 0 | 0 | 0 | 0 | 1 | 1 | 2 | 2 | Short | |
| 15 | 6 | CORE | BOSTON | 2 | 3 | 0 | 0 | 0 | 0 | 0 | 1 | 0 | 0 | Short | |
| 12 | 6 | CORE | CAMBRIDGE | 1 | 3 | 0 | 0 | 0 | 0 | 0 | 1 | 0 | 1 | Short | |
| 11 | 7 | CORE | BOSTON | 1 | 3 | 0 | 0 | 0 | 0 | 0 | 1 | 0 | 2 | Short | |
| 281 | 6 | CORE | SOMERVILLE | 1 | 2 | 0 | 0 | 0 | 0 | 1 | 1 | 0 | 1 | Short | |