TRANSPORTATION IMPROVEMENT PROGRAM
AND AIR QUALITY CONFORMITY DETERMINATION:
FEDERAL FISCAL YEARS
2019–23
Boston Region Metropolitan Planning Organization Staff
Directed by the Boston Region Metropolitan Planning Organization, which is composed of the following:
MassDOT Office of Transportation Planning |
City of Newton (At-Large City) |
Massachusetts Bay Transportation Authority |
City of Somerville (Inner Core Committee) |
Massachusetts Bay Transportation Authority Advisory Board |
City of Woburn (North Suburban Planning Council) |
MassDOT Highway Division |
Town of Arlington (At-Large Town) |
Massachusetts Port Authority |
Town of Bedford (Minuteman Advisory Group on Interlocal Coordination) |
Metropolitan Area Planning Council |
Town of Braintree (South Shore Coalition) |
Regional Transportation Advisory Council |
Town of Lexington (At-Large Town) |
City of Boston |
Town of Medway (South West Advisory Planning Committee) |
City of Beverly (North Shore Task Force) |
Town of Norwood (Three Rivers Interlocal Council) |
City of Everett (At-Large City) |
Federal Highway Administration (nonvoting) |
City of Framingham (MetroWest Regional Collaborative) |
Federal Transit Administration (nonvoting) |
The Boston Region MPO complies with Title VI of the Civil Rights Act of 1964, the Americans with Disabilities Act (ADA) and other federal and state nondiscrimination statutes and regulations in all programs and activities. The MPO does not discriminate based on race, color, national origin (including limited English proficiency), religion, creed, gender, ancestry, ethnicity, disability, age, sex, sexual orientation, gender identity or expression, veteran’s status (including Vietnam-era veterans), or background. Any person who believes herself/himself or any specific class of persons to have been subjected to discrimination prohibited by Title VI, ADA, or another nondiscrimination statute or regulation may, herself/himself or via a representative, file a written complaint with the MPO. Complaints filed under federal law (based on race, color, national origin [including limited English proficiency], sex, age, or disability) must be filed no later than 180 calendar days after the date the person believes the discrimination occurred. Complaints filed under Massachusetts General Law (based on race, color, religious creed, national origin, sex, sexual orientation, disability, or ancestry) or Governor's Executive Order 526, Section 4 (based on race, color, age, gender, ethnicity, sexual orientation, gender identity or expression, religion, creed, ancestry, national origin, disability, veteran's status [including Vietnam-era veterans], or background) must be filed no later than 300 calendar days after the date the person believes the discrimination occurred. A complaint form and additional information may be obtained at www.bostonmpo.org or by contacting the MPO staff at 857.702.3700 (voice), 617.570.9193 (TTY), 617.570.9192 (fax), or eharvey@ctps.org.
To request additional copies of this document or to request it in an accessible format, please contact MPO staff using the methods described below. It is also possible to download the document by visiting www.bostonmpo.org.
Mail Boston Region MPO
Certification Activities Group
10 Park Plaza, Suite 2150
Boston, MA 02116-3968
Telephone: 857.702.3700
TTY: 617.973.7089
Fax: 617.570.9192
Email: publicinfo@ctps.org
This document was funded in part through grants from the Federal Highway Administration and Federal Transit Administration of the U.S. Department of Transportation. Its contents do not necessarily reflect the official views or policy of the USDOT.
EXECUTIVE SUMMARY ES-1
CHAPTER ONE – THE 3C PROCESS 1-1
CHAPTER TWO – THE TIP PROCESS 2-1
CHAPTER THREE – HIGHWAY AND TRANSIT PROGRAMMING 3-1
Project Tables FFYs 2019 – 23 3-3
CHAPTER FOUR – TIP PERFORMORNACE MONITORING 4-1
CHAPTER FIVE – DETERMINATION OF AIR QUALITY CONFORMITY 5-1
APPENDICES
A Universe of Unprogrammed Projects A-1
B Greenhouse Gas Monitoring and Evaluation B-1
C Public Outreach and Comments C-1
D Glossary of Acronyms D-1
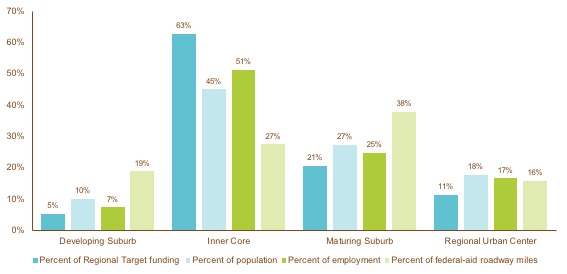
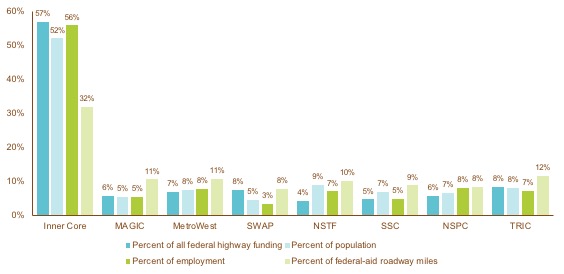
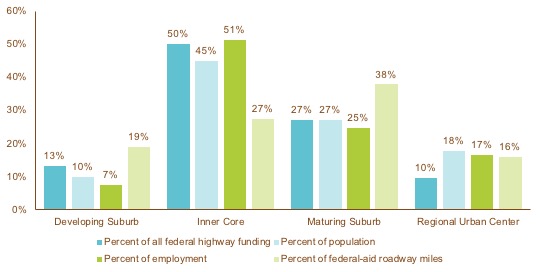
E Geographic Distribution of TIP Funding E-1
Executive Summary
Federal Fiscal Years 2019–23 Transportation Improvement Program
The Boston Region Metropolitan Planning Organization’s (MPO) five-year transportation capital investment plan, the Transportation Improvement Program (TIP), is the near-term investment program for the region’s transportation system. Guided by the Boston Region MPO’s vision, goals, and objectives, the TIP prioritizes investments that preserve the current transportation system in a state of good repair, provide safe transportation for all modes, enhance livability, and improve mobility throughout the region. These investments fund major highway reconstruction, arterial roadway and intersection improvements, maintenance and expansion of the public transit system, bicycle path construction, and improvements for pedestrians.
The Boston Region MPO is guided by a 22-member board with representatives of state agencies, regional organizations, and municipalities; its jurisdiction extends roughly from Boston north to Ipswich, south to Marshfield, and west to municipalities along Interstate 495. Each year, the MPO conducts a process to decide how to spend federal transportation funds for capital projects. The Central Transportation Planning Staff (CTPS), which is the staff to the MPO, manages the TIP-development process.
MPO staff coordinates the evaluation of project requests, proposes programming of current and new projects based on anticipated funding levels, supports the MPO in developing a draft TIP document, and facilitates a public review of the draft before the MPO endorses the final document.
The federal fiscal years (FFYs) 2019–23 TIP consists of transportation investments programmed in the Highway Program and Transit Program with funding sources from the Federal Highway Administration (FHWA) and the Federal Transit Administration (FTA), respectively.
These investments reflect the MPO’s goal of targeting a majority of transportation resources toward preserving and modernizing the existing roadway and transit systems and maintaining them in a state of good repair. This TIP also devotes a portion of funding for expanding the rapid transit system and new shared-use paths.
In addition, a number of the infrastructure investments in this TIP address needs identified in the MPO’s Long-Range Transportation Plan (LRTP), Charting Progress to 2040; or they implement recommendations from past studies and reports that were funded through the MPO’s Unified Planning Work Program (UPWP) (www.bostonmpo.org/upwp).
The TIP also supports the three strategic priorities of the Massachusetts Department of Transportation (MassDOT):
The complete TIP program is available in Chapter 3 of this document and online at www.ctps.org/tip. The TIP tables provide details of how funding is allocated to each programmed project and capital investment program. These tables are organized by federal fiscal year, and are grouped according to the transit program and the highway program.
The Transit Program of the TIP provides funding for projects and programs that address the capital needs prioritized by the three transit authorities in the region: the Massachusetts Bay Transportation Authority (MBTA), the Cape Ann Transportation Authority (CATA), and the MetroWest Regional Transit Authority (MWRTA). The Transit Program is predominantly dedicated to achieving and maintaining a state of good repair for all assets throughout the transit system. The FFYs 2019–23 TIP includes $3.2 billion in transit investments that will support state of good repair, modernize transit systems, and increase access to transit. The Green Line Extension project is a major project programmed in this TIP that will expand transit service.
The Highway Program of the TIP funds the priority transportation projects advanced by MassDOT and the cities and towns within the MPO region. The program is devoted primarily to preserving and modernizing the existing roadway network by resurfacing highways, replacing bridges, and reconstructing arterial roadways.
In Massachusetts, Federal-Aid Highway Program funding is apportioned by MassDOT, which allocates funding to Grant Anticipation Notes (GANs) payments, various statewide programs, and Regional Targets for the state’s MPOs. In the FFYs 2019–23 TIP, roadway, bridge, and bicycle and pedestrian programs account for $1.4 billion in funding to the Boston region. The Regional Target funding provided to the MPOs may be programmed for projects at the discretion of each MPO, whereas MassDOT has discretion to propose its recommended projects for statewide programs, such as those related to bridge repairs and interstate highway maintenance.
During FFYs 2019–23, the Boston Region MPO plans to fund 38 projects and programs with its Regional Target funding:
Figure ES-1 shows how the Regional Target funding for FFYs 2019–23 is distributed across the MPO’s investment programs. As the chart shows, the Boston Region MPO’s Regional Target Program is devoted primarily to modernizing and expanding the transportation network through Major Infrastructure and Complete Streets investments.
FIGURE ES-1
FFYs 2019-23 TIP Regional Target Funding
by Investment Program
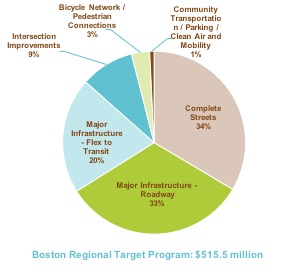
Data Source: Boston Region MPO.
These investments will be implemented in 37 cities and towns throughout the MPO region, ranging from high-density, built-out inner core communities to developing suburbs. Figure ES-2 identifies the type of communities—as defined by the Metropolitan Area Planning Council (MAPC)—that will receive these investments.
FIGURE ES-2
MPO Municipalities containing FFYs 2019–23 TIP Program Projects by Community Type
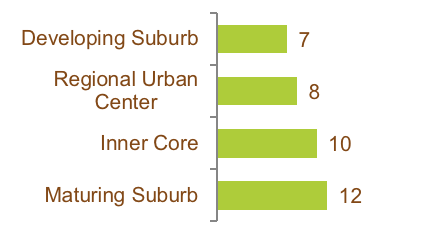
Data Source: Boston Region MPO.
The FTA allocates the funds programmed in the TIP Transit Program according to formula. The three regional transit authorities in the Boston Region MPO area that are recipients of these funds are the MBTA, CATA, and MWRTA. The MBTA, with its extensive transit program and infrastructure, is the recipient of the preponderance of the region’s federal transit funds.
Under the federal transportation legislation, Fixing America’s Surface Transportation Act (FAST Act), funding is allocated by the following categories:
The TIP Highway Program was developed with the assumption that federal funding for the state would range between $661 million and $726 million annually over the next five years (these amounts include the funds that would be set aside as payments for the Accelerated Bridge Program, and exclude required matching funds).
The process of deciding how to use this federal funding in the Boston region follows several steps. First, MassDOT reserves funding for GANs debt service payments for the Accelerated Bridge Program; annual GANs payments range between $66 million and $94 million annually over the five years of this TIP.
The remaining Federal-Aid Highway Program funds are budgeted to support state and regional (that is, MPO) priorities. In this planning cycle, $734 million to $782 million annually was available statewide for programming (these amounts include both federal dollars and the local match). MassDOT customarily provides the local match (which can also be provided by other entities); thus, projects are typically funded with 80 percent federal dollars and 20 percent state dollars, depending on the funding program.
MassDOT allocates approximately one-third of the total available federal funding among the state’s MPOs for programming. This discretionary funding for MPOs is suballocated by formula to determine the Regional Target amounts. MassDOT develops these targets in consultation with the Massachusetts Association of Regional Planning Agencies (MARPA).
MassDOT then finalizes the statewide program targets. Funding is allocated across the following funding categories:
This TIP assumes that the Boston Region MPO will have between $98 million and $109 million annually for Regional Target amounts (which consist of federal funding and state funding for the local match).
Each MPO may decide how to prioritize its Regional Target funding. Given that the Regional Target funding is a subset of the Highway Program, the MPO typically programs the majority of funding for roadway projects; however, the MPO has flexed portions of its highway funding to the Transit Program for transit expansion projects. The TIP Highway Program details the projects that will receive Regional Target funding from the Boston Region MPO, as well as statewide infrastructure projects within the Boston region.
When determining which projects to fund through the Regional Target funding process, MPO members collaborate with municipalities, state agencies, members of the public, advocacy groups, and other stakeholders. The MPO uses evaluation criteria in its project selection process to help identify and prioritize projects that advance the MPO’s goals, which are categorized as follows:
Additionally, the MPO has established investment programs, which are designed to direct Regional Target funding towards MPO priority areas over the next 25 years:
Projects that the MPO selects to receive Regional Target funding through the TIP development process are included in one of the five programs listed above.
In recent years, the MPO has been incorporating performance-based planning and programming (PBPP) practices into its TIP development and other processes. These practices are designed to help direct MPO funds towards achieving specific outcomes for the transportation system. The MPO’s goals and investment programs are key components of its PBPP framework. In FFY 2018, the MPO began to set targets for specific performance measures. Over time, the MPO will more closely link its performance targets, investment decisions, and monitoring and evaluation activities. See Chapter 4 for more information on PBPP.
The outreach process begins early in the federal fiscal year, when cities and towns designate TIP contacts and begin developing a list of priority projects to be considered for federal funding. The MPO staff asks the staffs of cities and towns in the region to identify their priority projects.
MPO staff compiles the project funding requests into a Universe of Unprogrammed Projects, a list of all projects identified as potential candidates to receive funding through the TIP. The Universe includes projects that are fully designed and ready to be advertised for construction, those that are undergoing preliminary engineering and design, and projects still in the conceptual or planning stage. MPO staff also collects data on each project in the Universe so that the projects may be evaluated.
MPO staff evaluates projects based on how well they address the MPO’s goals. In order for MPO staff to conduct a complete project evaluation, the project must have a functional design report or be at a 25-percent design stage; or its plans must include the level of detail defined in a functional design report. The evaluation results are posted on the MPO’s website where project proponents, municipal officials, and members of the public may review them and provide feedback.
An important step toward TIP programming takes place midway through the TIP development cycle at a meeting—referred to as TIP Readiness Day—that both MassDOT and MPO staff attend. At this meeting, MassDOT Highway Division provides updates about cost and schedule changes related to currently programmed projects. These cost and schedule changes must be taken into account as MPO staff helps the MPO board consider updates to the already programmed years of the TIP, as well as the addition of new projects in the outermost year of the TIP.
Using the evaluation results and information about project readiness (that is, when a project likely would be fully designed and ready for advertisement), staff prepares the First-Tier List of Projects. This list contains those projects that are supported by a project proponent (a municipality or MassDOT) and that could be made ready for advertising within the TIP’s time horizon—the next five federal fiscal years. The projects are ranked based on the evaluation results.
MPO staff then prepares a recommendation or a series of programming scenarios for how to program the Regional Target funding in the TIP based on the First-Tier List of Projects and other considerations, such as whether a project was included in the LRTP, addresses an identified transportation need, or promotes distribution of transportation investments across the region.
The staff recommendation is always financially constrained—meaning, subject to available funding. There was approximately $521 million of Regional Target funding available to the Boston Region MPO for FFYs 2019–23. This year, the MPO discussed the staff recommendation and programming scenarios for the Regional Target Program for highway projects and selected a preferred program in April.
In addition to prioritizing the Regional Target funding, the MPO also reviews and endorses the Statewide Infrastructure Items and Bridge Programs that MassDOT recommends for programming. The MPO also reviews and endorses programming of funds for the MBTA’s, CATA’s, and MWRTA’s capital programs.
After selecting a preferred programming scenario in April 2018, the MPO voted to release the draft TIP for a 30-day public review period, during which the MPO invited members of the public, regional and local officials, and other stakeholders in the Boston region to review the proposed program. During the public review period, MPO staff hosted extended Office Hours—open-house style public meetings—and a TIP-specific open house event, to discuss the draft TIP document and elicit additional comments.
After the public review period concluded, the MPO reviewed all municipal and public comments and made changes to the document as appropriate. The MPO then endorsed the TIP and submitted it to the FHWA and the FTA for approval. MassDOT incorporates the MPO-endorsed TIP into the State Transportation Improvement Program (STIP). The FHWA, FTA, and US Environmental Protection Agency review the STIP for certification by September 30, the close of the federal fiscal year.
Even after the TIP has been finalized, administrative modifications, amendments, and adjustments often must be introduced because of changes in project status, project cost, or available revenues. This may necessitate reprogramming a project in a different funding year or programming additional funds for a project.
Notices of administrative modifications and amendments are posted on the MPO’s website. If an amendment is necessary, the Regional Transportation Advisory Council—the public advisory board to the MPO—is informed, and the MPO notifies affected municipalities and other stakeholders via email. The MPO typically holds a 30-day public review period before taking final action on an amendment. In extraordinary circumstances, the MPO may vote to shorten the public comment period to a minimum of 15 days. Administrative modifications and adjustments are generally minor and usually do not warrant a public review period.
Public input is an important aspect of the transportation planning process. Please visit www.bostonmpo.org for more information about the MPO, to view the entire TIP, and to submit your comments. You also may wish to sign up for email news updates and notices by contacting publicinfo@ctps.org or signing up at www.ctps.org/subscribe.
To request a copy of the TIP in accessible formats, please contact the MPO staff by any of the following means:
Mail: Boston Region MPO c/o CTPS
Certification Activities Group
10 Park Plaza, Suite 2150
Boston, MA 02116-3968
Telephone: 857.702.3700
TTY: 617.973.7089
Fax: 617.570.9192
Email: publicinfo@ctps.org
Chapter One
The 3C Process
Decisions about how to spend transportation funds in a metropolitan area are guided by information and ideas from a broad group of people, including elected officials, municipal planners and engineers, transportation advocates, and other interested individuals. Metropolitan planning organizations (MPOs) are the bodies responsible for providing a forum for this decision-making process. Each metropolitan area in the United States with a population of 50,000 or more has an MPO, which decides how to spend federal transportation funds for capital projects and planning studies.
In order to be eligible for federal funds, metropolitan areas are required to maintain a continuous, comprehensive, and cooperative (3C) multimodal, performance-based transportation planning process that results in plans and programs consistent with the objectives of the metropolitan area.1 The 3C planning process in the Boston region is the responsibility of the Boston Region MPO, which has established the following objectives for the process:
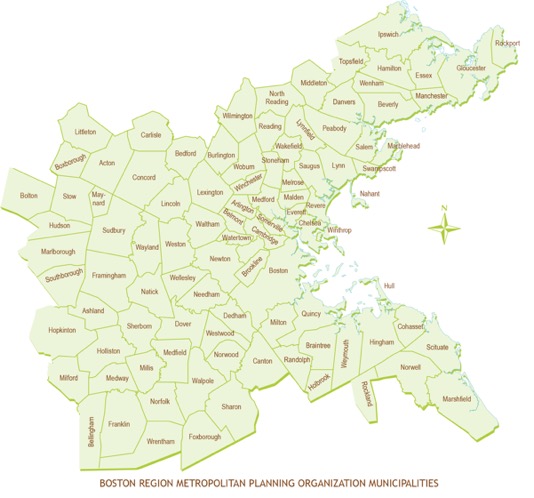
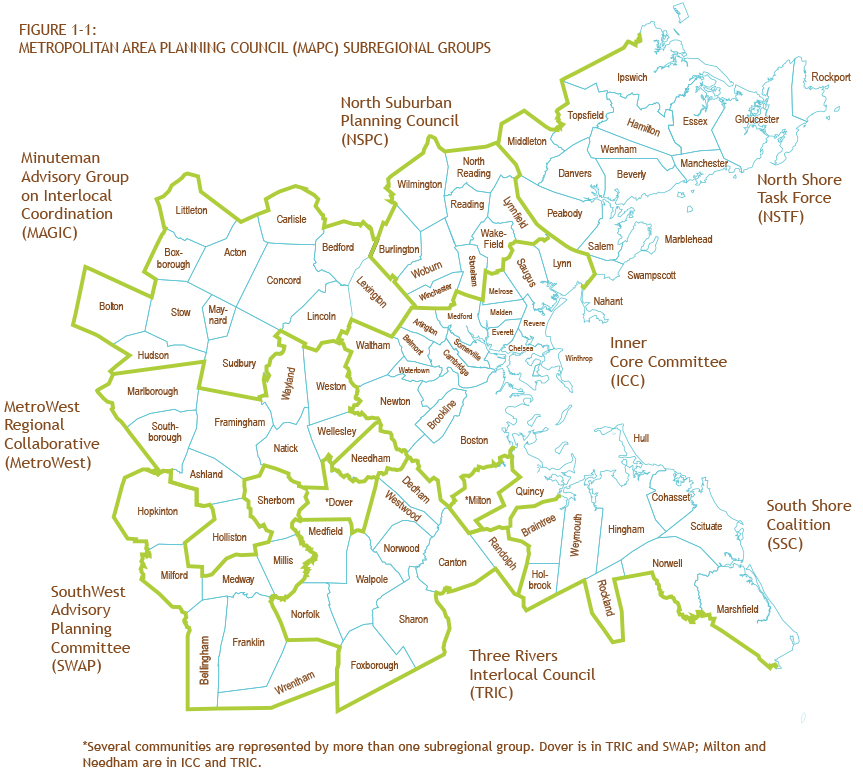
The Boston Region MPO is a 22-member board consisting of state agencies and regional and municipal organizations. Its jurisdiction extends from Boston north to Ipswich, south to Marshfield, and west to Interstate 495. There are 97 cities and towns that make up this area. Those municipalities are divided into eight subregional areas (as shown in Figure 1-1).
As part of its 3C planning process, the Boston Region MPO annually produces the Transportation Improvement Program (TIP) and the Unified Planning Work Program (UPWP). These documents, along with the Long-Range Transportation Plan (LRTP), are required for the MPO to be certified as meeting federal requirements, which in turn is a prerequisite for receiving federal transportation funds. These three plans and programs are often referred to as certification documents.
This TIP was developed and approved by the permanent and elected MPO voting members. The following are permanent voting members:
Municipal MPO members are elected by chief elected officials of the municipalities in the MPO region to represent the interests of the entire region. There are seats designated for at-large cities and at-large towns—which, respectively, may be filled by any city and town in the region—as well as seats for cities and towns within specific subregions. The current elected municipal MPO voting members are listed below (with their subregional affiliations noted):
Figure 1-1
Metropolitan Area Planning Council
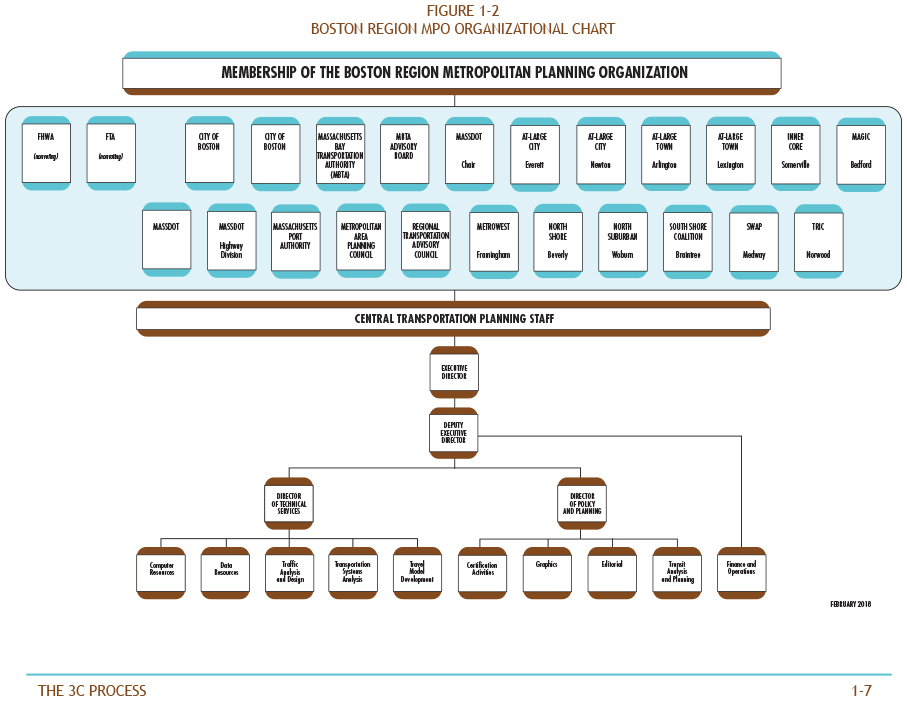
The Federal Highway Administration (FHWA) and Federal Transit Administration (FTA) participate in the MPO as advisory (nonvoting) members. Figure 1-2 is an organization chart of MPO membership and of the MPO’s staff, the Central Transportation Planning Staff (CTPS).
More details about the MPO’s members are cited below. All members—except for MassDOT and the City of Boston—hold one seat on the MPO board. MassDOT has three seats, including one for the Highway Division. The City of Boston has two seats.
MassDOT was established under Chapter 25 of the Acts of 2009, An Act Modernizing the Transportation Systems of the Commonwealth of Massachusetts. MassDOT has four divisions: Highway, Rail and Transit, Aeronautics, and the Registry of Motor Vehicles. The MassDOT Board of Directors, comprised of 11 members appointed by the governor, oversees all four divisions and all MassDOT operations, including the MBTA.
The MBTAhas the statutory responsibility within its district, under the provisions of Chapter 161A of the Massachusetts General Laws (MGLs), for preparing the engineering and architectural designs for transit development projects, constructing and operating transit development projects, and operating the public transportation system. The MBTA district comprises 175 communities, including all of the cities and towns of the Boston Region MPO area. As a result of an action plan to improve the MBTA, a five-member Fiscal and Management Control Board (FMCB) was created in April 2015 to oversee the MBTA’s finances and management and to increase accountability, initially over a three-to-five-year period. By statute, the FMCB consists of five members, one with experience in transportation finance, one with experience in mass transit operations, and three who are also members of the MassDOT Board of Directors.
Massport has the statutory responsibility under Chapter 465 of the Acts of 1956, as amended, of planning, constructing, owning, and operating such transportation and related facilities as may be necessary for developing and improving commerce in Boston and the surrounding metropolitan area. Massport owns and operates Boston’s Logan International Airport, Conley Freight Terminal, Cruiseport Boston, Hanscom Field, Worcester Regional Airport, and various maritime and waterfront properties, including parks in East Boston, South Boston, and Charlestown.
The Metropolitan Area Planning Council is the regional planning agency for 101 cities and towns in the Boston region. MAPC is composed of the chief executive officer (or designee) of each city and town in the region, 21 gubernatorial appointees, and 12 ex-officio members. MAPC has statutory responsibility for comprehensive regional planning in the region under Chapter 40B of the MGLs. It is the Boston Metropolitan Clearinghouse under Section 204 of the Demonstration Cities and Metropolitan Development Act of 1966, and Title VI of the Intergovernmental Cooperation Act of 1968. MAPC’s planning area also has been designated as an economic development district under Title IV of the Public Works and Economic Development Act of 1965, as amended. MAPC’s responsibilities for comprehensive planning include providing technical assistance to communities, transportation planning, and the development of zoning, land use, and demographic and environmental studies.
This work is facilitated by municipal subregional groups that foster better communication and cooperation among member communities. These groups have played an important role in the MPO’s participatory process, including by helping to prioritize transportation projects and studies. MAPC staff complements CTPS on supporting the MPO.
The City of Boston and twelve elected cities and towns (currently Arlington, Bedford, Beverly, Braintree, Everett, Framingham, Lexington, Medway, Newton, Norwood, Somerville, and Woburn) represent the region’s municipalities in the Boston region. The City of Boston is a permanent MPO member (with two seats). There is one elected municipal seat for each of the eight MAPC subregions, and there are four at-large elected municipalities (two cities and two towns). The elected municipalities serve staggered three-year terms.
The Regional Transportation Advisory Council, the MPO’s public advisory group, provides the opportunity for transportation-related organizations, agencies, and municipal representatives to become actively involved in the MPO’s decision-making processes for planning and programming transportation projects in the region. The Advisory Council reviews, comments on, and makes recommendations on the MPO’s certification documents. The Advisory Council also provides information about transportation topics in the region, identifies issues, advocates for ways to address the region’s transportation needs, and generates interest in the work of the MPO among members of the general public.
The FHWA and FTA participate in the Boston Region MPO in an advisory (nonvoting) capacity, reviewing the MPO’s certification documents to ensure compliance with federal planning and programming requirements. The two federal agencies oversee the highway and transit programs of the US Department of Transportation under the pertinent legislation and the provisions of the FAST Act.
Staff at CTPS and MAPC assist the MPO board in carrying out the responsibilities of the MPO’s 3C planning process through policy implementation, technical support, and public participation.
The following section briefly describes the three documents produced by the MPO as part of its federally required 3C planning process:
The TIP serves as the implementation arm of the LRTP; the Boston Region MPO updates the TIP annually. An MPO-endorsed TIP is incorporated into the State Transportation Improvement Program, which in turn is submitted to FHWA, FTA, and the US Environmental Protection Agency for approval.
The studies and work products programmed for funding through the UPWP are integrally related to other planning initiatives conducted by the Boston Region MPO, as well as to initiatives by MassDOT, the MBTA, Massport, MAPC, and the region’s municipalities. The UPWP efforts can be a means to study transportation projects and alternatives before they are advanced for further design, construction, and future programming through the TIP.
The FAST Act requires all MPOs to fulfill the 3C planning process. To meet this requirement, MPOs must perform the following activities:
The FAST Act also maintains national goals for federal highway programs, including the following:
1. Safety: Achieve significant reduction in traffic fatalities and serious injuries on all public roads
2. Infrastructure condition: Maintain the highway infrastructure asset system in a state of good repair
3. Congestion reduction: Achieve significant reduction in congestion on the National Highway System
4. System reliability: Improve efficiency of the surface transportation system
5. Freight movement and economic vitality: Improve the national freight network, strengthen the ability of rural communities to access national and international trade markets, and support regional economic development
6. Environmental sustainability: Enhance performance of the transportation system while protecting and enhancing the natural environment
7. Reduced project delivery delays: Reduce project costs; promote jobs and the economy; and expedite movement of people and goods by accelerating project completion, eliminating delays in the development and delivery process, lessening regulatory burdens, and improving the work practices of the agencies involved
In addition, the FAST Act maintains the federal planning factors established in the Safe, Accountable, Flexible, Efficient Transportation Equity Act: A Legacy for Users (SAFETEA-LU) and adds two new planning factors. In accordance with the legislation, the MPO shall comply with the following factors:
Federal guidance dictates that the 3C planning process should facilitate the safe and efficient management, operation, and development of surface transportation systems that will serve the mobility needs of people and freight. The surface transportation system should foster economic growth and development within and between states and urbanized areas, and take into consideration resiliency needs while minimizing transportation-related fuel consumption and air pollution.
The FAST Act continues to emphasize performance-based planning as an integral part of the metropolitan planning process. States are to develop performance goals, guided by the national goals, and then MPOs will work with state departments of transportation (DOTs) and public transportation providers to develop MPO performance targets. The TIP will integrate the MPOs’ performance measures and link transportation investment decisions to progress toward achieving performance goals.
Air quality conformity determinations must be performed for LRTPs and TIPs in areas that are classified as in nonattainment for pollutants controlled by National Ambient Air Quality Standards. Capital improvement projects that receive federal funding and that are considered regionally significant must be analyzed for their effect on air quality. These determinations must show that, collectively, projects programmed in the LRTP and TIP will not cause or contribute to any new air quality violations, will not increase the frequency or severity of any existing air quality violations in any area, and will not delay the timely attainment of air quality standards in any area.
A determination must also be performed if there are transportation control measures (TCMs) identified in the Commonwealth’s State Implementation Plan for the attainment of air quality standards in the region. TCMs are federally enforceable, and projects that address the identified air quality issues must be given first priority when using federal funds. Examples of TCMs that were programmed in previous TIPs include parking-freeze programs in Boston and Cambridge, statewide rideshare programs, rapid-transit and commuter-rail extension programs, park-and-ride facilities, residential parking-sticker programs, and the operation of high-occupancy-vehicle lanes.
The Boston Region MPO complies with Title VI of the Civil Rights Act of 1964, the ADA, and other federal and state nondiscrimination statutes and regulations in all of its programs and activities. The MPO does not discriminate based on race, color, national origin (including limited English proficiency), income, religion, creed, ancestry, ethnicity, disability, age, sex, sexual orientation, gender identity or expression, veteran status (including Vietnam-era veterans), or background. The major federal requirements are discussed below.
Title VI of the Civil Rights Act of 1964 requires that no person be excluded from participation in, denied the benefits of, or subjected to discrimination on the basis of race, color, or national origin under any program or activity provided by an agency receiving federal financial assistance.
Executive Order 13166, dated August 11, 2000, extends Title VI protections to persons who, as a result of national origin, have limited English proficiency (LEP). Specifically, it calls for improved access to programs and activities conducted or assisted by federal agencies, and it requires MPOs to develop and implement a system by which LEP persons can meaningfully participate in the transportation planning process.
Executive Order 12898, dated February 11, 1994, further expands upon Title VI, requiring each federal agency to achieve environmental justice by identifying and addressing any disproportionately high adverse human health or environmental effects on minority or low-income populations, including interrelated social and economic effects, resulting from its programs, policies, and activities.
On April 15, 1997, the US Department of Transportation issued its Final Order to Address Environmental Justice in Minority Populations and Low-Income Populations. Among other provisions, this order calls for programming and planning activities to meet the following requirements:
Title III of the ADA requires all transportation projects, plans, and programs to be accessible to people with disabilities. In regard to MPOs, this means that public meetings must be held in accessible buildings and documents must be made available in accessible formats.
Executive Order 13330, dated February 26, 2004, calls for the establishment of the Interagency Transportation Coordinating Council on Access and Mobility, under the aegis of the US Secretary of Transportation. This executive order reinforces both environmental justice and ADA requirements by charging the council with developing policies and methods for improving access for persons with disabilities, persons with low-income, and older adults.
The MPO considers the degree to which a proposed TIP project would advance the goals and objectives of its LRTP. The MPO also reviews TIP projects within the context of the recommended projects already included in the LRTP.
The MPO aims to implement the findings and recommendations of past studies and reports conducted through the UPWP when developing the TIP.
The purpose of the Congestion Management Process (CMP) is to monitor and analyze the performance of transportation facilities and services; develop strategies to alleviate congestion; and move these strategies into the implementation stage by providing decision-makers in the region with information and recommendations. The CMP monitors roadways and park-and-ride facilities in the MPO region for safety, congestion, and mobility, and identifies problematic locations. Projects that help address problems identified in the most recent CMP monitoring endeavor were considered for inclusion in this TIP.
The Global Warming Solutions Act (GWSA) makes Massachusetts a leader in setting aggressive and enforceable greenhouse gas (GHG) reduction targets and implementing policies and initiatives to achieve these targets. In keeping with this law, the Massachusetts Executive Office of Energy and Environmental Affairs, in consultation with other state agencies and the public, developed the Massachusetts Clean Energy and Climate Plan for 2020. This implementation plan, released on December 29, 2010 (and updated in 2015), establishes the following targets for overall statewide GHG emission reductions:
In January 2015, the Massachusetts Department of Environmental Protection promulgated regulation 310 CMR 60.05, Global Warming Solutions Act Requirements for the Transportation Sector and the Massachusetts Department of Transportation. This regulation places a range of obligations on MassDOT and MPOs to support achievement of the Commonwealth’s climate change goals through the programming of transportation funds. In particular, MPOs must use GHG impact as a selection criterion when they review projects to be programmed in their TIPs. Appendix B of this document includes information about these requirements and how the Boston Region MPO has addressed them in developing the TIP.
The transportation sector is the single largest contributor of GHGs—accounting for more than one-third of GHG emissions—and, therefore, is a major focus of the Massachusetts Clean Energy and Climate Plan for 2020. MassDOT’s approach to fulfilling its part of the plan is presented in its GreenDOT Policy Directive, a comprehensive sustainability initiative that sets three principal objectives:
The Commonwealth’s 10 MPOs and three non-metropolitan planning regions are integrally involved in helping MassDOT achieve its GreenDOT objectives and supporting the GHG reductions mandated under the GWSA. The MPOs seek to realize these objectives by prioritizing projects in the LRTP and TIP that will help reduce emissions from the transportation sector. The Boston Region MPO uses its TIP project evaluation criteria to score projects based on their GHG emissions impacts, multimodal Complete Streets accommodations, and ability to support smart growth development. Tracking and evaluating GHG emissions by project will enable the MPOs to anticipate GHG impacts of the planned and programmed projects.
In 2009, the MBTA adopted its current Program for Mass Transportation (PMT). The PMT was developed with extensive public involvement and was approved by the MBTA Advisory Board.
The next PMT, Focus40, is under development (and expected to be released by mid-2018). Focus40 is the 20-year investment plan to position the MBTA to meet the needs of the greater Boston region through 2040. The Focus40 process will create a long-term investment vision that recognizes current infrastructure challenges and the shifting demographics, changing climate, and evolving technology that may alter the role that the MBTA will play in greater Boston in the future. Focus40 will emphasize 1) improving system performance and reliability; 2) supporting economic growth; 3) supporting inclusive growth; 4) mitigating and adapting to climate change; and 5) providing a seamless multimodal experience.
In 2016, the Focus40 team examined the existing conditions and future context for the transit system, developed goals, and collected feedback and ideas for improvements through an extensive public engagement process. During 2017, the team established the plan’s framework and objectives and began to develop a recommended strategy. In 2018, MassDOT and the MBTA will propose programs and strategies that align with that framework and finalize the plan. Recommendations from Focus40 will support MassDOT’s Capital Investment Plan.
The Boston MPO continues to monitor the development of Focus40 to inform its decision making about transit capital investments in the TIP and LRTP.
MetroFuture, the long-range plan for land use, housing, economic development, and environmental preservation in the Boston region,was developed by MAPC and adopted in 2008. It includes a vision for the region’s future and a set of strategies for achieving that future. Its goals and objectives were used in developing the future land-use scenario for Charting Progress to 2040. MetroFuture’s goals, objectives, and strategies were considered in the development of this TIP. MAPC is working on an update to the plan.
On September 9, 2013, MassDOT passed the Healthy Transportation Policy Directive to formalize its commitment to implementing and maintaining transportation networks that allow for various mode choices. This directive will ensure that all MassDOT projects are designed and implemented in ways that provide all customers with access to safe and comfortable walking, bicycling, and transit options.
In November 2015, MassDOT released the Separated Bike Lane Planning & Design Guide. This guide represents the next—but not the last—step in MassDOT’s continuing commitment to Complete Streets, sustainable transportation, and the creation of more safe and convenient transportation options for Massachusetts’ residents. This guide may be used by project planners and designers as a resource for considering, evaluating, and designing separated bike lanes as part of a Complete Streets approach.
In Charting Progress to 2040, the Boston Region MPO has established investment programs—particularly its Complete Streets and Bicycle and Pedestrian programs—that support the implementation of Complete Streets projects. These investment programs are reflected in this TIP. The MPO’s TIP project selection criteria also reflect the MPO’s support for the programming of Complete Streets and bicycle and pedestrian investments.
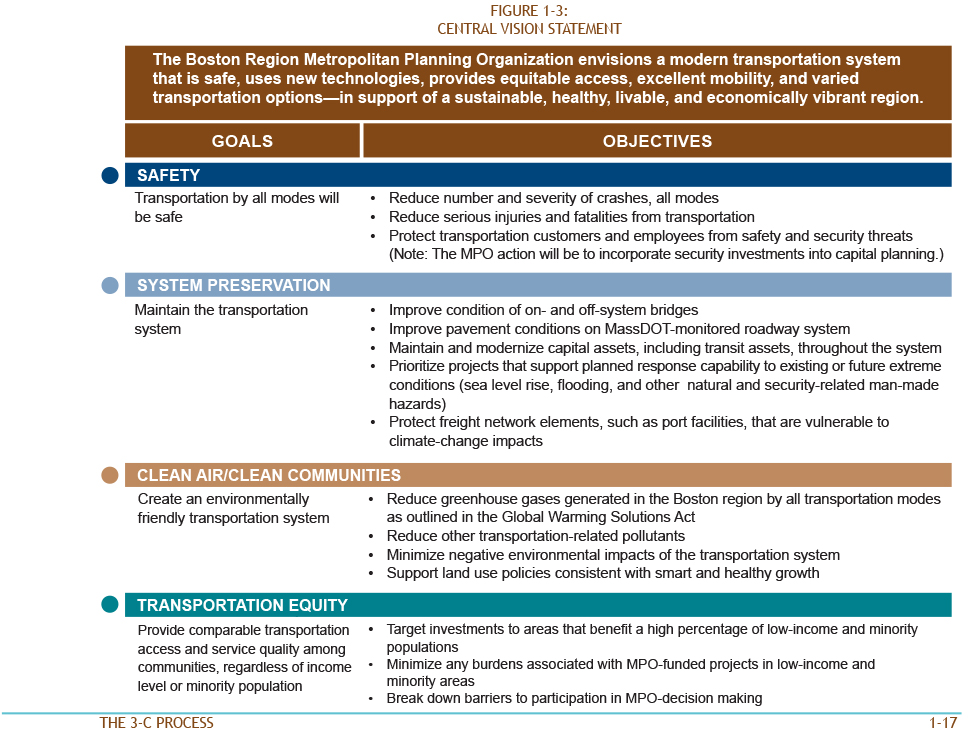
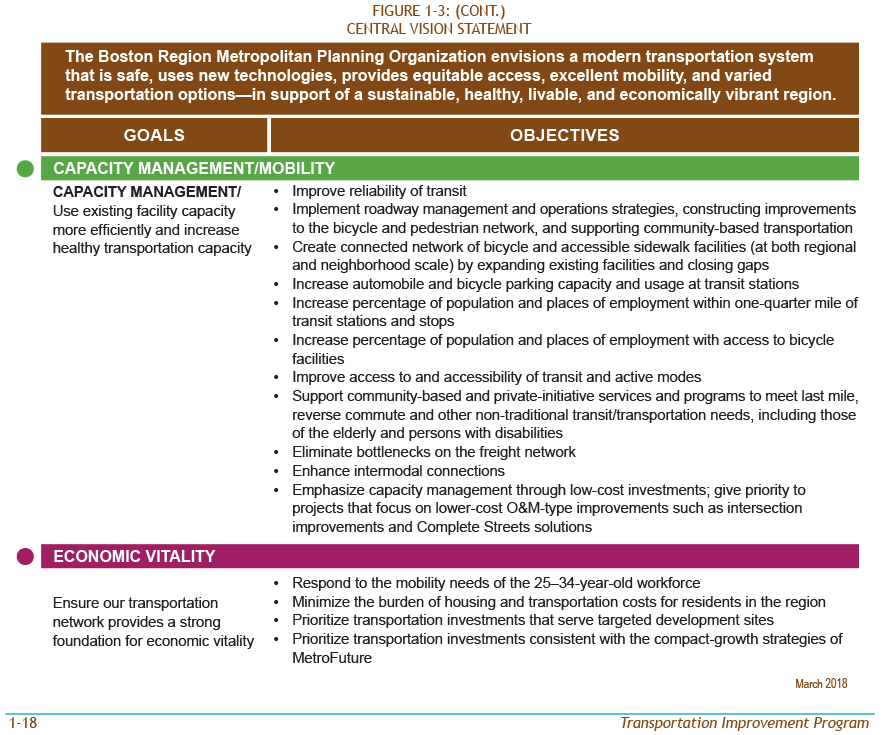
In the development of Charting Progress to 2040, the Boston Region MPO updated its vision, goals, and objectives. These updated goals and objectives, listed on the following pages, guided the 2016 update of the TIP evaluation criteria. As such, the investments in the TIP aim to achieve the following:
Chapter 4 demonstrates in detail how transportation investments over the next five years would advance the MPO’s goals and objectives.
Chapter Two
The TIP Process
Thus, the Boston Region MPO develops a long-range regional transportation plan and a Transportation Improvement Program (TIP) that prioritizes transportation investments and helps the MPO decide how to spend federal transportation funds for capital projects. The Central Transportation Planning Staff (CTPS), which is the staff to the Boston Region MPO, manages the annual development process for the TIP. MPO staff helps evaluate project funding requests from municipalities and state transportation agencies, propose programming for new and ongoing projects based on anticipated yearly funding levels, support the MPO by creating a draft TIP document, and facilitate a public involvement process that affords the public an opportunity to review the draft TIP before the MPO endorses the final document.
The first step in allocating federal transportation funds is the passage by the United States Congress of a multi-year act that establishes a maximum level of federal transportation funding per federal fiscal year (FFY).2 The establishment of this level of funding is referred to as an authorization.
Once the authorization level has been established, the United States Department of Transportation annually allocates funding among the states, based on various federal formulas. This allocation is referred to as an apportionment. The annual apportionment rarely represents the actual amount of federal funds that are ultimately committed to a state because of federally imposed limitations on spending in a given fiscal year, referred to as the obligation authority. In Massachusetts, TIPs are developed based on the estimated obligation authority.
Two of the most important distinctions between apportionment and obligation authority are as follows: 1) apportionment is allocated per funding program, while obligation authority is generally allocated as a lump sum; and 2) unused apportionment carries forward into successive FFYs, but unused obligation authority does not. Unused apportionment that is carried forward is referred to as an unobligated balance. Although a state’s unobligated balance can be used to increase the amount of federal aid programmed within a particular funding category in a given FFY, it cannot be used to increase the total amount of the state’s highway apportionment.
Federal regulations require states to “provide MPOs with estimates of federal and state funds which the MPOs shall utilize in developing financial plans” for TIPs.3
The FFYs 2019–23 TIP’s Highway Program was developed with the assumption that federal funding for the state would range between $661 million and $726 million annually over the next five years (these amounts include the funds that would be set aside as payments for the Accelerated Bridge Program and exclude required matching funds).
The process of deciding how to use this federal funding in the Boston region follows several steps. MassDOT first reserves funding for Grant Anticipation Notes (GANs) debt service payments for the Accelerated Bridge Program; annual GANs payments range between $66 million and $94 million annually over the five years of this TIP.
The remaining Federal-Aid Highway Program funds are budgeted to support state and regional (i.e., MPO) priorities. In this cycle, $734 million to $782 million annually was available statewide for programming (these amounts include both federal dollars and the state-provided local match). MassDOT customarily provides the local match (which can also be provided by other entities); thus, projects are typically funded with 80 percent federal dollars and 20 percent state dollars, depending on the funding program.
Next, MassDOT allocates the remaining federal funding into the following categories:
The Regional Targets are discretionary funds for MPOs, suballocated by formula to each metropolitan planning region. (The Boston Region MPO receives about 43 percent of the total funds available statewide for Regional Targets.) MassDOT developed the target formula in consultation with the Massachusetts Association of Regional Planning Agencies (MARPA).
Each MPO in the state can decide how to prioritize its Regional Target funding. Given that the Regional Target funding is a subset of the Highway Program, the Boston Region MPO typically programs the majority of its target funding on roadway projects; however, the MPO has flexed portions of its Highway Program funding to the Transit Program, as when the MPO gave its support to the Green Line Extension transit expansion project.
The MPO’s discretionary funding typically is used for modernization programs (intersection improvements and roadway reconstruction) and expansion projects (roadway capacity and bicycle and pedestrian facilities), whereas statewide highway items primarily cover the reliability programs (for bridges, pavement, and safety, for example).
During the next five years, the Boston Region MPO’s total Regional Target funding will be approximately $521 million, an average of $104 million per year. To decide how to spend its Regional Target funding, the MPO engages its 97 cities and towns in an annual TIP development process.
Federal aid for public transit authorities is allocated by formula to urbanized areas (UZAs). MassDOT is the recipient of this federal aid in the Boston UZA. In UZAs with populations greater than 200,000, such as the Boston UZA, the distribution formula factors in passenger-miles traveled, population density, and other factors associated with each transit provider. The three regional transit authorities (RTAs) in the Boston Region MPO area are the Massachusetts Bay Transportation Authority (MBTA), MetroWest Regional Transit Authority (MWRTA), and Cape Ann Transportation Authority (CATA). The MBTA, with its extensive transit program and infrastructure, is the recipient of the preponderance of federal transit funds in the region.
Metropolitan areas utilize many different federal-aid transportation programs, and each program has unique requirements. Federal programs in the FAST Act that fund projects in the FFYs 2019–23 TIP are listed in the following two tables.
TABLE 2-1
Federal Highway Administration Programs Applicable to the FFYs 2019-23 TIP
FAST Act Program |
Eligible Uses |
Congestion Mitigation and Air Quality Improvement (CMAQ) |
A wide range of projects to reduce congestion and improve air quality in nonattainment and maintenance areas for ozone, carbon monoxide, and particulate matter |
Highway Safety Improvement Program (HSIP) |
Implementation of infrastructure-related highway safety improvements |
National Highway Performance Program (NHPP)
|
Improvements to interstate routes, major urban and rural arterials, connectors to major intermodal facilities, and the national defense network; replacement or rehabilitation of any public bridge; and resurfacing, restoring, and rehabilitating routes on the Interstate Highway System |
Surface Transportation Block Grant Program (STBGP) [formerly the Surface Transportation Program (STP)] |
A broad range of surface transportation capital needs, including roads; transit, sea, and airport access; and vanpool, bicycle, and pedestrian facilities |
Transportation Alternatives Program (TAP)
|
A set-aside from the STBGP that funds the construction of infrastructure-related projects (for example, sidewalk, crossing, and on-road bicycle facility improvements) |
Metropolitan Planning |
Facilities that contribute to an intermodal transportation system, including intercity bus, pedestrian, and bicycle facilities |
National Highway Freight Program (NHFP) |
Projects that improve the efficient movement of freight on the National Highway Freight Network |
TABLE 2-2
Federal Transit Administration Programs Applicable to the FFYs 2019-23 TIP
FAST Act Program |
Eligible Uses |
Urbanized Area Formula Grants |
Transit capital and operating assistance in urbanized areas |
Fixed Guideway/Bus |
Replacement, rehabilitation, and other state-of-good-repair capital projects |
Bus and Bus Facilities |
Capital projects to replace, rehabilitate, and purchase buses and related equipment, and to construct |
Enhanced Mobility of Seniors and Individuals with Disabilities |
Capital expenses that support transportation to meet the special needs of older adults and persons with disabilities |
Fixed-Guideway Capital Investment Grants |
Grants for new and expanded rail, bus rapid transit, and ferry systems that reflect local priorities to improve transportation options in key corridors |
The MPO’s process for selecting projects to receive highway discretionary—or Regional Target—funding uses evaluation criteria to help identify and prioritize projects that advance the MPO’s goals. The criteria are based on the MPO’s goals and objectives, which were adopted for its current Long-Range Transportation Plan (LRTP), Charting Progress to 2040. All projects are required to show consistency with the LRTP and other statewide and regional plans. Other factors considered include the readiness of a project for construction and municipal support for the project. Background information about the TIP project evaluation process is presented in Appendix B.
The TIP development process begins early in the federal fiscal year when cities and towns in the region designate TIP contacts and begin developing a list of priority projects to be considered for federal funding. Each fall, the MPO staff asks these TIP contacts to identify their city or town’s priority projects and then staff elicits input from interested parties and members of the general public.
New projects must be initiated by the MassDOT Highway Division before they can be considered for programming in the TIP. MassDOT details the project initiation process and posts relevant documents on its Project Review Committee’s webpage, www.massdot.state.ma.us/highway/Departments/ProjectManagement/ProjectReviewCommittee.aspx.
Municipal TIP Contacts and the MPO staff coordinate to update each project’s Project Funding Application Form through the MPO’s Interactive TIP Database, www.bostonmpo.org/apps/tip11/tip_query.html, which summarizes information about each project's background, infrastructure condition and needs, development status, and ability to help the region attain the MPO’s goals and objectives.
MPO staff compiles the project funding requests into a Universe of Unprogrammed Projects list, which consists of all identified projects being advanced for possible funding. The Universe includes projects that are fully designed and ready to be advertised for construction, those that are undergoing preliminary engineering and design, and projects still in the conceptual planning stage.
The MPO staff also monitors the anticipated greenhouse gas (GHG) emissions of each project in order to consider these impacts when prioritizing transportation investments. For more information on GHG emission monitoring and evaluation, see Appendix B.
The MPO uses project evaluation criteria to logically and transparently evaluate and select projects for programming in the TIP that advance the MPO’s vision for transportation. This process favors projects that support the following goals:
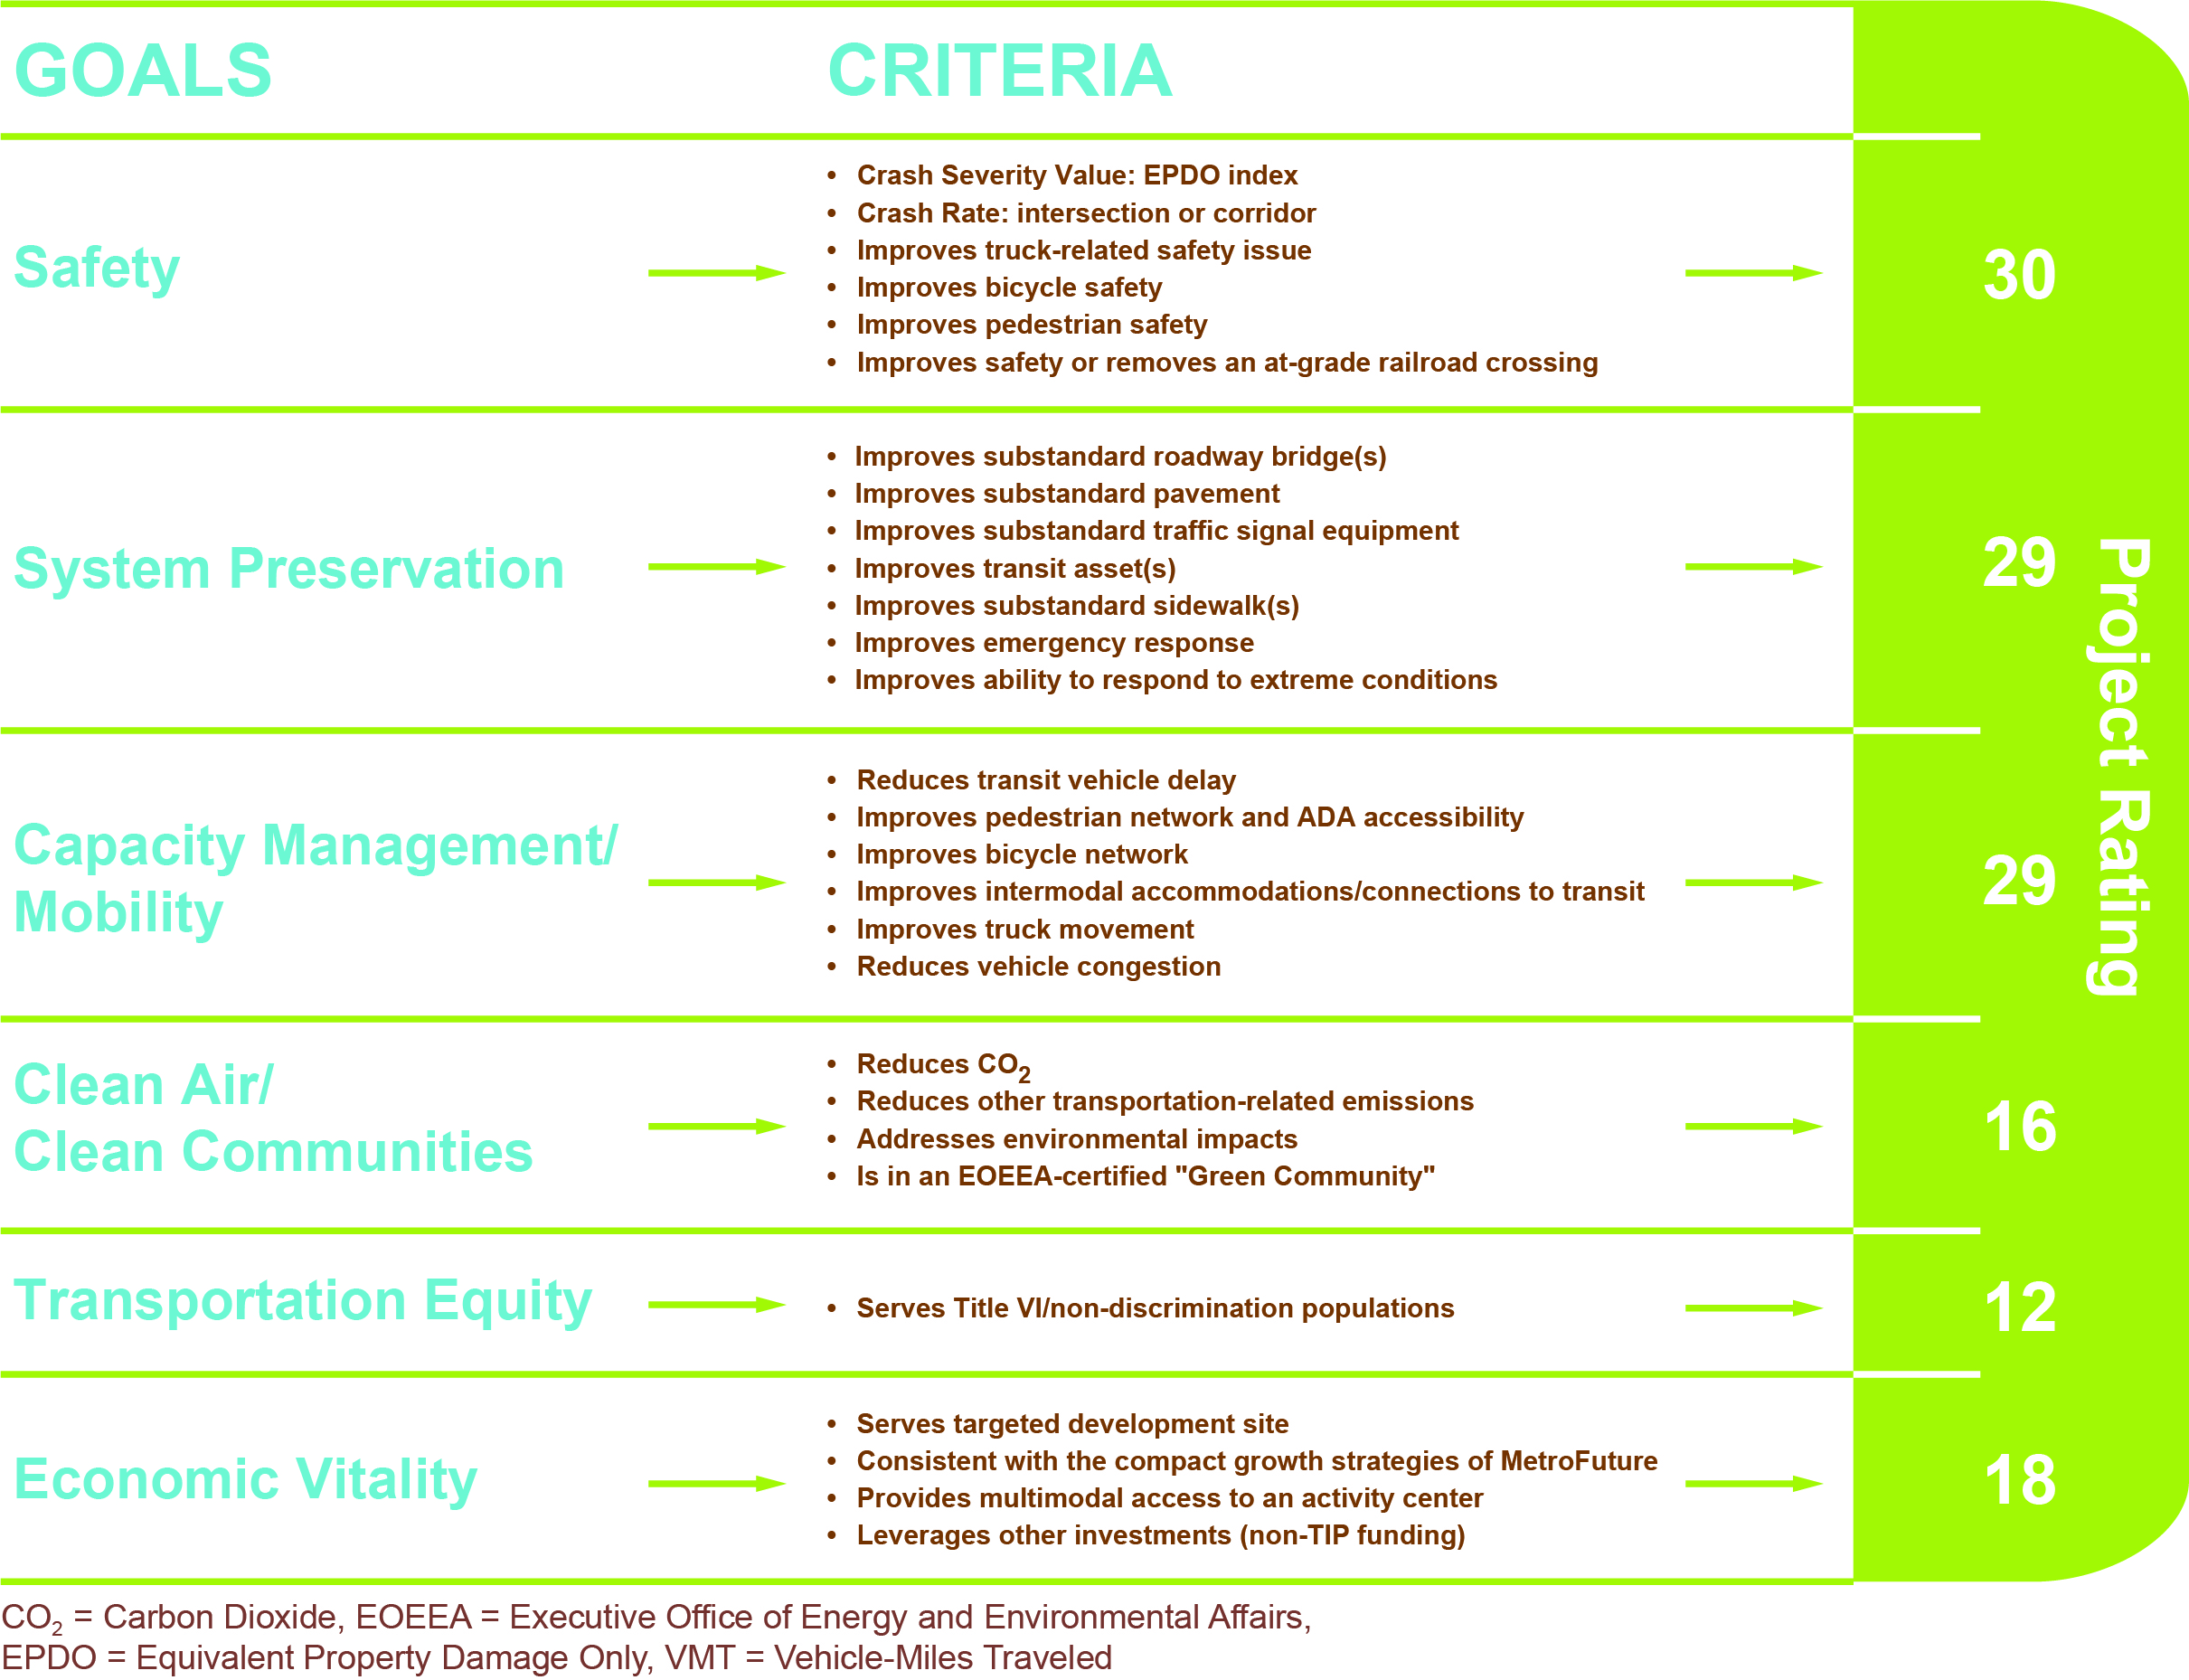
The project evaluation scoring methodology consists of 28 criteria that support the six goals and related objectives of the MPO’s LRTP. A list of the TIP evaluation criteria (on the following pages) provides an overview of the goals, criteria, and scoring values.
In order for MPO staff to conduct a complete project evaluation, the project must have a functional design report or be at a 25 percent design stage, or its plans must include the level of detail defined in a functional design report. See MassDOT’s Project Development and Design Guide for information about the contents of a functional design report. This guide is available at www.massdot.state.ma.us/highway/DoingBusinessWithUs/ManualsPublicationsForms/ProjectDevelopmentDesignGuide.aspx.
The summary of evaluation results for projects considered for programming in this TIP is available in Appendix A. The table contains the total project rating for each project. For more details about the evaluation criteria used to score projects, see Appendix B.
MPO staff meets with members of the MassDOT Highway Division and MassDOT District project managers to review cost and schedule changes related to currently programmed projects, which are undergoing design review, permitting, and right-of-way acquisition. The MPO board then considers these updated project construction costs and changes to the expected dates for construction advertisement when making decisions about changes to TIP programming. These changes have an impact on the ability of the MPO to program its target funds for new projects in the five-year TIP.
Using the evaluation ratings and information gathered about project readiness (when a project likely would be fully designed and ready for construction), staff prepares a First-Tier List of Projects. This list cites the projects that both earned the highest ratings in the MPO’s evaluation process and that could be made ready for advertising within the TIP’s time horizon—the next five FFYs.
The MPO staff strongly considers the First-Tier List of Projects when preparing a recommendation to the MPO for projects to program in the TIP. Other factors considered for project selection include whether a project was programmed in the LRTP, investment program funding targets, distribution of investments across the region, and whether sufficient funding is available for the proposed projects.
Figure 2-1
TIP Evaluation Criteria
The selection of transit, bridge, and statewide infrastructure projects for programming in the TIP draws primarily from MassDOT’s Capital Investment Plan (CIP), which is a fully integrated capital plan produced by all MassDOT divisions and the MBTA.
Projects in the CIP are selected from MassDOT’s Universe of Projects. They are prioritized based on a process recommended by the independent Project Selection Advisory Council (PSAC) and on data from asset management systems maintained by MassDOT divisions.
Projects that receive the highest priority are those that meet MassDOT’s goals for maintaining and improving the overall condition and reliability of the system; modernizing the system to make it safer and more accessible and to accommodate growth; and expanding and diversifying transportation options for communities. The following criteria guide project selection:
The transit element of the TIP also includes the federal-aid programs of the other two RTAs in the region, CATA and MWRTA. CATA and MWRTA coordinate with the MassDOT Rail and Transit Division to develop their capital programs.
The MPO considers the project evaluation results, First-Tier List of Projects, and staff recommendation when prioritizing projects for Regional Target funding. The body also considers public comments, the regional importance of projects, and other factors. In addition to prioritizing the Regional Target funding, the MPO reviews statewide infrastructure items, the Bridge Program, and the capital programs for the MBTA, CATA, and MWRTA before voting to release a draft TIP for public review.
The MPO votes to release the draft document for public review and invites members of the public, municipal officials, and other stakeholders in the Boston region to review the proposed TIP. MPO staff hosts outreach events, including its Office Hours and similar open-house events, during the public comment period to elicit comments on the draft document (summarized in Appendix C).
After the public review period ends, the MPO reviews all municipal and public comments and may change the programming or the document as appropriate. Then the MPO endorses the TIP. MassDOT incorporates the MPO-endorsed TIP into the State Transportation Improvement Program (STIP) and submits it to the Federal Highway Administration (FHWA) and Federal Transit Administration (FTA) for approval. The FHWA, FTA, and US Environmental Protection Agency review the STIP for certification by September 30, the end of the federal fiscal year.
The TIP is a dynamic program that may be amended and adjusted throughout the year. Administrative modifications and amendments are often introduced because of changes in project status (advertisement readiness), project cost, project design scope, or available revenues. An amendment is a revision that requires public review and a demonstration of fiscal constraint.
Consistent with federal guidelines, the Boston Region MPO must release an amendment if there is (1) a change in project cost of $500,000 or more, for projects valued at $5 million or less, or (2) a change of 10 percent or more of the project cost, for projects valued greater than $5 million. Cost changes that are less than these threshold amounts may be considered in the form of administrative modifications or adjustments, which must still undergo MPO action for approval. Although a public review period is not required for administrative modifications or adjustments, one may be offered at the MPO’s discretion.
Any proposed amendments are presented in a public setting at an MPO meeting, and details are posted on the MPO’s website, bostonmpo.org. Public notices are distributed through the MPO’s email contact list, which members of the public may join by signing up on the MPO’s website. TIP contacts at the affected municipalities and the public are notified of pending amendments at the start of an amendment’s public review period.
Notices of draft TIP amendments include a summary of the amendment’s contents, dates of the public review period, contact information for submitting a comment to the MPO, and the date, time, and location that the MPO will vote on that amendment. Also during the public review period, the MPO staff notifies and briefs the Regional Transportation Advisory Council about the amendment and relays comments from the Advisory Council, if any, to the MPO board. Municipal representatives and members of the public are invited to submit written or oral testimony at the MPO meetings at which amendments are discussed or voted upon.
The MPO typically holds a 30-day comment period before taking final action on an amendment. In extraordinary circumstances, the MPO may vote to shorten the public comment period to a minimum of 15 days. (These circumstances are detailed in the MPO’s Public Participation Plan.)
The MPO’s website is the best place to find current information about the TIP. All changes to the draft TIP and changes to the endorsed TIP, such as amendments and modifications, that have been approved by the MPO are available on the TIP webpage on the MPO’s website, bostonmpo.org/tip.
Comments or questions about the draft TIP materials may be submitted directly through the website, via email, voiced at MPO meetings and other public MPO events, or submitted via US mail.
Chapter Three
Highway and Transit Programming
This chapter contains the TIP tables, a listing of all the projects and programs funded with federal highway and transit funding in the Boston region during federal fiscal years (FFYs) 2019–23 (Tables 3-2 to 3-4). These tables are also included as part of the State Transportation Improvement Program (STIP). Section 1A in each annual element of the TIP table (Table 3-2) includes the regionally prioritized projects funded during a given federal fiscal year. The other sections of the table (sections 1B, 2A, 2B, 2C, 3, and 4) list the following:
Each annual element of Table 3-2 also lists the federally funded transit projects and programs in the Boston region that the MBTA, MetroWest Regional Transit Authority, and Cape Ann Transportation Authority plan to undertake. Tables 3-3 and 3-4 provide additional information related to the MBTA’s programs and projects planned in the region.
The Boston Region MPO has the discretion to allocate its share of funds from the Federal-Aid Highway Program—the MPO’s Regional Targets—to projects identified as regional priorities as it sees fit. However, the allocation of those funds is constrained by projections of available federal aid. As shown in Table 3-1 below, the MPO has programmed its discretionary funds within the limits of projected funding for highway funding programs. As such, the FFYs 2019–23 TIP Regional Target Program complies with financial constraint requirements.
The second part of the chapter includes detailed descriptions of projects, including evaluation ratings (for projects funded by the MPO’s Regional Target Program), length of roadway to be improved, and funding details. The pages are organized alphabetically by municipality.
TABLE 3-1
Boston Region MPO Regional Target Program
MPO Discretionary Funds Sourced from the Federal-Aid Highway Program
(including state matching funds, but excluding earmarked funds)
Regional Target Program |
FFY 2019 |
FFY 2020 |
FFY 2021 |
FFY 2022 |
FFY 2023 |
Total |
Regional Target Obligation Authority |
$98,794,261 |
$102,478,656 |
$104,552,877 |
$106,681,829 |
$109,011,849 |
$521,519,472 |
Regional Target Programmed |
$97,131,688 |
$102,478,643 |
$104,439,292 |
$106,584,302 |
$104,915,915 |
$515,544,161 |
Regional Target Funds Unprogrammed |
$1,662,573 |
$13 |
$113,585 |
$97,527 |
$4,095,934 |
$5,975,311 |
The second part of the chapter includes detailed descriptions of projects, including evaluation ratings (for projects funded by the MPO’s Regional Target Program), length of roadway to be improved, and funding details. The pages are organized alphabetically by municipality.
TABLE 3-2
FFYs 2019-23 Transportation Improvement Program Draft Highway Funding
| 2019 | Boston Region Transportation Improvement Program | |||||||||||
| Amendment / Adjustment Type ▼ |
STIP Program ▼ | MassDOT Project ID ▼ | Metropolitan Planning Organization ▼ | Municipality Name ▼ | MassDOT Project Description▼ | MassDOT District ▼ | Funding Source ▼ | Total Programmed Funds ▼ | Federal Funds ▼ | Non-Federal Funds ▼ | Additional Information ▼ Present information as follows, if applicable: a) Planning / Design / or Construction; b) total project cost and funding sources used; c) advance construction status; d) MPO project score; e) name of entity receiving a transfer; f) name of entity paying the non-state non-federal match; g) earmark details; h) TAP project proponent; i) other information | |
| ►Section 1A / Regionally Prioritized Projects | ||||||||||||
| ►Regionally Prioritized Projects | ||||||||||||
| Planning / Adjustments / Pass-throughs | 1570 | Boston Region | Multiple | GREEN LINE EXTENSION PROJECT- EXTENSION TO COLLEGE AVENUE WITH THE UNION SQUARE SPUR | 6 | CMAQ | $ 28,184,400 | $ 22,547,520 | $ 5,636,880 | Construction; STP+CMAQ+Section 5309 (Transit) Total MPO Contribution = $190,000,000; AC Yr 4 of 6; funding flexed to FTA; match provided by local contributions | ||
| Planning / Adjustments / Pass-throughs | 1570 | Boston Region | Multiple | GREEN LINE EXTENSION PROJECT- EXTENSION TO COLLEGE AVENUE WITH THE UNION SQUARE SPUR | 6 | STP | $ 28,184,400 | $ 22,547,520 | $ 5,636,880 | Construction; STP+CMAQ+Section 5309 (Transit) Total MPO Contribution = $190,000,000; AC Yr 4 of 6; funding flexed to FTA; match provided by local contributions | ||
| Roadway Reconstruction | 606635 | Boston Region | Multiple | NEEDHAM-NEWTON- RECONSTRUCTION OF HIGHLAND AVENUE, NEEDHAM STREET & CHARLES RIVER BRIDGE, N-04-002, FROM WEBSTER STREET (NEEDHAM) TO REOUT 9 (NEWTON) | 6 | CMAQ | $ 3,500,000 | $ 2,800,000 | $ 700,000 | Construction; CMAQ+HSIP+TAP+STP Total Cost = $26,883,332; AC Yr 1 of 2; MPO Evaluation Score = 75 | ||
| Roadway Reconstruction | 606635 | Boston Region | Multiple | NEEDHAM-NEWTON- RECONSTRUCTION OF HIGHLAND AVENUE, NEEDHAM STREET & CHARLES RIVER BRIDGE, N-04-002, FROM WEBSTER STREET (NEEDHAM) TO REOUT 9 (NEWTON) | 6 | HSIP | $ 2,875,199 | $ 2,587,679 | $ 287,520 | Construction; CMAQ+HSIP+TAP+STP Total Cost = $26,883,332; AC Yr 1 of 2; MPO Evaluation Score = 75 | ||
| Roadway Reconstruction | 606635 | Boston Region | Multiple | NEEDHAM-NEWTON- RECONSTRUCTION OF HIGHLAND AVENUE, NEEDHAM STREET & CHARLES RIVER BRIDGE, N-04-002, FROM WEBSTER STREET (NEEDHAM) TO REOUT 9 (NEWTON) | 6 | STP | $ 5,519,974 | $ 4,415,979 | $ 1,103,995 | Construction; CMAQ+HSIP+TAP+STP Total Cost = $26,883,332; AC Yr 1 of 2; MPO Evaluation Score = 75 | ||
| Roadway Reconstruction | 606635 | Boston Region | Multiple | NEEDHAM-NEWTON- RECONSTRUCTION OF HIGHLAND AVENUE, NEEDHAM STREET & CHARLES RIVER BRIDGE, N-04-002, FROM WEBSTER STREET (NEEDHAM) TO REOUT 9 (NEWTON) | 6 | TAP | $ 1,546,493 | $ 1,237,194 | $ 309,299 | Construction; CMAQ+HSIP+TAP+STP Total Cost = $26,883,332; AC Yr 1 of 2; MPO Evaluation Score = 75; TAP Proponent = MassDOT | ||
| Roadway Reconstruction | 605034 | Boston Region | Natick | NATICK- RECONSTRUCTION OF ROUTE 27 (NORTH MAIN STREET), FROM NORTH AVENUE TO THE WAYLAND T.L. | 3 | CMAQ | $ 2,415,334 | $ 1,932,267 | $ 483,067 | Construction; CMAQ+TAP+STP Total Cost = $12,087,144; MPO Evaluation Score = 60 | ||
| Roadway Reconstruction | 605034 | Boston Region | Natick | NATICK- RECONSTRUCTION OF ROUTE 27 (NORTH MAIN STREET), FROM NORTH AVENUE TO THE WAYLAND T.L. | 3 | STP | $ 8,352,877 | $ 6,682,302 | $ 1,670,575 | Construction; CMAQ+TAP+STP Total Cost = $12,087,144; MPO Evaluation Score = 60 | ||
| Roadway Reconstruction | 605034 | Boston Region | Natick | NATICK- RECONSTRUCTION OF ROUTE 27 (NORTH MAIN STREET), FROM NORTH AVENUE TO THE WAYLAND T.L. | 3 | TAP | $ 1,318,933 | $ 1,055,146 | $ 263,787 | Construction; CMAQ+TAP+STP Total Cost = $12,087,144; MPO Evaluation Score = 60 | ||
| Roadway Reconstruction | 607428 | Boston Region | Multiple | HOPEDALE- MILFORD- RESURFACING & INTERSECTION IMPROVEMENTS ON ROUTE 16 (MAIN STREET), FROM WATER STREET WEST TO APPROXIMATELY 120 FEET WEST OF THE MILFORD/HOPEDALE T.L AND THE INTERSECTION OF ROUTE 140. | 3 | CMAQ | $ 1,000,000 | $ 800,000 | $ 200,000 | Construction; CMAQ+HSIP Total Cost = $2,967,944; MPO Evaluation Score = 54 | ||
| Roadway Reconstruction | 607428 | Boston Region | Multiple | HOPEDALE- MILFORD- RESURFACING & INTERSECTION IMPROVEMENTS ON ROUTE 16 (MAIN STREET), FROM WATER STREET WEST TO APPROXIMATELY 120 FEET WEST OF THE MILFORD/HOPEDALE T.L AND THE INTERSECTION OF ROUTE 140. | 3 | HSIP | $ 1,967,944 | $ 1,771,150 | $ 196,794 | Construction; CMAQ+HSIP Total Cost = $2,967,944; MPO Evaluation Score = 54 | ||
| Roadway Reconstruction | 605789 | Boston Region | Boston | BOSTON- RECONSTRUCTION OF MELNEA CASS BOULEVARD | 6 | STP | $ 7,871,248 | $ 6,296,998 | $ 1,574,250 | Construction; STP+Earmark Total Cost = $25,315,588 ; MPO Evaluation Score = 59 | ||
| Roadway Reconstruction | 608347 | Boston Region | Beverly | BEVERLY- INTERSECTION IMPROVEMENTS @ 3 LOCATIONS: CABOT STREET (ROUTE 1A/97) @ DODGE STREET (ROUTE 1A), COUNTY WAY, LONGMEADOW ROAD & SCOTT STREET, MCKAY STREET @ BALCH STREET & VETERANS MEMORIAL BRIDGE (ROUTE 1A) AT RANTOUL, CABOT, WATER & FRONT STREETS | 4 | CMAQ | $ 1,520,271 | $ 1,216,217 | $ 304,054 | Construction; HSIP+CMAQ Total Cost = $4,394,886; MPO Evaluation Score = 63 | ||
| Roadway Reconstruction | 608347 | Boston Region | Beverly | BEVERLY- INTERSECTION IMPROVEMENTS @ 3 LOCATIONS: CABOT STREET (ROUTE 1A/97) @ DODGE STREET (ROUTE 1A), COUNTY WAY, LONGMEADOW ROAD & SCOTT STREET, MCKAY STREET @ BALCH STREET & VETERANS MEMORIAL BRIDGE (ROUTE 1A) AT RANTOUL, CABOT, WATER & FRONT STREETS | 4 | HSIP | $ 2,874,615 | $ 2,587,154 | $ 287,462 | Construction; HSIP+CMAQ Total Cost = $4,394,886; MPO Evaluation Score = 63 | ||
| Regionally Prioritized Projects subtotal ► | $ 97,131,688 | $ 78,477,126 | $ 18,654,562 | ◄ 80% Federal + 20% Non-Federal | ||||||||
| ►Section 1A / Fiscal Constraint Analysis | ||||||||||||
| Total Regional Federal Aid Funds Programmed ► | $ 97,131,688 | $ 98,794,261 | ◄Total Budget | $ 1,662,573 | Target Funds Available | |||||||
| Section 1A instructions: MPO Template Name) Choose Regional Name from dropdown list to populate header and MPO column; Column C) Enter ID from ProjectInfo; Column E) Choose Municipality Name from dropdown list; Column H) Choose the Funding Source being used for the project - if multiple funding sources are being used enter multiple lines; Column I) Enter the total amount of funds being programmed in this fiscal year and for each funding source; Column J) Federal funds autocalculates. Please verify the amount and only change if needed for flex. Column K) Non-federal funds autocalculates. Please verify the split/match - if matching an FTA flex, coordinate with Rail & Transit Division before programming; Column L) Enter Additional Information as described - please do not use any other format. | STP programmed ► | $ 49,928,499 | $ 17,395,279 | ◄ STP | ||||||||
| HSIP programmed ► | $ 7,717,758 | $ 6,945,982 | ◄ HSIP | |||||||||
| CMAQ programmed ► | $ 36,620,005 | $ 29,296,004 | ◄ CMAQ | |||||||||
| TAP programmed ► | $ 2,865,426 | $ 2,292,341 | ◄ TAP | |||||||||
| ►Section 1B / Earmark or Discretionary Grant Funded Projects | ||||||||||||
| ►Other Federal Aid | ||||||||||||
| Earmark Discretionary | 605789 | Boston Region | Boston | BOSTON- RECONSTRUCTION OF MELNEA CASS BOULEVARD | 6 | HPP | $ 5,007,375 | $ 4,005,900 | $ 1,001,475 | Construction; HPP 4284 (MA203); STP+Earmarks Total Cost = $25,315,588 | ||
| Earmark Discretionary | 605789 | Boston Region | Boston | BOSTON- RECONSTRUCTION OF MELNEA CASS BOULEVARD | 6 | HPP | $ 2,703,983 | $ 2,163,186 | $ 540,797 | Construction; HPP 756 (MA126); STP+Earmarks Total Cost = $25,315,588 | ||
| Earmark Discretionary | 605789 | Boston Region | Boston | BOSTON- RECONSTRUCTION OF MELNEA CASS BOULEVARD | 6 | HPP | $ 6,259,219 | $ 5,007,375 | $ 1,251,844 | Construction; (MA154); STP+Earmarks Total Cost = $25,315,588 | ||
| Earmark Discretionary | 605789 | Boston Region | Boston | BOSTON- RECONSTRUCTION OF MELNEA CASS BOULEVARD | 6 | HPP | $ 3,473,764 | $ 2,779,011 | $ 694,753 | Construction; (MA194); STP+Earmarks Total Cost = $25,315,588 | ||
| Earmark Discretionary | 607330 | Boston Region | Milton | MILTON- DECK RECONSTRUCTION OVER SE EXPRESSWAY (EAST MILTON SQUARE), INCLUDES PARKING & NEW LANDSCAPED AREA | 4 | HPP | $ 1,502,213 | $ 1,201,770 | $ 300,443 | Construction; (MA125) | ||
| Earmark Discretionary | 607330 | Boston Region | Milton | MILTON- DECK RECONSTRUCTION OVER SE EXPRESSWAY (EAST MILTON SQUARE), INCLUDES PARKING & NEW LANDSCAPED AREA | 4 | HPP | $ 1,251,844 | $ 1,001,475 | $ 250,369 | Construction; (MA134) | ||
| Earmark Discretionary | 606316 | Boston Region | Brookline | BROOKLINE- PEDESTRIAN BRIDGE REHABILITATION, B-27-016, OVER MBTA OFF CARLTON STREET | 6 | HPP | $ 751,106 | $ 600,885 | $ 150,221 | Demo ID: MA 149 Repurposed earmark, formerly design and construct signal crossing and other safety improvements to Emerald Necklace Greenway Bicycle Trail, Town of Brookline |
||
| Boston Region | Other Federal Aid | HPP | $ - | $ - | $ - | |||||||
| Other Federal Aid subtotal ► | $ 20,949,502 | $ 16,759,602 | $ 4,189,900 | ◄ Funding Split Varies by Funding Source | ||||||||
| ►Section 2A / State Prioritized Reliability Projects | ||||||||||||
| ►Bridge Program / Inspections | ||||||||||||
| Bridge Program | Boston Region | Bridge Inspection | $ - | $ - | $ - | |||||||
| Bridge Program / Inspections subtotal ► | $ - | $ - | $ - | ◄ Funding Split Varies by Funding Source | ||||||||
| ►Bridge Program / Off-System | ||||||||||||
| Bridge Program | 608079 | Boston Region | SHARON | SHARON- BRIDGE REPLACEMENT, S-09-003 (40N), MASKWONICUT STREET OVER AMTRAK/MBTA | 5 | STP-BR-OFF | $ 2,683,087 | $ 2,146,469 | $ 536,617 | |||
| Bridge Program | 608255 | Boston Region | STOW | STOW- BRIDGE REPLACEMENT, S-29-011, BOX MILL ROAD OVER ELIZABETH BROOK | 3 | STP-BR-OFF | $ 3,612,223 | $ 2,889,779 | $ 722,445 | |||
| Bridge Program / Off-System subtotal ► | $ 6,295,310 | $ 5,036,248 | $ 1,259,062 | ◄ 80% Federal + 20% Non-Federal | ||||||||
| ►Bridge Program / On-System (NHS) | ||||||||||||
| Bridge Program | 604952 | Boston Region | Multiple | LYNN- SAUGUS- BRIDGE REPLACEMENT, L-18-016=S-05-008, ROUTE 107 OVER THE SAUGUS RIVER (AKA - BELDEN G. BLY BRIDGE) | 4 | NHPP-On | $ 14,894,228 | $ 11,915,382 | $ 2,978,846 | AC Year 1 of 5, Total Cost $74,471,140 | ||
| Bridge Program | 604173 | Boston Region | BOSTON | BOSTON- BRIDGE REPLACEMENT, B-16-016, NORTH WASHINGTON STREET OVER THE BOSTON INNER HARBOR | 6 | NHPP-On | $ 25,184,931 | $ 20,147,945 | $ 5,036,986 | AC Year 3 of 6, Total Project Cost = $193,058,158. | ||
| Bridge Program | 605287 | Boston Region | CHELSEA | CHELSEA- ROUTE 1 VIADUCT REHABILITATION (SB/NB) ON C-09-007 & C-09-011 | 6 | NHPP-On | $ 71,677,130 | $ 57,341,704 | $ 14,335,426 | AC Year 2 of 4, Total Cost $213,972,689 | ||
| Bridge Program / On-System (NHS) subtotal ► | $ 111,756,289 | $ 89,405,031 | $ 22,351,258 | ◄ Funding Split Varies by Funding Source | ||||||||
| ►Bridge Program / On-System (Non-NHS) | ||||||||||||
| Bridge Program | Boston Region | Bridge Program / On-System (Non-NHS) | $ - | $ - | $ - | |||||||
| Bridge Program / On-System (Non-NHS) subtotal ► | $ - | $ - | $ - | ◄ 80% Federal + 20% Non-Federal | ||||||||
| ►Bridge Program / Systematic Maintenance | ||||||||||||
| Bridge Program | 608234 | Boston Region | RANDOLPH | RANDOLPH- BRIDGE PRESERVATION OF 2 BRIDGES: R-01-005 & R-01-007 | 6 | NHPP-On | $ 4,984,738 | $ 3,987,791 | $ 996,948 | |||
| Bridge Program / Systematic Maintenance subtotal ► | $ 4,984,738 | $ 3,987,791 | $ 996,948 | ◄ Funding Split Varies by Funding Source | ||||||||
| ►Interstate Pavement | ||||||||||||
| Interstate Pavement | 608219 | Boston Region | Multiple | READING- WAKEFIELD- RESURFACING AND RLATED WORK ON I-95 | 4 | NHPP | $ 4,123,392 | $ 3,711,053 | $ 412,339 | |||
| Insterstate Pavement subtotal ► | $ 4,123,392 | $ 3,711,053 | $ 412,339 | ◄ 90% Federal + 10% Non-Federal | ||||||||
| ►Non-Interstate Pavement | ||||||||||||
| Non-Interstate Pavement | 608468 | Boston Region | Multiple | PEABODY- DANVERS- RESURFACING AND RELATED WORK ON ROUTE 1 | 4 | NHPP | $ 11,628,900 | $ 9,303,120 | $ 2,325,780 | |||
| Non-Interstate Pavement | 608493 | Boston Region | Topsfield | TOPSFIELD- RESURFACING AND RELATED WORK ON ROUTE 1 | 4 | NHPP | $ 9,086,000 | $ 7,268,800 | $ 1,817,200 | |||
| Non-Interstate Pavement | 608587 | Boston Region | Dedham | DEDHAM- RESURFACING AND RELATED WORK ON ROUTE 109 | 6 | NHPP | $ 5,525,503 | $ 4,420,402 | $ 1,105,101 | |||
| Non-Interstate Pavement subtotal ► | $ 26,240,403 | $ 20,992,322 | $ 5,248,081 | ◄ 80% Federal + 20% Non-Federal | ||||||||
| ► Roadway Improvements | ||||||||||||
| Roadway Improvements | Boston Region | Roadway Improvements | $ - | $ - | $ - | |||||||
| Roadway Improvements | Boston Region | Roadway Improvements | $ - | $ - | $ - | |||||||
| Roadway Improvements | Boston Region | Roadway Improvements | $ - | $ - | $ - | |||||||
| Roadway Improvements subtotal ► | $ - | $ - | $ - | ◄ 80% Federal + 20% Non-Federal | ||||||||
| ► Safety Improvements | ||||||||||||
| Safety Improvements | 608206 | Boston Region | Multiple | CHELSEA TO DANVERS- GUIDE AND TRAFFIC SIGN REPLACEMENT ON A SECTION OF US ROUTE 1 | 4 | NHPP | $ 7,195,084 | $ 6,475,576 | $ 719,508 | |||
| Safety Improvements | 608205 | Boston Region | Multiple | READING TO LYNNFIELD- GUIDE AND TRAFFIC SIGN REPLACEMENT ON A SECTION OF I-95 (SR 128) | 4 | NHPP | $ 4,513,288 | $ 4,061,959 | $ 451,329 | |||
| Safety Improvements | 608608 | Boston Region | Braintree | BRAINTREE- HIGHWAY LIGHTING IMPROVEMENTS AT I-93/ROUTE 3 INTERCHANGE | 6 | NHPP | $ 7,008,503 | $ 6,307,653 | $ 700,850 | |||
| Safety Improvements subtotal ► | $ 18,716,875 | $ 16,845,188 | $ 1,871,688 | ◄ Funding Split Varies by Funding Source | ||||||||
| ►Section 2B / State Prioritized Modernization Projects | ||||||||||||
| ► ADA Retrofits | ||||||||||||
| ADA Retrofits | Boston Region | ADA Retrofits | $ - | $ - | $ - | |||||||
| ADA Retrofits | Boston Region | ADA Retrofits | $ - | $ - | $ - | |||||||
| ADA Retrofits subtotal ► | $ - | $ - | $ - | ◄ 80% Federal + 20% Non-Federal | ||||||||
| ►Intersection Improvements | ||||||||||||
| Intersection Improvements | 608755 | Boston Region | Boston | BOSTON- INTERSECTION IMPROVEMENTS AT MORTON STREET AND HARVARD STREET | 6 | HSIP | $ 1,500,000 | $ 1,350,000 | $ 150,000 | |||
| Intersection Improvements | 607249 | Boston Region | Sudbury | SUDBURY- INTERSECTION IMPROVEMENTS @ ROUTE 20 & LANDHAM ROAD | 3 | HSIP | $ 1,974,736 | $ 1,777,263 | $ 197,474 | |||
| Intersection Improvements subtotal ► | $ 3,474,736 | $ 3,127,263 | $ 347,474 | ◄ Funding Split Varies by Funding Source | ||||||||
| ►Intelligent Transportation Systems | ||||||||||||
| Intelligent Transportation Systems | Boston Region | Intelligent Transportation Systems | $ - | $ - | $ - | |||||||
| Intelligent Transportation Systems | Boston Region | Intelligent Transportation Systems | $ - | $ - | $ - | |||||||
| Intelligent Transportation Systems | Boston Region | Intelligent Transportation Systems | $ - | $ - | $ - | |||||||
| Intelligent Transportation System subtotal ► | $ - | $ - | $ - | ◄ 80% Federal + 20% Non-Federal | ||||||||
| ►Roadway Reconstruction | ||||||||||||
| Roadway Reconstruction | Boston Region | Roadway Reconstruction | $ - | $ - | $ - | |||||||
| Roadway Reconstruction | Boston Region | Roadway Reconstruction | $ - | $ - | $ - | |||||||
| Roadway Reconstruction | Boston Region | Roadway Reconstruction | $ - | $ - | $ - | |||||||
| Roadway Reconstruction | Boston Region | Roadway Reconstruction | $ - | $ - | $ - | |||||||
| Roadway Reconstruction subtotal ► | $ - | $ - | $ - | ◄ Funding Split Varies by Funding Source | ||||||||
| ►Section 2C / State Prioritized Expansion Projects | ||||||||||||
| ►Bicycles and Pedestrians | ||||||||||||
| Bicycles and Pedestrians | 606223 | Boston Region | Multiple | ACTON- CONCORD- BRUCE FREEMAN RAIL TRAIL CONSTRUCTION, INCLUDES REPLACING BRIDGE C-19-037, RAIL TRAIL OVER NASHOBA BROOK, NEW BRIDGE C-19-039, RAIL TRAIL OVER ROUTE 2 & NEW CULVERT C-19-040, ROUTE 2 OVER WILDLIFE CROSSING (PHASE II-B) | 4 | CMAQ | $ 9,196,638 | $ 7,357,311 | $ 1,839,328 | Construction / PSAC score 31.5 | ||
| Bicycles and Pedestrians | 606316 | Boston Region | BROOKLINE | BROOKLINE- PEDESTRIAN BRIDGE REHABILITATION, B-27-016, OVER MBTA OFF CARLTON STREET | 6 | CMAQ | $ 2,939,404 | $ 2,351,523 | $ 587,881 | Construction / Total Project Cost $ $3,690,510 w/ additional funding from earmark at $751,106 |
||
| Bicycles and Pedestrians | Boston Region | Bicycles and Pedestrians | $ - | $ - | $ - | |||||||
| Bicycles and Pedestrians subtotal ► | $ 12,136,042 | $ 9,708,834 | $ 2,427,208 | ◄ 80% Federal + 20% Non-Federal | ||||||||
| ►Capacity | ||||||||||||
| Capacity | Boston Region | Capacity | $ - | $ - | $ - | |||||||
| Capacity | Boston Region | Capacity | $ - | $ - | $ - | |||||||
| Capacity subtotal ► | $ - | $ - | $ - | ◄ Funding Split Varies by Funding Source | ||||||||
| ►Section 3 / Planning / Adjustments / Pass-throughs | ||||||||||||
| ►Planning / Adjustments / Pass-throughs | ||||||||||||
| Planning/Adjustments/Pass-throughs | BN0008 | Boston Region | Newburyport | Parker River National Wildlife Refuge - Replace Hellcat Trail Boardwalk | 4 | Other FA | $ 1,200,000 | $ 960,000 | $ 240,000 | |||
| Boston Region | ABP GANS Repayment | Multiple | $ - | $ - | $ - | |||||||
| Boston Region | ABP GANS Repayment | Multiple | $ - | $ - | $ - | |||||||
| Boston Region | Award adjustments, change orders, etc. | Multiple | $ - | $ - | $ - | |||||||
| Boston Region | Award adjustments, change orders, etc. | Multiple | $ - | $ - | $ - | |||||||
| Boston Region | Award adjustments, change orders, etc. | Multiple | $ - | $ - | $ - | |||||||
| Boston Region | Metropolitan Planning | Multiple | $ - | $ - | $ - | |||||||
| Boston Region | Metropolitan Planning | Multiple | $ - | $ - | $ - | |||||||
| Boston Region | State Planning and Research Work Program I, (SPR I), Planning | Multiple | $ - | $ - | $ - | |||||||
| Boston Region | State Planning and Research Work Program II, (SPR II), Research | Multiple | $ - | $ - | $ - | |||||||
| Boston Region | Railroad Crossings | Multiple | $ - | $ - | $ - | |||||||
| Boston Region | Railroad Crossings | Multiple | $ - | $ - | $ - | |||||||
| Boston Region | Recreational Trails | Multiple | $ - | $ - | $ - | |||||||
| Other Statewide Items subtotal ► | $ 1,200,000 | $ 960,000 | $ 240,000 | ◄ Funding Split Varies by Funding Source | ||||||||
| ►Section 4 / Non-Federally Aided Projects | ||||||||||||
| ►Non-Federally Aided Projects | ||||||||||||
| Non Federal Aid | Boston Region | Non-Federal Aid | $ - | $ - | ||||||||
| Non-Federally Aided Projects | Boston Region | Non-Federal Aid | $ - | $ - | ||||||||
| Non-Federal Aid subtotal► | $ - | $ - | ◄100% Non-Federal | |||||||||
| 2019 Summary | TIP Section 1 - 3: ▼ | TIP Section 4: ▼ | Total of All Projects ▼ | |||||||||
| Total ► | $ 307,008,976 | $ - | $ 307,008,976 | ◄ Total Spending in Region | ||||||||
| Federal Funds ► | $ 249,010,457 | $ 249,010,457 | ◄ Total Federal Spending in Region | |||||||||
| Non-Federal Funds ► | $ 57,998,519 | $ - | $ 57,998,519 | ◄ Total Non-Federal Spending in Region | ||||||||
| 701 CMR 7.00 Use of Road Flaggers and Police Details on Public Works Projects / 701 CMR 7.00 (the Regulation) was promulgated and became law on October 3, 2008. Under this Regulation, the CMR is applicable to any Public works Project that is performed within the limits of, or that impact traffic on, any Public Road. The Municipal Limitation referenced in this Regulation is applicable only to projects where the Municipality is the Awarding Authority. For all projects contained in the TIP, the Commonwealth is the Awarding Authority. Therefore, all projects must be considered and implemented in accordance with 701 CMR 7.00, and the Road Flagger and Police Detail Guidelines. By placing a project on the TIP, the Municipality acknowledges that 701 CMR 7.00 is applicable to its project and design and construction will be fully compliant with this Regulation. This information, and additional information relative to guidance and implementation of the Regulation can be found at the following link on the MassDOT Highway Division website: http://www.massdot.state.ma.us/Highway/flaggers/main.aspx | ||||||||||||
| Transportation Improvement Program (TIP) | ||||||||||
| Project List (FY2019) | ||||||||||
| FTA Program | Project Number | Transit Agency | FTA Activity Line Item | Project Description | Carryover (unobligated) | Federal Funds | State Funds | TDC | Local Funds | Total Cost |
| 5307 | ||||||||||
| 5307 | RTD0006599 | Cape Ann Transportation Authority | 117A00 | PREVENTIVE MAINTENANCE | $285,000 | $0 | $0 | $71,250 | $356,250 | |
| 5307 | RTD0006600 | Cape Ann Transportation Authority | 114206 | ACQUIRE - SHOP EQ/COMPUTER/SFTWR | $55,000 | $13,750 | $0 | $0 | $68,750 | |
| 5307 | RTD0007086 | MetroWest Regional Transit Authority | 117C00 | NON FIXED ROUTE ADA PARA SERV | $1,300,000 | $325,000 | $0 | $0 | $1,625,000 | |
| 5307 | RTD0007087 | MetroWest Regional Transit Authority | 114200 | ACQUISITION OF BUS SUPPORT EQUIP/FACILITIES | $248,415 | $62,104 | $0 | $0 | $310,519 | |
| 5307 | RTD0007088 | MetroWest Regional Transit Authority | 440000 | Mobility Management | $25,000 | $6,250 | $0 | $0 | $31,250 | |
| 5307 | RTD0003639 | MetroWest Regional Transit Authority | 113403 | TERMINAL, INTERMODAL (TRANSIT) - BLANDIN - Front Entrance | $150,000 | $37,500 | $0 | $0 | $187,500 | |
| 5307 | RTD0007057 | Massachusetts Bay Transportation Authority (MBTA) | 121200 | Revenue Vehicle Program - 5307 | $57,969,489 | $0 | $0 | $14,492,372 | $72,461,861 | |
| 5307 | RTD0007058 | Massachusetts Bay Transportation Authority (MBTA) | 123400 | Stations and Facilities Program - 5307 | $18,827,713 | $0 | $0 | $4,706,928 | $23,534,641 | |
| 5307 | RTD0007366 | Massachusetts Bay Transportation Authority (MBTA) | 123402 | Elevator and Escalator Program - 5307 | $2,644,350 | $0 | $0 | $661,087 | $3,305,437 | |
| 5307 | RTD0007367 | Massachusetts Bay Transportation Authority (MBTA) | 126301 | Signals/Systems Upgrade Program - 5307 | $64,280,000 | $0 | $0 | $16,070,000 | $80,350,000 | |
| Subtotal | $145,784,967 | $444,604 | $0 | $36,001,637 | $182,231,208 | |||||
| 5309 | ||||||||||
| 5309 | RTD0007082 | Massachusetts Bay Transportation Authority (MBTA) | 132303 | Green Line Extension Project | $150,000,000 | $0 | $0 | $150,000,000 | $300,000,000 | |
| Subtotal | $150,000,000 | $0 | $0 | $150,000,000 | $300,000,000 | |||||
| 5310 | ||||||||||
| Subtotal | $0 | $0 | $0 | $0 | $0 | |||||
| 5311 | ||||||||||
| Subtotal | $0 | $0 | $0 | $0 | $0 | |||||
| 5337 | ||||||||||
| 5337 | RTD0007059 | Massachusetts Bay Transportation Authority (MBTA) | 123400 | Stations and Facilities Program - 5337 | $8,571,579 | $0 | $0 | $2,142,895 | $10,714,474 | |
| 5337 | RTD0007060 | Massachusetts Bay Transportation Authority (MBTA) | 124400 | Signal/Systems Upgrades Program - 5337 | $36,966,421 | $0 | $0 | $9,241,605 | $46,208,026 | |
| 5337 | RTD0007368 | Massachusetts Bay Transportation Authority (MBTA) | 122405 | Bridge and Tunnel Program - 5337 | $97,885,318 | $0 | $0 | $24,471,329 | $122,356,647 | |
| Subtotal | $143,423,318 | $0 | $0 | $35,855,829 | $179,279,147 | |||||
| 5339 | ||||||||||
| 5339 | RTD0007061 | Massachusetts Bay Transportation Authority (MBTA) | 111400 | Bus Program - 5339 | $5,562,970 | $0 | $0 | $1,390,743 | $6,953,713 | |
| Subtotal | $5,562,970 | $0 | $0 | $1,390,743 | $6,953,713 | |||||
| 5320 | ||||||||||
| Subtotal | $0 | $0 | $0 | $0 | $0 | |||||
| Other Federal | ||||||||||
| Subtotal | $0 | $0 | $0 | $0 | $0 | |||||
| Other Non-Federal | ||||||||||
| Other Non-Federal | RTD0007348 | Cape Ann Transportation Authority | 111202 | BUY REPLACEMENT 35-FT BUS (2) | $0 | $900,000 | $0 | $0 | $900,000 | |
| Other Non-Federal | RTD0007151 | MetroWest Regional Transit Authority | 111215 | BUY REPLACEMENT- CAPITOL BUS | $0 | $120,000 | $0 | $0 | $120,000 | |
| Subtotal | $0 | $1,020,000 | $0 | $0 | $1,020,000 | |||||
| Total | $444,771,255 | $1,464,604 | $0 | $223,248,209 | $669,484,068 | |||||
| Funds listed under the Carry Over column are included in the Federal Amount | ||||||||||
| 2020 | Boston Region Transportation Improvement Program | |||||||||||
| Amendment / Adjustment Type ▼ |
STIP Program ▼ | MassDOT Project ID ▼ | Metropolitan Planning Organization ▼ | Municipality Name ▼ | MassDOT Project Description▼ | MassDOT District ▼ | Funding Source ▼ | Total Programmed Funds ▼ | Federal Funds ▼ | Non-Federal Funds ▼ | Additional Information ▼ Present information as follows, if applicable: a) Planning / Design / or Construction; b) total project cost and funding sources used; c) advance construction status; d) MPO project score; e) name of entity receiving a transfer; f) name of entity paying the non-state non-federal match; g) earmark details; h) TAP project proponent; i) other information | |
| ►Section 1A / Regionally Prioritized Projects | ||||||||||||
| ►Regionally Prioritized Projects | ||||||||||||
| Planning / Adjustments / Pass-throughs | 1570 | Boston Region | Multiple | GREEN LINE EXTENSION PROJECT- EXTENSION TO COLLEGE AVENUE WITH THE UNION SQUARE SPUR | 6 | CMAQ | $ 20,031,200 | $ 16,024,960 | $ 4,006,240 | Construction; STP+CMAQ+Section 5309 (Transit) Total MPO Contribution = $190,000,000; AC Yr 5 of 6; funding flexed to FTA; match provided by local contributions | ||
| Roadway Reconstruction | 606635 | Boston Region | Multiple | NEEDHAM-NEWTON- RECONSTRUCTION OF HIGHLAND AVENUE, NEEDHAM STREET & CHARLES RIVER BRIDGE, N-04-002, FROM WEBSTER STREET (NEEDHAM) TO REOUT 9 (NEWTON) | 6 | HSIP | $ 3,044,110 | $ 2,739,699 | $ 304,411 | Construction; CMAQ+HSIP+TAP+STP Total Cost = $26,883,332; AC Yr 2 of 2; MPO Evaluation Score = 75 | ||
| Roadway Reconstruction | 606635 | Boston Region | Multiple | NEEDHAM-NEWTON- RECONSTRUCTION OF HIGHLAND AVENUE, NEEDHAM STREET & CHARLES RIVER BRIDGE, N-04-002, FROM WEBSTER STREET (NEEDHAM) TO REOUT 9 (NEWTON) | 6 | STP | $ 10,397,556 | $ 8,318,045 | $ 2,079,511 | Construction; CMAQ+HSIP+TAP+STP Total Cost = $26,883,332; AC Yr 2 of 2; MPO Evaluation Score = 75 | ||
| Roadway Reconstruction | 606043 | Boston Region | Hopkinton | HOPKINTON- SIGNAL & INTERSECTION IMPROVEMENTS ON ROUTE 135 | 3 | CMAQ | $ 2,365,425 | $ 1,892,340 | $ 473,085 | Construction; CMAQ+STP Total Cost = $8,264,619 | ||
| Roadway Reconstruction | 606043 | Boston Region | Hopkinton | HOPKINTON- SIGNAL & INTERSECTION IMPROVEMENTS ON ROUTE 135 | 3 | STP | $ 5,899,194 | $ 4,719,355 | $ 1,179,839 | Construction; CMAQ+STP Total Cost = $8,264,619 | ||
| Roadway Reconstruction | 607652 | Boston Region | Everett | EVERETT- RECONSTRUCTION OF FERRY STREET, SOUTH FERRY STREET AND A PORTION OF ELM STREET | 4 | CMAQ | $ 1,884,270 | $ 1,507,416 | $ 376,854 | Cosntruction; CMAQ+STP+HSIP+TAP Total Cost = $16,764,338; MPO Evaluation Score = 73 | ||
| Roadway Reconstruction | 607652 | Boston Region | Everett | EVERETT- RECONSTRUCTION OF FERRY STREET, SOUTH FERRY STREET AND A PORTION OF ELM STREET | 4 | HSIP | $ 1,050,296 | $ 945,266 | $ 105,030 | Cosntruction; CMAQ+STP+HSIP+TAP Total Cost = $16,764,338; MPO Evaluation Score = 73 | ||
| Roadway Reconstruction | 607652 | Boston Region | Everett | EVERETT- RECONSTRUCTION OF FERRY STREET, SOUTH FERRY STREET AND A PORTION OF ELM STREET | 4 | STP | $ 13,105,360 | $ 10,484,288 | $ 2,621,072 | Cosntruction; CMAQ+STP+HSIP+TAP Total Cost = $16,764,338; MPO Evaluation Score = 73 | ||
| Roadway Reconstruction | 607652 | Boston Region | Everett | EVERETT- RECONSTRUCTION OF FERRY STREET, SOUTH FERRY STREET AND A PORTION OF ELM STREET | 4 | TAP | $ 724,412 | $ 579,530 | $ 144,882 | Cosntruction; CMAQ+STP+HSIP+TAP Total Cost = $16,764,338; MPO Evaluation Score = 73; TAP Proponent = Everett | ||
| Roadway Reconstruction | 602077 | Boston Region | Lynn | LYNN- RECONSTRUCTION ON ROUTE 129 (LYNNFIELD STREET), FROM GREAT WOODS ROAD TO WYOMA SQUARE | 4 | CMAQ | $ 1,000,000 | $ 800,000 | $ 200,000 | Construction; CMAQ+STP Total Cost = $4,579,576; MPO Evaluation Score = 38 | ||
| Roadway Reconstruction | 602077 | Boston Region | Lynn | LYNN- RECONSTRUCTION ON ROUTE 129 (LYNNFIELD STREET), FROM GREAT WOODS ROAD TO WYOMA SQUARE | 4 | STP | $ 3,579,576 | $ 2,863,661 | $ 715,915 | Construction; CMAQ+STP Total Cost = $4,579,576; MPO Evaluation Score = 38 | ||
| Roadway Reconstruction | 606226 | Boston Region | Boston | BOSTON- RECONSTRUCTION OF RUTHERFORD AVENUE, FROM CITY SQUARE TO SULLIVAN SQUARE | 6 | STP | $ 7,000,000 | $ 5,600,000 | $ 1,400,000 | Construction; NHPP+STP+TAP Total Cost = $152,000,000; AC Yr 1 of 5; Total funding in this TIP = $116,626,515; MPO Evaluation Score = 59 | ||
| Roadway Reconstruction | 604123 | Boston Region | Ashland | ASHLAND- RECONSTRUCTION ON ROUTE 126 (POND STREET), FROM THE FRAMINGHAM T.L. TO THE HOLLISTON T.L. | 3 | CMAQ | $ 1,000,000 | $ 800,000 | $ 200,000 | Construction; STP+CMAQ+TAP Total Cost = $14,094,251; MPO Evaluation Score = 54 | ||
| Roadway Reconstruction | 604123 | Boston Region | Ashland | ASHLAND- RECONSTRUCTION ON ROUTE 126 (POND STREET), FROM THE FRAMINGHAM T.L. TO THE HOLLISTON T.L. | 3 | STP | $ 10,987,770 | $ 8,790,216 | $ 2,197,554 | Construction; STP+CMAQ+TAP Total Cost = $14,094,251; MPO Evaluation Score = 54 | ||
| Roadway Reconstruction | 604123 | Boston Region | Ashland | ASHLAND- RECONSTRUCTION ON ROUTE 126 (POND STREET), FROM THE FRAMINGHAM T.L. TO THE HOLLISTON T.L. | 3 | TAP | $ 2,106,481 | $ 1,685,185 | $ 421,296 | Construction; STP+CMAQ+TAP Total Cost = $14,094,251; MPO Evaluation Score = 54; TAP Proponent = MassDOT | ||
| Roadway Reconstruction | 602261 | Boston Region | Walpole | WALPOLE- RECONSTRUCTION ON ROUTE 1A (MAIN STREET), FROM THE NORWOOD T.L. TO ROUTE 27, INCLUDES W-03-024 OVER THE NEPONSET RIVER | 5 | CMAQ | $ 1,000,000 | $ 800,000 | $ 200,000 | Construction; STP+CMAQ+TAP Total Cost = $16,749,233; MPO Evaluation Score = 51 | ||
| Roadway Reconstruction | 602261 | Boston Region | Walpole | WALPOLE- RECONSTRUCTION ON ROUTE 1A (MAIN STREET), FROM THE NORWOOD T.L. TO ROUTE 27, INCLUDES W-03-024 OVER THE NEPONSET RIVER | 5 | STP | $ 13,890,796 | $ 11,112,637 | $ 2,778,159 | Construction; STP+CMAQ+TAP Total Cost = $16,749,233; MPO Evaluation Score = 51 | ||
| Roadway Reconstruction | 602261 | Boston Region | Walpole | WALPOLE- RECONSTRUCTION ON ROUTE 1A (MAIN STREET), FROM THE NORWOOD T.L. TO ROUTE 27, INCLUDES W-03-024 OVER THE NEPONSET RIVER | 5 | TAP | $ 1,858,437 | $ 1,486,750 | $ 371,687 | Construction; STP+CMAQ+TAP Total Cost = $16,749,233; MPO Evaluation Score = 51; TAP Proponent = MassDOT | ||
| Roadway Reconstruction | 608275 | Boston Region | Malden | MALDEN - EXHANGE STREET DOWNTOWN IMPROVEMENT PROJECT | 4 | CMAQ | $ 1,000,000 | $ 800,000 | $ 200,000 | Construction; CMAQ+STP Total Cost = $1,553,760; MPO Evaluation Score = 59 | ||
| Roadway Reconstruction | 608275 | Boston Region | Malden | MALDEN - EXHANGE STREET DOWNTOWN IMPROVEMENT PROJECT | 4 | STP | $ 553,760 | $ 443,008 | $ 110,752 | Construction; CMAQ+STP Total Cost = $1,553,760; MPO Evaluation Score = 59 | ||
| Regionally Prioritized Projects subtotal ► | $ 102,478,643 | $ 82,392,355 | $ 20,086,288 | ◄ 80% Federal + 20% Non-Federal | ||||||||
| ►Section 1A / Fiscal Constraint Analysis | ||||||||||||
| Total Regional Federal Aid Funds Programmed ► | $ 102,478,643 | $ 102,478,656 | ◄Total Budget | $ 13 | Target Funds Available | |||||||
| Section 1A instructions: MPO Template Name) Choose Regional Name from dropdown list to populate header and MPO column; Column C) Enter ID from ProjectInfo; Column E) Choose Municipality Name from dropdown list; Column H) Choose the Funding Source being used for the project - if multiple funding sources are being used enter multiple lines; Column I) Enter the total amount of funds being programmed in this fiscal year and for each funding source; Column J) Federal funds autocalculates. Please verify the amount and only change if needed for flex. Column K) Non-federal funds autocalculates. Please verify the split/match - if matching an FTA flex, coordinate with Rail & Transit Division before programming; Column L) Enter Additional Information as described - please do not use any other format. | STP programmed ► | $ 65,414,012 | $ 52,331,210 | ◄ STP | ||||||||
| HSIP programmed ► | $ 4,094,406 | $ 3,684,965 | ◄ HSIP | |||||||||
| CMAQ programmed ► | $ 28,280,895 | $ 22,624,716 | ◄ CMAQ | |||||||||
| TAP programmed ► | $ 4,689,330 | $ 3,751,464 | ◄ TAP | |||||||||
| ►Section 1B / Earmark or Discretionary Grant Funded Projects | ||||||||||||
| ►Other Federal Aid | ||||||||||||
| Boston Region | Other Federal Aid | HPP | $ - | $ - | $ - | |||||||
| Boston Region | Other Federal Aid | HPP | $ - | $ - | $ - | |||||||
| Other Federal Aid subtotal ► | $ - | $ - | $ - | ◄ Funding Split Varies by Funding Source | ||||||||
| ►Section 2A / State Prioritized Reliability Projects | ||||||||||||
| ►Bridge Program / Inspections | ||||||||||||
| Bridge Program | Boston Region | Bridge Inspection | $ - | $ - | $ - | |||||||
| Bridge Program / Inspections subtotal ► | $ - | $ - | $ - | ◄ Funding Split Varies by Funding Source | ||||||||
| ►Bridge Program / Off-System | ||||||||||||
| Bridge Program | Boston Region | Bridge Program / Off-System | $ - | $ - | $ - | |||||||
| Bridge Program / Off-System subtotal ► | $ - | $ - | $ - | ◄ 80% Federal + 20% Non-Federal | ||||||||
| ►Bridge Program / On-System (NHS) | ||||||||||||
| Bridge Program | 605342 | Boston Region | STOW | STOW- BRIDGE REPLACEMENT, S-29-001, (ST 62) GLEASONDALE ROAD OVER THE ASSABET RIVER | 3 | NHPP-On | $ 6,706,556 | $ 5,365,245 | $ 1,341,311 | |||
| Bridge Program | 604173 | Boston Region | BOSTON | BOSTON- BRIDGE REPLACEMENT, B-16-016, NORTH WASHINGTON STREET OVER THE BOSTON INNER HARBOR | 6 | NHPP-On | $ 24,184,931 | $ 19,347,945 | $ 4,836,986 | AC Year 4 of 6, Total Project Cost = $193,058,158. | ||
| Bridge Program | 605287 | Boston Region | CHELSEA | CHELSEA- ROUTE 1 VIADUCT REHABILITATION (SB/NB) ON C-09-007 & C-09-011 | 6 | NHPP-On | $ 40,952,933 | $ 32,762,346 | $ 8,190,587 | AC Year 3 of 4, Total Cost $213,972,689 | ||
| Bridge Program | 604952 | Boston Region | Multiple | LYNN- SAUGUS- BRIDGE REPLACEMENT, L-18-016=S-05-008, ROUTE 107 OVER THE SAUGUS RIVER (AKA - BELDEN G. BLY BRIDGE) | 4 | NHPP-On | $ 14,894,228 | $ 11,915,382 | $ 2,978,846 | AC Year 2 of 5, Total Cost $74,471,140 | ||
| Bridge Program / On-System (NHS) subtotal ► | $ 86,738,648 | $ 69,390,919 | $ 17,347,730 | ◄ Funding Split Varies by Funding Source | ||||||||
| ►Bridge Program / On-System (Non-NHS) | ||||||||||||
| Bridge Program | Boston Region | NHPP-Off | $ - | $ - | ||||||||
| Bridge Program / On-System (Non-NHS) subtotal ► | $ - | $ - | $ - | ◄ 80% Federal + 20% Non-Federal | ||||||||
| ►Bridge Program / Systematic Maintenance | ||||||||||||
| Bridge Program | Boston Region | Bridge Program / Systematic Maintenance | $ - | $ - | $ - | |||||||
| Bridge Program / Systematic Maintenance subtotal ► | $ - | $ - | $ - | ◄ Funding Split Varies by Funding Source | ||||||||
| ►Interstate Pavement | ||||||||||||
| Interstate Pavement | 608208 | Boston Region | Multiple | QUINCY- MILTON- BOSTON INTERSTATE MAINTENANCE AND RELATED WORK ON I-93 | 6 | NHPP | $ 24,264,576 | $ 21,838,118 | $ 2,426,458 | |||
| Insterstate Pavement subtotal ► | $ 24,264,576 | $ 21,838,118 | $ 2,426,458 | ◄ 90% Federal + 10% Non-Federal | ||||||||
| ►Non-Interstate Pavement | ||||||||||||
| Non-Interstate Pavement | 609101 | Boston Region | Peabody | PEABODY- PAVEMENT PRESERVATION AND RELATED WORK ON ROUTE 128 | 4 | NHPP | $ 4,712,448 | $ 3,769,958 | $ 942,490 | |||
| Non-Interstate Pavement | 608480 | Boston Region | Multiple | FOXBOROUGH- WALPOLE- RESURFACING AND RELATED WORK ON US ROUTE 1 | 5 | NHPP | $ 8,036,933 | $ 6,429,546 | $ 1,607,387 | |||
| Non-Interstate Pavement | 608482 | Boston Region | Multiple | CAMBRIDGE- SOMERVILLE- RESURFACING AND RELATED WORK ON ROUTE 28 | 6 | NHPP | $ 8,541,312 | $ 6,833,050 | $ 1,708,262 | |||
| Non-Interstate Pavement | 608467 | Boston Region | Marlborough | MARLBOROUGH- RESURFACING AND RELATED WORK ON ROUTE 20 | 3 | NHPP | $ 14,358,240 | $ 11,486,592 | $ 2,871,648 | |||
| Non-Interstate Pavement | 608484 | Boston Region | Multiple | CANTON- MILTON- RESURFACING AND RELATED WORK ON ROUTE 138 | 6 | NHPP | $ 17,941,664 | $ 14,353,331 | $ 3,588,333 | |||
| Non-Interstate Pavement subtotal ► | $ 53,590,597 | $ 42,872,478 | $ 10,718,119 | ◄ 80% Federal + 20% Non-Federal | ||||||||
| ► Roadway Improvements | ||||||||||||
| Roadway Improvements | Boston Region | Roadway Improvements | $ - | $ - | $ - | |||||||
| Roadway Improvements | Boston Region | Roadway Improvements | $ - | $ - | $ - | |||||||
| Roadway Improvements | Boston Region | Roadway Improvements | $ - | $ - | $ - | |||||||
| Roadway Improvements subtotal ► | $ - | $ - | $ - | ◄ 80% Federal + 20% Non-Federal | ||||||||
| ► Safety Improvements | ||||||||||||
| Safety Improvements | 608608 | Boston Region | Braintree | BRAINTREE- HIGHWAY LIGHTING IMPROVEMENTS AT I-93/ROUTE 3 INTERCHANGE | 6 | NHPP | $ 2,688,726 | $ 2,419,853 | $ 268,873 | |||
| Safety Improvements | 608611 | Boston Region | Multiple | CANTON- MILTON- RANDOLPH- REPLACEMENT AND REHABILITATION OF THE HIGHWAY LIGHTING SYSTEM AT THE ROUTE 24/ROUTE 1/I-93 INTERCHANGE | 6 | NHPP | $ 9,434,070 | $ 8,490,663 | $ 943,407 | |||
| Safety Improvements | Boston Region | NHPP | ||||||||||
| Safety Improvements subtotal ► | $ 12,122,796 | $ 10,910,516 | $ 1,212,280 | ◄ Funding Split Varies by Funding Source | ||||||||
| ►Section 2B / State Prioritized Modernization Projects | ||||||||||||
| ► ADA Retrofits | ||||||||||||
| ADA Retrofits | Boston Region | ADA Retrofits | $ - | $ - | $ - | |||||||
| ADA Retrofits | Boston Region | ADA Retrofits | $ - | $ - | $ - | |||||||
| ADA Retrofits subtotal ► | $ - | $ - | $ - | ◄ 80% Federal + 20% Non-Federal | ||||||||
| ►Intersection Improvements | ||||||||||||
| Intersection Improvements | 608562 | Boston Region | Somerville | SOMERVILLE- SIGNAL AND INTERSECTION IMPROVEMENT ON I-93 AT MYSTIC AVENUE AND MCGRATH HIGHWAY (TOP 200 CRASH LOCATION) | 4 | HSIP | $ 5,000,000 | $ 4,500,000 | $ 500,000 | |||
| Intersection Improvements | 607342 | Boston Region | Milton | MILTON- INTERSECTION & SIGNAL IMPROVEMENTS @ ROUTE 28 (RANDOLPH AVENUE) & CHICKATAWBUT ROAD | 6 | HSIP | $ 1,531,200 | $ 1,378,080 | $ 153,120 | |||
| Intersection Improvements | 607759 | Boston Region | Boston | BOSTON- INTERSECTION & SIGNAL IMPROVEMENTS AT THE VFW PARKWAY & SPRING STREET | 6 | HSIP | $ 974,815 | $ 877,334 | $ 97,482 | |||
| Intersection Improvements | Boston Region | HSIP | ||||||||||
| Intersection Improvements | Boston Region | HSIP | ||||||||||
| Intersection Improvements subtotal ► | $ 7,506,015 | $ 6,755,414 | $ 750,602 | ◄ Funding Split Varies by Funding Source | ||||||||
| ►Intelligent Transportation Systems | ||||||||||||
| Intelligent Transportation Systems | Boston Region | Intelligent Transportation Systems | $ - | $ - | $ - | |||||||
| Intelligent Transportation Systems | Boston Region | Intelligent Transportation Systems | $ - | $ - | $ - | |||||||
| Intelligent Transportation Systems | Boston Region | Intelligent Transportation Systems | $ - | $ - | $ - | |||||||
| Intelligent Transportation System subtotal ► | $ - | $ - | $ - | ◄ 80% Federal + 20% Non-Federal | ||||||||
| ►Roadway Reconstruction | ||||||||||||
| Roadway Reconstruction | 608835 | Boston Region | Medford | MEDFORD- IMPROVEMENTS AT BROOKS ELEMENTARY SCHOOL (SRTS) | 4 | TAP | $ 1,200,000 | $ 960,000 | $ 240,000 | |||
| Roadway Reconstruction | 608743 | Boston Region | Salem | SALEM- IMPROVEMENTS AT BATES ELEMENTARY SCHOOL (SRTS) | 4 | TAP | $ 937,500 | $ 750,000 | $ 187,500 | |||
| Roadway Reconstruction | 608791 | Boston Region | Winchester | WINCHESTER- IMPROVEMENTS AT VINSON-OWEN ELEMENTARY SCHOOL (SRTS) | 4 | TAP | $ 1,666,200 | $ 1,332,960 | $ 333,240 | |||
| Roadway Reconstruction subtotal ► | $ 3,803,700 | $ 3,042,960 | $ 760,740 | ◄ Funding Split Varies by Funding Source | ||||||||
| ►Section 2C / State Prioritized Expansion Projects | ||||||||||||
| ►Bicycles and Pedestrians | ||||||||||||
| Bicycles and Pedestrians | 607888 | Boston Region | Multiple | BOSTON- BROOKLINE- MULTI-USE PATH CONSTRUCTION ON NEW FENWAY | 6 | CMAQ | $ 1,770,722 | $ 1,416,578 | $ 354,144 | Construction / PSAC score 41 | ||
| Bicycles and Pedestrians subtotal ► | $ 1,770,722 | $ 1,416,578 | $ 354,144 | ◄ 80% Federal + 20% Non-Federal | ||||||||
| ►Capacity | ||||||||||||
| Capacity | Boston Region | Capacity | $ - | $ - | $ - | |||||||
| Capacity | Boston Region | Capacity | $ - | $ - | $ - | |||||||
| Capacity subtotal ► | $ - | $ - | $ - | ◄ Funding Split Varies by Funding Source | ||||||||
| ►Section 3 / Planning / Adjustments / Pass-throughs | ||||||||||||
| ►Planning / Adjustments / Pass-throughs | ||||||||||||
| Boston Region | ABP GANS Repayment | Multiple | $ - | $ - | $ - | |||||||
| Boston Region | ABP GANS Repayment | Multiple | $ - | $ - | $ - | |||||||
| Boston Region | Award adjustments, change orders, etc. | Multiple | $ - | $ - | $ - | |||||||
| Boston Region | Award adjustments, change orders, etc. | Multiple | $ - | $ - | $ - | |||||||
| Boston Region | Award adjustments, change orders, etc. | Multiple | $ - | $ - | $ - | |||||||
| Boston Region | Award adjustments, change orders, etc. | Multiple | $ - | $ - | $ - | |||||||
| Boston Region | Metropolitan Planning | Multiple | $ - | $ - | $ - | |||||||
| Boston Region | Metropolitan Planning | Multiple | $ - | $ - | $ - | |||||||
| Boston Region | State Planning and Research Work Program I, (SPR I), Planning | Multiple | $ - | $ - | $ - | |||||||
| Boston Region | State Planning and Research Work Program II, (SPR II), Research | Multiple | $ - | $ - | $ - | |||||||
| Boston Region | Railroad Crossings | Multiple | $ - | $ - | $ - | |||||||
| Boston Region | Railroad Crossings | Multiple | $ - | $ - | $ - | |||||||
| Boston Region | Recreational Trails | Multiple | $ - | $ - | $ - | |||||||
| Other Statewide Items subtotal ► | $ - | $ - | $ - | ◄ Funding Split Varies by Funding Source | ||||||||
| ►Section 4 / Non-Federally Aided Projects | ||||||||||||
| ►Non-Federally Aided Projects | ||||||||||||
| Non Federal Aid | Boston Region | Non-Federal Aid | $ - | $ - | ||||||||
| Non-Federally Aided Projects | Boston Region | Non-Federal Aid | $ - | $ - | ||||||||
| Non-Federal Aid subtotal► | $ - | $ - | ◄100% Non-Federal | |||||||||
| 2020 Summary | TIP Section 1 - 3: ▼ | TIP Section 4: ▼ | Total of All Projects ▼ | |||||||||
| Total ► | $ 292,275,698 | $ - | $ 292,275,698 | ◄ Total Spending in Region | ||||||||
| Federal Funds ► | $ 238,619,337 | $ 238,619,337 | ◄ Total Federal Spending in Region | |||||||||
| Non-Federal Funds ► | $ 53,656,360 | $ - | $ 53,656,360 | ◄ Total Non-Federal Spending in Region | ||||||||
| 701 CMR 7.00 Use of Road Flaggers and Police Details on Public Works Projects / 701 CMR 7.00 (the Regulation) was promulgated and became law on October 3, 2008. Under this Regulation, the CMR is applicable to any Public works Project that is performed within the limits of, or that impact traffic on, any Public Road. The Municipal Limitation referenced in this Regulation is applicable only to projects where the Municipality is the Awarding Authority. For all projects contained in the TIP, the Commonwealth is the Awarding Authority. Therefore, all projects must be considered and implemented in accordance with 701 CMR 7.00, and the Road Flagger and Police Detail Guidelines. By placing a project on the TIP, the Municipality acknowledges that 701 CMR 7.00 is applicable to its project and design and construction will be fully compliant with this Regulation. This information, and additional information relative to guidance and implementation of the Regulation can be found at the following link on the MassDOT Highway Division website: http://www.massdot.state.ma.us/Highway/flaggers/main.aspx | ||||||||||||
| Transportation Improvement Program (TIP) | ||||||||||
| Project List (FY2020) | ||||||||||
| FTA Program | Project Number | Transit Agency | FTA Activity Line Item | Project Description | Carryover (unobligated) | Federal Funds | State Funds | TDC | Local Funds | Total Cost |
| 5307 | ||||||||||
| 5307 | RTD0006602 | Cape Ann Transportation Authority | 117A00 | PREVENTIVE MAINTENANCE | 2019 - $285,000 | $285,000 | $0 | $0 | $71,250 | $356,250 |
| 5307 | RTD0006603 | Cape Ann Transportation Authority | 114206 | ACQUIRE - SHOP EQ/COMP/SFTWR | 2019 - $55,000 | $55,000 | $13,750 | $0 | $0 | $68,750 |
| 5307 | RTD0007089 | MetroWest Regional Transit Authority | 114200 | ACQUISITION OF BUS SUPPORT EQUIP/FACILITIES | 2019 - $248,415 | $248,415 | $62,104 | $0 | $0 | $310,519 |
| 5307 | RTD0007090 | MetroWest Regional Transit Authority | 440000 | Mobility Management | 2019 - $25,000 | $25,000 | $6,250 | $0 | $0 | $31,250 |
| 5307 | RTD0007091 | MetroWest Regional Transit Authority | 117C00 | NON FIXED ROUTE ADA PARA SERV | 2019 - $1,300,000 | $1,300,000 | $325,000 | $0 | $0 | $1,625,000 |
| 5307 | RTD0007092 | MetroWest Regional Transit Authority | 113403 | TERMINAL, INTERMODAL (TRANSIT) - BLANDIN | 2019 - $150,000 | $150,000 | $37,500 | $0 | $0 | $187,500 |
| 5307 | RTD0007062 | Massachusetts Bay Transportation Authority (MBTA) | 121200 | Revenue Vehicle Program - 5307 | $146,121,933 | $0 | $0 | $36,530,483 | $182,652,416 | |
| Subtotal | $148,185,348 | $444,604 | $0 | $36,601,733 | $185,231,685 | |||||
| 5309 | ||||||||||
| 5309 | RTD0007083 | Massachusetts Bay Transportation Authority (MBTA) | 132303 | Green Line Extension Project | $150,000,000 | $0 | $0 | $150,000,000 | $300,000,000 | |
| Subtotal | $150,000,000 | $0 | $0 | $150,000,000 | $300,000,000 | |||||
| 5310 | ||||||||||
| Subtotal | $0 | $0 | $0 | $0 | $0 | |||||
| 5311 | ||||||||||
| Subtotal | $0 | $0 | $0 | $0 | $0 | |||||
| 5337 | ||||||||||
| 5337 | RTD0007066 | Massachusetts Bay Transportation Authority (MBTA) | 123402 | Elevator and Escalator Program - 5337 | $27,740,714 | $0 | $0 | $6,935,178 | $34,675,892 | |
| 5337 | RTD0007067 | Massachusetts Bay Transportation Authority (MBTA) | 123400 | Stations and Facilities Program - 5337 | $58,152,291 | $0 | $0 | $14,538,073 | $72,690,364 | |
| 5337 | RTD0007068 | Massachusetts Bay Transportation Authority (MBTA) | 124400 | Signals/Systems Upgrade Program - 5337 | $60,000,000 | $0 | $0 | $15,000,000 | $75,000,000 | |
| Subtotal | $145,893,005 | $0 | $0 | $36,473,251 | $182,366,256 | |||||
| 5339 | ||||||||||
| 5339 | RTD0007069 | Massachusetts Bay Transportation Authority (MBTA) | 111400 | Bus Program - 5339 | $5,683,653 | $0 | $0 | $1,420,913 | $7,104,566 | |
| Subtotal | $5,683,653 | $0 | $0 | $1,420,913 | $7,104,566 | |||||
| 5320 | ||||||||||
| Subtotal | $0 | $0 | $0 | $0 | $0 | |||||
| Other Federal | ||||||||||
| Subtotal | $0 | $0 | $0 | $0 | $0 | |||||
| Other Non-Federal | ||||||||||
| Subtotal | $0 | $0 | $0 | $0 | $0 | |||||
| Total | $449,762,006 | $444,604 | $0 | $224,495,897 | $674,702,507 | |||||
| Funds listed under the Carry Over column are included in the Federal Amount | ||||||||||
| 2021 | Boston Region Transportation Improvement Program | |||||||||||
| Amendment / Adjustment Type ▼ |
STIP Program ▼ | MassDOT Project ID ▼ | Metropolitan Planning Organization ▼ | Municipality Name ▼ | MassDOT Project Description▼ | MassDOT District ▼ | Funding Source ▼ | Total Programmed Funds ▼ | Federal Funds ▼ | Non-Federal Funds ▼ | Additional Information ▼ Present information as follows, if applicable: a) Planning / Design / or Construction; b) total project cost and funding sources used; c) advance construction status; d) MPO project score; e) name of entity receiving a transfer; f) name of entity paying the non-state non-federal match; g) earmark details; h) TAP project proponent; i) other information | |
| ►Section 1A / Regionally Prioritized Projects | ||||||||||||
| ►Regionally Prioritized Projects | ||||||||||||
| Planning / Adjustments / Pass-throughs | 1570 | Boston Region | Multiple | GREEN LINE EXTENSION PROJECT- EXTENSION TO COLLEGE AVENUE WITH THE UNION SQUARE SPUR | 6 | CMAQ | $ 29,100,000 | $ 23,280,000 | $ 5,820,000 | Construction; STP+CMAQ+Section 5309 (Transit) Total MPO Contribution = $190,000,000; AC Yr 6 of 6; funding flexed to FTA; match provided by local contributions |
||
| Roadway Reconstruction | 606453 | Boston Region | Boston | BOSTON- IMPROVEMENTS ON BOYLSTON STREET, FROM INTERSECTION OF BROOKLINE AVENUE & PARK DRIVE TO IPSWICH STREET | 6 | CMAQ | $ 1,000,000 | $ 800,000 | $ 200,000 | Construction; CMAQ+TAP+STP Total Cost = $8,542,892; MPO Evaluation Score = 58 | ||
| Roadway Reconstruction | 606453 | Boston Region | Boston | BOSTON- IMPROVEMENTS ON BOYLSTON STREET, FROM INTERSECTION OF BROOKLINE AVENUE & PARK DRIVE TO IPSWICH STREET | 6 | TAP | $ 812,432 | $ 649,946 | $ 162,486 | Construction; CMAQ+TAP+STP Total Cost = $8,542,892; MPO Evaluation Score = 58 | ||
| Roadway Reconstruction | 606453 | Boston Region | Boston | BOSTON- IMPROVEMENTS ON BOYLSTON STREET, FROM INTERSECTION OF BROOKLINE AVENUE & PARK DRIVE TO IPSWICH STREET | 6 | STP | $ 6,730,460 | $ 5,384,368 | $ 1,346,092 | Construction; CMAQ+TAP+STP Total Cost = $8,542,892; MPO Evaluation Score = 58; TAP Proponent = Boston | ||
| Roadway Reconstruction | 606226 | Boston Region | Boston | BOSTON- RECONSTRUCTION OF RUTHERFORD AVENUE, FROM CITY SQUARE TO SULLIVAN SQUARE | 6 | NHPP | $ 11,207,439 | $ 8,965,951 | $ 2,241,488 | Construction; NHPP+STP+TAP Total Cost = $152,000,000; AC Yr 2 of 5; Total funding in this TIP = $116,626,515; TAP Proponent = Boston; MPO Evaluation Score = 59 | ||
| Roadway Reconstruction | 606226 | Boston Region | Boston | BOSTON- RECONSTRUCTION OF RUTHERFORD AVENUE, FROM CITY SQUARE TO SULLIVAN SQUARE | 6 | TAP | $ 1,922,546 | $ 1,538,037 | $ 384,509 | Construction; NHPP+STP+TAP Total Cost = $152,000,000; AC Yr 2 of 5; Total funding in this TIP = $116,626,515; TAP Proponent = Boston; MPO Evaluation Score = 59; TAP Proponent = Boston | ||
| Roadway Reconstruction | 606226 | Boston Region | Boston | BOSTON- RECONSTRUCTION OF RUTHERFORD AVENUE, FROM CITY SQUARE TO SULLIVAN SQUARE | 6 | STP | $ 14,050,761 | $ 11,240,609 | $ 2,810,152 | Construction; NHPP+STP+TAP Total Cost = $152,000,000; AC Yr 2 of 5; Total funding in this TIP = $116,626,515; TAP Proponent = Boston; MPO Evaluation Score = 59 | ||
| Bridge Program | 604996 | Boston Region | Woburn | WOBURN- BRIDGE REPLACEMENT, W-43-017, NEW BOSTON STREET OVER MBTA | 4 | STP | $ 16,418,347 | $ 13,134,678 | $ 3,283,669 | Construction; Total Cost = $16,418,347; MPO Evaluation Score = 55 | ||
| Roadway Reconstruction | 608228 | Boston Region | Framingham | FRAMINGHAM- RECONSTRUCTION OF UNION AVENUE, FROM PROCTOR STREET TO MAIN STREET | 3 | HSIP | $ 1,000,000 | $ 900,000 | $ 100,000 | Construction; STP+HSIP+TAP Total Cost = $9,124,364; MPO Evaluation Score = 58 | ||
| Roadway Reconstruction | 608228 | Boston Region | Framingham | FRAMINGHAM- RECONSTRUCTION OF UNION AVENUE, FROM PROCTOR STREET TO MAIN STREET | 3 | TAP | $ 1,006,391 | $ 805,113 | $ 201,278 | Construction; STP+HSIP+TAP Total Cost = $9,124,364; MPO Evaluation Score = 58 | ||
| Roadway Reconstruction | 608228 | Boston Region | Framingham | FRAMINGHAM- RECONSTRUCTION OF UNION AVENUE, FROM PROCTOR STREET TO MAIN STREET | 3 | STP | $ 7,117,973 | $ 5,694,378 | $ 1,423,595 | Construction; STP+HSIP+TAP Total Cost = $9,124,364; MPO Evaluation Score = 58; TAP Proponent = Framingham | ||
| Roadway Reconstruction | 606501 | Boston Region | Holbrook | HOLBROOK- RECONSTRUCTION OF UNION STREET (ROUTE 139), FROM LINFIELD STREET TO CENTRE STREET/WATER STREET | 5 | STP | $ 468,830 | $ 375,064 | $ 93,766 | Construction; TAP+STP+Earmark Total Cost = $2,285,168; MPO Evaluation Score = 45 | ||
| Roadway Reconstruction | 606501 | Boston Region | Holbrook | HOLBROOK- RECONSTRUCTION OF UNION STREET (ROUTE 139), FROM LINFIELD STREET TO CENTRE STREET/WATER STREET | 5 | TAP | $ 289,088 | $ 231,270 | $ 57,818 | Construction; TAP+STP+Earmark Total Cost = $2,285,168; MPO Evaluation Score = 45; TAP Proponent = Holbrook | ||
| Roadway Reconstruction | 601607 | Boston Region | Hull | HULL- RECONSTRUCTION OF ATLANTIC AVENUE AND RELATED WORK FROM NANTASKET AVENUE TO COHASSET TOWN LINE | 5 | STP | $ 6,651,674 | $ 5,321,339 | $ 1,330,335 | Construction; Total Cost = $6,651,674; MPO Evaluation Score = 44 | ||
| Intersection Improvements | 606130 | Boston Region | Norwood | NORWOOD- INTERSECTION IMPROVEMENTS @ ROUTE 1A & UPLAND ROAD/WASHINGTON STREET & PROSPECT STREET/FULTON STREET | 5 | CMAQ | $ 1,000,000 | $ 800,000 | $ 200,000 | Construction; CMAQ+STP Total Cost = $3,936,781; MPO Evaluation Score = 53 | ||
| Intersection Improvements | 606130 | Boston Region | Norwood | NORWOOD- INTERSECTION IMPROVEMENTS @ ROUTE 1A & UPLAND ROAD/WASHINGTON STREET & PROSPECT STREET/FULTON STREET | 5 | STP | $ 2,936,781 | $ 2,349,425 | $ 587,356 | Construction; CMAQ+STP Total Cost = $3,936,781; MPO Evaluation Score = 53 | ||
| Roadway Reconstruction | 608146 | Boston Region | Marblehead | MARBLEHEAD- INTERSECTION IMPROVEMENTS AT PLEASANT STREET & VILLAGE, VINE AND CROSS STREETS | 4 | STP | $ 726,570 | $ 581,256 | $ 145,314 | Construction; STP Total Cost = $726,570; MPO Evaluation Score = 40 | ||
| Planning / Adjustments / Pass-throughs | BN0009 | Boston Region | Multiple | COMMUNITY TRANSPORTATION PROGRAM | N/A | CMAQ | $ 2,000,000 | $ 1,600,000 | $ 400,000 | Planning, Design, or Construction; Set Aside for LRTP Clean Air and Mobility Program | ||
| Regionally Prioritized Projects subtotal ► | $ 104,439,292 | $ 83,651,434 | $ 20,787,858 | ◄ 80% Federal + 20% Non-Federal | ||||||||
| ►Section 1A / Fiscal Constraint Analysis | ||||||||||||
| Total Regional Federal Aid Funds Programmed ► | $ 104,439,292 | $ 104,552,877 | ◄Total Budget | $ 113,585 | Target Funds Available | |||||||
| Section 1A instructions: MPO Template Name) Choose Regional Name from dropdown list to populate header and MPO column; Column C) Enter ID from ProjectInfo; Column E) Choose Municipality Name from dropdown list; Column H) Choose the Funding Source being used for the project - if multiple funding sources are being used enter multiple lines; Column I) Enter the total amount of funds being programmed in this fiscal year and for each funding source; Column J) Federal funds autocalculates. Please verify the amount and only change if needed for flex. Column K) Non-federal funds autocalculates. Please verify the split/match - if matching an FTA flex, coordinate with Rail & Transit Division before programming; Column L) Enter Additional Information as described - please do not use any other format. | STP programmed ► | $ 66,308,835 | $ 53,047,068 | ◄ STP | ||||||||
| HSIP programmed ► | $ 1,000,000 | $ 900,000 | ◄ HSIP | |||||||||
| CMAQ programmed ► | $ 33,100,000 | $ 26,480,000 | ◄ CMAQ | |||||||||
| TAP programmed ► | $ 4,030,457 | $ 3,224,366 | ◄ TAP | |||||||||
| ►Section 1B / Earmark or Discretionary Grant Funded Projects | ||||||||||||
| ►Other Federal Aid | ||||||||||||
| Earmark Discretionary | 606226 | Boston Region | Boston | BOSTON- RECONSTRUCTION OF RUTHERFORD AVENUE, FROM CITY SQUARE TO SULLIVAN SQUARE | 6 | HPP | $ 126,970 | $ 101,576 | $ 25,394 | Demo ID MA183; AC Yr 2 of 5 | ||
| Earmark Discretionary | 606226 | Boston Region | Boston | BOSTON- RECONSTRUCTION OF RUTHERFORD AVENUE, FROM CITY SQUARE TO SULLIVAN SQUARE | 6 | HPP | $ 8,451,960 | $ 6,761,568 | $ 1,690,392 | Demo ID MA210; AC Yr 2 of 5 | ||
| Earmark Discretionary | 606501 | Boston Region | Holbrook | HOLBROOK- RECONSTRUCTION OF UNION STREET (ROUTE 139), FROM LINFIELD STREET TO CENTRE STREET/WATER STREET | 5 | HPP | $ 1,527,250 | $ 1,221,800 | $ 305,450 | Demo ID MA177 | ||
| Boston Region | Other Federal Aid | HPP | $ - | $ - | $ - | |||||||
| Boston Region | Other Federal Aid | HPP | $ - | $ - | $ - | |||||||
| Other Federal Aid subtotal ► | $ 10,106,180 | $ 8,084,944 | $ 2,021,236 | ◄ Funding Split Varies by Funding Source | ||||||||
| ►Section 2A / State Prioritized Reliability Projects | ||||||||||||
| ►Bridge Program / Inspections | ||||||||||||
| Bridge Program | Boston Region | Bridge Inspection | $ - | $ - | $ - | |||||||
| Bridge Program / Inspections subtotal ► | $ - | $ - | $ - | ◄ Funding Split Varies by Funding Source | ||||||||
| ►Bridge Program / Off-System | ||||||||||||
| Bridge Program | 608637 | Boston Region | MAYNARD | MAYNARD- BRIDGE REPLACMENT, M-10-006, CARRYING FLORIDA ROAD OVER THE ASSABET RIVER | 3 | STP-BR-OFF | $ 1,646,400 | $ 1,317,120 | $ 329,280 | |||
| Bridge Program / Off-System subtotal ► | $ 6,295,310 | $ 5,036,248 | $ 1,259,062 | ◄ 80% Federal + 20% Non-Federal | ||||||||
| ►Bridge Program / On-System (NHS) | ||||||||||||
| Bridge Program | 604173 | Boston Region | BOSTON | BOSTON- BRIDGE REPLACEMENT, B-16-016, NORTH WASHINGTON STREET OVER THE BOSTON INNER HARBOR | 6 | NHPP-On | $ 24,184,931 | $ 19,347,945 | $ 4,836,986 | AC Year 5 of 6, Total Cost $193,058,158 | ||
| Bridge Program | 605287 | Boston Region | CHELSEA | CHELSEA- ROUTE 1 VIADUCT REHABILITATION (SB/NB) ON C-09-007 & C-09-011 | 6 | NHPP-On | $ 29,992,990 | $ 23,994,392 | $ 5,998,598 | AC Year 4 of 4, Total Cost $213,972,689 | ||
| Bridge Program | 604952 | Boston Region | Multiple | LYNN- SAUGUS- BRIDGE REPLACEMENT, L-18-016=S-05-008, ROUTE 107 OVER THE SAUGUS RIVER (AKA - BELDEN G. BLY BRIDGE) | 4 | NHPP-On | $ 17,028,354 | $ 13,622,683 | $ 3,405,671 | AC Year 3 of 5, Total Cost $74,471,140 | ||
| Bridge Program / On-System (NHS) subtotal ► | $ 71,206,275 | $ 56,965,020 | $ 14,241,255 | ◄ Funding Split Varies by Funding Source | ||||||||
| ►Bridge Program / On-System (Non-NHS) | ||||||||||||
| Bridge Program | 608596 | Boston Region | ESSEX | ESSEX- SUPERSTRUCTURE REPLACEMENT, E-11-001 (2TV), ROUTE 133\MAIN STREET OVER ESSEX RIVER | 4 | NHPP-Off | $ 4,511,360 | $ 3,609,088 | $ 902,272 | |||
| Bridge Program | Boston Region | NHPP-Off | $ - | $ - | ||||||||
| Bridge Program / On-System (Non-NHS) subtotal ► | $ 4,511,360 | $ 3,609,088 | $ 902,272 | ◄ 80% Federal + 20% Non-Federal | ||||||||
| ►Bridge Program / Systematic Maintenance | ||||||||||||
| Bridge Program | 608610 | Boston Region | NEWTON | NEWTON- STEEL SUPERSTRUCTURE CLEANING (FULL REMOVAL) AND PAINTING OF N-12-055 | 6 | NHPP-On | $ 2,304,000 | $ 1,843,200 | $ 460,800 | |||
| Bridge Program / Systematic Maintenance subtotal ► | $ 2,304,000 | $ 1,843,200 | $ 460,800 | ◄ Funding Split Varies by Funding Source | ||||||||
| ►Interstate Pavement | ||||||||||||
| Interstate Pavement | 608378 | Boston Region | Multiple | DANVERS- TOPSFIELD- BOXFORD- ROWLEY- INTERSTATE MAINTENANCE AND RELATED WORK ON I-95 | 4 | NHPP | $ 17,299,744 | $ 15,569,770 | $ 1,729,974 | |||
| Insterstate Pavement subtotal ► | $ 17,299,744 | $ 15,569,770 | $ 1,729,974 | ◄ 90% Federal + 10% Non-Federal | ||||||||
| ►Non-Interstate Pavement | ||||||||||||
| Non-Interstate Pavement | 607477 | Boston Region | Multiple | LYNNFIELD- PEABODY- RESURFACING AND RELATED WORK ON ROUTE 1 | 4 | NHPP | $ 7,424,560 | $ 5,939,648 | $ 1,484,912 | |||
| Non-Interstate Pavement subtotal ► | $ 7,424,560 | $ 5,939,648 | $ 1,484,912 | ◄ 80% Federal + 20% Non-Federal | ||||||||
| ► Roadway Improvements | ||||||||||||
| Roadway Improvements | Boston Region | Roadway Improvements | $ - | $ - | $ - | |||||||
| Roadway Improvements | Boston Region | Roadway Improvements | $ - | $ - | $ - | |||||||
| Roadway Improvements | Boston Region | Roadway Improvements | $ - | $ - | $ - | |||||||
| Roadway Improvements subtotal ► | $ - | $ - | $ - | ◄ 80% Federal + 20% Non-Federal | ||||||||
| ► Safety Improvements | ||||||||||||
| Safety Improvements | 609090 | Boston Region | Multiple | BOSTON-MILTON-QUINCY- HIGHWAY LIGHTING SYSTEM REPLACEMENT ON I-93, FROM NEPONSET AVENUE TO THE BRAINTREE | 6 | NHPP | $ 3,000,000 | $ 2,700,000 | $ 300,000 | |||
| Safety Improvements | Boston Region | Multiple | NHPP | $ - | $ - | |||||||
| Safety Improvements subtotal ► | $ 3,000,000 | $ 2,700,000 | $ 300,000 | ◄ Funding Split Varies by Funding Source | ||||||||
| ►Section 2B / State Prioritized Modernization Projects | ||||||||||||
| ► ADA Retrofits | ||||||||||||
| ADA Retrofits | Boston Region | ADA Retrofits | $ - | $ - | $ - | |||||||
| ADA Retrofits | Boston Region | ADA Retrofits | $ - | $ - | $ - | |||||||
| ADA Retrofits subtotal ► | $ - | $ - | $ - | ◄ 80% Federal + 20% Non-Federal | ||||||||
| ►Intersection Improvements | ||||||||||||
| Intersection Improvements | 607761 | Boston Region | Swampscott | SWAMPSCOTT- INTERSECTION & SIGNAL IMPROVEMENTS AT SR 1A (PARADISE ROAD) AT SWAMPSCOTT MALL | 4 | HSIP | $ 2,000,000 | $ 1,800,000 | $ 200,000 | |||
| Intersection Improvements | 607748 | Boston Region | Acton | ACTON- INTERSECTION & SIGNAL IMPROVEMENTS ON SR 2 & SR 111 (MASSACHUSETTS AVENUE) AT PIPER ROAD & TAYLOR ROAD |
3 | HSIP | $ 5,000,000 | $ 4,500,000 | $ 500,000 | |||
| Intersection Improvements | Boston Region | Intersection Improvements | $ - | $ - | $ - | |||||||
| Intersection Improvements | Boston Region | Intersection Improvements | $ - | $ - | $ - | |||||||
| Intersection Improvements subtotal ► | $ 7,000,000 | $ 6,300,000 | $ 700,000 | ◄ Funding Split Varies by Funding Source | ||||||||
| ►Intelligent Transportation Systems | ||||||||||||
| Intelligent Transportation Systems | Boston Region | Intelligent Transportation Systems | $ - | $ - | $ - | |||||||
| Intelligent Transportation Systems | Boston Region | Intelligent Transportation Systems | $ - | $ - | $ - | |||||||
| Intelligent Transportation Systems | Boston Region | Intelligent Transportation Systems | $ - | $ - | $ - | |||||||
| Intelligent Transportation System subtotal ► | $ - | $ - | $ - | ◄ 80% Federal + 20% Non-Federal | ||||||||
| ►Roadway Reconstruction | ||||||||||||
| Roadway Reconstruction | 608911 | Boston Region | Belmont | BELMONT- IMPROVEMENTS AT WELLINGTON ELEMENTARY SCHOOL (SRTS) | 4 | TAP | $ 1,243,750 | $ 995,000 | $ 248,750 | |||
| Roadway Reconstruction | 607901 | Boston Region | Dedham | DEDHAM- PEDESTRIAN IMPROVEMENTS ALONG ELM STREET & RUSTCRAFT ROAD CORRIDORS | 6 | CMAQ | $ 3,230,597 | $ 2,584,478 | $ 646,119 | |||
| Roadway Reconstruction subtotal ► | $ 4,474,347 | $ 3,579,478 | $ 894,869 | ◄ Funding Split Varies by Funding Source | ||||||||
| ►Section 2C / State Prioritized Expansion Projects | ||||||||||||
| ►Bicycles and Pedestrians | ||||||||||||
| Bicycles and Pedestrians | 607329 | Boston Region | Multiple | WAKEFIELD- LYNNFIELD- RAIL TRAIL EXTENSION, FROM THE GALVIN MIDDLE SCHOOL TO LYNNFIELD/PEABODY T.L. | 4 | CMAQ | $ 10,316,559 | $ 8,253,247 | $ 2,063,312 | Construction / PSAC score 32.5 | ||
| Bicycles and Pedestrians subtotal ► | $ 10,316,559 | $ 8,253,247 | $ 2,063,312 | ◄ 80% Federal + 20% Non-Federal | ||||||||
| ►Capacity | ||||||||||||
| Capacity | Boston Region | Capacity | $ - | $ - | $ - | |||||||
| Capacity | Boston Region | Capacity | $ - | $ - | $ - | |||||||
| Capacity subtotal ► | $ - | $ - | $ - | ◄ Funding Split Varies by Funding Source | ||||||||
| ►Section 3 / Planning / Adjustments / Pass-throughs | ||||||||||||
| ►Planning / Adjustments / Pass-throughs | ||||||||||||
| Boston Region | ABP GANS Repayment | Multiple | $ - | $ - | $ - | |||||||
| Boston Region | ABP GANS Repayment | Multiple | $ - | $ - | $ - | |||||||
| Boston Region | Award adjustments, change orders, etc. | Multiple | $ - | $ - | $ - | |||||||
| Boston Region | Award adjustments, change orders, etc. | Multiple | $ - | $ - | $ - | |||||||
| Boston Region | Award adjustments, change orders, etc. | Multiple | $ - | $ - | $ - | |||||||
| Boston Region | Award adjustments, change orders, etc. | Multiple | $ - | $ - | $ - | |||||||
| Boston Region | Metropolitan Planning | Multiple | $ - | $ - | $ - | |||||||
| Boston Region | Metropolitan Planning | Multiple | $ - | $ - | $ - | |||||||
| Boston Region | State Planning and Research Work Program I, (SPR I), Planning | Multiple | $ - | $ - | $ - | |||||||
| Boston Region | State Planning and Research Work Program II, (SPR II), Research | Multiple | $ - | $ - | $ - | |||||||
| Boston Region | Railroad Crossings | Multiple | $ - | $ - | $ - | |||||||
| Boston Region | Railroad Crossings | Multiple | $ - | $ - | $ - | |||||||
| Boston Region | Recreational Trails | Multiple | $ - | $ - | $ - | |||||||
| Other Statewide Items subtotal ► | $ - | $ - | $ - | ◄ Funding Split Varies by Funding Source | ||||||||
| ►Section 4 / Non-Federally Aided Projects | ||||||||||||
| ►Non-Federally Aided Projects | ||||||||||||
| Non Federal Aid | Boston Region | Non-Federal Aid | $ - | $ - | ||||||||
| Non-Federally Aided Projects | Boston Region | Non-Federal Aid | $ - | $ - | ||||||||
| Non-Federal Aid subtotal► | $ - | $ - | ◄100% Non-Federal | |||||||||
| 2021 Summary | TIP Section 1 - 3: ▼ | TIP Section 4: ▼ | Total of All Projects ▼ | |||||||||
| Total ► | $ 248,377,627 | $ - | $ 248,377,627 | ◄ Total Spending in Region | ||||||||
| Federal Funds ► | $ 201,532,076 | $ 201,532,076 | ◄ Total Federal Spending in Region | |||||||||
| Non-Federal Funds ► | $ 46,845,551 | $ - | $ 46,845,551 | ◄ Total Non-Federal Spending in Region | ||||||||
| 701 CMR 7.00 Use of Road Flaggers and Police Details on Public Works Projects / 701 CMR 7.00 (the Regulation) was promulgated and became law on October 3, 2008. Under this Regulation, the CMR is applicable to any Public works Project that is performed within the limits of, or that impact traffic on, any Public Road. The Municipal Limitation referenced in this Regulation is applicable only to projects where the Municipality is the Awarding Authority. For all projects contained in the TIP, the Commonwealth is the Awarding Authority. Therefore, all projects must be considered and implemented in accordance with 701 CMR 7.00, and the Road Flagger and Police Detail Guidelines. By placing a project on the TIP, the Municipality acknowledges that 701 CMR 7.00 is applicable to its project and design and construction will be fully compliant with this Regulation. This information, and additional information relative to guidance and implementation of the Regulation can be found at the following link on the MassDOT Highway Division website: http://www.massdot.state.ma.us/Highway/flaggers/main.aspx | ||||||||||||
| Transportation Improvement Program (TIP) | ||||||||||
| Project List (FY2021) | ||||||||||
| FTA Program | Project Number | Transit Agency | FTA Activity Line Item | Project Description | Carryover (unobligated) | Federal Funds | State Funds | TDC | Local Funds | Total Cost |
| 5307 | ||||||||||
| 5307 | RTD0006605 | Cape Ann Transportation Authority | 117A00 | PREVENTIVE MAINTENANCE | 2020 - $285,000 | $285,000 | $0 | $0 | $71,250 | $356,250 |
| 5307 | RTD0006606 | Cape Ann Transportation Authority | 114206 | ACQUIRE - SHOP EQ/COMP/SFTWR | 2020 - $55,000 | $55,000 | $13,750 | $0 | $0 | $68,750 |
| 5307 | RTD0007093 | MetroWest Regional Transit Authority | 117C00 | NON FIXED ROUTE ADA PARA SERV | 2020 - $1,300,000 | $1,300,000 | $325,000 | $0 | $0 | $1,625,000 |
| 5307 | RTD0007094 | MetroWest Regional Transit Authority | 113403 | TERMINAL, INTERMODAL (TRANSIT) - BLANDIN | 2020 - $150,000 | $150,000 | $37,500 | $0 | $0 | $187,500 |
| 5307 | RTD0007095 | MetroWest Regional Transit Authority | 114200 | ACQUISITION OF BUS SUPPORT EQUIP/FACILITIES | 2020 - $248,415 | $248,415 | $62,104 | $0 | $0 | $310,519 |
| 5307 | RTD0007096 | MetroWest Regional Transit Authority | 440000 | Mobility Management | 2020 - $25,000 | $25,000 | $6,250 | $0 | $0 | $31,250 |
| 5307 | RTD0007070 | Massachusetts Bay Transportation Authority (MBTA) | 121200 | Revenue Vehicle Program - 5307 | $81,761,933 | $0 | $0 | $20,440,483 | $102,202,416 | |
| 5307 | RTD0007371 | Massachusetts Bay Transportation Authority (MBTA) | 126301 | Signals/Systems Upgrade Program - 5307 | $64,360,000 | $0 | $0 | $16,090,000 | $80,450,000 | |
| Subtotal | $148,185,348 | $444,604 | $0 | $36,601,733 | $185,231,685 | |||||
| 5309 | ||||||||||
| 5309 | RTD0007084 | Massachusetts Bay Transportation Authority (MBTA) | 132303 | Green Line Extension Project | $100,000,000 | $0 | $0 | $100,000,000 | $200,000,000 | |
| Subtotal | $100,000,000 | $0 | $0 | $100,000,000 | $200,000,000 | |||||
| 5310 | ||||||||||
| Subtotal | $0 | $0 | $0 | $0 | $0 | |||||
| 5311 | ||||||||||
| Subtotal | $0 | $0 | $0 | $0 | $0 | |||||
| 5337 | ||||||||||
| 5337 | RTD0007073 | Massachusetts Bay Transportation Authority (MBTA) | 123400 | Stations and Facilities Program - 5337 | $85,893,004 | $0 | $0 | $21,473,251 | $107,366,255 | |
| 5337 | RTD0007074 | Massachusetts Bay Transportation Authority (MBTA) | 124400 | Signals/Systems Upgrade Program - 5337 | $60,000,000 | $0 | $0 | $15,000,000 | $75,000,000 | |
| Subtotal | $145,893,004 | $0 | $0 | $36,473,251 | $182,366,255 | |||||
| 5339 | ||||||||||
| 5339 | RTD0007075 | Massachusetts Bay Transportation Authority (MBTA) | 111400 | Bus Program - 5339 | $5,683,653 | $0 | $0 | $1,420,913 | $7,104,566 | |
| Subtotal | $5,683,653 | $0 | $0 | $1,420,913 | $7,104,566 | |||||
| 5320 | ||||||||||
| Subtotal | $0 | $0 | $0 | $0 | $0 | |||||
| Other Federal | ||||||||||
| Other Federal | RTD0007376 | Massachusetts Bay Transportation Authority (MBTA) | 126301 | PTC - RRIF/TIFIA Financing | $382,000,000 | $0 | $0 | $95,500,000 | $477,500,000 | |
| Subtotal | $382,000,000 | $0 | $0 | $95,500,000 | $477,500,000 | |||||
| Other Non-Federal | ||||||||||
| Subtotal | $0 | $0 | $0 | $0 | $0 | |||||
| Total | $781,762,005 | $444,604 | $0 | $269,995,897 | $1,052,202,506 | |||||
| Funds listed under the Carry Over column are included in the Federal Amount | ||||||||||
| 2022 | Boston Region Transportation Improvement Program | 2022 | GHG Tracking for | Boston Region Transportation Improvement Program | |||||||||||||||
| Amendment / Adjustment Type ▼ |
STIP Program ▼ | MassDOT Project ID ▼ | Metropolitan Planning Organization ▼ | Municipality Name ▼ | MassDOT Project Description▼ | MassDOT District ▼ | Funding Source ▼ | Total Programmed Funds ▼ | Federal Funds ▼ | Non-Federal Funds ▼ | Additional Information ▼ Present information as follows, if applicable: a) Planning / Design / or Construction; b) total project cost and funding sources used; c) advance construction status; d) MPO project score; e) name of entity receiving a transfer; f) name of entity paying the non-state non-federal match; g) earmark details; h) TAP project proponent; i) other information | MassDOT Project ID ▼ | MassDOT Project Description▼ | Total Programmed Funds ▼ | GHG Analysis Type ▼ | GHG CO2 Impact (kg/yr)▼ | GHG Impact Description ▼ | Additional Description ▼ | |
| ►Section 1A / Regionally Prioritized Projects | ►Section 1A / Regionally Prioritized Projects | ||||||||||||||||||
| ►Regionally Prioritized Projects | ►Regionally Prioritized Projects | ||||||||||||||||||
| Roadway Reconstruction | 606226 | Boston Region | Boston | BOSTON- RECONSTRUCTION OF RUTHERFORD AVENUE, FROM CITY SQUARE TO SULLIVAN SQUARE | 6 | NHPP | $ 14,664,180 | $ 11,731,344 | $ 2,932,836 | Construction; NHPP+STP+TAP Total Cost = $152,000,000; AC Yr 3 of 5; Total funding in this TIP = $116,626,515; MPO Evaluation Score = 59 | 606226 | BOSTON- RECONSTRUCTION OF RUTHERFORD AVENUE, FROM CITY SQUARE TO SULLIVAN SQUARE | $ 14,664,180 | Qualitative | LRTP project included in the statewide model | ||||
| Roadway Reconstruction | 606226 | Boston Region | Boston | BOSTON- RECONSTRUCTION OF RUTHERFORD AVENUE, FROM CITY SQUARE TO SULLIVAN SQUARE | 6 | STP | $ 26,498,598 | $ 21,198,878 | $ 5,299,720 | Construction; NHPP+STP+TAP Total Cost = $152,000,000; AC Yr 3 of 5; Total funding in this TIP = $116,626,515; MPO Evaluation Score = 59 | 606226 | BOSTON- RECONSTRUCTION OF RUTHERFORD AVENUE, FROM CITY SQUARE TO SULLIVAN SQUARE | $ 26,498,598 | Qualitative | LRTP project included in the statewide model | ||||
| Roadway Reconstruction | 606226 | Boston Region | Boston | BOSTON- RECONSTRUCTION OF RUTHERFORD AVENUE, FROM CITY SQUARE TO SULLIVAN SQUARE | 6 | TAP | $ 1,282,990 | $ 1,026,392 | $ 256,598 | Construction; NHPP+STP+TAP Total Cost = $152,000,000; AC Yr 3 of 5; Total funding in this TIP = $116,626,515; MPO Evaluation Score = 59; TAP Proponent = Boston | 606226 | BOSTON- RECONSTRUCTION OF RUTHERFORD AVENUE, FROM CITY SQUARE TO SULLIVAN SQUARE | $ 1,282,990 | Qualitative | LRTP project included in the statewide model | ||||
| Intersection Improvements | 605857 | Boston Region | Norwood | NORWOOD- INTERSECTION IMPROVEMENTS @ ROUTE 1 & UNIVERSITY AVENUE/EVERETT STREET | 5 | CMAQ | $ 3,000,000 | $ 2,400,000 | $ 600,000 | Construction; HSIP+CMAQ+STP+NHPP Total Cost = $9,166,410; MPO Evaluation Score = 55 | 605857 | NORWOOD- INTERSECTION IMPROVEMENTS @ ROUTE 1 & UNIVERSITY AVENUE/EVERETT STREET | $ 3,000,000 | Quantified | 1,092,131 | Quantified Decrease in Emissions from Traffic Operational Improvement | |||
| Intersection Improvements | 605857 | Boston Region | Norwood | NORWOOD- INTERSECTION IMPROVEMENTS @ ROUTE 1 & UNIVERSITY AVENUE/EVERETT STREET | 5 | HSIP | $ 631,724 | $ 568,552 | $ 63,172 | Construction; HSIP+CMAQ+STP+NHPP Total Cost = $9,166,410; MPO Evaluation Score = 55 | 605857 | NORWOOD- INTERSECTION IMPROVEMENTS @ ROUTE 1 & UNIVERSITY AVENUE/EVERETT STREET | $ 631,724 | Quantified | Quantified Decrease in Emissions from Traffic Operational Improvement | ||||
| Intersection Improvements | 605857 | Boston Region | Norwood | NORWOOD- INTERSECTION IMPROVEMENTS @ ROUTE 1 & UNIVERSITY AVENUE/EVERETT STREET | 5 | NHPP | $ 2,873,029 | $ 2,298,423 | $ 574,606 | Construction; HSIP+CMAQ+STP+NHPP Total Cost = $9,166,410; MPO Evaluation Score = 55 | 605857 | NORWOOD- INTERSECTION IMPROVEMENTS @ ROUTE 1 & UNIVERSITY AVENUE/EVERETT STREET | $ 2,873,029 | Quantified | Quantified Decrease in Emissions from Traffic Operational Improvement | ||||
| Intersection Improvements | 605857 | Boston Region | Norwood | NORWOOD- INTERSECTION IMPROVEMENTS @ ROUTE 1 & UNIVERSITY AVENUE/EVERETT STREET | 5 | STP | $ 2,661,657 | $ 2,129,326 | $ 532,331 | Construction; HSIP+CMAQ+STP+NHPP Total Cost = $9,166,410; MPO Evaluation Score = 55 | 605857 | NORWOOD- INTERSECTION IMPROVEMENTS @ ROUTE 1 & UNIVERSITY AVENUE/EVERETT STREET | $ 2,661,657 | Quantified | Quantified Decrease in Emissions from Traffic Operational Improvement | ||||
| Bicycles and Pedestrians | 607738 | Boston Region | Bedford | BEDFORD- MINUTEMAN BIKEWAY EXTENSION, FROM LOOMIS STREET TO THE CONCORD T.L. | 4 | CMAQ | $ 6,489,964 | $ 5,191,971 | $ 1,297,993 | Construction; CMAQ+TAP Total Cost = $6,839,964; MPO Evaluation Score = 47 | 607738 | BEDFORD- MINUTEMAN BIKEWAY EXTENSION, FROM LOOMIS STREET TO THE CONCORD T.L. | $ 6,489,964 | Quantified | 21,098 | Quantified Decrease in Emissions from Bicycle and Pedestrian Project | |||
| Bicycles and Pedestrians | 607738 | Boston Region | Bedford | BEDFORD- MINUTEMAN BIKEWAY EXTENSION, FROM LOOMIS STREET TO THE CONCORD T.L. | 4 | TAP | $ 350,000 | $ 280,000 | $ 70,000 | Construction; CMAQ+TAP Total Cost = $6,839,964; MPO Evaluation Score = 47; TAP Proponent = Bedford | 607738 | BEDFORD- MINUTEMAN BIKEWAY EXTENSION, FROM LOOMIS STREET TO THE CONCORD T.L. | $ 350,000 | Quantified | Quantified Decrease in Emissions from Bicycle and Pedestrian Project | ||||
| Bicycles and Pedestrians | 608164 | Boston Region | Sudbury | SUDBURY- BIKE PATH CONSTRUCTION (BRUCE FREEMAN RAIL TRAIL) | 3 | CMAQ | $ 9,184,778 | $ 7,347,822 | $ 1,836,956 | Construction; CMAQ+TAP Total Cost = $9,684,778; MPO Evaluation Score = 40 | 608164 | SUDBURY- BIKE PATH CONSTRUCTION (BRUCE FREEMAN RAIL TRAIL) | $ 9,184,778 | Quantified | 49,903 | Quantified Decrease in Emissions from Bicycle and Pedestrian Project | |||
| Bicycles and Pedestrians | 608164 | Boston Region | Sudbury | SUDBURY- BIKE PATH CONSTRUCTION (BRUCE FREEMAN RAIL TRAIL) | 3 | TAP | $ 500,000 | $ 400,000 | $ 100,000 | Construction; CMAQ+TAP Total Cost = $9,684,778; MPO Evaluation Score = 40; TAP Proponent = Sudbury | 608164 | SUDBURY- BIKE PATH CONSTRUCTION (BRUCE FREEMAN RAIL TRAIL) | $ 500,000 | Quantified | Quantified Decrease in Emissions from Bicycle and Pedestrian Project | ||||
| Roadway Reconstruction | 607777 | Boston Region | Watertown | WATERTOWN- REHABILITATION OF MOUNT AUBURN STREET (ROUTE 16) | 6 | CMAQ | $ 1,000,000 | $ 800,000 | $ 200,000 | Construction; HSIP+CMAQ+STP Total Cost = $13,701,100; MPO Evaluation Score = 75 | 607777 | WATERTOWN- REHABILITATION OF MOUNT AUBURN STREET (ROUTE 16) | $ 1,000,000 | Quantified | 536,769 | Quantified Decrease in Emissions from Complete Streets Project | |||
| Roadway Reconstruction | 607777 | Boston Region | Watertown | WATERTOWN- REHABILITATION OF MOUNT AUBURN STREET (ROUTE 16) | 6 | HSIP | $ 2,000,000 | $ 1,800,000 | $ 200,000 | Construction; HSIP+CMAQ+STP Total Cost = $13,701,100; MPO Evaluation Score = 75 | 607777 | WATERTOWN- REHABILITATION OF MOUNT AUBURN STREET (ROUTE 16) | $ 2,000,000 | Quantified | Quantified Decrease in Emissions from Complete Streets Project | ||||
| Roadway Reconstruction | 607777 | Boston Region | Watertown | WATERTOWN- REHABILITATION OF MOUNT AUBURN STREET (ROUTE 16) | 6 | STP | $ 10,701,100 | $ 8,560,880 | $ 2,140,220 | Construction; HSIP+CMAQ+STP Total Cost = $13,701,100; MPO Evaluation Score = 75 | 607777 | WATERTOWN- REHABILITATION OF MOUNT AUBURN STREET (ROUTE 16) | $ 10,701,100 | Quantified | Quantified Decrease in Emissions from Complete Streets Project | ||||
| Roadway Reconstruction | 608078 | Boston Region | Chelsea | CHELSEA- RECONSTRUCTION ON BROADWAY (ROUTE 107), FROM CITY HALL AVENUE TO THE REVERE C.L. | 6 | CMAQ | $ 1,000,000 | $ 800,000 | $ 200,000 | Construction; CMAQ+STP Total Cost = $10,027,904; MPO Evaluation Score = 61 | 608078 | CHELSEA- RECONSTRUCTION ON BROADWAY (ROUTE 107), FROM CITY HALL AVENUE TO THE REVERE C.L. | $ 1,000,000 | Quantified | 93,278 | Quantified Decrease in Emissions from Complete Streets Project | |||
| Roadway Reconstruction | 608078 | Boston Region | Chelsea | CHELSEA- RECONSTRUCTION ON BROADWAY (ROUTE 107), FROM CITY HALL AVENUE TO THE REVERE C.L. | 6 | STP | $ 9,027,904 | $ 7,222,323 | $ 1,805,581 | Construction; CMAQ+STP Total Cost = $10,027,904; MPO Evaluation Score = 61 | 608078 | CHELSEA- RECONSTRUCTION ON BROADWAY (ROUTE 107), FROM CITY HALL AVENUE TO THE REVERE C.L. | $ 9,027,904 | Quantified | Quantified Decrease in Emissions from Complete Streets Project | ||||
| Roadway Reconstruction | 608229 | Boston Region | Acton | ACTON- INTERSECTION & SIGNAL IMPROVEMENTS AT KELLEY'S CORNER, ROUTE 111 (MASSACHUSETTS AVENUE) AND ROUTE 27 (MAIN STREET) | 3 | CMAQ | $ 3,000,000 | $ 2,400,000 | $ 600,000 | Construction; CMAQ+TAP+STP Total Cost = $14,718,378; MPO Evaluation Score = 45 | 608229 | ACTON- INTERSECTION & SIGNAL IMPROVEMENTS AT KELLEY'S CORNER, ROUTE 111 (MASSACHUSETTS AVENUE) AND ROUTE 27 (MAIN STREET) | $ 3,000,000 | Quantified | 111,958 | Quantified Decrease in Emissions from Complete Streets Project | |||
| Roadway Reconstruction | 608229 | Boston Region | Acton | ACTON- INTERSECTION & SIGNAL IMPROVEMENTS AT KELLEY'S CORNER, ROUTE 111 (MASSACHUSETTS AVENUE) AND ROUTE 27 (MAIN STREET) | 3 | STP | $ 11,518,378 | $ 9,214,702 | $ 2,303,676 | Construction; CMAQ+TAP+STP Total Cost = $14,718,378; MPO Evaluation Score = 45 | 608229 | ACTON- INTERSECTION & SIGNAL IMPROVEMENTS AT KELLEY'S CORNER, ROUTE 111 (MASSACHUSETTS AVENUE) AND ROUTE 27 (MAIN STREET) | $ 11,518,378 | Quantified | Quantified Decrease in Emissions from Complete Streets Project | ||||
| Roadway Reconstruction | 608229 | Boston Region | Acton | ACTON- INTERSECTION & SIGNAL IMPROVEMENTS AT KELLEY'S CORNER, ROUTE 111 (MASSACHUSETTS AVENUE) AND ROUTE 27 (MAIN STREET) | 3 | TAP | $ 200,000 | $ 160,000 | $ 40,000 | Construction; CMAQ+TAP+STP Total Cost = $14,718,378; MPO Evaluation Score = 45; TAP project proponent = Acton | 608229 | ACTON- INTERSECTION & SIGNAL IMPROVEMENTS AT KELLEY'S CORNER, ROUTE 111 (MASSACHUSETTS AVENUE) AND ROUTE 27 (MAIN STREET) | $ 200,000 | Quantified | Quantified Decrease in Emissions from Complete Streets Project | ||||
| Regionally Prioritized Projects subtotal ► | $ 106,584,302 | $ 85,530,614 | $ 21,053,688 | ◄ 80% Federal + 20% Non-Federal | Quantified Impact ► | 1,905,137 | |||||||||||||
| ►Section 1A / Fiscal Constraint Analysis | |||||||||||||||||||
| Total Regional Federal Aid Funds Programmed ► | $ 106,584,302 | $ 106,681,829 | ◄Total Budget | $ 97,527 | Target Funds Available | ||||||||||||||
| Section 1A instructions: MPO Template Name) Choose Regional Name from dropdown list to populate header and MPO column; Column C) Enter ID from ProjectInfo; Column E) Choose Municipality Name from dropdown list; Column H) Choose the Funding Source being used for the project - if multiple funding sources are being used enter multiple lines; Column I) Enter the total amount of funds being programmed in this fiscal year and for each funding source; Column J) Federal funds autocalculates. Please verify the amount and only change if needed for flex. Column K) Non-federal funds autocalculates. Please verify the split/match - if matching an FTA flex, coordinate with Rail & Transit Division before programming; Column L) Enter Additional Information as described - please do not use any other format. | STP programmed ► | $ 77,944,846 | $ 62,355,877 | ◄ STP | |||||||||||||||
| HSIP programmed ► | $ 2,631,724 | $ 2,368,552 | ◄ HSIP | ||||||||||||||||
| CMAQ programmed ► | $ 23,674,742 | $ 18,939,794 | ◄ CMAQ | ||||||||||||||||
| TAP programmed ► | $ 2,332,990 | $ 1,866,392 | ◄ TAP | ||||||||||||||||
| ►Section 1B / Earmark or Discretionary Grant Funded Projects | ►Section 1B / Earmark or Discretionary Grant Funded Projects | ||||||||||||||||||
| ►Other Federal Aid | ►Other Federal Aid | ||||||||||||||||||
| Boston Region | Other Federal Aid | HPP | $ - | $ - | $ - | 0 | Other Federal Aid | $ - | |||||||||||
| Boston Region | Other Federal Aid | HPP | $ - | $ - | $ - | 0 | Other Federal Aid | $ - | |||||||||||
| Other Federal Aid subtotal ► | $ - | $ - | $ - | ◄ Funding Split Varies by Funding Source | Quantified Impact ► | 0 | |||||||||||||
| ►Section 2A / State Prioritized Reliability Projects | ►Section 2A / State Prioritized Reliability Projects | ||||||||||||||||||
| ►Bridge Program / Inspections | ►Bridge Program / Inspections | ||||||||||||||||||
| Bridge Program | Boston Region | Bridge Inspection | $ - | $ - | $ - | 0 | Bridge Inspection | $ - | |||||||||||
| Bridge Program | Boston Region | Bridge Inspection | $ - | $ - | $ - | 0 | Bridge Inspection | $ - | |||||||||||
| Bridge Program / Inspections subtotal ► | $ - | $ - | $ - | ◄ Funding Split Varies by Funding Source | Quantified Impact ► | 0 | |||||||||||||
| ►Bridge Program / Off-System | ►Bridge Program / Off-System | ||||||||||||||||||
| Bridge Program | Boston Region | Bridge Program / Off-System | $ - | $ - | $ - | 0 | Bridge Program / Off-System | $ - | |||||||||||
| Bridge Program | Boston Region | Bridge Program / Off-System | $ - | $ - | $ - | 0 | Bridge Program / Off-System | $ - | |||||||||||
| Bridge Program | Boston Region | Bridge Program / Off-System | $ - | $ - | $ - | 0 | Bridge Program / Off-System | $ - | |||||||||||
| Bridge Program | Boston Region | Bridge Program / Off-System | $ - | $ - | $ - | 0 | Bridge Program / Off-System | $ - | |||||||||||
| Bridge Program | Boston Region | Bridge Program / Off-System | $ - | $ - | $ - | 0 | Bridge Program / Off-System | $ - | |||||||||||
| Bridge Program | Boston Region | Bridge Program / Off-System | $ - | $ - | $ - | 0 | Bridge Program / Off-System | $ - | |||||||||||
| Bridge Program | Boston Region | Bridge Program / Off-System | $ - | $ - | $ - | 0 | Bridge Program / Off-System | $ - | |||||||||||
| Bridge Program / Off-System subtotal ► | $ - | $ - | $ - | ◄ 80% Federal + 20% Non-Federal | Quantified Impact ► | 0 | |||||||||||||
| ►Bridge Program / On-System (NHS) | ►Bridge Program / On-System (NHS) | ||||||||||||||||||
| Bridge Program | 608614 | Boston Region | BOSTON | BOSTON- BRIDGE SUBSTRUCTURE REPAIRS, B-16-179, AUSTIN STREET OVER I-93 RAMPS, MBTA COMMUTER RAIL AND ORANGE LINE | 6 | NHPP-On | $ 22,132,800 | $ 17,706,240 | $ 4,426,560 | 608614 | BOSTON- BRIDGE SUBSTRUCTURE REPAIRS, B-16-179, AUSTIN STREET OVER I-93 RAMPS, MBTA COMMUTER RAIL AND ORANGE LINE | $ 22,132,800 | Qualitative | No assumed impact/negligible impact on emissions | |||||
| Bridge Program | 607327 | Boston Region | WILMINGTON | WILMINGTON- BRIDGE REPLACEMENT, W-38-002, ROUTE 38 (MAIN STREET) OVER THE B&M RAILROAD | 4 | NHPP-On | $ 10,760,960 | $ 8,608,768 | $ 2,152,192 | 607327 | WILMINGTON- BRIDGE REPLACEMENT, W-38-002, ROUTE 38 (MAIN STREET) OVER THE B&M RAILROAD | $ 10,760,960 | Qualitative | No assumed impact/negligible impact on emissions | |||||
| Bridge Program | 604173 | Boston Region | BOSTON | BOSTON- BRIDGE REPLACEMENT, B-16-016, NORTH WASHINGTON STREET OVER THE BOSTON INNER HARBOR | 6 | NHPP-On | $ 22,621,004 | $ 18,096,803 | $ 4,524,201 | AC Year 6 of 6, Total Cost $193,058,158 | 604173 | BOSTON- BRIDGE REPLACEMENT, B-16-016, NORTH WASHINGTON STREET OVER THE BOSTON INNER HARBOR | $ 22,621,004 | Qualitative | No assumed impact/negligible impact on emissions | ||||
| Bridge Program | 604952 | Boston Region | Multiple | LYNN- SAUGUS- BRIDGE REPLACEMENT, L-18-016=S-05-008, ROUTE 107 OVER THE SAUGUS RIVER (AKA - BELDEN G. BLY BRIDGE) | 4 | NHPP-On | $ 21,746,735 | $ 17,397,388 | $ 4,349,347 | AC Year 4 of 5, Total Cost $74,471,140 | |||||||||
| Bridge Program | Boston Region | Bridge Program / On-System (NHS) | $ - | $ - | $ - | 0 | Bridge Program / On-System (NHS) | $ - | |||||||||||
| Bridge Program / On-System (NHS) subtotal ► | $ 77,261,499 | $ 61,809,199 | $ 15,452,300 | ◄ Funding Split Varies by Funding Source | Quantified Impact ► | 0 | |||||||||||||
| ►Bridge Program / On-System (Non-NHS) | ►Bridge Program / On-System (Non-NHS) | ||||||||||||||||||
| Bridge Program | 608929 | Boston Region | WILMINGTON | WILMINGTON- BRIDGE REPLACEMENT, W-38-003, BUTTERS ROW OVER MBTA | 4 | NHPP-Off | $ 5,183,360 | $ 4,146,688 | $ 1,036,672 | 608929 | WILMINGTON- BRIDGE REPLACEMENT, W-38-003, BUTTERS ROW OVER MBTA | $ 5,183,360 | Qualitative | No assumed impact/negligible impact on emissions | |||||
| Bridge Program | Boston Region | NHPP-Off | $ - | $ - | 0 | 0 | $ - | ||||||||||||
| Bridge Program / On-System (Non-NHS) subtotal ► | $ 5,183,360 | $ 4,146,688 | $ 1,036,672 | ◄ 80% Federal + 20% Non-Federal | Quantified Impact ► | 0 | |||||||||||||
| ►Bridge Program / Systematic Maintenance | ►Bridge Program / Systematic Maintenance | ||||||||||||||||||
| Bridge Program | 608866 | Boston Region | NEWTON- WESTON | NEWTON- WESTON- STEEL SUPERSTRUCTURE CLEANING (FULL REMOVAL) AND PAINTING OF 3 BRIDGES: N-12-051, W-29-011 & W-29-028 | 6 | NHPP-On | $ 2,349,900 | $ 1,879,920 | $ 469,980 | 608866 | NEWTON- WESTON- STEEL SUPERSTRUCTURE CLEANING (FULL REMOVAL) AND PAINTING OF 3 BRIDGES: N-12-051, W-29-011 & W-29-028 | $ 2,349,900 | Qualitative | No assumed impact/negligible impact on emissions | |||||
| Bridge Program / Systematic Maintenance subtotal ► | $ 2,349,900 | $ 1,879,920 | $ 469,980 | ◄ Funding Split Varies by Funding Source | Quantified Impact ► | 0 | |||||||||||||
| ►Interstate Pavement | ►Interstate Pavement | ||||||||||||||||||
| Interstate Pavement | 608210 | Boston Region | Multiple | FOXBOROUGH- PLAINVILLE- WRENTHAM- FRANKLIN I.M. RESURFACING WORK ON I-495 | 5 | NHPP | $ 11,497,920 | $ 10,348,128 | $ 1,149,792 | 608210 | FOXBOROUGH- PLAINVILLE- WRENTHAM- FRANKLIN I.M. RESURFACING WORK ON I-495 | $ 11,497,920 | Qualitative | Qualitative Decrease in Emissions | |||||
| Insterstate Pavement subtotal ► | $ 11,497,920 | $ 10,348,128 | $ 1,149,792 | ◄ 90% Federal + 10% Non-Federal | Quantified Impact ► | 0 | |||||||||||||
| ►Non-Interstate Pavement | ►Non-Interstate Pavement | ||||||||||||||||||
| Non-Interstate Pavement | 608817 | Boston Region | Multiple | SALEM- LYNN- RESURFACING AND RELATED WORK ON RTE 107 | 4 | NHPP | $ 2,527,560 | $ 2,022,048 | $ 505,512 | 608817 | SALEM- LYNN- RESURFACING AND RELATED WORK ON RTE 107 | $ 2,527,560 | Qualitative | Qualitative Decrease in Emissions | |||||
| Non-Interstate Pavement | 608498 | Boston Region | Multiple | HINGHAM- WEYMOUTH- BRAINTREE- RESURFACING AND RELATED WORK ON ROUTE 53 | 6 | NHPP | $ 7,929,600 | $ 6,343,680 | $ 1,585,920 | 608498 | HINGHAM- WEYMOUTH- BRAINTREE- RESURFACING AND RELATED WORK ON ROUTE 53 | $ 7,929,600 | Qualitative | Qualitative Decrease in Emissions | |||||
| Non-Interstate Pavement | 608818 | Boston Region | DANVERS | DANVERS- RESURFACING AND RELATED WORK ON ROUTE 114 | 4 | NHPP | $ 1,850,240 | $ 1,480,192 | $ 370,048 | 608818 | DANVERS- RESURFACING AND RELATED WORK ON ROUTE 114 | $ 1,850,240 | Qualitative | Qualitative Decrease in Emissions | |||||
| Non-Interstate Pavement subtotal ► | $ 12,307,400 | $ 9,845,920 | $ 2,461,480 | ◄ 80% Federal + 20% Non-Federal | Quantified Impact ► | 0 | |||||||||||||
| ► Roadway Improvements | ► Roadway Improvements | ||||||||||||||||||
| Roadway Improvements | 608599 | Boston Region | Multiple | CANTON- SHARON- FOXBOROUGH- NORWOOD-WALPOLE- STORMWATER IMPROVEMENTS ALONG ROUTE 1, ROUTE 1A & INTERSTATE 95 | 5 | STP-TE | $ 526,235 | $ 420,988 | $ 105,247 | 608599 | CANTON- SHARON- FOXBOROUGH- NORWOOD-WALPOLE- STORMWATER IMPROVEMENTS ALONG ROUTE 1, ROUTE 1A & INTERSTATE 95 | $ 526,235 | Qualitative | No assumed impact/negligible impact on emissions | |||||
| Roadway Improvements | Boston Region | Roadway Improvements | $ - | $ - | $ - | Roadway Improvements | $ - | ||||||||||||
| Roadway Improvements | Boston Region | Roadway Improvements | $ - | $ - | $ - | 0 | Roadway Improvements | $ - | |||||||||||
| Roadway Improvements subtotal ► | $ 526,235 | $ 420,988 | $ 105,247 | ◄ 80% Federal + 20% Non-Federal | Quantified Impact ► | 0 | |||||||||||||
| ► Safety Improvements | ► Safety Improvements | ||||||||||||||||||
| Safety Improvements | Boston Region | Safety Improvements | $ - | $ - | $ - | 0 | Safety Improvements | $ - | |||||||||||
| Safety Improvements | Boston Region | Safety Improvements | $ - | $ - | $ - | 0 | Safety Improvements | $ - | |||||||||||
| Safety Improvements | Boston Region | Safety Improvements | $ - | $ - | $ - | 0 | Safety Improvements | $ - | |||||||||||
| Safety Improvements | Boston Region | Safety Improvements | $ - | $ - | $ - | 0 | Safety Improvements | $ - | |||||||||||
| Safety Improvements | Boston Region | Safety Improvements | $ - | $ - | $ - | 0 | Safety Improvements | $ - | |||||||||||
| Safety Improvements | Boston Region | Safety Improvements | $ - | $ - | $ - | 0 | Safety Improvements | $ - | |||||||||||
| Safety Improvements subtotal ► | $ - | $ - | $ - | ◄ Funding Split Varies by Funding Source | Quantified Impact ► | 0 | |||||||||||||
| ►Section 2B / State Prioritized Modernization Projects | ►Section 2B / State Prioritized Modernization Projects | ||||||||||||||||||
| ► ADA Retrofits | ► ADA Retrofits | ||||||||||||||||||
| ADA Retrofits | Boston Region | ADA Retrofits | $ - | $ - | $ - | 0 | ADA Retrofits | $ - | |||||||||||
| ADA Retrofits | Boston Region | ADA Retrofits | $ - | $ - | $ - | 0 | ADA Retrofits | $ - | |||||||||||
| ADA Retrofits subtotal ► | $ - | $ - | $ - | ◄ 80% Federal + 20% Non-Federal | Quantified Impact ► | 0 | |||||||||||||
| ►Intersection Improvements | ►Intersection Improvements | ||||||||||||||||||
| Intersection Improvements | 608567 | Boston Region | Peabody | PEABODY- IMPROVEMENTS AT ROUTE 114 AT SYLVAN STREET, CROSS STREET, NORTHSHORE MALL, LORIS ROAD, ROUTE 128 INTERCHANGE AND ESQUIRE DRIVE | 4 | HSIP | $ 3,200,000 | $ 2,880,000 | $ 320,000 | 608567 | PEABODY- IMPROVEMENTS AT ROUTE 114 AT SYLVAN STREET, CROSS STREET, NORTHSHORE MALL, LORIS ROAD, ROUTE 128 INTERCHANGE AND ESQUIRE DRIVE | $ 3,200,000 | Qualitative | Qualitative Decrease in Emissions | |||||
| Intersection Improvements | 608569 | Boston Region | Quincy | QUINCY- INTERSECTION IMPROVEMENTS AT ROUTE 3A (SOUTHERN ARTERY) AND BROAD STREET | 6 | HSIP | $ 4,000,000 | $ 3,600,000 | $ 400,000 | 608569 | QUINCY- INTERSECTION IMPROVEMENTS AT ROUTE 3A (SOUTHERN ARTERY) AND BROAD STREET | $ 4,000,000 | Qualitative | Qualitative Decrease in Emissions | |||||
| Intersection Improvements subtotal ► | $ 7,200,000 | $ 6,480,000 | $ 720,000 | ◄ Funding Split Varies by Funding Source | Quantified Impact ► | 0 | |||||||||||||
| ►Intelligent Transportation Systems | ►Intelligent Transportation Systems | ||||||||||||||||||
| Intelligent Transportation Systems | Boston Region | Intelligent Transportation Systems | $ - | $ - | $ - | 0 | Intelligent Transportation Systems | $ - | |||||||||||
| Intelligent Transportation Systems | Boston Region | Intelligent Transportation Systems | $ - | $ - | $ - | 0 | Intelligent Transportation Systems | $ - | |||||||||||
| Intelligent Transportation Systems | Boston Region | Intelligent Transportation Systems | $ - | $ - | $ - | 0 | Intelligent Transportation Systems | $ - | |||||||||||
| Intelligent Transportation System subtotal ► | $ - | $ - | $ - | ◄ 80% Federal + 20% Non-Federal | Quantified Impact ► | 0 | |||||||||||||
| ►Roadway Reconstruction | ►Roadway Reconstruction | ||||||||||||||||||
| Roadway Reconstruction | 607977 | Boston Region | Multiple | HOPKINTON- WESTBOROUGH- RECONSTRUCTION OF I-90/I-495 INTERCHANGE | 3 | NFP | $ 27,500,000 | $ 22,000,000 | $ 5,500,000 | Total Federal Participating Cost (TFPC) = $189,451,000; Total Construction Cost (TCC) = $270,000,000; AC Yr 1 of 6 | 607977 | HOPKINTON- WESTBOROUGH- RECONSTRUCTION OF I-90/I-495 INTERCHANGE | $ 27,500,000 | Quantified | LRTP project included in the statewide model | ||||
| Roadway Reconstruction | 607977 | Boston Region | Multiple | HOPKINTON- WESTBOROUGH- RECONSTRUCTION OF I-90/I-495 INTERCHANGE | 3 | NHPP | $ 12,233,939 | $ 9,787,151 | $ 2,446,788 | Total Federal Participating Cost (TFPC) = $189,451,000; Total Construction Cost (TCC) = $270,000,000; AC Yr 1 of 6 | 607977 | HOPKINTON- WESTBOROUGH- RECONSTRUCTION OF I-90/I-495 INTERCHANGE | $ 12,233,939 | Quantified | LRTP project included in the statewide model | ||||
| Roadway Reconstruction subtotal ► | $ 39,733,939 | $ 31,787,151 | $ 7,946,788 | ◄ Funding Split Varies by Funding Source | Quantified Impact ► | 0 | |||||||||||||
| ►Section 2C / State Prioritized Expansion Projects | ►Section 2C / State Prioritized Expansion Projects | ||||||||||||||||||
| ►Bicycles and Pedestrians | ►Bicycles and Pedestrians | ||||||||||||||||||
| Bicycles and Pedestrians | Boston Region | Bicycles and Pedestrians | $ - | $ - | $ - | 0 | Bicycles and Pedestrians | $ - | |||||||||||
| Bicycles and Pedestrians | Boston Region | Bicycles and Pedestrians | $ - | $ - | $ - | 0 | Bicycles and Pedestrians | $ - | |||||||||||
| Bicycles and Pedestrians | Boston Region | Bicycles and Pedestrians | $ - | $ - | $ - | 0 | Bicycles and Pedestrians | $ - | |||||||||||
| Bicycles and Pedestrians subtotal ► | $ - | $ - | $ - | ◄ 80% Federal + 20% Non-Federal | Quantified Impact ► | 0 | |||||||||||||
| ►Capacity | ►Capacity | ||||||||||||||||||
| Capacity | Boston Region | Capacity | $ - | $ - | $ - | 0 | Capacity | $ - | |||||||||||
| Capacity | Boston Region | Capacity | $ - | $ - | $ - | 0 | Capacity | $ - | |||||||||||
| Capacity subtotal ► | $ - | $ - | $ - | ◄ Funding Split Varies by Funding Source | Quantified Impact ► | 0 | |||||||||||||
| ►Section 3 / Planning / Adjustments / Pass-throughs | ►Section 3 / Planning / Adjustments / Pass-throughs | ||||||||||||||||||
| ►Planning / Adjustments / Pass-throughs | ►Planning / Adjustments / Pass-throughs | ||||||||||||||||||
| Boston Region | ABP GANS Repayment | Multiple | $ - | $ - | $ - | 0 | ABP GANS Repayment | $ - | |||||||||||
| Boston Region | ABP GANS Repayment | Multiple | $ - | $ - | $ - | 0 | ABP GANS Repayment | $ - | |||||||||||
| Boston Region | Award adjustments, change orders, etc. | Multiple | $ - | $ - | $ - | 0 | Award adjustments, change orders, etc. | $ - | |||||||||||
| Boston Region | Award adjustments, change orders, etc. | Multiple | $ - | $ - | $ - | 0 | Award adjustments, change orders, etc. | $ - | |||||||||||
| Boston Region | Award adjustments, change orders, etc. | Multiple | $ - | $ - | $ - | 0 | Award adjustments, change orders, etc. | $ - | |||||||||||
| Boston Region | Award adjustments, change orders, etc. | Multiple | $ - | $ - | $ - | 0 | Award adjustments, change orders, etc. | $ - | |||||||||||
| Boston Region | Metropolitan Planning | Multiple | $ - | $ - | $ - | 0 | Metropolitan Planning | $ - | |||||||||||
| Boston Region | Metropolitan Planning | Multiple | $ - | $ - | $ - | 0 | Metropolitan Planning | $ - | |||||||||||
| Boston Region | State Planning and Research Work Program I, (SPR I), Planning | Multiple | $ - | $ - | $ - | 0 | State Planning and Research Work Program I, (SPR I), Planning | $ - | |||||||||||
| Boston Region | State Planning and Research Work Program II, (SPR II), Research | Multiple | $ - | $ - | $ - | 0 | State Planning and Research Work Program II, (SPR II), Research | $ - | |||||||||||
| Boston Region | Railroad Crossings | Multiple | $ - | $ - | $ - | 0 | Railroad Crossings | $ - | |||||||||||
| Boston Region | Railroad Crossings | Multiple | $ - | $ - | $ - | 0 | Railroad Crossings | $ - | |||||||||||
| Boston Region | Recreational Trails | Multiple | $ - | $ - | $ - | 0 | Recreational Trails | $ - | |||||||||||
| Other Statewide Items subtotal ► | $ - | $ - | $ - | ◄ Funding Split Varies by Funding Source | Quantified Impact ► | 0 | |||||||||||||
| ►Section 4 / Non-Federally Aided Projects | ►Section 2A / Non-Federal Projects | ||||||||||||||||||
| ►Non-Federally Aided Projects | ►Non-Federally Aided Projects | ||||||||||||||||||
| Non Federal Aid | 607977 | Boston Region | Multiple | HOPKINTON- WESTBOROUGH- RECONSTRUCTION OF I-90/I-495 INTERCHANGE | 3 | NFA | $ 18,112,483 | $ 18,112,483 | Total Federal Participating Cost (TFPC) = $189,451,000; Total Construction Cost (TCC) = $270,000,000; AC Yr 1 of 6 | 607977 | HOPKINTON- WESTBOROUGH- RECONSTRUCTION OF I-90/I-495 INTERCHANGE | $ 18,112,483 | Quantified | LRTP project included in the statewide model | |||||
| Non-Federally Aided Projects | Boston Region | Non-Federal Aid | $ - | $ - | 0 | Non-Federal Aid | $ - | ||||||||||||
| Non-Federal Aid subtotal► | $ 18,112,483 | $ 18,112,483 | ◄100% Non-Federal | Quantified Impact ► | 0 | ||||||||||||||
| 2022 Summary | TIP Section 1 - 3: ▼ | TIP Section 4: ▼ | Total of All Projects ▼ | 2022 X Region MPO GHG Tracking Summary | Total Quantified Impact ▼ | ||||||||||||||
| Total ► | $ 262,644,555 | $ 18,112,483 | $ 280,757,038 | ◄ Total Spending in Region | Quantified Impact ► | 1,905,137 | |||||||||||||
| Federal Funds ► | $ 212,248,608 | $ 212,248,608 | ◄ Total Federal Spending in Region | ||||||||||||||||
| Non-Federal Funds ► | $ 50,395,947 | $ 18,112,483 | $ 68,508,430 | ◄ Total Non-Federal Spending in Region | |||||||||||||||
| 701 CMR 7.00 Use of Road Flaggers and Police Details on Public Works Projects / 701 CMR 7.00 (the Regulation) was promulgated and became law on October 3, 2008. Under this Regulation, the CMR is applicable to any Public works Project that is performed within the limits of, or that impact traffic on, any Public Road. The Municipal Limitation referenced in this Regulation is applicable only to projects where the Municipality is the Awarding Authority. For all projects contained in the TIP, the Commonwealth is the Awarding Authority. Therefore, all projects must be considered and implemented in accordance with 701 CMR 7.00, and the Road Flagger and Police Detail Guidelines. By placing a project on the TIP, the Municipality acknowledges that 701 CMR 7.00 is applicable to its project and design and construction will be fully compliant with this Regulation. This information, and additional information relative to guidance and implementation of the Regulation can be found at the following link on the MassDOT Highway Division website: http://www.massdot.state.ma.us/Highway/flaggers/main.aspx | |||||||||||||||||||
| Transportation Improvement Program (TIP) | ||||||||||
| Project List (FY2022) | ||||||||||
| FTA Program | Project Number | Transit Agency | FTA Activity Line Item | Project Description | Carryover (unobligated) | Federal Funds | State Funds | TDC | Local Funds | Total Cost |
| 5307 | ||||||||||
| 5307 | RTD0006607 | Cape Ann Transportation Authority | 117A00 | PREVENTIVE MAINTENANCE | 2021 - $285,000 | $285,000 | $0 | $0 | $71,250 | $356,250 |
| 5307 | RTD0006608 | Cape Ann Transportation Authority | 114206 | ACQUIRE - SHOP EQUIPMENT | 2021 - $55,000 | $55,000 | $13,750 | $0 | $0 | $68,750 |
| 5307 | RTD0007097 | MetroWest Regional Transit Authority | 117C00 | NON FIXED ROUTE ADA PARA SERV | 2021 - $1,300,000 | $1,300,000 | $325,000 | $0 | $0 | $1,625,000 |
| 5307 | RTD0007098 | MetroWest Regional Transit Authority | 114200 | ACQUISITION OF BUS SUPPORT EQUIP/FACILITIES | 2021 - $248,415 | $248,415 | $62,104 | $0 | $0 | $310,519 |
| 5307 | RTD0007099 | MetroWest Regional Transit Authority | 113403 | TERMINAL, INTERMODAL (TRANSIT) - BLANDIN | 2021 - $150,000 | $150,000 | $37,500 | $0 | $0 | $187,500 |
| 5307 | RTD0007100 | MetroWest Regional Transit Authority | 440000 | Mobility Management | 2021 - $25,000 | $25,000 | $6,250 | $0 | $0 | $31,250 |
| 5307 | RTD0007076 | Massachusetts Bay Transportation Authority (MBTA) | 121200 | Revenue Vehicle Program - 5307 | $146,121,933 | $0 | $0 | $36,530,483 | $182,652,416 | |
| Subtotal | $148,185,348 | $444,604 | $0 | $36,601,733 | $185,231,685 | |||||
| 5309 | ||||||||||
| 5309 | RTD0007339 | Massachusetts Bay Transportation Authority (MBTA) | 133302 | Green Line Extension | $46,121,000 | $0 | $0 | $46,121,000 | $92,242,000 | |
| Subtotal | $46,121,000 | $0 | $0 | $46,121,000 | $92,242,000 | |||||
| 5310 | ||||||||||
| Subtotal | $0 | $0 | $0 | $0 | $0 | |||||
| 5311 | ||||||||||
| Subtotal | $0 | $0 | $0 | $0 | $0 | |||||
| 5337 | ||||||||||
| 5337 | RTD0007078 | Massachusetts Bay Transportation Authority (MBTA) | 122405 | Bridge & Tunnel Program - 5337 | $80,000,000 | $0 | $0 | $20,000,000 | $100,000,000 | |
| 5337 | RTD0007079 | Massachusetts Bay Transportation Authority (MBTA) | 123400 | Stations and Facilities Program - 5337 | $25,893,004 | $0 | $0 | $6,473,251 | $32,366,255 | |
| 5337 | RTD0007080 | Massachusetts Bay Transportation Authority (MBTA) | 126301 | Signals/Systems Upgrade Program - 5337 | $40,000,000 | $0 | $0 | $10,000,000 | $50,000,000 | |
| Subtotal | $145,893,004 | $0 | $0 | $36,473,251 | $182,366,255 | |||||
| 5339 | ||||||||||
| 5339 | RTD0007081 | Massachusetts Bay Transportation Authority (MBTA) | 111400 | Bus Program - 5339 | $5,683,653 | $0 | $0 | $1,420,913 | $7,104,566 | |
| Subtotal | $5,683,653 | $0 | $0 | $1,420,913 | $7,104,566 | |||||
| 5320 | ||||||||||
| Subtotal | $0 | $0 | $0 | $0 | $0 | |||||
| Other Federal | ||||||||||
| Subtotal | $0 | $0 | $0 | $0 | $0 | |||||
| Other Non-Federal | ||||||||||
| Subtotal | $0 | $0 | $0 | $0 | $0 | |||||
| Total | $345,883,005 | $444,604 | $0 | $120,616,897 | $466,944,506 | |||||
| Funds listed under the Carry Over column are included in the Federal Amount | ||||||||||
| 2023 | Boston Region Transportation Improvement Program | |||||||||||
| Amendment / Adjustment Type ▼ |
STIP Program ▼ | MassDOT Project ID ▼ | Metropolitan Planning Organization ▼ | Municipality Name ▼ | MassDOT Project Description▼ | MassDOT District ▼ | Funding Source ▼ | Total Programmed Funds ▼ | Federal Funds ▼ | Non-Federal Funds ▼ | Additional Information ▼ Present information as follows, if applicable: a) Planning / Design / or Construction; b) total project cost and funding sources used; c) advance construction status; d) MPO project score; e) name of entity receiving a transfer; f) name of entity paying the non-state non-federal match; g) earmark details; h) TAP project proponent; i) other information | |
| ►Section 1A / Regionally Prioritized Projects | ||||||||||||
| ►Regionally Prioritized Projects | ||||||||||||
| Roadway Reconstruction | 606226 | Boston Region | Boston | BOSTON- RECONSTRUCTION OF RUTHERFORD AVENUE, FROM CITY SQUARE TO SULLIVAN SQUARE | 6 | NHPP | $ 13,000,000 | $ 10,400,000 | $ 2,600,000 | Construction; NHPP+STP+TAP Total Cost = $152,000,000; AC Yr 4 of 5; Total funding in this TIP = $116,626,515; MPO Evaluation Score = 59 | ||
| Roadway Reconstruction | 606226 | Boston Region | Boston | BOSTON- RECONSTRUCTION OF RUTHERFORD AVENUE, FROM CITY SQUARE TO SULLIVAN SQUARE | 6 | STP | $ 26,000,000 | $ 20,800,000 | $ 5,200,000 | Construction; NHPP+STP+TAP Total Cost = $152,000,000; AC Yr 4 of 5; Total funding in this TIP = $116,626,515; MPO Evaluation Score = 59 | ||
| Roadway Reconstruction | 606226 | Boston Region | Boston | BOSTON- RECONSTRUCTION OF RUTHERFORD AVENUE, FROM CITY SQUARE TO SULLIVAN SQUARE | 6 | TAP | $ 1,000,000 | $ 800,000 | $ 200,000 | Construction; NHPP+STP+TAP Total Cost = $152,000,000; AC Yr 4 of 5; Total funding in this TIP = $116,626,515; MPO Evaluation Score = 59; TAP Proponent = Boston | ||
| Roadway Reconstruction | 608348 | Boston Region | Beverly | BEVERLY - RECONSTRUCTION OF BRIDGE STREET | 4 | CMAQ | $ 3,000,000 | $ 2,400,000 | $ 600,000 | Construction; CMAQ+STP Total Cost = $6,124,800; MPO Evaluation Score = 66 | ||
| Roadway Reconstruction | 608348 | Boston Region | Beverly | BEVERLY - RECONSTRUCTION OF BRIDGE STREET | 4 | STP | $ 3,124,800 | $ 2,499,840 | $ 624,960 | Construction; CMAQ+STP Total Cost = $6,124,800; MPO Evaluation Score = 66 | ||
| Roadway Reconstruction | 608933 | Boston Region | Peabody | PEABODY - REHABILITATION OF CENTRAL STREET | 4 | CMAQ | $ 3,000,000 | $ 2,400,000 | $ 600,000 | Construction; CMAQ+HSIP+STP Total Cost = $11,205,600; MPO Evaluation Score = 61 | ||
| Roadway Reconstruction | 608933 | Boston Region | Peabody | PEABODY - REHABILITATION OF CENTRAL STREET | 4 | HSIP | $ 1,500,000 | $ 1,350,000 | $ 150,000 | Construction; CMAQ+HSIP+STP Total Cost = $11,205,600; MPO Evaluation Score = 61 | ||
| Roadway Reconstruction | 608933 | Boston Region | Peabody | PEABODY - REHABILITATION OF CENTRAL STREET | 4 | STP | $ 6,705,600 | $ 5,364,480 | $ 1,341,120 | Construction; CMAQ+HSIP+STP Total Cost = $11,205,600; MPO Evaluation Score = 61 | ||
| Roadway Reconstruction | 607244 | Boston Region | Winthrop | WINTHROP - RECONSTRUCTION & RELATED WORK ALONG WINTHROP STREET & REVERE STREET CORRIDOR | 6 | CMAQ | $ 2,000,000 | $ 1,600,000 | $ 400,000 | Construction; CMAQ+STP+TAP Total Cost = $4,060,000; MPO Evaluation Score = 47 | ||
| Roadway Reconstruction | 607244 | Boston Region | Winthrop | WINTHROP - RECONSTRUCTION & RELATED WORK ALONG WINTHROP STREET & REVERE STREET CORRIDOR | 6 | STP | $ 1,500,000 | $ 1,200,000 | $ 300,000 | Construction; CMAQ+STP+TAP Total Cost = $4,060,000; MPO Evaluation Score = 47 | ||
| Roadway Reconstruction | 607244 | Boston Region | Winthrop | WINTHROP - RECONSTRUCTION & RELATED WORK ALONG WINTHROP STREET & REVERE STREET CORRIDOR | 6 | TAP | $ 560,000 | $ 448,000 | $ 112,000 | Construction; CMAQ+STP+TAP Total Cost = $4,060,000; MPO Evaluation Score = 54; TAP Proponent = Winthrop | ||
| Roadway Reconstruction | 605743 | Boston Region | Ipswich | IPSWICH - RESURFACING &RELATED WORK ON CENTRAL & SOUTH MAIN STREETS | 4 | STP | $ 2,500,000 | $ 2,000,000 | $ 500,000 | Construction; STP+TAP Total Cost = $3,019,550; MPO Evaluation Score = 47 | ||
| Roadway Reconstruction | 605743 | Boston Region | Ipswich | IPSWICH - RESURFACING &RELATED WORK ON CENTRAL & SOUTH MAIN STREETS | 4 | TAP | $ 519,550 | $ 415,640 | $ 103,910 | Construction; STP+TAP Total Cost = $3,019,550; MPO Evaluation Score = 47; TAP Proponent = Ipswich | ||
| Roadway Reconstruction | 608887 | Boston Region | Bellingham | BELLINGHAM - REHABILITATION AND RELATED WORK ON ROUTE 126, FROM DOUGLAS DRIVE TO ROUTE 140 | 3 | CMAQ | $ 2,000,000 | $ 1,600,000 | $ 400,000 | Construction; CMAQ+STP+TAP Total Cost = $6,960,000; MPO Evaluation Score = 45 | ||
| Roadway Reconstruction | 608887 | Boston Region | Bellingham | BELLINGHAM - REHABILITATION AND RELATED WORK ON ROUTE 126, FROM DOUGLAS DRIVE TO ROUTE 140 | 3 | STP | $ 4,000,000 | $ 3,200,000 | $ 800,000 | Construction; CMAQ+STP+TAP Total Cost = $6,960,000; MPO Evaluation Score = 45 | ||
| Roadway Reconstruction | 608887 | Boston Region | Bellingham | BELLINGHAM - REHABILITATION AND RELATED WORK ON ROUTE 126, FROM DOUGLAS DRIVE TO ROUTE 140 | 3 | TAP | $ 960,000 | $ 768,000 | $ 192,000 | Construction; CMAQ+STP+TAP Total Cost = $6,960,000; MPO Evaluation Score = 45; TAP Proponent = Bellingham | ||
| Roadway Reconstruction | 608707 | Boston Region | Quincy | QUINCY - RECONSTRUCTION OF SEA STREET | 6 | STP | $ 6,300,000 | $ 5,040,000 | $ 1,260,000 | Construction; STP+TAP Total Cost = $6,526,254; MPO Evaluation Score = 40 | ||
| Roadway Reconstruction | 608707 | Boston Region | Quincy | QUINCY - RECONSTRUCTION OF SEA STREET | 6 | TAP | $ 226,254 | $ 181,003 | $ 45,251 | Construction; STP+TAP Total Cost = $6,526,254; MPO Evaluation Score = 40; TAP Project Proponent = Quincy | ||
| Roadway Reconstruction | 608007 | Boston Region | Multiple | COHASSET/SCITUATE - CORRIDOR IMPROVMENTS AND RELATED WORK ON JUSTICE CUSHING HIGHWAY (ROUTE 3A), FROM BEECHWOOD STREET TO HENRY TURNER BAILEY ROAD | 5 | HSIP | $ 1,500,000 | $ 1,350,000 | $ 150,000 | Construction; HSIP+STP+TAP Total Cost = $4,640,232; MPO Evaluation Score = 37 | ||
| Roadway Reconstruction | 608007 | Boston Region | Multiple | COHASSET/SCITUATE - CORRIDOR IMPROVMENTS AND RELATED WORK ON JUSTICE CUSHING HIGHWAY (ROUTE 3A), FROM BEECHWOOD STREET TO HENRY TURNER BAILEY ROAD | 5 | STP | $ 3,000,000 | $ 2,400,000 | $ 600,000 | Construction; HSIP+STP+TAP Total Cost = $4,640,232; MPO Evaluation Score = 37 | ||
| Roadway Reconstruction | 608007 | Boston Region | Multiple | COHASSET/SCITUATE - CORRIDOR IMPROVMENTS AND RELATED WORK ON JUSTICE CUSHING HIGHWAY (ROUTE 3A), FROM BEECHWOOD STREET TO HENRY TURNER BAILEY ROAD | 5 | TAP | $ 140,232 | $ 112,186 | $ 28,046 | Construction; HSIP+STP+TAP Total Cost = $4,640,232; MPO Evaluation Score = 37; TAP Proponent = MassDOT | ||
| Roadway Reconstruction | 607899 | Boston Region | Dedham | DEDHAM - PEDESTRIAN IMPROVEMENTS ALONG BUSSEY STREET, INCLUDING SUPERSTRUCTURE REPLACEMENT, D-05-010, BUSSEY STREET OVER MOTHER BROOK | 6 | STP | $ 4,000,000 | $ 3,200,000 | $ 800,000 | Construction; STP+TAP Total Cost = $4,527,196; MPO Evaluation Score = 35 | ||
| Roadway Reconstruction | 607899 | Boston Region | Dedham | DEDHAM - PEDESTRIAN IMPROVEMENTS ALONG BUSSEY STREET, INCLUDING SUPERSTRUCTURE REPLACEMENT, D-05-010, BUSSEY STREET OVER MOTHER BROOK | 6 | TAP | $ 527,196 | $ 421,757 | $ 105,439 | Construction; STP+TAP Total Cost = $4,527,196; MPO Evaluation Score = 35; TAP Proponent = Dedham | ||
| Intersection Improvements | 603739 | Boston Region | Wrentham | WRENTHAM - CONSTRUCTION OF A SLIP RAMP FROM ROUTE 1A NB TO I-495 SB AND ASSCOCIATED INTERSECTION IMPROVEMENTS ALONG ROUTE 1A | 5 | HSIP | $ 2,500,000 | $ 2,250,000 | $ 250,000 | Construction; HSIP+STP+TAP Total Cost = $11,600,000; MPO Evaluation Score = 55 | ||
| Intersection Improvements | 603739 | Boston Region | Wrentham | WRENTHAM - CONSTRUCTION OF A SLIP RAMP FROM ROUTE 1A NB TO I-495 SB AND ASSCOCIATED INTERSECTION IMPROVEMENTS ALONG ROUTE 1A | 5 | STP | $ 8,600,000 | $ 6,880,000 | $ 1,720,000 | Construction; HSIP+STP+TAP Total Cost = $11,600,000; MPO Evaluation Score = 55 | ||
| Intersection Improvements | 603739 | Boston Region | Wrentham | WRENTHAM - CONSTRUCTION OF A SLIP RAMP FROM ROUTE 1A NB TO I-495 SB AND ASSCOCIATED INTERSECTION IMPROVEMENTS ALONG ROUTE 1A | 5 | TAP | $ 500,000 | $ 400,000 | $ 100,000 | Construction; HSIP+STP+TAP Total Cost = $11,600,000; MPO Evaluation Score = 55; TAP Proponent = MassDOT | ||
| Intersection Improvements | 607305 | Boston Region | Reading | READING - INTERSECTION SIGNALIZATION @ ROUTE 28 & HOPKINS STREET | 4 | HSIP | $ 468,283 | $ 421,455 | $ 46,828 | Construction; HSIP+STP Total Cost = $1,468,283; MPO Evaluation Score = 38 | ||
| Intersection Improvements | 607305 | Boston Region | Reading | READING - INTERSECTION SIGNALIZATION @ ROUTE 28 & HOPKINS STREET | 4 | STP | $ 1,000,000 | $ 800,000 | $ 200,000 | Construction; HSIP+STP Total Cost = $1,468,283; MPO Evaluation Score = 38 | ||
| Intersection Improvements | 608443 | Boston Region | Multiple | LITTLETON- AYER - INTERSECTION IMPROVEMENTS ON ROUTE 2A AT WILLOW ROAD AND BRUCE STREET | 3 | HSIP | $ 1,000,000 | $ 900,000 | $ 100,000 | Construction; HSIP+STP Total Cost = $2,784,000; MPO Evaluation Score = 36 | ||
| Intersection Improvements | 608443 | Boston Region | Multiple | LITTLETON- AYER - INTERSECTION IMPROVEMENTS ON ROUTE 2A AT WILLOW ROAD AND BRUCE STREET | 3 | STP | $ 1,784,000 | $ 1,427,200 | $ 356,800 | Construction; HSIP+STP Total Cost = $2,784,000; MPO Evaluation Score = 36 | ||
| Planning / Adjustments / Pass-throughs | BN0009 | Boston Region | Multiple | COMMUNITY TRANSPORTATION PROGRAM | N/A | CMAQ | $ 2,000,000 | $ 1,600,000 | $ 400,000 | Planning, Design, or Construction; Set Aside for LRTP Clean Air and Mobility Program | ||
| Regionally Prioritized Projects subtotal ► | $ 104,915,915 | $ 84,629,560 | $ 20,286,355 | ◄ 80% Federal + 20% Non-Federal | ||||||||
| ►Section 1A / Fiscal Constraint Analysis | ||||||||||||
| Total Regional Federal Aid Funds Programmed ► | $ 104,915,915 | $ 109,011,849 | ◄Total Budget | $ 4,095,934 | Target Funds Available | |||||||
| Section 1A instructions: MPO Template Name) Choose Regional Name from dropdown list to populate header and MPO column; Column C) Enter ID from ProjectInfo; Column E) Choose Municipality Name from dropdown list; Column H) Choose the Funding Source being used for the project - if multiple funding sources are being used enter multiple lines; Column I) Enter the total amount of funds being programmed in this fiscal year and for each funding source; Column J) Federal funds autocalculates. Please verify the amount and only change if needed for flex. Column K) Non-federal funds autocalculates. Please verify the split/match - if matching an FTA flex, coordinate with Rail & Transit Division before programming; Column L) Enter Additional Information as described - please do not use any other format. | STP programmed ► | $ 81,514,400 | $ 65,211,520 | ◄ STP | ||||||||
| HSIP programmed ► | $ 6,968,283 | $ 6,271,455 | ◄ HSIP | |||||||||
| CMAQ programmed ► | $ 12,000,000 | $ 9,600,000 | ◄ CMAQ | |||||||||
| TAP programmed ► | $ 4,433,232 | $ 3,546,586 | ◄ TAP | |||||||||
| ►Section 1B / Earmark or Discretionary Grant Funded Projects | ||||||||||||
| ►Other Federal Aid | ||||||||||||
| Boston Region | Other Federal Aid | HPP | $ - | $ - | $ - | |||||||
| Boston Region | Other Federal Aid | HPP | $ - | $ - | $ - | |||||||
| Other Federal Aid subtotal ► | $ - | $ - | $ - | ◄ Funding Split Varies by Funding Source | ||||||||
| ►Section 2A / State Prioritized Reliability Projects | ||||||||||||
| ►Bridge Program / Inspections | ||||||||||||
| Bridge Program | Boston Region | Bridge Inspection | $ - | $ - | $ - | |||||||
| Bridge Program | Boston Region | Bridge Inspection | $ - | $ - | $ - | |||||||
| Bridge Program / Inspections subtotal ► | $ - | $ - | $ - | ◄ Funding Split Varies by Funding Source | ||||||||
| ►Bridge Program / Off-System | ||||||||||||
| Bridge Program | Boston Region | Bridge Program / Off-System | $ - | $ - | $ - | |||||||
| Bridge Program | Boston Region | Bridge Program / Off-System | $ - | $ - | $ - | |||||||
| Bridge Program | Boston Region | Bridge Program / Off-System | $ - | $ - | $ - | |||||||
| Bridge Program | Boston Region | Bridge Program / Off-System | $ - | $ - | $ - | |||||||
| Bridge Program | Boston Region | Bridge Program / Off-System | $ - | $ - | $ - | |||||||
| Bridge Program | Boston Region | Bridge Program / Off-System | $ - | $ - | $ - | |||||||
| Bridge Program | Boston Region | Bridge Program / Off-System | $ - | $ - | $ - | |||||||
| Bridge Program / Off-System subtotal ► | $ - | $ - | $ - | ◄ 80% Federal + 20% Non-Federal | ||||||||
| ►Bridge Program / On-System (NHS) | ||||||||||||
| Bridge Program | 606902 | Boston Region | BOSTON | BOSTON- BRIDGE RECONSTRUCTION/REHAB, B-16-181, WEST ROXBURY PARKWAY OVER MBTA | 6 | NHPP-On | $ 6,900,000 | $ 5,520,000 | $ 1,380,000 | |||
| Bridge Program | 606728 | Boston Region | BOSTON | BOSTON- BRIDGE REPLACEMENT B-16-365, BOWKER OVERPASS OVER STORROW DRIVE (EB) | 6 | NHPP-On | $ 24,009,700 | $ 19,207,760 | $ 4,801,940 | |||
| Bridge Program | 604952 | Boston Region | Multiple | LYNN- SAUGUS- BRIDGE REPLACEMENT, L-18-016=S-05-008, ROUTE 107 OVER THE SAUGUS RIVER (AKA - BELDEN G. BLY BRIDGE) | 4 | NHPP-On | $ 5,907,595 | $ 4,726,076 | $ 1,181,519 | AC Year 5 of 5, Total Cost $74,471,140 | ||
| Bridge Program | Boston Region | NHPP-On | ||||||||||
| Bridge Program / On-System (NHS) subtotal ► | $ 36,817,295 | $ 29,453,836 | $ 7,363,459 | ◄ Funding Split Varies by Funding Source | ||||||||
| ►Bridge Program / On-System (Non-NHS) | ||||||||||||
| Bridge Program | 608197 | Boston Region | BOSTON | BOSTON- SUPERSTRUCTURE REPLACEMENT, B-16-107, CANTERBURY STREET OVER AMTRAK/MBTA | 6 | NHPP-Off | $ 4,678,280 | $ 3,742,624 | $ 935,656 | |||
| Bridge Program / On-System (Non-NHS) subtotal ► | $ 4,678,280 | $ 3,742,624 | $ 935,656 | ◄ 80% Federal + 20% Non-Federal | ||||||||
| ►Bridge Program / Systematic Maintenance | ||||||||||||
| Bridge Program | 608609 | Boston Region | Multiple | NEWTON- WESTWOOD- STEEL SUPERSTRUCTURE CLEANING (FULL REMOVAL) AND PAINTING OF 2 BRIDGES: N-12-056 & W-31-006 | 6 | NHPP-Off | $ 2,142,857 | $ 1,714,285 | $ 428,571 | |||
| Bridge Program / Systematic Maintenance subtotal ► | $ 2,142,857 | $ 1,714,285 | $ 428,571 | ◄ Funding Split Varies by Funding Source | ||||||||
| ►Interstate Pavement | ||||||||||||
| Interstate Pavement | Boston Region | Interstate Pavement | $ - | $ - | $ - | |||||||
| Insterstate Pavement subtotal ► | $ - | $ - | $ - | ◄ 90% Federal + 10% Non-Federal | ||||||||
| ►Non-Interstate Pavement | ||||||||||||
| Non-Interstate Pavement | 608495 | Boston Region | Multiple | CONCORD- LINCOLN- LEXINGTON RESURFACING AND RELATED WORK ON ROUTE 2A | 4 | NHPP | $ 3,480,000 | $ 2,784,000 | $ 696,000 | |||
| Non-Interstate Pavement | 609102 | Boston Region | Multiple | WENHAM- MANCHESTER- ESSEX- GLOUCESTER- PAVEMENT PRESERVATION AND RELATED WORK ON ROUTE 128 | 4 | NHPP | $ 13,731,802 | $ 10,985,442 | $ 2,746,360 | |||
| Non-Interstate Pavement subtotal ► | $ 17,211,802 | $ 13,769,442 | $ 3,442,360 | ◄ 80% Federal + 20% Non-Federal | ||||||||
| ► Roadway Improvements | ||||||||||||
| Roadway Improvements | Boston Region | Roadway Improvements | $ - | $ - | $ - | |||||||
| Roadway Improvements | Boston Region | Roadway Improvements | $ - | $ - | $ - | |||||||
| Roadway Improvements | Boston Region | Roadway Improvements | $ - | $ - | $ - | |||||||
| Roadway Improvements subtotal ► | $ - | $ - | $ - | ◄ 80% Federal + 20% Non-Federal | ||||||||
| ► Safety Improvements | ||||||||||||
| Safety Improvements | 609053 | Boston Region | Multiple | CANTON-DEDHAM-NORWOOD- HIGHWAY LIGHTING IMPROVEMENTS AT I93 & I95/128 | 6 | NHPP | $ 4,000,000 | $ 3,200,000 | $ 800,000 | |||
| Safety Improvements | 609058 | Boston Region | Multiple | PEABODY TO GLOUCESTER- GUIDE AND TRAFFIC SIGN REPLACEMENT ON ROUTE 128 | 4 | HSIP | $ 1,960,848 | $ 1,764,764 | $ 196,085 | |||
| Safety Improvements | 609060 | Boston Region | Multiple | LYNNFIELD- PEABODY- DANVERS- GUIDE AND TRAFFIC SIGN REPLACEMENT ON I-95/128 (TASK 'A' INTERCHANGE) | 4 | HSIP | $ 492,862 | $ 443,576 | $ 49,286 | |||
| Safety Improvements | Boston Region | HSIP | $ - | $ - | ||||||||
| Safety Improvements | Boston Region | HSIP | $ - | $ - | ||||||||
| Safety Improvements subtotal ► | $ 6,453,711 | $ 5,408,340 | $ 1,045,371 | ◄ Funding Split Varies by Funding Source | ||||||||
| ►Section 2B / State Prioritized Modernization Projects | ||||||||||||
| ► ADA Retrofits | ||||||||||||
| ADA Retrofits | Boston Region | ADA Retrofits | $ - | $ - | $ - | |||||||
| ADA Retrofits | Boston Region | ADA Retrofits | $ - | $ - | $ - | |||||||
| ADA Retrofits subtotal ► | $ - | $ - | $ - | ◄ 80% Federal + 20% Non-Federal | ||||||||
| ►Intersection Improvements | ||||||||||||
| Intersection Improvements | 608052 | Boston Region | Norwood | NORWOOD- INTERSECTION & SIGNAL IMPROVEMENTS AT US 1 (PROVIDENCE HIGHWAY) & MORSE STREET | 5 | HSIP | $ 974,815 | $ 877,334 | $ 97,482 | |||
| Intersection Improvements | 608564 | Boston Region | Watertown | WATERTOWN- INTERSECTION IMPROVEMENTS AT ROUTE 16 AND GALEN STREET | 6 | HSIP | $ 2,630,000 | $ 2,367,000 | $ 263,000 | |||
| Intersection Improvements | 608566 | Boston Region | Marlborough | MARLBOROUGH- IMPROVEMENTS AT ROUTE 20 (EAST MAIN STREET) AT CURTIS AVENUE | 3 | HSIP | $ 2,784,000 | $ 2,505,600 | $ 278,400 | |||
| Intersection Improvements | Boston Region | HSIP | ||||||||||
| Intersection Improvements subtotal ► | $ 6,388,815 | $ 5,749,934 | $ 638,882 | ◄ Funding Split Varies by Funding Source | ||||||||
| ►Intelligent Transportation Systems | ||||||||||||
| Intelligent Transportation Systems | Boston Region | Intelligent Transportation Systems | $ - | $ - | $ - | |||||||
| Intelligent Transportation Systems | Boston Region | Intelligent Transportation Systems | $ - | $ - | $ - | |||||||
| Intelligent Transportation Systems | Boston Region | Intelligent Transportation Systems | $ - | $ - | $ - | |||||||
| Intelligent Transportation System subtotal ► | $ - | $ - | $ - | ◄ 80% Federal + 20% Non-Federal | ||||||||
| ►Roadway Reconstruction | ||||||||||||
| Roadway Reconstruction | 607977 | Boston Region | Multiple | HOPKINTON- WESTBOROUGH- RECONSTRUCTION OF I-90/I-495 INTERCHANGE | 3 | NFP | $ 30,000,000 | $ 24,000,000 | $ 6,000,000 | Total Federal Participating Cost (TFPC) = $189,451,000; Total Construction Cost (TCC) = $270,000,000; AC Yr 2 of 6 | ||
| Roadway Reconstruction subtotal ► | $ 30,000,000 | $ 24,000,000 | $ 6,000,000 | ◄ Funding Split Varies by Funding Source | ||||||||
| ►Section 2C / State Prioritized Expansion Projects | ||||||||||||
| ►Bicycles and Pedestrians | ||||||||||||
| Bicycles and Pedestrians | Boston Region | Bicycles and Pedestrians | $ - | $ - | $ - | |||||||
| Bicycles and Pedestrians | Boston Region | Bicycles and Pedestrians | $ - | $ - | $ - | |||||||
| Bicycles and Pedestrians | Boston Region | Bicycles and Pedestrians | $ - | $ - | $ - | |||||||
| Bicycles and Pedestrians subtotal ► | $ - | $ - | $ - | ◄ 80% Federal + 20% Non-Federal | ||||||||
| ►Capacity | ||||||||||||
| Capacity | Boston Region | Capacity | $ - | $ - | $ - | |||||||
| Capacity | Boston Region | Capacity | $ - | $ - | $ - | |||||||
| Capacity subtotal ► | $ - | $ - | $ - | ◄ Funding Split Varies by Funding Source | ||||||||
| ►Section 3 / Planning / Adjustments / Pass-throughs | ||||||||||||
| ►Planning / Adjustments / Pass-throughs | ||||||||||||
| Boston Region | ABP GANS Repayment | Multiple | $ - | $ - | $ - | |||||||
| Boston Region | ABP GANS Repayment | Multiple | $ - | $ - | $ - | |||||||
| Boston Region | Award adjustments, change orders, etc. | Multiple | $ - | $ - | $ - | |||||||
| Boston Region | Award adjustments, change orders, etc. | Multiple | $ - | $ - | $ - | |||||||
| Boston Region | Award adjustments, change orders, etc. | Multiple | $ - | $ - | $ - | |||||||
| Boston Region | Award adjustments, change orders, etc. | Multiple | $ - | $ - | $ - | |||||||
| Boston Region | Metropolitan Planning | Multiple | $ - | $ - | $ - | |||||||
| Boston Region | Metropolitan Planning | Multiple | $ - | $ - | $ - | |||||||
| Boston Region | State Planning and Research Work Program I, (SPR I), Planning | Multiple | $ - | $ - | $ - | |||||||
| Boston Region | State Planning and Research Work Program II, (SPR II), Research | Multiple | $ - | $ - | $ - | |||||||
| Boston Region | Railroad Crossings | Multiple | $ - | $ - | $ - | |||||||
| Boston Region | Railroad Crossings | Multiple | $ - | $ - | $ - | |||||||
| Boston Region | Recreational Trails | Multiple | $ - | $ - | $ - | |||||||
| Other Statewide Items subtotal ► | $ - | $ - | $ - | ◄ Funding Split Varies by Funding Source | ||||||||
| ►Section 4 / Non-Federally Aided Projects | ||||||||||||
| ►Non-Federally Aided Projects | ||||||||||||
| Non Federal Aid | 607977 | Boston Region | Multiple | HOPKINTON- WESTBOROUGH- RECONSTRUCTION OF I-90/I-495 INTERCHANGE | 3 | NFA | $ 18,112,483 | $ 18,112,483 | Total Federal Participating Cost (TFPC) = $189,451,000; Total Construction Cost (TCC) = $270,000,000; AC Yr 2 of 6 | |||
| Non-Federally Aided Projects | Boston Region | Non-Federal Aid | $ - | $ - | ||||||||
| Non-Federal Aid subtotal► | $ 18,112,483 | $ 18,112,483 | ◄100% Non-Federal | |||||||||
| 2023 Summary | TIP Section 1 - 3: ▼ | TIP Section 4: ▼ | Total of All Projects ▼ | |||||||||
| Total ► | $ 208,608,674 | $ 18,112,483 | $ 226,721,157 | ◄ Total Spending in Region | ||||||||
| Federal Funds ► | $ 168,468,020 | $ 168,468,020 | ◄ Total Federal Spending in Region | |||||||||
| Non-Federal Funds ► | $ 40,140,654 | $ 18,112,483 | $ 58,253,137 | ◄ Total Non-Federal Spending in Region | ||||||||
| 701 CMR 7.00 Use of Road Flaggers and Police Details on Public Works Projects / 701 CMR 7.00 (the Regulation) was promulgated and became law on October 3, 2008. Under this Regulation, the CMR is applicable to any Public works Project that is performed within the limits of, or that impact traffic on, any Public Road. The Municipal Limitation referenced in this Regulation is applicable only to projects where the Municipality is the Awarding Authority. For all projects contained in the TIP, the Commonwealth is the Awarding Authority. Therefore, all projects must be considered and implemented in accordance with 701 CMR 7.00, and the Road Flagger and Police Detail Guidelines. By placing a project on the TIP, the Municipality acknowledges that 701 CMR 7.00 is applicable to its project and design and construction will be fully compliant with this Regulation. This information, and additional information relative to guidance and implementation of the Regulation can be found at the following link on the MassDOT Highway Division website: http://www.massdot.state.ma.us/Highway/flaggers/main.aspx | ||||||||||||
| Transportation Improvement Program (TIP) | ||||||||||
| Project List (FY2023) | ||||||||||
| FTA Program | Project Number | Transit Agency | FTA Activity Line Item | Project Description | Carryover (unobligated) | Federal Funds | State Funds | TDC | Local Funds | Total Cost |
| 5307 | ||||||||||
| 5307 | RTD0007184 | Cape Ann Transportation Authority | 117A00 | PREVENTIVE MAINTENANCE | 2022 - $285,000 | $285,000 | $0 | $0 | $71,250 | $356,250 |
| 5307 | RTD0007197 | Cape Ann Transportation Authority | 111203 | Replace Two 30-FT BUS | 2019 - $175,000; 2020 - $175,000; 2021 - $175,000; 2022 - $175,000 | $700,000 | $175,000 | $0 | $0 | $875,000 |
| 5307 | RTD0007186 | Cape Ann Transportation Authority | 114403 | Rehab/Reno-repave parking lot (match in 24) | $80,000 | $0 | $0 | $0 | $80,000 | |
| 5307 | RTD0007152 | MetroWest Regional Transit Authority | 117C00 | NON FIXED ROUTE ADA PARA SERV | 2022 - $1,300,000 | $1,300,000 | $325,000 | $0 | $0 | $1,625,000 |
| 5307 | RTD0007153 | MetroWest Regional Transit Authority | 114200 | ACQUISITION OF BUS SUPPORT EQUIP/FACILITIES | 2022 - $248,415 | $248,415 | $62,104 | $0 | $0 | $310,519 |
| 5307 | RTD0007155 | MetroWest Regional Transit Authority | 440000 | Mobility Management | 2022 - $25,000 | $25,000 | $6,250 | $0 | $0 | $31,250 |
| 5307 | RTD0007154 | MetroWest Regional Transit Authority | 113403 | TERMINAL, INTERMODAL (TRANSIT) - BLANDIN | 2022 - $150,000 | $150,000 | $37,500 | $0 | $0 | $187,500 |
| 5307 | RTD0007363 | Massachusetts Bay Transportation Authority (MBTA) | 121200 | Revenue Vehicle Program - 5307 | $146,121,933 | $0 | $0 | $36,530,483 | $182,652,416 | |
| Subtotal | $148,910,348 | $605,854 | $0 | $36,601,733 | $186,117,935 | |||||
| 5309 | ||||||||||
| Subtotal | $0 | $0 | $0 | $0 | $0 | |||||
| 5310 | ||||||||||
| Subtotal | $0 | $0 | $0 | $0 | $0 | |||||
| 5311 | ||||||||||
| Subtotal | $0 | $0 | $0 | $0 | $0 | |||||
| 5337 | ||||||||||
| 5337 | RTD0007373 | Massachusetts Bay Transportation Authority (MBTA) | 122405 | Bridge and Tunnel Program - 5337 | $83,270,751 | $0 | $0 | $20,817,688 | $104,088,439 | |
| 5337 | RTD0007374 | Massachusetts Bay Transportation Authority (MBTA) | 123402 | Elevator and Escalator Program - 5337 | $62,622,254 | $0 | $0 | $15,655,563 | $78,277,817 | |
| Subtotal | $145,893,005 | $0 | $0 | $36,473,251 | $182,366,256 | |||||
| 5339 | ||||||||||
| 5339 | RTD0007375 | Massachusetts Bay Transportation Authority (MBTA) | 111400 | Bus Program - 5339 | $5,683,653 | $0 | $0 | $1,420,913 | $7,104,566 | |
| Subtotal | $5,683,653 | $0 | $0 | $1,420,913 | $7,104,566 | |||||
| 5320 | ||||||||||
| Subtotal | $0 | $0 | $0 | $0 | $0 | |||||
| Other Federal | ||||||||||
| Subtotal | $0 | $0 | $0 | $0 | $0 | |||||
| Other Non-Federal | ||||||||||
| Subtotal | $0 | $0 | $0 | $0 | $0 | |||||
| Total | $300,487,006 | $605,854 | $0 | $74,495,897 | $375,588,757 | |||||
| Funds listed under the Carry Over column are included in the Federal Amount | ||||||||||
| TABLE 3-3 MBTA Federal Capital Program - FTA Formula Funds |
||||
| FFY 2019-2023 TIP - Project-Level Backup for Informational Purposes | ||||
| Presented to the Boston MPO on 3/15/2018 | ||||
| Section 5307 - Urbanized Formula Funds | ||||
| 5307 - Revenue Vehicle Program | Federal Share | MBTA Match | Total | |
| DMA Bus Replacement | $78,690,003 | $19,672,501 | $98,362,504 | |
| Green Line Light Rail Fleet Replacement - Design | $4,000,000 | $1,000,000 | $5,000,000 | |
| Green Line Train Protection | $135,470,052 | $33,867,513 | $169,337,565 | |
| Locomotive Overhaul | $24,000,000 | $6,000,000 | $30,000,000 | |
| MBTA Catamaran Overhaul | $7,493,568 | $1,873,392 | $9,366,960 | |
| Midlife Overhaul of 25 New Flyer Allison Hybrid 60 ft Articulated Buses | $12,702,054 | $3,175,514 | $15,877,568 | |
| Overhaul of 33 Kawasaki 900 Series Bi-Level Coaches | $62,257,345 | $15,564,336 | $77,821,681 | |
| Procurement of Bi-Level Commuter Rail Coaches | $99,344,131 | $24,836,033 | $124,180,164 | |
| Procurement of 194 New Flyer Hybrid 40 ft Buses | $138,372,573 | $34,593,143 | $172,965,716 | |
| Procurement of Battery Electric 40 ft Buses and Related infrastructure (5307) | $8,596,955 | $2,149,239 | $10,746,194 | |
| Procurement of 40 ft Buses | $95,135,134 | $23,783,784 | $118,918,918 | |
| Red Line No. 3 Car - Targeted Reliability Improvements | $35,226,739 | $8,806,685 | $44,033,424 | |
| TIP Program Allowance | $8,605,346 | $2,151,337 | $10,756,683 | |
| $709,893,901 | $177,473,475 | $887,367,377 | ||
| 5307 - Stations and Facilities Program | Federal Share | MBTA Match | Total | |
| Bus Route Safety and Service Improvements | $6,589,422 | $1,647,355 | $8,236,777 | |
| Charlestown Bus - Seawall Rehab | $17,645,441 | $4,411,360 | $22,056,801 | |
| $24,234,863 | $6,058,716 | $30,293,578 | ||
| 5307 - Signals/Systems Upgrade Program | Federal Share | MBTA Match | Total | |
| Green Line - Central Tunnel Interlocking Signals | $64,360,000 | $16,090,000 | $80,450,000 | |
| Green Line Riverside to Reservoir - Signal & Track Work | $71,440,000 | $17,860,000 | $89,300,000 | |
| $135,800,000 | $33,950,000 | $169,750,000 | ||
| Section 5307 Totals | $869,928,764 | $217,482,191 | $1,087,410,955 | |
| Section 5337 - State of Good Repair | ||||
| 5337 - Bridge and Tunnel Program | Federal Share | MBTA Match | Total | |
| Bridge Bundling Contract (6 Bridges) | $105,720,000 | $26,430,000 | $132,150,000 | |
| Bridge Design / Inspection & Rating Program | $25,391,729 | $6,347,932 | $31,739,661 | |
| Bridge Repair Program | $8,722,002 | $2,180,501 | $10,902,503 | |
| North Station Draw 1 Bridge Replacement | $108,800,000 | $27,200,000 | $136,000,000 | |
| Tunnel Rehabilitation Program | $12,522,337 | $3,130,584 | $15,652,922 | |
| TIP Program Allowance | $7,834,682 | $1,958,671 | $9,793,353 | |
| $268,990,750 | $67,247,688 | $336,238,439 | ||
| 5337 - Stations and Facilities Program | Federal Share | MBTA Match | Total | |
| Newton Commuter Rail Stations Study | $16,511,947 | $4,127,987 | $20,639,934 | |
| Commonwealth Ave Stations Access | $13,040,000 | $3,260,000 | $16,300,000 | |
| Downtown Crossing Vertical Transportation Improvements Phase 2 | $24,326,390 | $6,081,598 | $30,407,988 | |
| Forest Hills Improvement Project | $18,089,763 | $4,522,441 | $22,612,204 | |
| Harvard Square Busway Repairs | $18,489,531 | $4,622,383 | $23,111,914 | |
| Hingham Ferry Dock Modification | $9,668,534 | $2,417,134 | $12,085,668 | |
| Iron Horse Operations Control Center | $32,000,000 | $8,000,000 | $40,000,000 | |
| Natick Center Station Accessibility Project | $1,760,506 | $440,126 | $2,200,632 | |
| Newton Highlands Green Line Station Accessibility Project | $10,636,354 | $2,659,089 | $13,295,443 | |
| Oak Grove Station Vertical Transportation Improvements | $10,340,603 | $2,585,151 | $12,925,754 | |
| Old South Meeting House Leak Repairs | $1,108,000 | $277,000 | $1,385,000 | |
| Park Street Station Wayfinding Improvements Construction | $9,013,235 | $2,253,309 | $11,266,544 | |
| Ruggles Station Upgrade - Accessibility (Design) | $1,600,000 | $400,000 | $2,000,000 | |
| Savin Hill Underpass | $2,787,200 | $696,800 | $3,484,000 | |
| South Attleboro Station Improvements | $2,100,654 | $525,164 | $2,625,818 | |
| Symphony Station Improvements | $30,615,840 | $7,653,960 | $38,269,801 | |
| Winchester Center Station | $27,697,425 | $6,924,356 | $34,621,781 | |
| TIP Program Allowance | $6,893,579 | $1,723,395 | $8,616,974 | |
| $236,679,563 | $59,169,891 | $295,849,453 | ||
| 5337 - Elevator and Escalator Program | Federal Share | MBTA Match | Total | |
| Elevator Program Multiple Location Design | $8,020,714 | $2,005,178 | $10,025,892 | |
| Priority Replacement and Redundant Elevator Program | $18,400,000 | $4,600,000 | $23,000,000 | |
| TIP Program Allowance | $792,621 | $198,155 | $990,777 | |
| $27,213,335 | $6,803,334 | $34,016,669 | ||
| 5337 - Signals/Systems Upgrade Program | Federal Share | MBTA Match | Total | |
| 45 High Street Improvements | $6,095,130 | $1,523,783 | $7,618,913 | |
| Infrastructure Asset Management Program Phase 1 | $16,335,993 | $4,083,998 | $20,419,991 | |
| North Station Terminal Signal Improvements | $28,480,000 | $7,120,000 | $35,600,000 | |
| Signal Program - Red/Orange Line | $274,072,211 | $68,518,053 | $342,590,264 | |
| TIP Program Allowance | $10,123,744 | $2,530,936 | $12,654,680 | |
| $335,107,079 | $83,776,770 | $418,883,848 | ||
| Section 5337 Totals | $840,777,392 | $210,194,348 | $1,084,988,409 | |
| Section 5339 - Bus & Bus Facilities | ||||
| 5339 - Bus Program | Federal Share | MBTA Match | Total | |
| Procurement of Battery Electric 40 ft Buses and Related infrastructure (5339) | $33,742,282 | $8,435,570 | $42,177,852 | |
| $33,742,282 | $8,435,570 | $42,177,852 | ||
| Section 5339 Totals | $33,742,282 | $8,435,570 | $42,177,852 | |
| TABLE 3-4 MBTA Federal Capital Program - FTA Formula Funds |
|
| FFY 2019-2023 TIP - Project Descriptions Provided for Informational Purposes | |
| Presented to the Boston MPO on 3/15/2018 | |
| TIP Project Name | Project Description |
| 5307 - Revenue Vehicle Program | |
| DMA Bus Replacement | Procurement of 60-foot Dual Mode Articulated (DMA) buses to replace the existing fleet of 32 Silver Line Bus Rapid Transit buses and to provide for ridership expansion projected as a result of Silver Line service extension to Chelsea. |
| Green Line Light Rail Fleet Replacement - Design | Development of technical specifications for the procurement of light rail vehicles to replace the existing fleet that is approaching the end of its service life. |
| Green Line Train Protection | Procurement and installation of on-board and wayside equipment for a train monitoring system to determine allowable train separation, based on speed and location, and to prevent vehicles from passing a red signal. |
| Locomotive Overhaul | Overhaul of locomotives in operation on commuter rail lines systemwide in order to improve reliability. |
| MBTA Catamaran Overhaul | Replacement of major systems and refurbishment of seating and other customer facing components on two catamarans (Lightning and Flying Cloud). |
| Midlife Overhaul of 25 New Flyer Allison Hybrid 60 ft Articulated Buses | Overhaul of 25 hybrid buses, brought into service in 2009 and 2010, to enable optimal reliability through the end of their service life. |
| Overhaul of 33 Kawasaki 900 Series Bi-Level Coaches | Overhaul and upgrade of existing systems on commuter rail coaches that were brought into service in 2005 to enable optimal reliability through the end of their service life. |
| Procurement of Bi-Level Commuter Rail Coaches | Procurement of bi-level commuter rail coaches to replace existing cars that have exceeded their service life. |
| Procurement of 194 New Flyer Hybrid 40 ft Buses | Procurement of 40-foot buses with hybrid propulsion to replace Emission Controlled Diesel (ECD) buses that have reached the end of their service life. |
| Procurement of Battery Electric 40 ft Buses and Related infrastructure (5307) | Procurement of up to 35 Battery Electric 40-ft. buses and supporting infrastructure to replace the existing electric trolley bus fleet and to serve as a pilot for determining bus propulsion technologies for future procurements. (Funded from both 5307 and 5339.) |
| Procurement of 40 ft Buses | Procurement of 40-foot electric and hybrid buses for replacement of diesel bus fleet. |
| Red Line No. 3 Car - Targeted Reliability Improvements | Overhaul and upgrade of selected systems on Red Line fleet vehicles to extend service life until planned replacement. |
| 5307 - Stations and Facilities Program | |
| Bus Route Safety and Service Improvements | To address accessibility, safety and operational deficiencies at select bus stops systemwide. |
| Charlestown Bus - Seawall Rehab | Rehabilitation of existing seawall to protect bus maintenance facility from future storm and flooding events. |
| 5307 - Signals/Systems Upgrade Program | |
| Green Line - Central Tunnel Interlocking Signals | To provide for the removal and the replacement of the existing 25 cycle signal system and associated wayside equipment at Government Center, Copley and Park Street Interlockings. |
| Green Line Riverside to Reservoir - Signal & Track Work | Replacement of track and signal system components on the Highland Branch of the Green Line from Reservoir to Riverside Stations, including replacement of obsolete 25 Hz track circuits with modern solid-state 100 Hz track circuits. |
| 5337 - Bridge and Tunnel Program | |
| Bridge Bundling Contract (6 Bridges) | Replacement of 6 commuter rail bridges: Lynn Fells Parkway in Melrose (Haverhill Line); Parker Street in Lawrence (Haverhill Line); Commercial Street in Lynn (Newburyport/Rockport Line); Bacon Street in Wellesley (Worcester Line); Intervale Road in Weston (Worcester Line); and High Line Bridge in Somerville (Lowell Line). |
| Bridge Design / Inspection & Rating Program | Inspection of bridge assets systemwide for determination of asset condition ratings and subsequent prioritization and scoping for repairs to select bridges. |
| Bridge Repair Program | Repairs to bridges systemwide, based on asset condition as determined by systemwide inspections. |
| North Station Draw 1 Bridge Replacement | Replacement of the North Station commuter rail drawbridge (Draw 1). Funding source under review. |
| Tunnel Rehabilitation Program | Repair and rehabilitation of transit tunnels systemwide |
| 5337 - Stations and Facilities Program | |
| Newton Commuter Rail Stations Study | For a conceptual design and operational analysis study of the Newton commuter rail stations, with additional funding for various accessibility and infrastructure improvements |
| Commonwealth Ave Stations Access | Addressing accessibility issues along the B branch of the Green Line along Commonwealth Avenue |
| Downtown Crossing Vertical Transportation Improvements Phase 2 | Construction of two new redundant elevators, in order to improve accessibility and to provide for future elevator maintenance without rendering the station temporarily inaccessible. |
| Forest Hills Improvement Project | Improvements at Forest Hills Station on the Orange Line and Needham Commuter Rail Line to comply with ADA and Massachusetts Architectural Access Board (MAAB) accessibility standards. Work will also include infrastructure and other improvements (e.g., wayfinding signage, installation of tactile platform edges). |
| Harvard Square Busway Repairs | Rehabilitation of roadway, drainage and catenary infrastructure at the Harvard Square Busway. |
| Hingham Ferry Dock Modification | Construction of a new, full accessible ferry dock at the Hingham Ferry Terminal located at Hewitts Cove in the Weymouth Back River in Hingham, MA |
| Iron Horse Operations Control Center | Construction of Iron Horse Park Operations Control Center building to provide an updated dispatch facility for Commuter Rail North (CRN) and Pan Am freight and to house the back-up Positive Train Control (PTC) data center. |
| Natick Center Station Accessibility Project | Accessibility improvements at the Natick Center commuter rail station on the Framingham/Worcester Line. |
| Newton Highlands Green Line Station Accessibility Project | Improvements at Newton Highlands station on the D branch of the Green Line to comply with ADA and Massachusetts Architectural Access Board (MAAB) accessibility standards. |
| Oak Grove Station Vertical Transportation Improvements | Retrofit of the existing Oak Grove station on the Orange Line to bring it into full compliance with ADA standards, including the replacement of existing elevators, construction of two new elevators, various parking and path of travel upgrades. |
| Old South Meeting House Leak Repairs | Remediation of leaks along the wall of the Old South Meeting House resulting from the construction of an entrance to State Street Station |
| Park Street Station Wayfinding Improvements Construction | Replacement of existing signage with updated ADA-compliant standard graphics at the lobby, Green Line platform, Red Line platform and Winter Street concourse as well as related architecture improvements such as lighting and illuminated exit signs. |
| Ruggles Station Upgrade - Accessibility (Design) | Design for future accessibility improvements at Ruggles Station. |
| Savin Hill Underpass | Rehabilitation of underpass at the Savin Hill Red Line Station in Boston |
| South Attleboro Station Improvements | Needs assessment and design services associated with accessibility, structural, parking and multi-modal facility improvements for the South Attleboro commuter rail station. |
| Symphony Station Improvements | Upgrades to the existing Symphony Station on the Green Line in order to provide a modern, accessible, code-compliant facility |
| Winchester Center Station | Renovation and accessibility improvements to Winchester Center Station on the Lowell and Haverhill commuter rail lines. |
| 5337 - Elevator and Escalator Program | |
| Elevator Program Multiple Location Design | Design for the installation of new redundant elevators and the replacement of existing elevators systemwide. |
| Priority Replacement and Redundant Elevator Program | Installation of new redundant elevators and the replacement of existing elevators at various stations, in order to mitigate degradation of station elevators and to maintain station accessbility during elevator maintenance. |
| 5337 - Signals/Systems Upgrade Program | |
| 45 High Street Improvements | Infrastructure improvements and data center upgrades at the MBTA's 45 High Street facility. |
| Infrastructure Asset Management Program Phase 1 | Collection of infrastructure based asset data in order to update the SGR Database and manage asset and life cycle/risk management practices. |
| North Station Terminal Signal Improvements | Upgrades to the commuter rail signal/communication system in the North Station area required for more efficient phasing of future track alignments, including support for the future Draw 1 Bridge Replacement Project. |
| Signal Program - Red/Orange Line | Various signal upgrades and improvements along both the Red and Orange Lines |
| 5339 - Bus Program | |
| Procurement of Battery Electric 40 ft Buses and Related infrastructure (5339) | Procurement of up to 35 Battery Electric 40-ft. buses and supporting infrastructure to replace the existing electric trolley bus fleet and to serve as a pilot for determining bus propulsion technologies for future procurements. (Funded from both 5307 and 5339.) |
| Note: Project descriptions are preliminary only and are provided for informational purposes. In many cases, the scopes of work will become more fully developed as the design process proceeds and is completed. | |
ID Number: This number references the project’s identification number in MassDOT’s project-tracking system.
Municipality: This field lists the municipality (or municipalities) in which a project is located.
Project Name: This field provides the project name or descriptor of project location.
Evaluation Rating: This field shows the total number of points scored by the project based on the MPO’s project evaluation criteria. MPO staff has not evaluated all projects in the TIP; staff mainly evaluates projects that can be considered for funding with the MPO’s Regional Target funding. If no score is listed, that means MPO staff did not evaluate the project.
MPO/CTPS Study: This field indicates if a study was conducted in the project area by the MPO staff and the findings, at least in part, have been incorporated in the engineering design for the TIP project. These studies are funded through the MPO’s 3C planning work and documented in the Unified Planning Work Program (UPWP). If no study name and year are listed, that means that MPO staff has not conducted a transportation study in the project area.
LRTP Status: This field shows the time band that the project is proposed for programming in the Long-Range Transportation Plan (LRTP). Projects are programmed in the LRTP if they are Major Infrastructure projects that add capacity to the transportation system. Projects that fall into the Operations and Maintenance investment programs established in the LRTP do not have to be programmed in the LRTP prior to being funded in the TIP; therefore, this field is blank for those projects.
Project Length: This field provides the length of the project in miles. This information is based on the best available data, and comes mainly from MassDOT’s Project Information website and from communication with project proponents or MassDOT project managers. Project lengths are engineering design estimates and may change during project development and construction.
Project Description: The description of the project is based, in part, on the written description of the project on MassDOT’s Project Information website. In some cases, these descriptions have been modified to clarify the details of the projects.
Funding Tables: Funding tables are included for each project and show the following information:
The project description information on the following pages originates from MassDOT’s Project Information database and, in some cases, has been modified to include additional project details
Information regarding TIP projects changes periodically. For more information on all projects please visit MassDOT’s Project Information website, www.massdot.state.ma.us/highway/ProjectInfo.aspx, the Boston Region MPO’s website, www.bostonmpo.org, or contact Ali Kleyman, TIP Manager, at akleyman@ctps.org.
ID Number:
608229
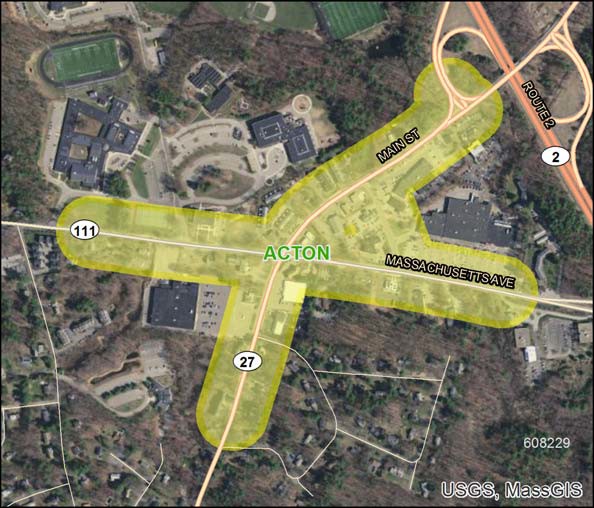
Municipality: Acton
Project Name: Intersection Improvements at Massachusetts
Avenue (Route 111) and Main Street (Route
27) (Kelley's Corner)
Evaluation Rating: 45
MPO/CTPS Study:
Project Length (miles): 1.12
Project Description:
The objective of the project is to make the Kelly's Corner area in Acton safer for pedestrians and bicyclists; reduce congestion; increase safety for residents, students, and patrons of local businesses; and improve vehicle access to and from businesses and private developments.
Year |
Funding Program |
Federal Funds |
Non‐Federal Funds |
Total Funds |
2022 |
Congestion Mitigation and Air Quality Program
|
$2,400,000 |
$600,000 |
$3,000,000 |
2022 |
Surface Transportation Program |
$9,214,702 |
$2,303,676 |
$11,518,378 |
2022 |
Transportation Alternatives |
$160,000 |
$40,000 |
$200,000 |
- |
Total Funding Programmed |
$11,774,702 |
$2,943,676 |
$14,718,378 |
ID Number:
607748
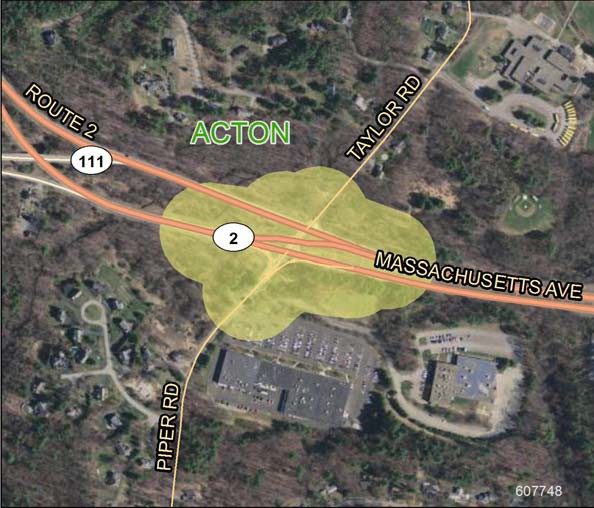
Municipality: Acton
Project Name: Intersection and Signal Improvements on Routes 2 and 111 (Massachusetts Avenue) at Piper Road and Taylor Road
Evaluation Rating: MPO/CTPS Study:
Project Length (miles): 0.21
Project Description:
The project will make upgrades at the intersection of Routes 2 and 111 (Massachusetts Avenue) at Piper and Taylor Roads in Acton to improve safety. The upgrades will include signs, pavement markings, and traffic signals as identified through a Road Safety Audit process in the Town of Acton.
Year |
Funding Program |
Federal Funds |
Non‐Federal Funds |
Total Funds |
2021 |
Highway Safety Improvement Program |
$4,500,000 |
$500,000 |
$5,000,000 |
|
Total Funding Programmed |
$4,500,000 |
$500,000 |
$5,000,000 |
ID Number:
606223
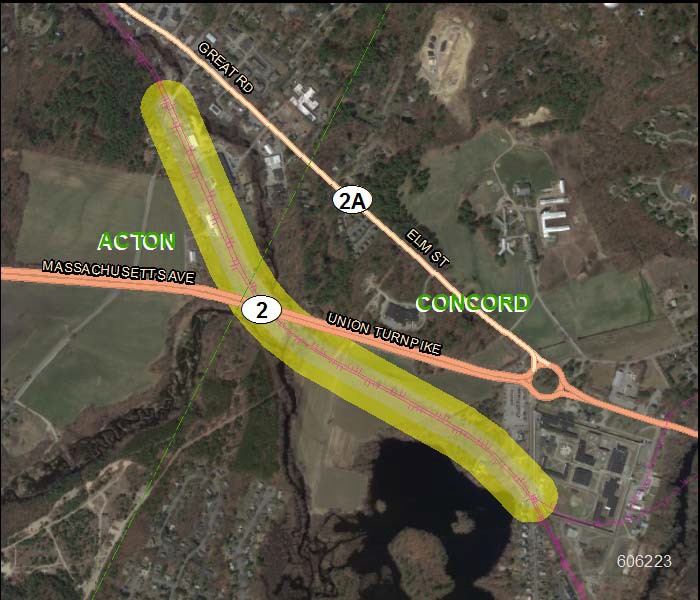
Municipality: Acton, Concord
Project Name: Bruce Freeman Rail Trail Construction (Phase II-B)
Evaluation Rating: MPO/CTPS Study:
Project Length (miles): 1.04
Project Description:
This rail-to-trail project begins at the intersection of Weatherbee Street and Great Road in Acton and continues across Route 2
to Commonwealth Avenue in Concord. This portion of the trail will connect the Bruce Freeman Rail Trail across Route 2 between
Concord and Acton. The total project length is approximately 5,500 feet (1.04 miles).
Year |
Funding Program |
Federal Funds |
Non‐Federal Funds |
Total Funds |
2019 |
Congestion Mitigation and Air Quality Program |
$7,357,311 |
$1,839,328 |
$9,196,639 |
|
Total Funding Programmed |
$7,357,311 |
$1,839,328 |
$9,196,639 |
ID Number: 604123
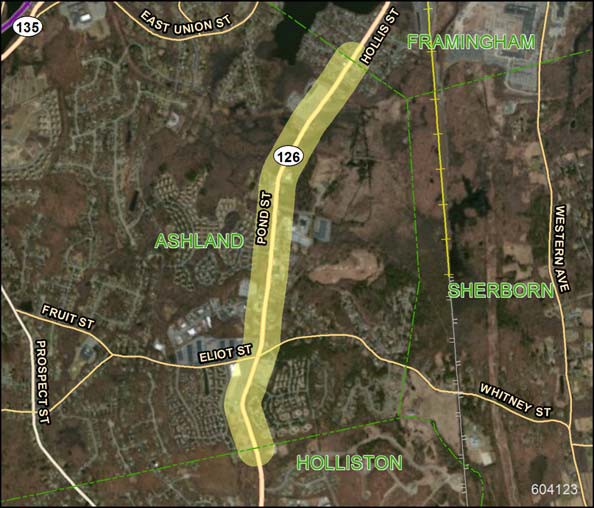
Municipality: Ashland
Project Name: Reconstruction on Route 126 (Pond Street), from the Framingham town line to the Holliston town line
Evaluation Rating: 57
MPO/CTPS Study: Route 126 Corridor Transportation Improvement Study
Project Length (miles): 1.71
Project Description:
The project limits are from the Framingham town line to the Holliston town line, a distance of 1.7 miles. The project consists of milling and resurfacing with minor box widening. Traffic improvements at the intersection of Route 126 and Elliot Street entail signalization, stone masonry retaining wall construction, minor drainage improvements, installation of granite curbing and edging, construction of sidewalks, and the resetting of guardrail.
Year |
Funding Program |
Federal Funds |
Non‐Federal Funds |
Total Funds |
2020 |
Congestion Mitigation and Air Quality Program |
$800,000 |
$200,000 |
$1,000,000 |
2020 |
Surface Transportation Program |
$8,790,216 |
$2,197,554 |
$10,987,770 |
2020 |
Transportation Alternatives |
$1,685,185 |
$421,296 |
$2,106,481 |
|
Total Funding Programmed |
$11,275,401 |
$2,818,850 |
$14,094,251 |
ID Number: 608443
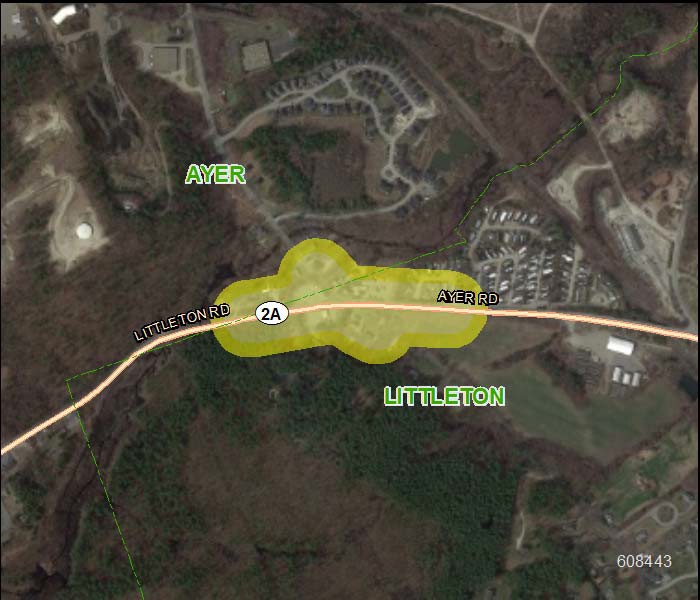
Municipality: Ayer, Littleton
Project Name: Intersection Improvements on Route 2A at Willow Road and Bruce Street
Evaluation Rating: 36
MPO/CTPS Study:
Project Length (miles): 0.32
Project Description:
The project involves intersection improvements, including geometric modifications, widening, and signalization. Additional improvements involve updated signage and pavement markings.
Year |
Funding Program |
Federal Funds |
Non‐Federal Funds |
Total Funds |
2023 |
Highway Safety Improvement Program |
$900,000 |
$100,000 |
$1,000,000 |
2023 |
Surface Transportation Program |
$1,427,200 |
$356,800 |
$1,784,000 |
|
Total Funding Programmed |
$2,327,200 |
$456,800 |
$2,784,000 |
ID Number: 607738
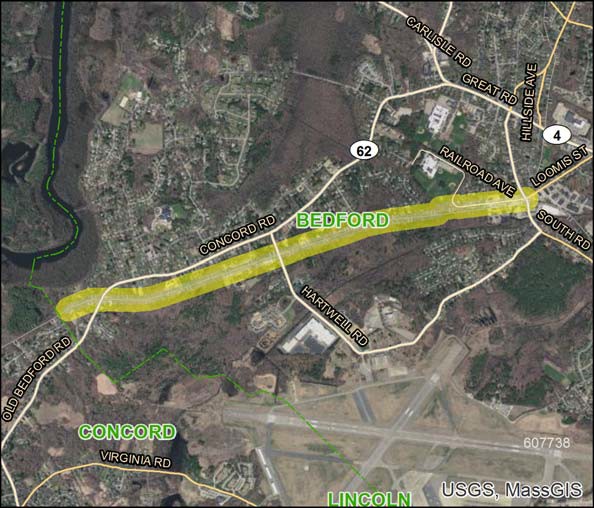
Municipality: Bedford
Project Name: Minuteman Bikeway Extension, from Loomis Street to the Concord town line
Evaluation Rating: 47
MPO/CTPS Study:
Project Length (miles): 2.28
Project Description:
The Minuteman Bikeway currently ends at Depot Park, in Bedford, near the intersection of South Road and Loomis Street. This project would extend the bikeway by making a 1,665 foot portion of Railroad Avenue accessible to bikes and by constructing
8,800 feet of bikeway on the Reformatory Branch Trail, from Railroad Avenue past Concord Road to Wheeler Drive, near the Bedford/Concord town line. As a part of the Railroad Avenue reconstruction, sidewalks, bike accommodations, new drainage, pavement markings and signs, and defined curb cuts will be constructed.
Year |
Funding Program |
Federal Funds |
Non‐Federal Funds |
Total Funds |
2022 |
Congestion Mitigation and Air Quality Program |
$5,191,971 |
$1,297,993 |
$6,489,964 |
2022 |
Transportation Alternatives |
$280,000 |
$70,000 |
$350,000 |
|
Total Funding Programmed |
$5,471,971 |
$1,367,993 |
$6,839,964 |
ID Number: 608887
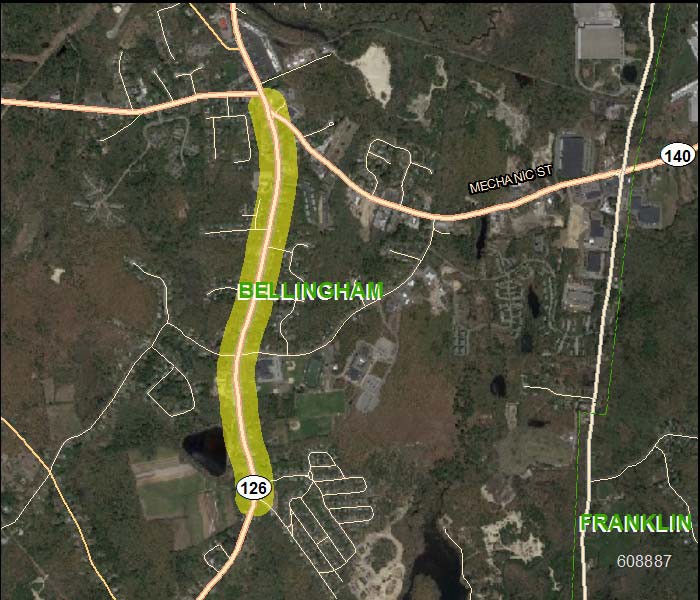
Municipality: Bellingham
Project Name: South Main Street (Route 126), from Mechanic Street (Route 140) to Douglas Drive
Evaluation Rating: 45
MPO/CTPS Study: Yes
Project Length (miles): 1.22
Project Description:
Road reconstruction with enhancements to existing curb reveal, sidewalks, and storm drainage systems, and widening to accommodate improved walk width and bike paths.
Year |
Funding Program |
Federal Funds |
Non‐Federal Funds |
Total Funds |
2023 |
Congestion Mitigation and Air Quality Program |
$1,600,000 |
$400,000 |
$2,000,000 |
2023 |
Surface Transportation Program |
$3,200,000 |
$800,000 |
$4,000,000 |
2023 |
Transportation Alternatives |
$768,000 |
$192,000 |
$960,000 |
|
Total Funding Programmed |
$5,568,000 |
$1,392,000 |
$6,960,000 |
ID Number:
608911
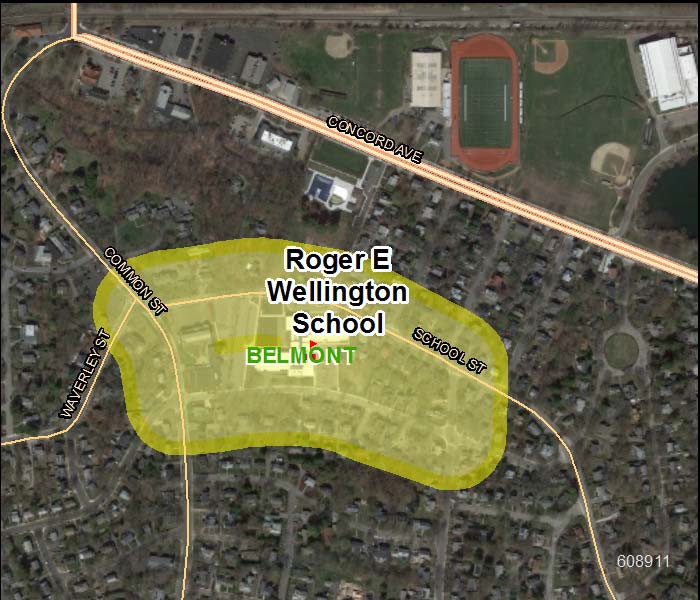
Municipality: Belmont
Project Name: Improvements at Wellington Elementary
School (SRTS) in Belmont
Evaluation Rating: MPO/CTPS Study:
Project Length (miles):
Project Description:
This Safe Routes to School project will make improvements around Wellington Elementary School to provide safer access for students
Year |
Funding Program |
Federal Funds |
Non‐Federal Funds |
Total Funds |
2021 |
Transportation Alternatives |
$995,000 |
$248,750 |
$1,243,750 |
|
Total Funding Programmed |
$995,000 |
$248,750 |
$1,243,750 |
ID Number: 608347
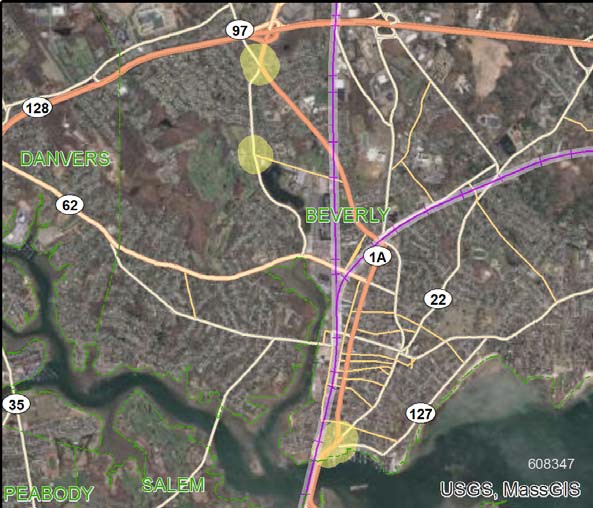
Municipality: Beverly
Project Name: Intersection Improvements at Three Locations: Cabot Street (Route 1A/97) at Dodge Street (Route 1A), County Way, Longmeadow Road and Scott Street, McKay Street at Balch Street and Veterans Memorial Bridge (Route 1A) at Rantoul, Cabot, Water and Front Streets
Evaluation Rating: 63
MPO/CTPS Study:
Project Length (miles): 0.38
Project Description:
The project involves updating and modernizing traffic signal equipment at the intersections of Cabot Street at Dodge Street/County Way/Longmeadow Road and Cabot Street at Rantoul Street/Front Street/Water Street/Goat Hill Lane; signalizing or installing a modern roundabout at the intersection of McKay Street at Balch Street; and providing on-street bicycle accommodations and ADA compliant wheelchair ramps at sidewalks at each intersection. Pavement milling and overlay at each intersection is also included in this work.
Year |
Funding Program |
Federal Funds |
Non‐Federal Funds |
Total Funds |
2019 |
Congestion Mitigation and Air Quality Program |
$1,216,217 |
$304,054 |
$1,520,271 |
2019 |
Highway Safety Improvement Program |
$2,587,154 |
$287,462 |
$2,874,616 |
|
Total Funding Programmed |
$3,803,371 |
$591,516 |
$4,394,887 |
ID Number: 608348
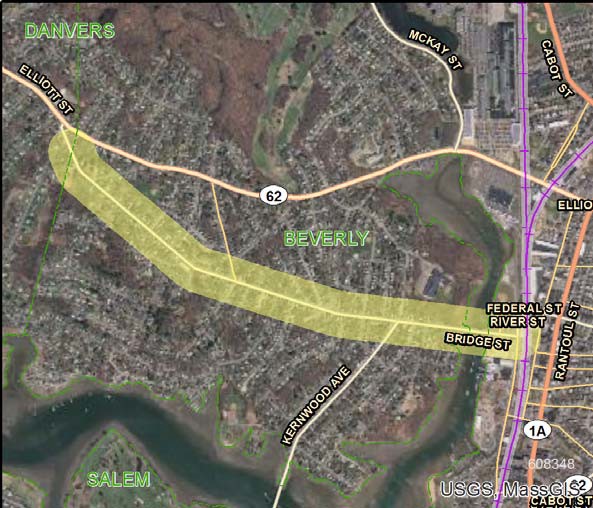
Municipality: Beverly
Project Name: Rehabilitation of Bridge Street
Evaluation Rating: 66
MPO/CTPS Study:
Project Length (miles): 1.34
Project Description:
The project involves rehabilitation of pavement and sidewalks along the Bridge Street corridor from the Danvers town line to River Street, excluding the Hall Whitaker drawbridge. The project includes cross section improvements to accommodate on- street parking and on-street bicycle accommodations. Existing traffic signal equipment at the intersection of Bridge Street at Livingstone Avenue will be upgraded, and new traffic signals will be installed at the intersection of Bridge Street with Kernwood Avenue and the intersection of Bridge Street with River Street. Under the proposed project, continuous cement concrete sidewalks with vertical granite curb will be provided along both sides of the roadway for the full length of the project. As part of the proposed project, a 7 foot wide parking shoulder will be provided on the eastbound side of the roadway to prevent vehicles from parking on the sidewalk. Additionally, 5 foot wide bicycle lanes will be provided along the corridor. Minor realignments will be performed at the intersections of Bridge Street with Cressy Street, County Way/Bates Park Avenue, and Eastern Avenue/Dolloff Avenue.
Year |
Funding Program |
Federal Funds |
Non‐Federal Funds |
Total Funds |
2023 |
Congestion Mitigation and Air Quality Program |
$2,400,000 |
$600,000 |
$3,000,000 |
2023 |
Surface Transportation Program |
$2,499,840 |
$624,960 |
$3,124,800 |
|
Total Funding Programmed |
$4,899,840 |
$1,224,960 |
$6,124,800 |
ID Number: 609058
Municipality: Beverly ,Danvers, Essex, Gloucester, Manchester-by-the-Sea, Peabody, Wenham
Project Name: Peabody to Gloucester- Guide and Traffic Sign Replacement on Route 128
Evaluation Rating: MPO/CTPS Study:
Project Length (miles): 21
Project Description:
This project will replace guide and traffic signs on Route 128 from Peabody to Gloucester.
Year |
Funding Program |
Federal Funds |
Non‐Federal Funds |
Total Funds |
2023 |
Highway Safety Improvement Program |
$1,764,764 |
$196,085 |
$1,960,849 |
Total Funding Programmed |
$1,764,764 |
$196,085 |
$1,960,849 |
ID Number: 606453
Municipality: Boston
Project Name: Improvements on Boylston Street, from Intersection of Brookline Avenue and Park Drive to Ipswich Street
Evaluation Rating: 58
MPO/CTPS Study:
Project Length (miles): 0.63
Project Description:
This roadway improvement project will improve pedestrian mobility, encourage local and regional bicycle travel, and reduce vehicular congestion.
Year |
Funding Program |
Federal Funds |
Non‐Federal Funds |
Total Funds |
2021 |
Congestion Mitigation and Air Quality Program Regionally Prioritized |
$800,000 |
$200,000 |
$1,000,000 |
2021 |
Surface Transportation Program |
$649,946 |
$162,486 |
$812,432 |
2021 |
Transportation Alternatives Regionally Prioritized |
$5,384,368 |
$1,346,092 |
$6,730,460 |
|
Total Funding Programmed |
$6,834,314 |
$1,708,578 |
$8,542,892 |
ID Number: 1829
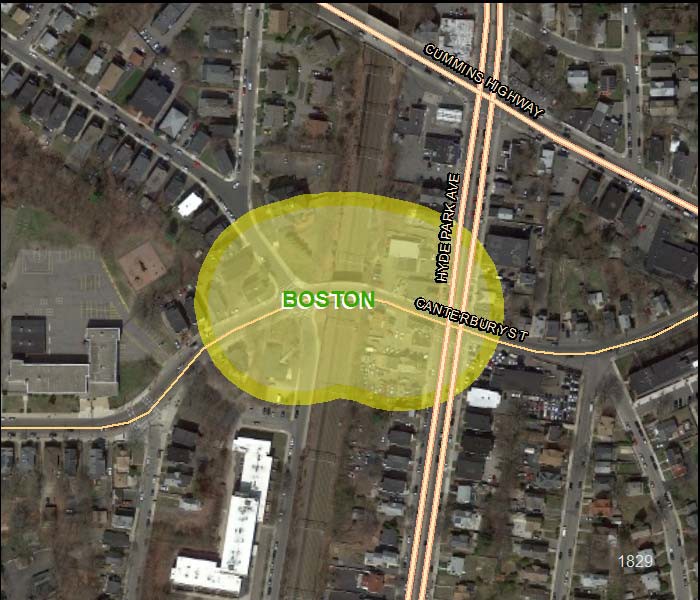
Municipality: Boston
Project Name: Superstructure Replacement, B-16-107, Canterbury Street over Amtrak/MBTA
Evaluation Rating: MPO/CTPS Study:
Project Length (miles): 0.04
Project Description:
This project will replace the superstructure of bridge B-16-107, which carries Canterbury Street over the Amtrak/MBTA tracks.
Year |
Funding Program |
Federal Funds |
Non‐Federal Funds |
Total Funds |
2023 |
Bridge On NHS System |
$3,742,624 |
$935,656 |
$4,678,280 |
|
Total Funding Programmed |
$3,742,624 |
$935,656 |
$4,678,280 |
ID Number: 608755
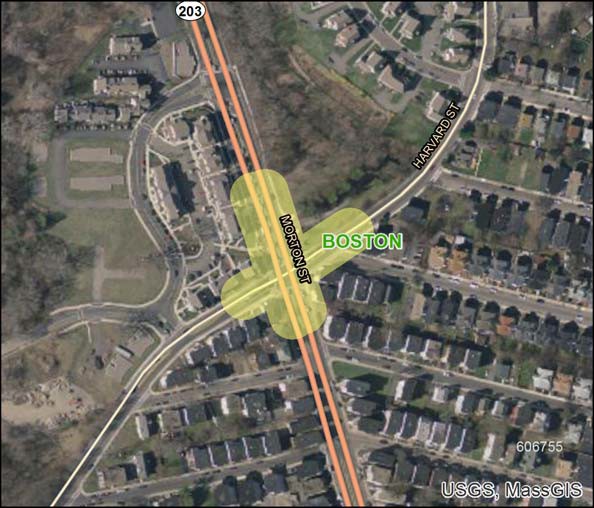
Municipality: Boston
Project Name: Intersection Improvements at Morton Street and Harvard Street
Evaluation Rating: MPO/CTPS Study:
Project Length (miles): 0.11
Project Description:
This project will improve the intersection of Morton Street and Harvard Street.
Year |
Funding Program |
Federal Funds |
Non‐Federal Funds |
Total Funds |
2019 |
Highway Safety Improvement Program |
$1,350,000 |
$150,000 |
$1,500,000 |
|
Total Funding Programmed |
$1,350,000 |
$150,000 |
$1,500,000 |
ID Number: 607759
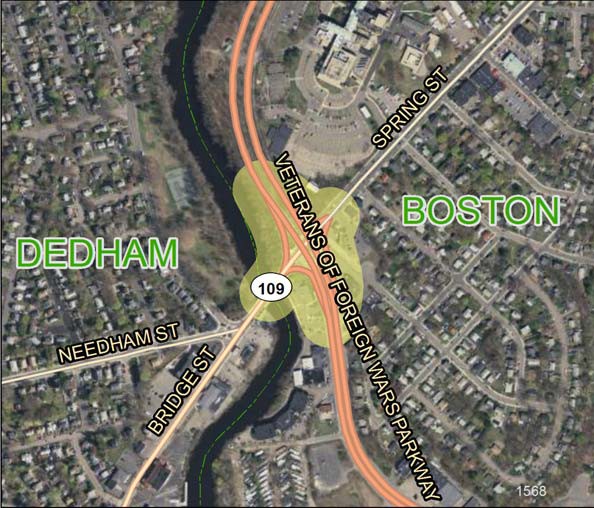
Municipality: Boston
Project Name: Intersection and Signal Improvements at the VFW Parkway and Spring Street
Evaluation Rating: MPO/CTPS Study:
Project Length (miles): 0.19
Project Description:
The project will make upgrades at the intersection to improve safety. The upgrades will include signs, pa
vement markings, and traffic signals as identified through a Road Safety Audit process.
Year |
Funding Program |
Federal Funds |
Non‐Federal Funds |
Total Funds |
2020 |
Highway Safety Improvement Program |
$877,334 |
$97,482 |
$974,816 |
|
Total Funding Programmed |
$877,334 |
$97,482 |
$974,816 |
ID Number: 606902
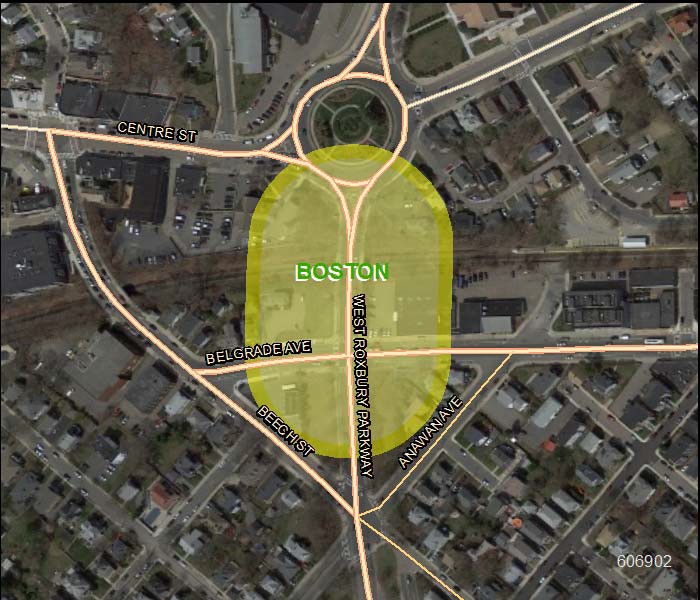
Municipality: Boston
Project Name: Bridge Reconstruction/Rehabilitation on West Roxbury Parkway over MBTA
Evaluation Rating: MPO/CTPS Study:
Project Length (miles): 0.04
Project Description:
This project will involve the reconstruction of this bridge.
Year |
Funding Program |
Federal Funds |
Non‐Federal Funds |
Total Funds |
2023 |
Bridge On NHS System |
$5,520,000 |
$1,380,000 |
$6,900,000 |
|
Total Funding Programmed |
$5,520,000 |
$1,380,000 |
$6,900,000 |
ID Number: 605789
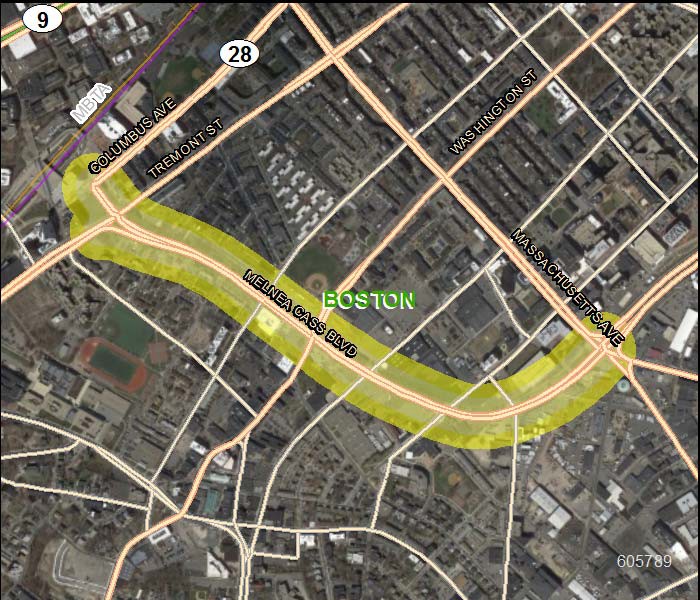
Municipality: Boston
Project Name: Reconstruction of Melnea Cass Boulevard
Evaluation Rating: 61
MPO/CTPS Study:
Project Length (miles): 0.94
Project Description:
The project involves the reconstruction of Melnea Cass Boulevard including pedestrian and bicycle facilities, traffic signal operation enhancements, landscaping, as well as ITS measures to create a Complete Streets design. This project is funded with $7,871248 dedicated by the Boston Region MPO and $17,444,341 in earmark discretionary funding. The total project cost is $25,315,589.
Year |
Funding Program |
Federal Funds |
Non‐Federal Funds |
Total Funds |
2019 |
Earmark HPP (MA 154) |
$5,007,375 |
$1,251,844 |
$6,259,219 |
2019 |
Earmark HPP (MA 194) |
$2,779,011 |
$694,753 |
$3,473,764 |
2019 |
Earmark HPP 4284 (MA203) |
$4,005,900 |
$1,001,475 |
$5,007,375 |
2019 |
Earmark HPP 756 ( MA 126) |
$2,163,186 |
$540,797 |
$2,703,983 |
2019 |
Surface Transportation Program |
$6,296,998 |
$1,574,250 |
$7,871,248 |
|
Total Funding Programmed |
$20,252,470 |
$5,063,119 |
$25,315,589 |
ID Number: 606226
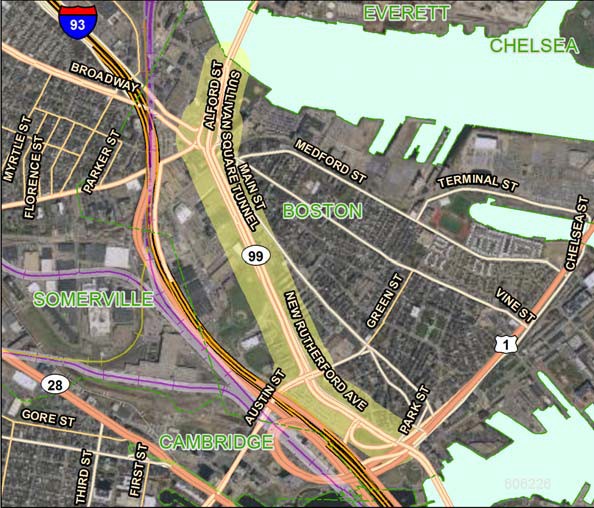
Municipality: Boston
Project Name: Reconstruction of Rutherford Avenue, from Sullivan Square to North Washington Street Bridge
Evaluation Rating: 59
MPO/CTPS Study:
Project Length (miles): 2.94
Project Description:
This project will make the road a multi-modal urban boulevard corridor. Funded over five years, the total project cost is estimated to be $152,000,000 with $125,205,444 in the FFYs 2019-23 TIP.
Year |
Funding Program |
Federal Funds |
Non‐Federal Funds |
Total Funds |
2020 |
Surface Transportation Program |
$5,600,000 |
$1400000 |
$7,000,000 |
2021 |
Earmark Demo ID (MA 183) |
$101,576 |
$25,394 |
$126,970 |
2021 |
Earmark Demo ID (MA 210) |
$6,761,568 |
$1,690,392 |
$8,451,960 |
2021 |
National Highway Performance Program |
$8,965,951 |
$2,241,488 |
$11,207,439 |
2021 |
Surface Transportation Program |
$11,240,609 |
$2,810,152 |
$14,050,761 |
2021 |
Transportation Alternatives |
$1,538,037 |
$384,509 |
$1,922,546 |
2022 |
National Highway Performance Program |
$11,731,344 |
$2,932,836 |
$14,664,180 |
2022 |
Surface Transportation Program |
$21,198,878 |
$5,299,720 |
$26,498,598 |
2022 |
Transportation Alternatives |
$1,026,392 |
$256,598 |
$1,282,990 |
2023 |
National Highway Performance Program |
$10,400,000 |
$2,600,000 |
$13,000,000 |
2023 |
Surface Transportation Program |
$20,800,000 |
$5,200,000 |
$26,000,000 |
2023 |
Transportation Alternatives |
$800,000 |
$200,000 |
$1,000,000 |
|
Total Funding Programmed |
$100,164,355 |
$25,041,089 |
$125,205,444 |
ID Number: 606728
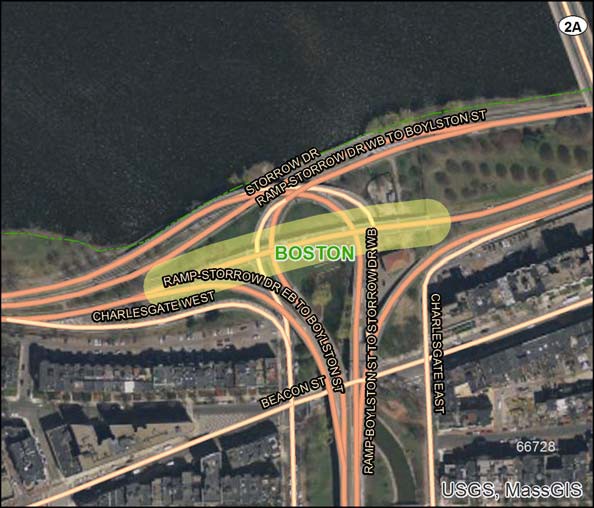
Municipality: Boston
Project Name: Superstructure Repairs, Bowker Overpass over Storrow Drive (eastbound)
Evaluation Rating: MPO/CTPS Study:
Project Length (miles): 0.12
Project Description:
The project consists of bridge deck, parapet, expansion joint, and substructure repairs to B-16-365(4FK), the Bowker Overpass over Storrow Drive eastbound.
Year |
Funding Program |
Federal Funds |
Non‐Federal Funds |
Total Funds |
2023 |
Bridge On NHS System |
$19,207,760 |
$4,801,940 |
$24,009,700 |
|
Total Funding Programmed |
$19,207,760 |
$4,801,940 |
$24,009,700 |
ID Number: 604173
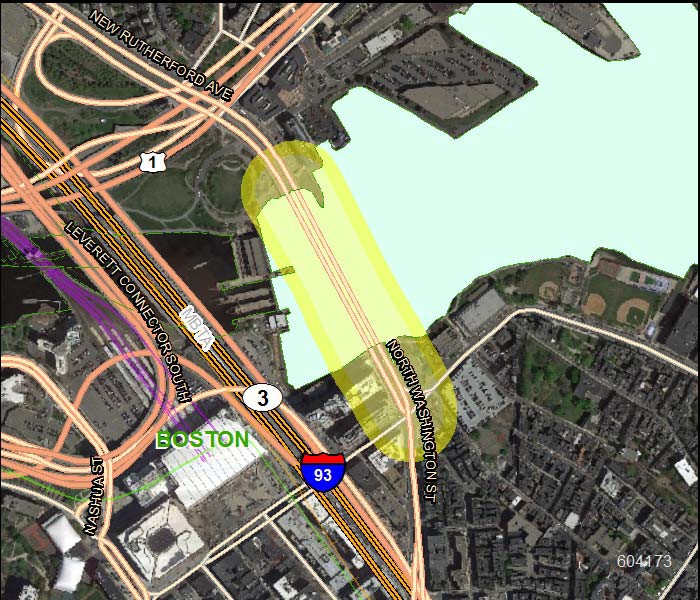
Municipality: Boston
Project Name: Bridge Replacement, North Washington Street over the Boston Inner Harbor
Evaluation Rating: MPO/CTPS Study:
Project Length (miles): 0.24
Project Description:
The North Washington Street Bridge is a historic structure constructed in 1898. The bridge consists of ten approach spans and a swing span, which is not operational. The bridge is structurally deficient and is posted as weight restricted. There have been extensive emergency repairs done to the bridge in the past few years. Currently the two center lanes on the swing span are closed due to steel deterioration. The City of Boston proposes to replace the bridge. The existing granite/concrete bridge piers on the approach spans will be replaced with reinforced concrete V piers and continuous trapezoidal steel box girders. The proposed deck will provide for increased bicycle and pedestrian accommodations between Kearney Square and Rutherford Avenue. This project is funded over six FFYs (FFYs 2017-22). The total estimated cost of the project is
$193,058,158.
Year |
Funding Program |
Federal Funds |
Non‐Federal Funds |
Total Funds |
2019 |
Bridge On NHS System |
$16,800,000 |
$4,200,000 |
$21,000,000 |
2020 |
Bridge On NHS System |
$16,000,000 |
$4,000,000 |
$20,000,000 |
2021 |
Bridge On NHS System |
$16,000,000 |
$4,000,000 |
$20,000,000 |
2022 |
Bridge On NHS System |
$14,748,858 |
$3,687,215 |
$18,436,073 |
|
Total Funding Programmed |
$63,548,858 |
$15,887,215 |
$79,436,073 |
ID Number: 608208
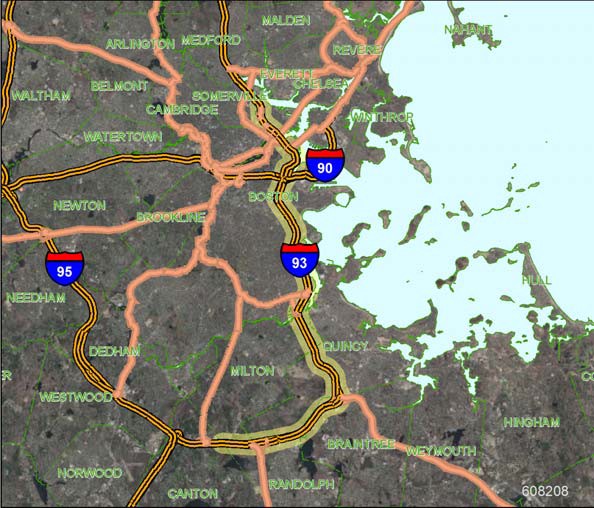
Municipality: Boston, Braintree, Milton, Quincy, Randolph, Somerville
Project Name: Interstate Maintenance Resurfacing and Related Work on Interstate 93
Evaluation Rating: MPO/CTPS Study:
Project Length (miles): 17.62
Project Description:
The project is an interstate maintenance resurfacing project on the Southeast Expressway. A preservation treatment or thin bonded overlay is proposed to extend the pavement service life and improve safety.
Year |
Funding Program |
Federal Funds |
Non‐Federal Funds |
Total Funds |
2020 |
National Highway Performance Program |
$21,838,118 |
$2,426,458 |
$24,264,576 |
|
Total Funding Programmed |
$21,838,118 |
$2,426,458 |
$24,264,576 |
ID Number: 607888
Municipality: Boston, Brookline
Project Name: Multi-use Path Construction on New Fenway
Evaluation Rating: 44
MPO/CTPS Study:
Project Length (miles): 0.41
Project Description:
This project will construct a new multi-use bike/pedestrian pathway from the Muddy River in Brookline to Maitland Street in Boston for a total of 1,700 feet. The project will improve access to the Fenway MBTA Station and the Yawkey commuter rail station and provide a non-motorized transportation link to key job centers and new mixed-use developments planned for the Fenway area.
Year |
Funding Program |
Federal Funds |
Non‐Federal Funds |
Total Funds |
2020 |
Congestion Mitigation and Air Quality Program |
$1,416,578 |
$354,144 |
$1,770,722 |
|
Total Funding Programmed |
$1,416,578 |
$354,144 |
$1,770,722 |
ID Number: 608614
Municipality: Boston, Cambridge
Project Name: Superstructure Replacement, B-16-179, Austin Street over Interstate 93 Ramps, MBTA Commuter Rail and Orange Line
Evaluation Rating: MPO/CTPS Study:
Project Length (miles): 0.31
Project Description:
The project will replace the superstructure of bridge B-16-179, which carries Austin Street over the Interstate 93 ramps and the MBTA commuter rail and Orange Line tracks in Boston.
Year |
Funding Program |
Federal Funds |
Non‐Federal Funds |
Total Funds |
2022 |
Bridge On NHS System |
$17,706,240 |
$4,426,560 |
$22,132,800 |
|
Total Funding Programmed |
$17,706,240 |
$4,426,560 |
$22,132,800 |
ID Number: 609090
Municipality: Boston, Milton, Quincy
Project Name: Boston-Milton-Quincy- Highway Lighting System Replacement on Interstate 93, from Neponset Avenue to the Braintree Split
Evaluation Rating: MPO/CTPS Study:
Project Length (miles): 4.58
Project Description:
This project will replace the highway lighting system on Interstate 93, from Neponset Avenue to the Braintree Split.
Year |
Funding Program |
Federal Funds |
Non‐Federal Funds |
Total Funds |
2021 |
National Highway Performance Program |
$2,700,000 |
$300,000 |
$3,000,000 |
|
Total Funding Programmed |
$2,700,000 |
$300,000 |
$3,000,000 |
ID Number: 608234
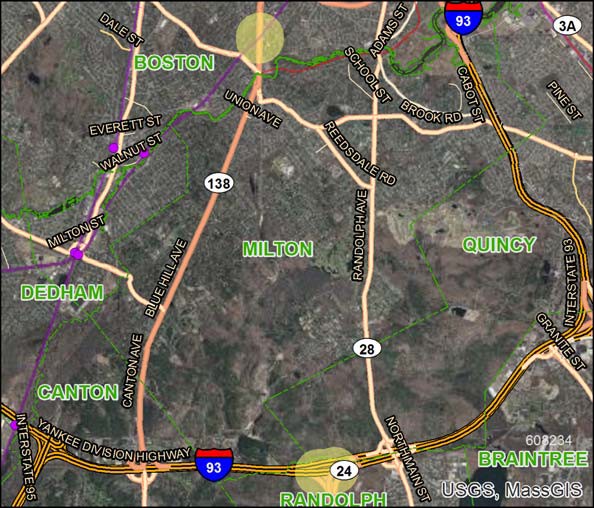
Municipality: Boston, Randolph
Project Name: Bridge Preservation of Three Bridges: B-16-165, R-01-005 and R-01-007
Evaluation Rating: MPO/CTPS Study:
Project Length (miles): 0.12
Project Description:
The project addresses the structures that carry Blue Hill Avenue over the MBTA tracks; Interstate 93 northbound over Route 24 northbound; and Interstate 93 over Route 24 southbound. Work on the Blue Hill Avenue structure will involve both the deck and substructure. Work on the Interstate 93 bridges will include deck, superstructure, and substructure repairs.
Year |
Funding Program |
Federal Funds |
Non‐Federal Funds |
Total Funds |
2019 |
Bridge On NHS System |
$3,987,791 |
$996,948 |
$4,984,739 |
|
Total Funding Programmed |
$3,987,791 |
$996,948 |
$4,984,739 |
ID Number: 608378
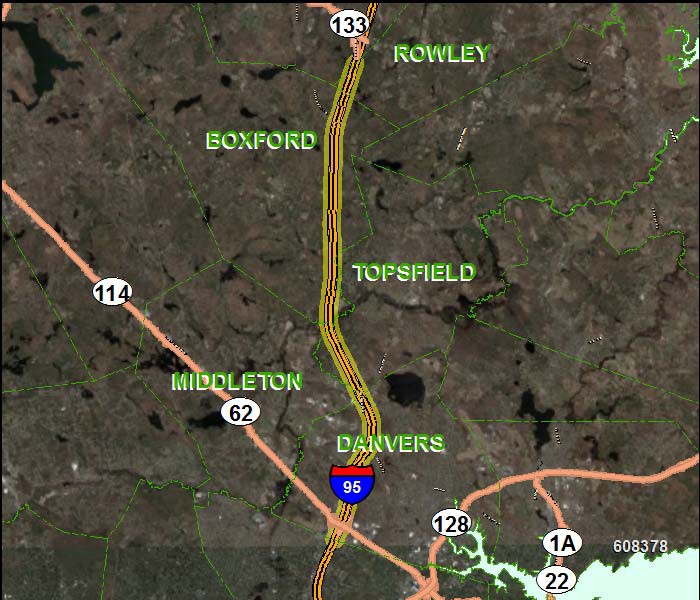
Municipality: Boxford, Danvers, Middleton, Rowley, Topsfield
Project Name: Interstate Maintenance and Related Work on Interstate 95
Evaluation Rating: MPO/CTPS Study:
Project Length (miles): 10.5
Project Description:
The interstate maintenance resurfacing will restore the pavement service life to a good to excellent condition and improve safety.
Year |
Funding Program |
Federal Funds |
Non‐Federal Funds |
Total Funds |
2021 |
National Highway Performance Program |
$524,160 |
$58,240 |
$582,400 |
|
Total Funding Programmed |
$524,160 |
$58,240 |
$582,400 |
ID Number: 608498
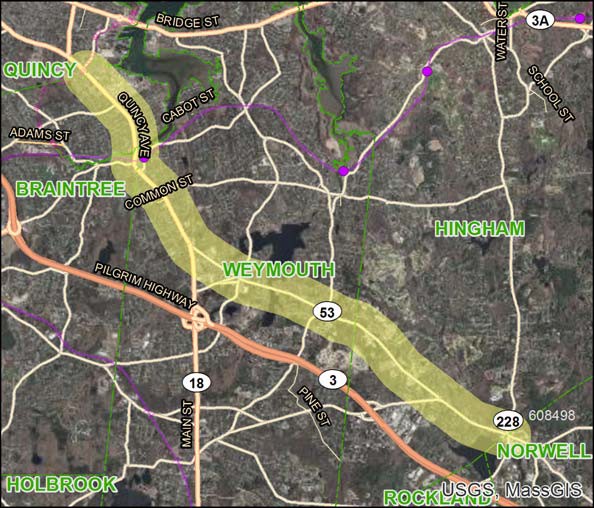
Municipality: Braintree, Hingham, Weymouth
Project Name: Resurfacing and related work on Route 53
Evaluation Rating: MPO/CTPS Study:
Project Length (miles): 6.81
Project Description:
The project consists of resurfacing on Route 53.
Year |
Funding Program |
Federal Funds |
Non‐Federal Funds |
Total Funds |
2022 |
National Highway Performance Program |
$6,343,680 |
$1,585,920 |
$7,929,600 |
|
Total Funding Programmed |
$6,343,680 |
$1,585,920 |
$7,929,600 |
ID Number: 608608
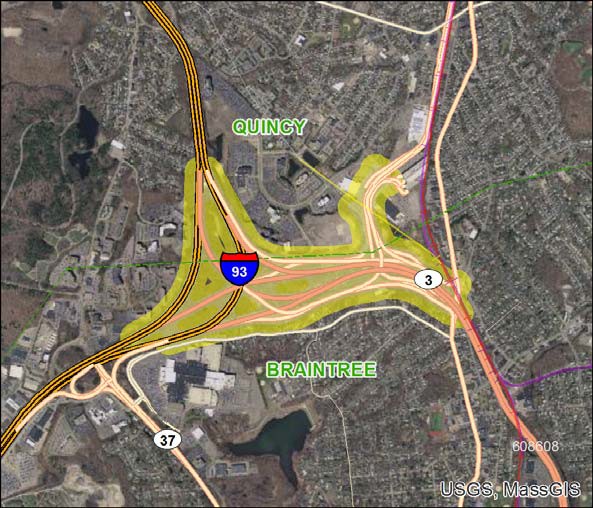
Municipality: Braintree, Quincy
Project Name: Highway Lighting Improvements at Interstate 93/Route 3 Interchange
Evaluation Rating: MPO/CTPS Study:
Project Length (miles): 8.14
Project Description:
The project consists of highway lighting improvements at the interchange of Interstate 93 and Route 3 in Braintree.
Year |
Funding Program |
Federal Funds |
Non‐Federal Funds |
Total Funds |
2019 |
National Highway Performance Program |
$6,307,653 |
$700,850 |
$7,008,503 |
2020 |
Surface Transportation Program |
$2,419,853 |
$268,873 |
$2,688,726 |
|
Total Funding Programmed |
$8,727,506 |
$969,723 |
$9,697,229 |
ID Number: 606316
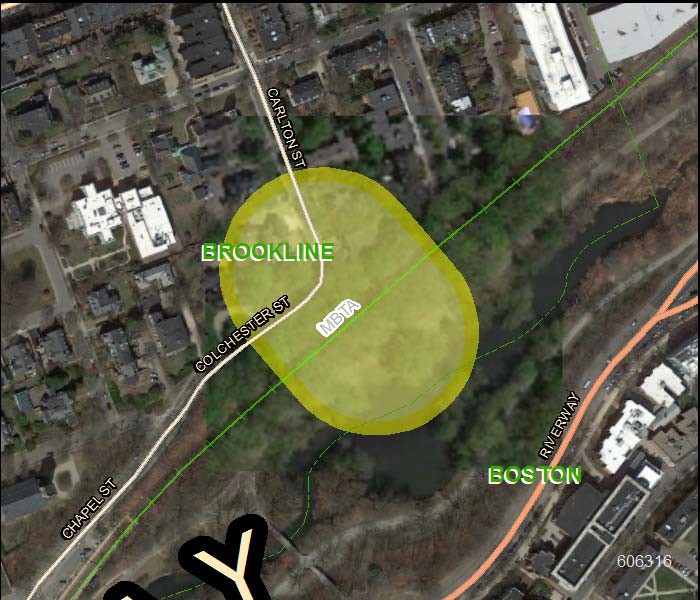
Municipality: Brookline
Project Name: Pedestrian Bridge Rehabilitation over MBTA off Carlton Street
Evaluation Rating: 41
MPO/CTPS Study:
Project Length (miles): 0.03
Project Description:
This project involves the rehabilitation of a historic steel-truss pedestrian bridge built in 1894. The bridge has been closed to pedestrian traffic since 1976 because it is in poor condition. This project will restore this bridge as a pedestrian connection.
Year |
Funding Program |
Federal Funds |
Non‐Federal Funds |
Total Funds |
2019 |
Congestion Mitigation and Air Quality Program |
$2,351,523 |
$587,881 |
$2,939,404 |
2019 |
Earmark HPP Demo ID (MA 149) |
$600,885 |
$150,221 |
$751,106 |
|
Total Funding Programmed |
$2,952,408 |
$738,102 |
$3,690,510 |
ID Number: 1570
Municipality: Cambridge, Somerville
Project Name: Green Line Extension Project - Extension to College Avenue with the Union Square Spur
Evaluation Rating: MPO/CTPS Study:
Project Length (miles): 4.12
Project Description:
The purpose of this project is to improve corridor mobility, boost transit ridership, improve regional air quality, ensure equitable distribution of transit services, and support opportunities for sustainable development. The project will extend the MBTA Green Line from a relocated Lechmere Station in East Cambridge to College Avenue in Medford, with a branch to Union Square in Somerville.
Year |
Funding Program |
Federal Funds |
Non‐Federal Funds |
Total Funds |
2019 |
Congestion Mitigation and Air Quality Program |
$22,547,520 |
$5,636,880 |
$28,184,400 |
2019 |
Surface Transportation Program |
$22,547,520 |
$5,636,880 |
$28,184,400 |
2020 |
Congestion Mitigation and Air Quality Program |
$16,024,960 |
$4,006,240 |
$20,031,200 |
2021 |
Congestion Mitigation and Air Quality Program |
$23,280,000 |
$5,820,000 |
$29,100,000 |
|
Total Funding Programmed |
$84,400,000 |
$21,100,000 |
$105,500,000 |
ID Number: 608482
Municipality: Cambridge, Somerville
Project Name: Resurfacing and Related Work on Route 28
Evaluation Rating: MPO/CTPS Study:
Project Length (miles): 2.78
Project Description:
The project consists of resurfacing on Route 28 in Cambridge and Somerville.
Year |
Funding Program |
Federal Funds |
Non‐Federal Funds |
Total Funds |
2020 |
National Highway Performance Program |
$6,833,050 |
$1,708,262 |
$8,541,312 |
|
Total Funding Programmed |
$6,833,050 |
$1,708,262 |
$8,541,312 |
ID Number: 609053
Municipality: Canton, Dedham, Norwood, Sharon, Westwood
Project Name: Highway Lighting Improvement at Interstate 93 and Interstate 95/Route 128
Evaluation Rating: MPO/CTPS Study:
Project Length (miles): 13.27
Project Description:
This project involves improvements to the lighting system at the area around the junction of Interstate 93 and Interstate 95/Route 128.
Year |
Funding Program |
Federal Funds |
Non‐Federal Funds |
Total Funds |
2023 |
National Highway Performance Program |
$3,600,000 |
$400,000 |
$4,000,000 |
|
Total Funding Programmed |
$3,600,000 |
$400,000 |
$4,000,000 |
ID Number: 608599
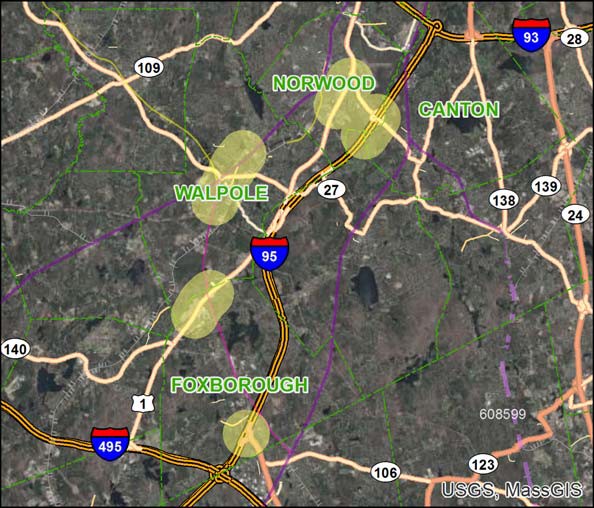
Municipality: Canton, Foxborough, Norwood, Sharon, Walpole
Project Name: Stormwater Improvements along Route 1, Route 1A, and Interstate 95
Evaluation Rating: MPO/CTPS Study:
Project Length (miles): 3.36
Project Description:
The project consists of stormwater drainage improvements along Route 1, Route 1A, and Interstate 95.
Year |
Funding Program |
Federal Funds |
Non‐Federal Funds |
Total Funds |
2022 |
Surface Transportation Program |
$420,988 |
$105,247 |
$526,235 |
|
Total Funding Programmed |
$420,988 |
$105,247 |
$526,235 |
ID Number: 608484
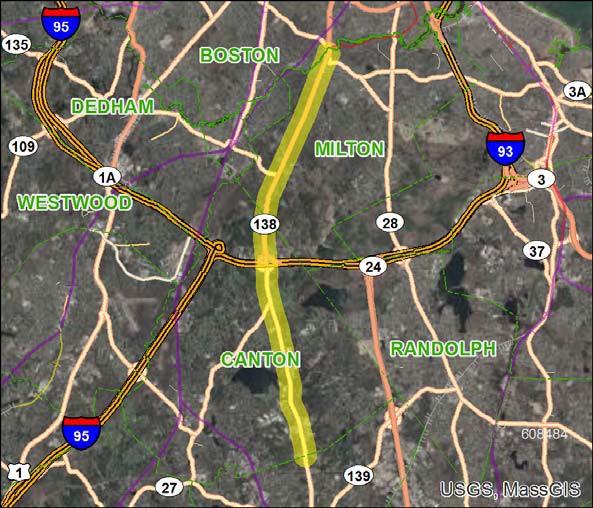
Municipality: Canton, Milton
Project Name: Resurfacing and Related Work on Route 138
Evaluation Rating: MPO/CTPS Study:
Project Length (miles): 8.62
Project Description:
The project consists of resurfacing on Route 138 in Canton and Milton.
Year |
Funding Program |
Federal Funds |
Non‐Federal Funds |
Total Funds |
2020 |
National Highway Performance Program |
$14,353,331 |
$3,588,333 |
$17,941,664 |
|
Total Funding Programmed |
$14,353,331 |
$3,588,333 |
$17,941,664 |
ID Number: 608611
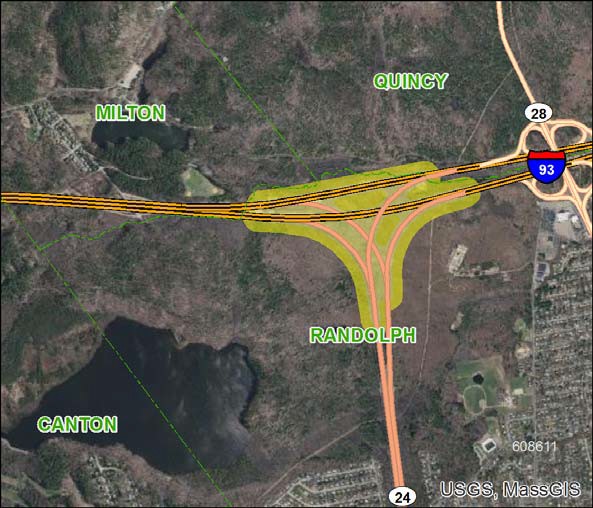
Municipality: Canton, Milton, Randolph
Project Name: Replacement and Rehabilitation of the
Highway Lighting System at the Route
24/Route 1/Interstate 93 Interchange
Evaluation Rating: MPO/CTPS Study:
Project Length (miles): 1.99
Project Description:
The project involves of replacement and rehabilitation of the highway lighting system at the interchange of Route 24, Route 1, and Interstate 93 in Canton, Milton, and Randolph.
Year |
Funding Program |
Federal Funds |
Non‐Federal Funds |
Total Funds |
2020 |
National Highway Performance Program |
$8,490,663 |
$943,407 |
$9,434,070 |
|
Total Funding Programmed |
$8,490,663 |
$943,407 |
$9,434,070 |
ID Number: 605287
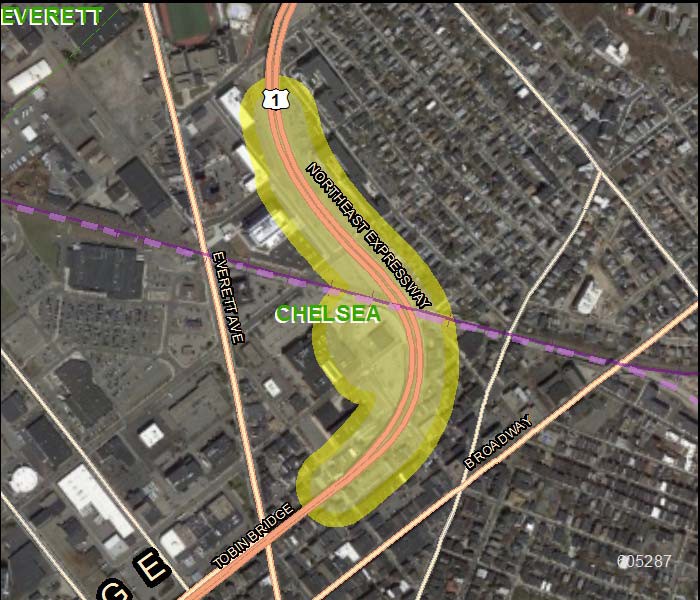
Municipality: Chelsea
Project Name: Bridge Betterment, Route 1 over Arlington and 5th Street/MBTA Railroad/Spruce Street
Evaluation Rating: MPO/CTPS Study:
Project Length (miles): 0.74
Project Description:
This project involves bridge betterment along Route 1 over Arlington and 5th Street/MBTA Railroad/Spruce Street.
Year |
Funding Program |
Federal Funds |
Non‐Federal Funds |
Total Funds |
2019 |
Bridge On NHS System |
$57,341,704 |
$14,335,426 |
$71,677,130 |
2020 |
Bridge On NHS System |
$32,762,346 |
$8,190,587 |
$40,952,933 |
2021 |
Bridge On NHS System |
$23,994,392 |
$5,998,598 |
$29,992,990 |
|
Total Funding Programmed |
$114,098,442 |
$28,524,611 |
$142,623,053 |
ID Number: 608078
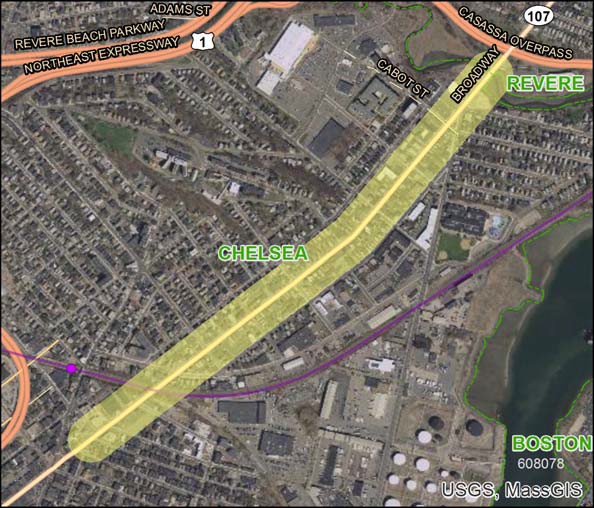
Municipality: Chelsea
Project Name: Reconstruction of Broadway, from City Hall Avenue to the Revere city line
Evaluation Rating: 61
MPO/CTPS Study:
Project Length (miles): 1.01
Project Description:
This project will reconstruct of one mile of Broadway. Improvements to the roadway will include surface and subsurface work, including replacement of utilities; construction of a dedicated bike lane along Broadway; and upgrades to the existing sidewalk network, including the installation of ADA compliant ramps at all intersections.
Year |
Funding Program |
Federal Funds |
Non‐Federal Funds |
Total Funds |
2022 |
Congestion Mitigation and Air Quality Program Regionally Prioritized |
$800,000 |
$200,000 |
$1,000,000 |
2022 |
Surface Transportation Program |
$7,222,323 |
$1,805,581 |
$9,027,904 |
|
Total Funding Programmed |
$8,022,323 |
$2,005,581 |
$10,027,904 |
ID Number: 608206
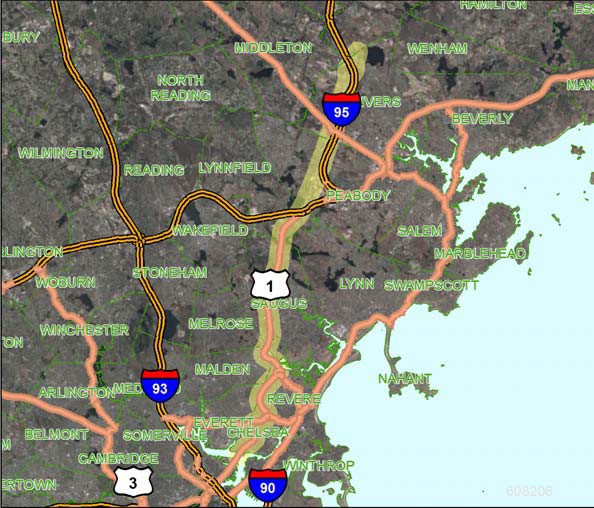
Municipality: Chelsea, Danvers, Lynnfield, Malden, Peabody, Revere, Saugus
Project Name: Guide and Traffic Sign Replacement on a
Section of Route 1
Evaluation Rating: MPO/CTPS Study:
Project Length (miles): 17.15
Project Description:
The project will replace guide and traffic signs and supports on Route 1 between the Tobin Bridge in Chelsea and Interstate 95 at the Danvers/Topsfield town line, including applicable signing on intersecting secondary roads. To ensure continued driver safety, new signs and supports meeting current retro-reflectivity and design standards will be installed.
Year |
Funding Program |
Federal Funds |
Non‐Federal Funds |
Total Funds |
2019 |
National Highway Performance Program |
$6,475,576 |
$719,508 |
$7,195,084 |
|
Total Funding Programmed |
$6,475,576 |
$719,508 |
$7,195,084 |
ID Number: 608007
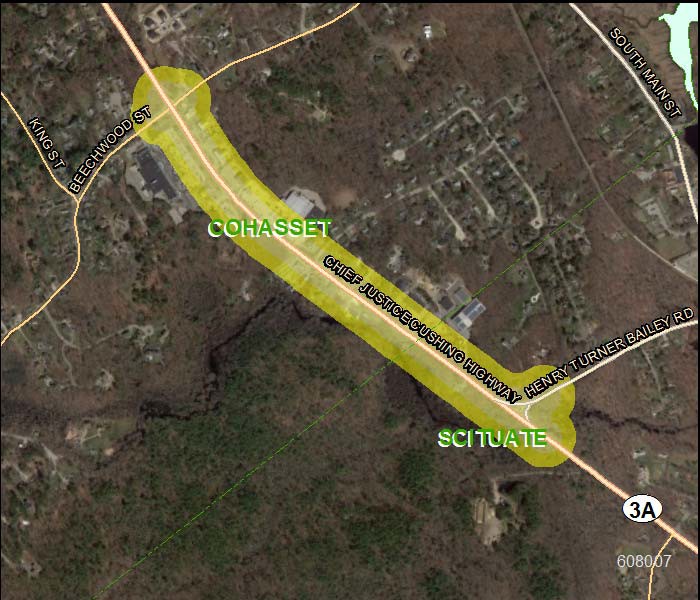
Municipality: Cohasset, Scituate
Project Name: Corridor Improvements and Related Work on Justice Cushing Highway (Route 3A), from Beechwood Street to the Scituate town line
Evaluation Rating: 37
MPO/CTPS Study: Subregional Priority Corridors (2014): Route 3A Cohasset and Scituate
Project Length (miles): 0.93
Project Description:
This project includes corridor improvements from the Beechwood Street intersection to the Cohasset/Scituate town line. The intersection of Route 3A and Beechwood Street will be upgraded with new traffic signal equipment as well as minor geometric improvements. The intersection of Route 3A and Henry Turner Bailey Road will be reviewed to determine if it meets the requirements for traffic signals and geometric improvements. Pedestrian and bicycle accommodations will be included along the corridor.
Year |
Funding Program |
Federal Funds |
Non‐Federal Funds |
Total Funds |
2023 |
Highway Safety Improvement Program |
$1,350,000 |
$150,000 |
$1,500,000 |
2023 |
Surface Transportation Program |
$2,400,000 |
$600,000 |
$3,000,000 |
2023 |
Transportation Alternatives |
$112,186 |
$28,046 |
$140,232 |
|
Total Funding Programmed |
$3,862,186 |
$778,046 |
$4,640,232 |
ID Number: 608495
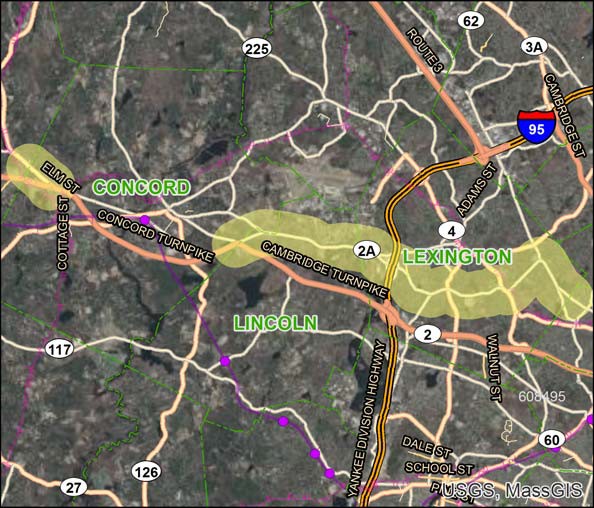
Municipality: Concord, Lexington, Lincoln
Project Name: Resurfacing and Related Work on Route 2A
Evaluation Rating: MPO/CTPS Study:
Project Length (miles): 8.93
Project Description:
The project consists of resurfacing and related work on Route 2A.
Year |
Funding Program |
Federal Funds |
Non‐Federal Funds |
Total Funds |
2023 |
National Highway Performance Program |
$2,784,000 |
$696,000 |
$3,480,000 |
|
Total Funding Programmed |
$2,784,000 |
$696,000 |
$3,480,000 |
ID Number: 608818
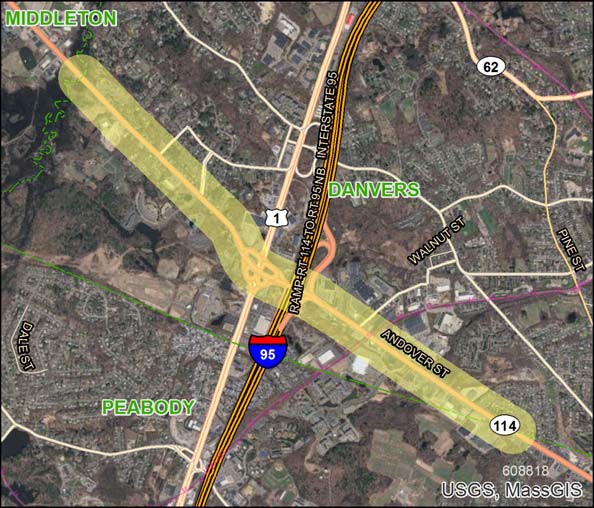
Municipality: Danvers
Project Name: Resurfacing and Related Work on Route 114
Evaluation Rating: MPO/CTPS Study:
Project Length (miles): 2.22
Project Description:
The project consists of resurfacing and related work on Route 114.
Year |
Funding Program |
Federal Funds |
Non‐Federal Funds |
Total Funds |
2022 |
National Highway Performance Program |
$1,480,192 |
$370,048 |
$1,850,240 |
|
Total Funding Programmed |
$1,480,192 |
$370,048 |
$1,850,240 |
ID Number: 609060
Municipality: Danvers, Lynnfield, Peabody
Project Name: Guide and Traffic Sign Replacement On Interstate 95/Route 128 (Task 'A' Interchange)
Evaluation Rating: MPO/CTPS Study:
Project Length (miles): 7.57
Project Description:
This project will replace guide and traffic signs at the Task 'A' interchange on Interstate-95/Route 128 in Danvers, Lynnfield, and Peabody.
Year |
Funding Program |
Federal Funds |
Non‐Federal Funds |
Total Funds |
2023 |
Highway Safety Improvement Program |
$443,576 |
$49,286 |
$492,862 |
|
Total Funding Programmed |
$443,576 |
$49,286 |
$492,862 |
ID Number: 608468
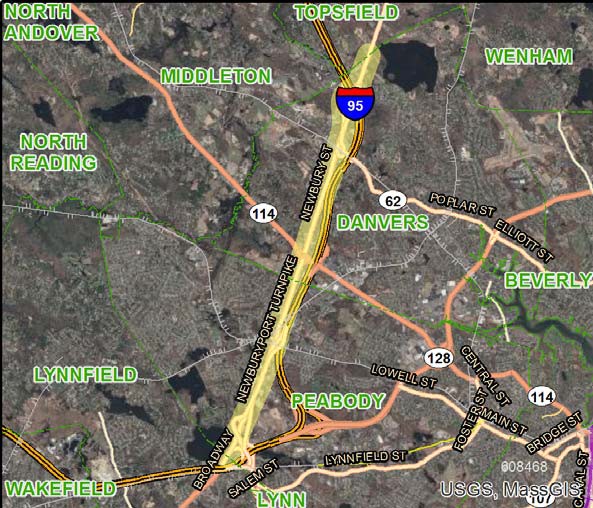
Municipality: Danvers, Peabody
Project Name: Resurfacing and Related Work on Route 1
Evaluation Rating: MPO/CTPS Study:
Project Length (miles): 6.2
Project Description:
The work consists of resurfacing on Route 1 in Danvers and Peabody.
Year |
Funding Program |
Federal Funds |
Non‐Federal Funds |
Total Funds |
2019 |
National Highway Performance Program |
$9,303,120 |
$2,325,780 |
$11,628,900 |
|
Total Funding Programmed |
$9,303,120 |
$2,325,780 |
$11,628,900 |
ID Number: 607899
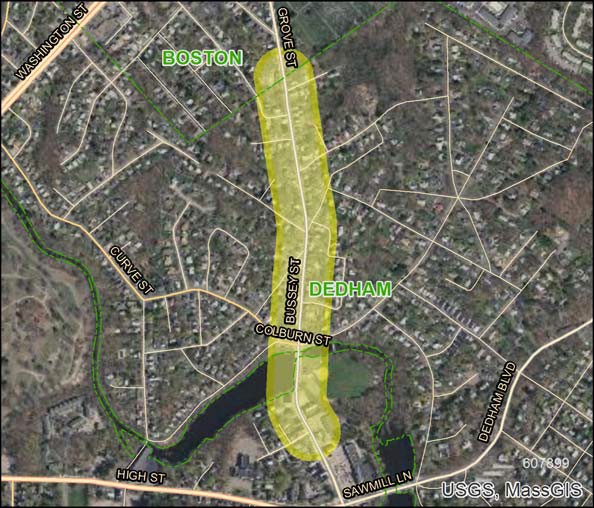
Municipality: Dedham
Project Name: Pedestrian Improvements along Bussey Street
Evaluation Rating: 35
MPO/CTPS Study:
Project Length (miles): 0.62
Project Description:
Improvements along the Bussey Street corridor will include resetting and setting the curb and reconstructing ADA compliant sidewalks and ramps on both sides of the roadway. Some pavement reconstruction may be necessary to obtain the necessary curb reveal. Minor geometric improvements at the intersection with Colburn Street and Clisby Avenue will make them more pedestrian friendly. Shared bicycle accommodations are planned.
Year |
Funding Program |
Federal Funds |
Non‐Federal Funds |
Total Funds |
2023 |
Surface Transportation Program |
$3,200,000 |
$800,000 |
$4,000,000 |
2023 |
Transportation Alternatives |
$421,757 |
$105,439 |
$527,196 |
|
Total Funding Programmed |
$3,621,757 |
$905,439 |
$4,527,196 |
ID Number: 607901
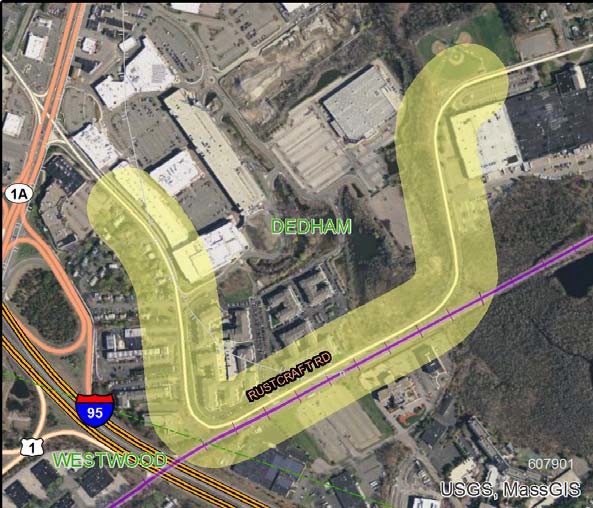
Municipality: Dedham
Project Name: Pedestrian Improvements along Elm Street and Rustcraft Road Corridors
Evaluation Rating: 44
MPO/CTPS Study:
Project Length (miles): 1.75
Project Description:
Improvements along the Elm Street and Rustcraft Road corridor will primarily consist of the installation of new curbing, sidewalks, and ramps on both sides of the corridor. This area will also require drainage improvements to modify stormwater management from sheet flow to catch basins, which is necessary with the installation of new curbs and sidewalks. Minor roadway widening is anticipated to achieve a minimum roadway width to accommodate a five-foot bicycle lane. An off-road area for drop off and pick up at the Dedham Corporate Center Station on the MBTA commuter rail has already been constructed by the Town of Dedham.
Year |
Funding Program |
Federal Funds |
Non‐Federal Funds |
Total Funds |
2021 |
Congestion Mitigation and Air Quality Program |
$2,584,478 |
$646,119 |
$3,230,597 |
|
Total Funding Programmed |
$2,584,478 |
$646,119 |
$3,230,597 |
ID Number: 608587
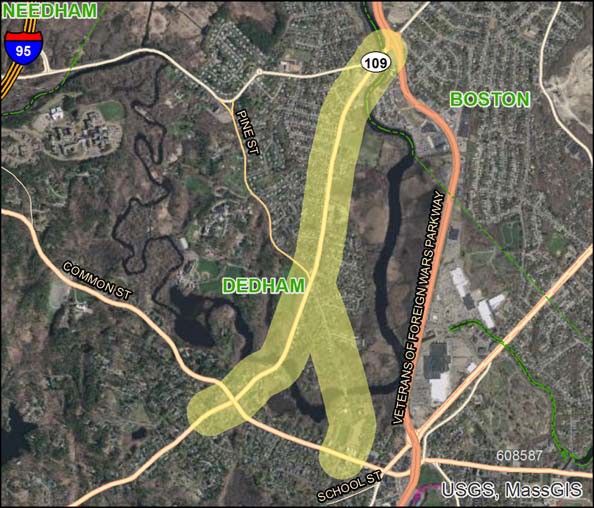
Municipality: Dedham
Project Name: Reconstruction and Related Work on Bridge Street (Route 109) and Ames Street
Evaluation Rating: MPO/CTPS Study:
Project Length (miles): 2.24
Project Description:
The project consists of the reconstruction of Bridge Street (Route 109) and Ames Street and related work.
Year |
Funding Program |
Federal Funds |
Non‐Federal Funds |
Total Funds |
2019 |
National Highway Performance Program |
$4,420,402 |
$1,105,101 |
$5,525,503 |
|
Total Funding Programmed |
$4,420,402 |
$1,105,101 |
$5,525,503 |
ID Number: 608596
Municipality: Essex
Project Name: Superstructure Replacement, E-11-001 (2TV), Route 133 (Main Street) over Essex River
Evaluation Rating: MPO/CTPS Study:
Project Length (miles): 0.4
Project Description:
This bridge preservation project will address the bridge that carries Route 133 (Main Street) over the Essex River in Essex.
Year |
Funding Program |
Federal Funds |
Non‐Federal Funds |
Total Funds |
2021 |
Bridge On NHS System |
$3,609,088 |
$902,272 |
$4,511,360 |
|
Total Funding Programmed |
$3,609,088 |
$902,272 |
$4,511,360 |
ID Number: 609102

Municipality: Essex, Gloucester, Manchester-by-the-Sea, Wenham
Project Name: Pavement Preservation and Related Work on Route 128
Evaluation Rating: MPO/CTPS Study:
Project Length (miles): 10.83
Project Description:
This project involves pavement preservation and related work on Route 128.
Year |
Funding Program |
Federal Funds |
Non‐Federal Funds |
Total Funds |
2023 |
National Highway Performance Program |
$10,985,442 |
$2,746,360 |
$13,731,802 |
|
Total Funding Programmed |
$10,985,442 |
$2,746,360 |
$13,731,802 |
ID Number: 607652
Municipality: Everett
Project Name: Reconstruction of Ferry Street, South Ferry Street, and a portion of Elm Street
Evaluation Rating: 73
MPO/CTPS Study: Community Transportation Technical Assistance Program (2013)
Project Description:
The project will reconstruct Ferry Street from the Malden city line (Belmont Street) to Route 16 and Elm Street between Ferry Street and Woodlawn Street. The work will include resurfacing and construction of new sidewalks, wheelchair ramps, and curb extensions. The traffic signals at five locations and the fire station will be upgraded. The signalized intersection at Chelsea Street will be replaced by a roundabout.
Year |
Funding Program |
Federal Funds |
Non‐Federal Funds |
Total Funds |
2020 |
Congestion Mitigation and Air Quality Program |
$1,507,416 |
$376,854 |
$1,884,270 |
2020 |
Highway Safety Improvement Program |
$945,266 |
$105,030 |
$1,050,296 |
2020 |
Surface Transportation Program |
$10,484,288 |
$2,621,072 |
$13,105,360 |
2020 |
Transportation Alternatives |
$579,530 |
$144,882 |
$724,412 |
|
Total Funding Programmed |
$13,516,500 |
$3,247,838 |
$16,764,338 |
ID Number: 608210
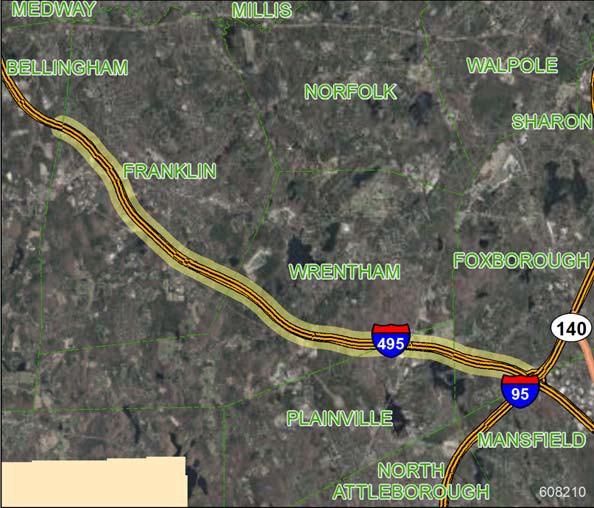
Municipality: Foxborough, Franklin, Plainville, Wrentham
Project Name: Interstate Maintenance Resurfacing and Related Work on Interstate 495
Evaluation Rating: MPO/CTPS Study:
Project Length (miles): 11.65
Project Description:
This interstate maintenance resurfacing project consists of resurfacing the pavement with friction course and improving safety.
Year |
Funding Program |
Federal Funds |
Non‐Federal Funds |
Total Funds |
2022 |
National Highway Performance Program |
$10,348,128 |
$1,149,792 |
$11,497,920 |
|
Total Funding Programmed |
$10,348,128 |
$1,149,792 |
$11,497,920 |
ID Number: 608480
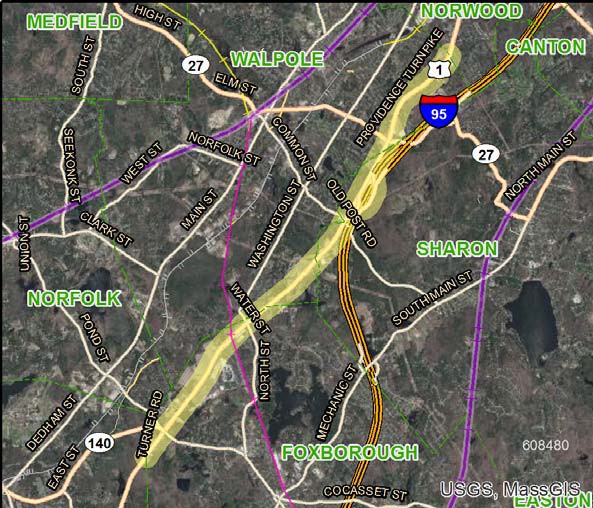
Municipality: Foxborough, Sharon, Walpole
Project Name: Resurfacing and Related Work on Route 1
Evaluation Rating: MPO/CTPS Study:
Project Length (miles): 7.54
Project Description:
The project consists of resurfacing on Route 1 in Foxborough, Sharon, and Walpole.
Year |
Funding Program |
Federal Funds |
Non‐Federal Funds |
Total Funds |
2020 |
National Highway Performance Program |
$6,429,546 |
$1,607,387 |
$8,036,933 |
|
Total Funding Programmed |
$6,429,546 |
$1,607,387 |
$8,036,933 |
ID Number: 608228
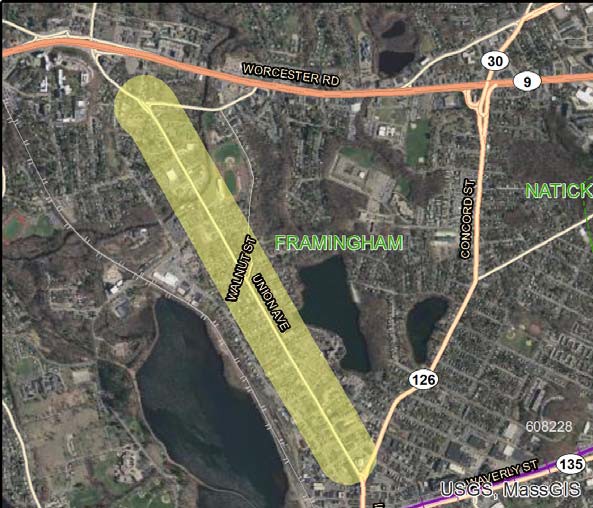
Municipality: Framingham
Project Name: Reconstruction of Union Avenue, from Proctor Street to Main Street
Evaluation Rating: 58
MPO/CTPS Study: Safety and Operational Improvements at Selected Intersections (2011)
Project Length (miles): 1.36
Project Description:
The project involves improvements to Union Avenue from Proctor Street to Main Street, with limited work on intersecting local roadways. Specifically, the proposed improvements include full-depth pavement reconstruction, sidewalk reconstruction, traffic signal improvements, streetscape improvements, bicycle accommodation, warning and regulatory signing, and pavement markings. The existing traffic signal at Mt. Wayte Avenue will be reconstructed and new traffic signals will be erected at the intersections of Union Avenue with Lincoln Street and Walnut Street. Streetscape and ornamental lighting improvements will be made from the south end of the project area to the intersection of Union Avenue and Lincoln Street. Minor roadway widening of less than two feet is proposed between Proctor Street and Lexington Street in order to provide a sufficient cross section for travel lanes, bike lanes, and on-street parking. The Town of Framingham is constructing significant stormwater improvements as part of a separate utility project to be completed prior to the roadway improvements.
Year |
Funding Program |
Federal Funds |
Non‐Federal Funds |
Total Funds |
2021 |
Highway Safety Improvement Program |
$900,000 |
$100,000 |
$1,000,000 |
2021 |
Surface Transportation Program |
$805,113 |
$201,278 |
$1,006,391 |
2021 |
Transportation Alternatives |
$5,694,378 |
$1,423,595 |
$7,117,973 |
|
Total Funding Programmed |
$7,399,491 |
$1,724,873 |
$9,124,364 |
ID Number: 606501
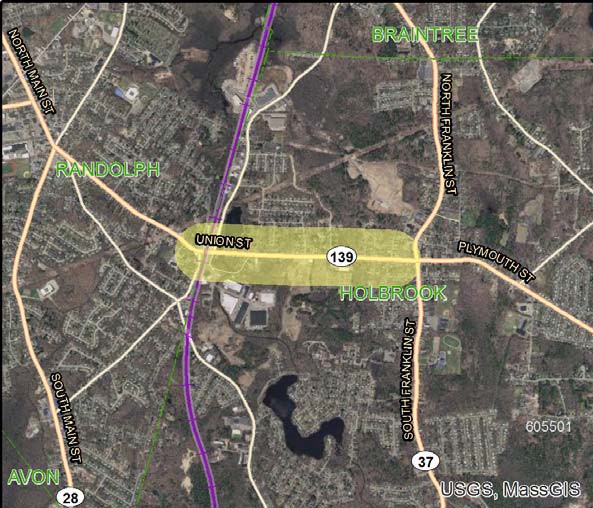
Municipality: Holbrook
Project Name: Reconstruction of Union Street (Route 139), from Linfield Street to Centre Street/Water Street
Evaluation Rating: 45
MPO/CTPS Study:
Project Length (miles): 0.87
Project Description:
The purpose of this project is to rehabilitate a segment of Union Street from Linfield Street to Centre Street and Water Street. The proposed improvements will address poor roadway pavement conditions, deteriorating sidewalks, a lack of curbing, and necessary drainage improvements. The project will also address the need for upgraded pavement markings, signage, and guard rails.
Year |
Funding Program |
Federal Funds |
Non‐Federal Funds |
Total Funds |
2021 |
Earmark Demo ID (MA 177) |
$1,221,800 |
$305,450 |
$1,527,250 |
2021 |
Surface Transportation Program |
$375,064 |
$93,766 |
$468,830 |
2021 |
Transportation Alternatives |
$231,270 |
$57,817 |
$289,087 |
|
Total Funding Programmed |
$1,828,134 |
$457,033 |
$2,285,167 |
ID Number: 607428
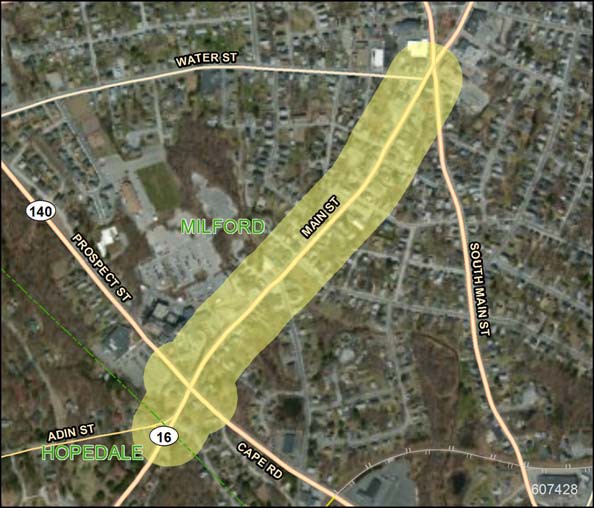
Municipality: Hopedale, Milford
Project Name: Resurfacing and Intersection Improvements on Route 16 (Main Street), from Water Street to the Hopedale town line
Evaluation Rating: 54
MPO/CTPS Study:
Project Length (miles): 0.62
Project Description:
The project involves resurfacing along Route 16, from Water Street to just west of the Hopedale town line. Additional work includes sidewalk reconstruction, culvert repairs, and related work. The project includes improvements to the intersection of Route 16 and Route 140, including upgrades to signal equipment and widening where feasible.
Year |
Funding Program |
Federal Funds |
Non‐Federal Funds |
Total Funds |
2019 |
Congestion Mitigation and Air Quality Program |
$800,000 |
$200,000 |
$1,000,000 |
2019 |
Highway Safety Improvement Program |
$1,771,150 |
$196,794 |
$1,967,944 |
2019 |
Surface Transportation Program |
$6,296,998 |
$1,574,250 |
$7,871,248 |
|
Total Funding Programmed |
$8,868,148 |
$1,971,044 |
$10,839,192 |
ID Number: 606043
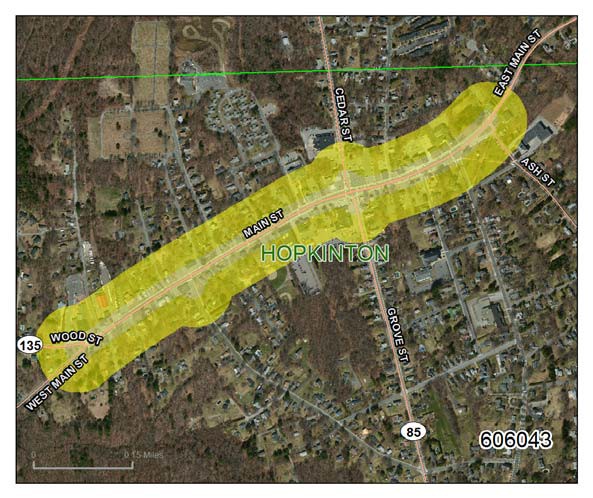
Municipality: Hopkinton
Project Name: Signal and Intersection Improvements on Route 135
Evaluation Rating: 65
MPO/CTPS Study:
Project Length (miles): 0.82
Project Description:
The project involves improvements at the intersections of Route 135 with Route 85, Pleasant Street, and Wood Street. The improvements include signal equipment upgrades, geometric modifications, and the addition of lanes at the Route 85 intersection; possible signalization at Pleasant Street; and minor widening, geometric modifications, and equipment upgrades at Wood Street. The project includes pavement rehabilitation from Ash Street to Wood Street, drainage improvements as needed, reconstruction of sidewalks and wheelchair ramps, and streetscape enhancements in the town center.
Year |
Funding Program |
Federal Funds |
Non‐Federal Funds |
Total Funds |
2020 |
Congestion Mitigation and Air Quality Program |
$1,892,340 |
$473,085 |
$2,365,425 |
2020 |
Surface Transportation Program |
$4,719,355 |
$1,179,839 |
$5,899,194 |
|
Total Funding Programmed |
$6,611,695 |
$1,652,924 |
$8,264,619 |
ID Number: 607977
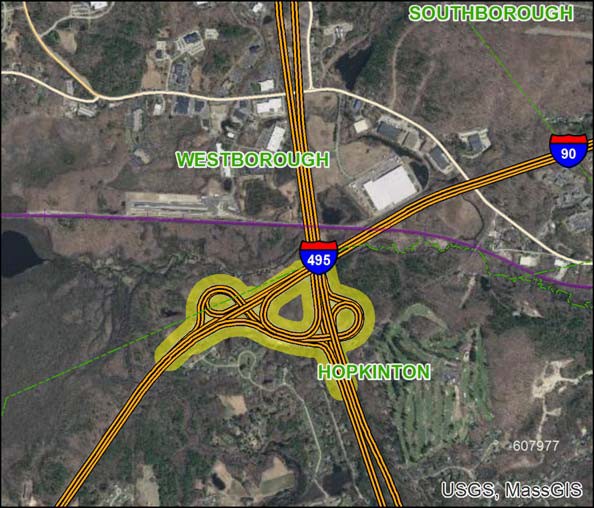
Municipality: Hopkinton, Westborough
Project Name: Reconstruction of Interstate 90/Interstate 495 Interchange
Evaluation Rating: MPO/CTPS Study:
Project Length (miles): 3.61
Project Description:
The project would improve the interchange of Interstate 90 and Interstate 495. A number of alternatives are being developed and evaluated in a feasibility study.
Year |
Funding Program |
Federal Funds |
Non‐Federal Funds |
Total Funds |
2022 |
National Highway Performance Program |
$9,787,151 |
$2,446,788 |
$12,233,939 |
2022 |
Non‐Federal Aid |
|
$18,112,483 |
|
2022 |
Non‐Federal Aid |
$22,000,000 |
$5,500,000 |
$27,500,000 |
2023 |
Non‐Federal Aid |
|
$18,112,483 |
|
2023 |
Non‐Federal Aid |
$24,000,000 |
$6,000,000 |
$30,000,000 |
|
Total Funding Programmed |
$55,787,151 |
$50,171,754 |
$105,958,905 |
ID Number: 601607
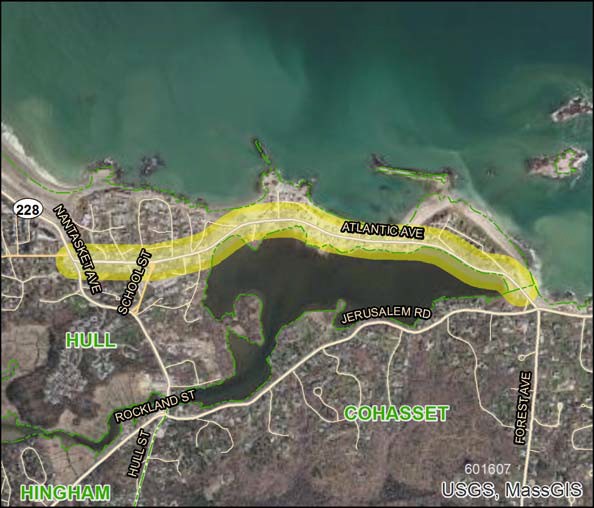
Municipality: Hull
Project Name: Reconstruction of Atlantic Avenue and related work, from Nantasket Avenue to Cohasset town line
Evaluation Rating: 44
MPO/CTPS Study:
Project Length (miles): 1.25
Project Description:
This project involves the reconstruction of Atlantic Avenue from Nantasket Avenue to the Cohasset town line. Minor widening of the roadway is also planned. Related work includes drainage improvements and reconstruction of sidewalks.
Year |
Funding Program |
Federal Funds |
Non‐Federal Funds |
Total Funds |
2021 |
Surface Transportation Program |
$5,321,339 |
$1,330,335 |
$6,651,674 |
|
Total Funding Programmed |
$5,321,339 |
$1,330,335 |
$6,651,674 |
ID Number: 605743
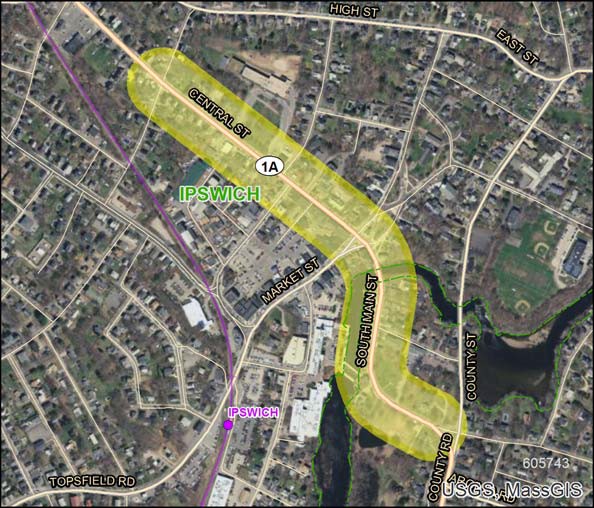
Municipality: Ipswich
Project Name: Resurfacing and Related Work on Central and South Main Streets
Evaluation Rating: 47
MPO/CTPS Study:
Project Length (miles): 0.55
Project Description:
The project will reconstruct 3,200 feet of roadway between Mineral Street and Poplar Street in Ipswich to improve the roadway surface. Minor geometric improvements at intersection and pedestrian crossings will be included. Sidewalks and wheelchair ramps will be improved in selected areas for ADA compliance. The drainage system is undersized and will be upgraded.
Year |
Funding Program |
Federal Funds |
Non‐Federal Funds |
Total Funds |
2023 |
Surface Transportation Program |
$2,000,000 |
$500,000 |
$2,500,000 |
2023 |
Transportation Alternatives |
$415,640 |
$103,910 |
$519,550 |
|
Total Funding Programmed |
$2,415,640 |
$603,910 |
$3,019,550 |
ID Number: 602077
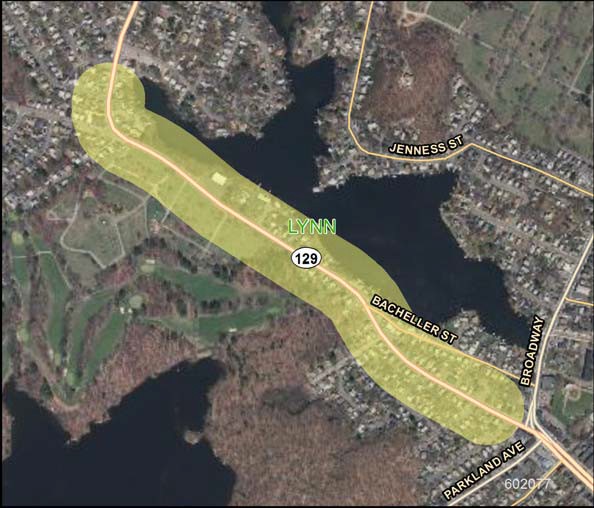
Municipality: Lynn
Project Name: Reconstruction on Route 129 (Lynnfield Street), from Great Woods Road to Wyoma Square
Evaluation Rating: 38
MPO/CTPS Study:
Project Length (miles): 0.72
Project Description:
This roadway and safety improvement project on Route 129 in Lynn includes drainage improvements, curbing, new sidewalks, wheelchair ramps, intersection improvements, pavement markings, signing, landscaping, and other incidental work. The project limits are from Colonial Avenue to about 150 feet south of Floyd Avenue (between Floyd and Cowdrey Road) for a total of 0.72 miles.
Year |
Funding Program |
Federal Funds |
Non‐Federal Funds |
Total Funds |
2020 |
Congestion Mitigation and Air Quality Program |
$800,000 |
$200,000 |
$1,000,000 |
2020 |
Surface Transportation Program |
$2,863,661 |
$715,915 |
$3,579,576 |
|
Total Funding Programmed |
$3,663,661 |
$915,915 |
$4,579,576 |
ID Number: 608817
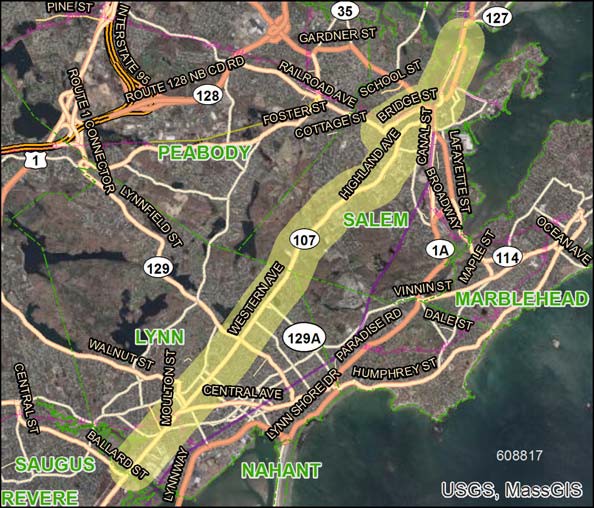
Municipality: Lynn, Salem
Project Name: Resurfacing and Related Work on Route 107
Evaluation Rating: MPO/CTPS Study:
Project Length (miles): 8.11
Project Description:
This project involves resurfacing and related work on Route 107 in Lynn and Salem.
Year |
Funding Program |
Federal Funds |
Non‐Federal Funds |
Total Funds |
2022 |
National Highway Performance Program |
$2,022,048 |
$505,512 |
$2,527,560 |
|
Total Funding Programmed |
$2,022,048 |
$505,512 |
$2,527,560 |
ID Number: 604952
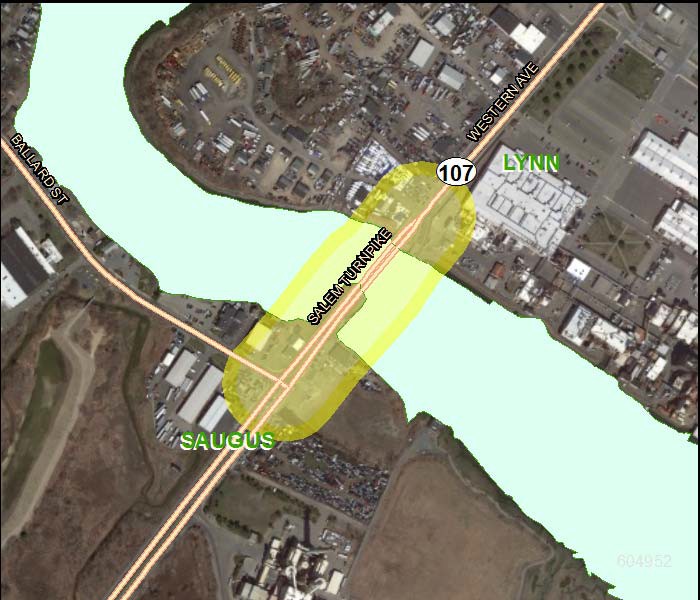
Municipality: Lynn, Saugus
Project Name: Bridge Replacement, Route 107 over the Saugus River (a.k.a. Belden G. Bly Bridge)
Evaluation Rating: MPO/CTPS Study:
Project Length (miles): 0.17
Project Description:
This project consists of the construction of the Route 107 (Fox Hill Bridge), which spans the Saugus River. The new bridge will serve as the permanent replacement for the proposed temporary drawbridge. The new bridge (a.k.a. Belden G. Bly Bridge) will be a single leaf bascule drawbridge.
Year |
Funding Program |
Federal Funds |
Non‐Federal Funds |
Total Funds |
2019 |
Bridge On NHS System |
$11,915,382 |
$2,978,846 |
$14,894,228 |
2020 |
Bridge On NHS System |
$11,915,382 |
$2,978,846 |
$14,894,228 |
2021 |
Bridge On NHS System |
$13,622,683 |
$3,405,671 |
$17,028,354 |
2022 |
Bridge On NHS System |
$17,397,388 |
$4,349,347 |
$21,746,735 |
2023 |
Bridge On NHS System |
$4,726,076 |
$1,181,519 |
$5,907,595 |
|
Total Funding Programmed |
$59,576,911 |
$14,894,229 |
$74,471,140 |
ID Number: 607477
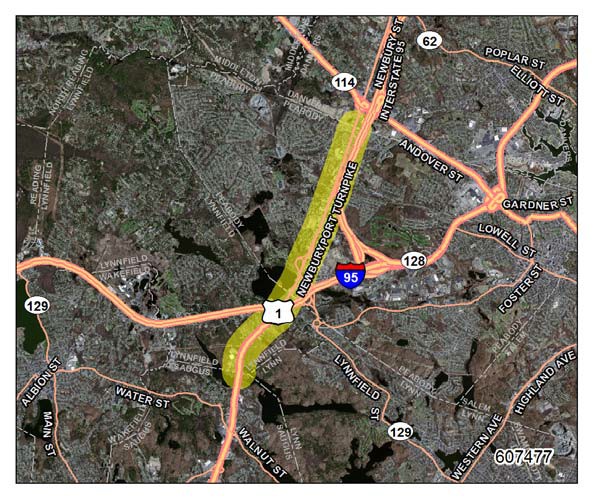
Municipality: Lynnfield, Peabody
Project Name: Resurfacing and Related Work on Route 1
Evaluation Rating: MPO/CTPS Study:
Project Length (miles): 2.7
Project Description:
The project will resurface 2.7 miles of Route 1 in Lynnfield and Peabody from milepoint 58.8 to 61.5.
Year |
Funding Program |
Federal Funds |
Non‐Federal Funds |
Total Funds |
2021 |
National Highway Performance Program |
$5,939,648 |
$1,484,912 |
$7,424,560 |
|
Total Funding Programmed |
$5,939,648 |
$1,484,912 |
$7,424,560 |
ID Number: 608219
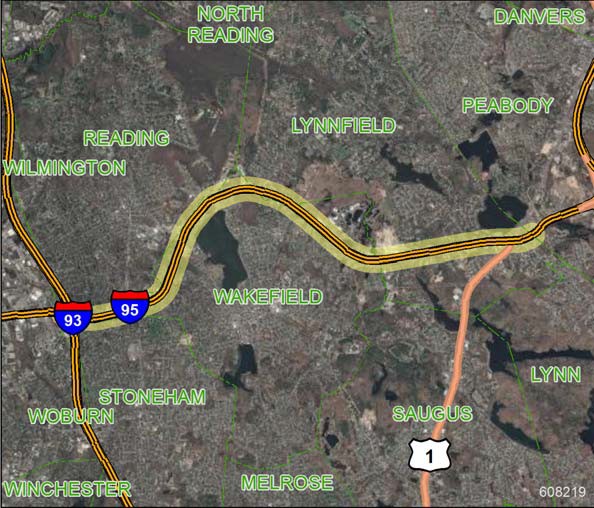
Municipality: Lynnfield, Reading, Wakefield
Project Name: Interstate Maintenance Resurfacing and Related Work on Interstate 95
Evaluation Rating: MPO/CTPS Study:
Project Length (miles): 7.49
Project Description:
The interstate maintenance project on Interstate 95 in Lynnfield, Reading, and Wakefield involves resurfacing and safety improvements.
Year |
Funding Program |
Federal Funds |
Non‐Federal Funds |
Total Funds |
2019 |
National Highway Performance Program |
$3,711,053 |
$412,339 |
$4,123,392 |
|
Total Funding Programmed |
$3,711,053 |
$412,339 |
$4,123,392 |
ID Number: 608205
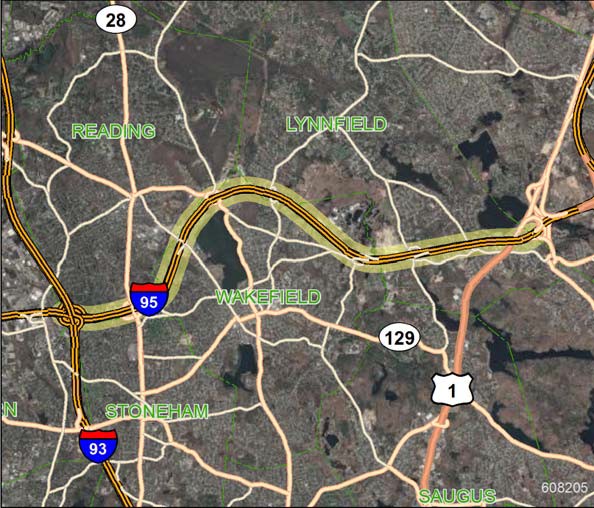
Municipality: Lynnfield, Reading, Wakefield
Project Name: Guide and Traffic Sign Replacement on a Section of Interstate 95
Evaluation Rating: MPO/CTPS Study:
Project Length (miles): 7.58
Project Description:
This project consists of replacing guide and traffic signs, and supports, on Interstate 95/Route 128 between Route 28 (Exit 38) in Reading and Route 1 (Exit 44) in Lynnfield, including applicable signs on intersecting secondary roads. To ensure driver safety, new signs and supports will meet current retro-reflectivity and design standards.
Year |
Funding Program |
Federal Funds |
Non‐Federal Funds |
Total Funds |
2019 |
National Highway Performance Program |
$4,061,959 |
$451,328 |
$4,513,287 |
|
Total Funding Programmed |
$4,061,959 |
$451,328 |
$4,513,287 |
ID Number: 607329
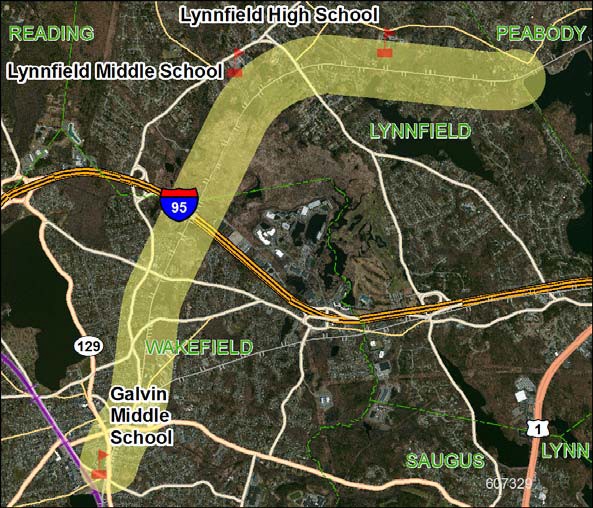
Municipality: Lynnfield, Wakefield
Project Name: Rail Trail Extension, from the Galvin Middle School to Lynnfield/Peabody town line
Evaluation Rating: MPO/CTPS Study:
Project Length (miles): 4.35
Project Description:
The proposed Wakefield/Lynnfield Rail Trail extends from the Galvin Middle School in Wakefield north to the Lynnfield/Peabody town line, a distance of approximately 4.4 miles. Approximately 1.9 miles of the trail is located within Wakefield and 2.5 miles in Lynnfield. The corridor is the southern section of the former Newburyport Railroad and will connect to Peabody and the regional Border to Boston Trail.
Year |
Funding Program |
Federal Funds |
Non‐Federal Funds |
Total Funds |
2021 |
Congestion Mitigation and Air Quality Program |
$8,253,247 |
$2063312 |
$10,316,559 |
|
Total Funding Programmed |
$8,253,247 |
$2,063,312 |
$10,316,559 |
ID Number: 608275
Municipality: Malden
Project Name: Lighting and Sidewalk Improvements on Exchange Street
Evaluation Rating: 59
MPO/CTPS Study:
Project Length (miles): 0.31
Project Description:
The project will replace street lighting along Exchange Street from Abbott Street to just east of Middlesex Street. The project will provide new LED street lights to improve access and amenities in the Downtown Malden Business District. Sidewalks and ramps will be reconstructed in the area.
Year |
Funding Program |
Federal Funds |
Non‐Federal Funds |
Total Funds |
2020 |
Congestion Mitigation and Air Quality Program |
$800,000 |
$200,000 |
$1,000,000 |
|
Total Funding Programmed |
$800,000 |
$200,000 |
$1,000,000 |
ID Number: 608146
Municipality: Marblehead
Project Name: Intersection Improvements to Pleasant Street at Village, Vine, and Cross Streets
Evaluation Rating: 40
MPO/CTPS Study:
Project Length (miles): 0.12
Project Description:
The intersection improvements will include realignment of Vine Street to form a T intersection; narrowing and realigning Pleasant Street to minimize crossing distance; the installation of new sidewalks and signs; enhanced lighting; modest drainage modifications; ADA/AAB crossing enhancements; and shared bicycle accommodations. The project area is approximately 800 linear feet: 400 linear feet on Pleasant Street (200 feet east and west of the intersection), 150 linear feet on Village Street, 150 linear feet on Vine Street, and 100 linear feet on Cross Street. Drainage and utility adjustments will be made as needed to accommodate the proposed intersection channelization modifications.
Year |
Funding Program |
Federal Funds |
Non‐Federal Funds |
Total Funds |
2021 |
Surface Transportation Program |
$581,256 |
$145,314 |
$726,570 |
|
Total Funding Programmed |
$581,256 |
$145,314 |
$726,570 |
ID Number: 608467
Municipality: Marlborough
Project Name: Resurfacing on Route 20
Evaluation Rating: MPO/CTPS Study:
Project Length (miles): 12.41
Project Description:
The proposed resurfacing extends from just west of Peters Avenue to just east of Wayside Inn Road, for a distance of 2.4 miles. Additional work will include traffic signal upgrades, reconstruction of existing sidewalks, as well as construction of new sidewalk.
Year |
Funding Program |
Federal Funds |
Non‐Federal Funds |
Total Funds |
2019 |
National Highway Performance Program |
$12,922,416 |
$1,435,824 |
$14,358,240 |
|
Total Funding Programmed |
$12,922,416 |
$1,435,824 |
$14,358,240 |
ID Number: 608566
Municipality: Marlborough
Project Name: Improvements at Route 20 (East Main Street) at Curtis Avenue
Evaluation Rating: MPO/CTPS Study:
Project Length (miles): 0.12
Project Description:
The project consists of improvements to the intersection of Route 20 (East Main Street) and Curtis Avenue in Marlborough.
Year |
Funding Program |
Federal Funds |
Non‐Federal Funds |
Total Funds |
2023 |
Highway Safety Improvement Program |
$2,505,600 |
$278,400 |
$2,784,000 |
|
Total Funding Programmed |
$2,505,600 |
$278,400 |
$2,784,000 |
ID Number: 608637
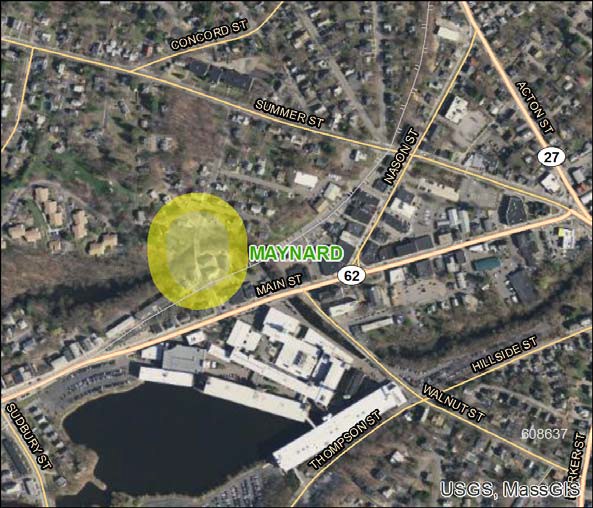
Municipality: Maynard
Project Name: Bridge Replacement, M-10-006, Florida Road over Assabet River
Evaluation Rating: MPO/CTPS Study:
Project Length (miles): 0.01
Project Description:
This is a functional replacement of the existing bridge the carries Florida Road over the Assabet River in Maynard. The work will include reconstruction of the approaches and related safety improvements.
Year |
Funding Program |
Federal Funds |
Non‐Federal Funds |
Total Funds |
2021 |
Bridge Surface Transportation Program‐Bridge‐Off System |
$1,317,120 |
$329,280 |
$1,646,400 |
|
Total Funding Programmed |
$1,317,120 |
$329,280 |
$1,646,400 |
ID Number: 608835
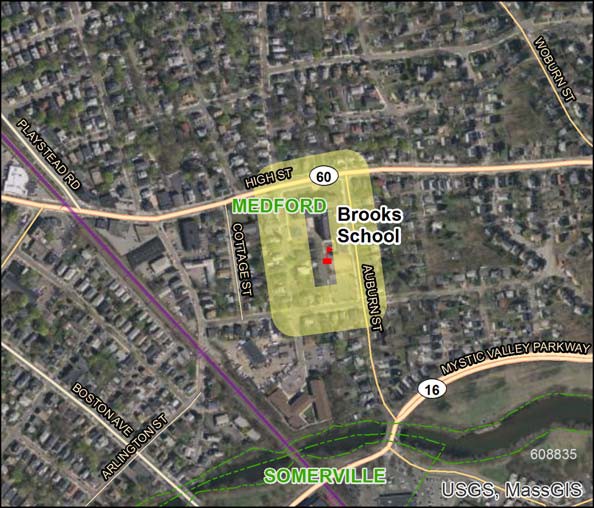
Municipality: Medford
Project Name: Safe Routes to School Improvements at Brooks Elementary
Evaluation Rating: MPO/CTPS Study:
Project Length (miles): Project Description:
This Safe Routes to School project will make improvements around Brooks Elementary School in Medford to provide safer access for students.
Year |
Funding Program |
Federal Funds |
Non‐Federal Funds |
Total Funds |
2020 |
Transportation Alternatives |
$960,000 |
$240,000 |
$1,200,000 |
|
Total Funding Programmed |
$960,000 |
$240,000 |
$1,200,000 |
ID Number: 607330
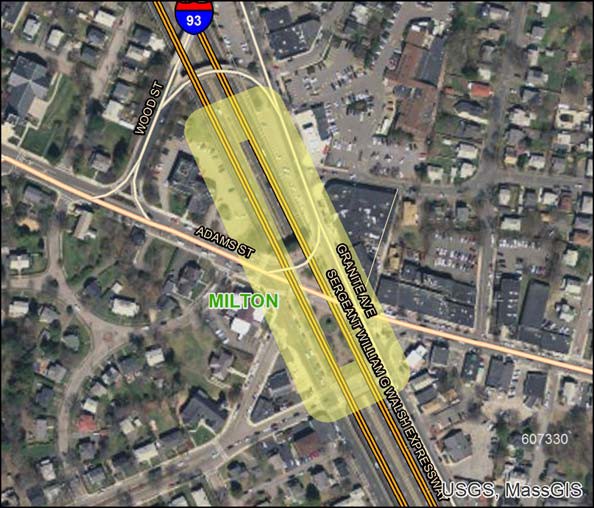
Municipality: Milton
Project Name: Deck Reconstruction over Southeast Expressway (East Milton Square), includes Parking and New Landscaped Area
Evaluation Rating: MPO/CTPS Study:
Project Length (miles):
Project Description:
This project involves the redesign of the current deck over the Southeast Expressway in Milton. The Town of Milton hopes to add additional parking and make the existing space more attractive. There is currently a parking shortage for the businesses in East Milton Square. The additional parking is expected to contribute to economic development.
Year |
Funding Program |
Federal Funds |
Non‐Federal Funds |
Total Funds |
2019 |
Earmark HPP( MA 125) |
$1,201,770 |
$300,443 |
$1,502,213 |
2019 |
Earmark HPP (MA 134) |
$1,001,475 |
$250,369 |
$1,251,844 |
|
Total Funding Programmed |
$2,203,245 |
$550,812 |
$2,754,057 |
ID Number: 607342
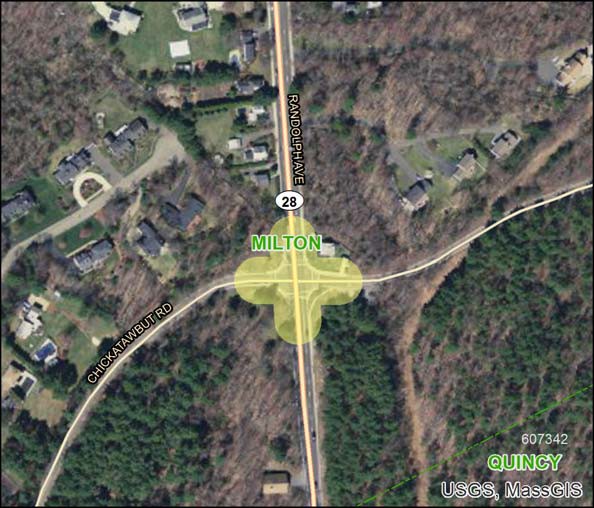
Municipality: Milton
Project Name: Intersection and Signal Improvements at Route 28 (Randolph Avenue) and Chickatawbut Road
Evaluation Rating: MPO/CTPS Study:
Project Length (miles): 0.07
Project Description:
The intersection of Route 20 (Randolph Avenue) and Chickatawbut Road is ranked second in the 2008-10 Statewide Top 200 Intersection Crash List, and this project addresses the high number and severity of crashes that occur there.
Year |
Funding Program |
Federal Funds |
Non‐Federal Funds |
Total Funds |
2020 |
Highway Safety Improvement Program |
$1,378,080 |
$153,120 |
$1,531,200 |
|
Total Funding Programmed |
$1,378,080 |
$153,120 |
$1,531,200 |
ID Number: 605034
Municipality: Natick
Project Name: Reconstruction of Route 27 (North Main Street), from North Avenue to the Wayland town line
Evaluation Rating: 60
MPO/CTPS Study:
Project Length (miles): 2.18
Project Description:
The project area extends 2.2 miles from Route 27 (North Main Street) at North Avenue to the Wayland town line, excluding the Route 9 interchange. The proposed improvements include minor widening of the section of roadway south of Route 9 to create a more consistent cross-section. The pavement will be reconstructed utilizing reclaimed base course. Cement concrete sidewalks will be constructed on both sides of the roadway throughout the length of the project area. The existing signals will be upgraded and, if warrants are met, new signals will be installed at Lake Street, Rutledge Road, and Pine Street.
Year |
Funding Program |
Federal Funds |
Non‐Federal Funds |
Total Funds |
2019 |
Congestion Mitigation and Air Quality Program |
$1,932,267 |
$483,067 |
$2,415,334 |
2019 |
Surface Transportation Program |
$6,677,758 |
$1,669,439 |
$8,347,197 |
2019 |
Transportation Alternatives |
$1,055,146 |
$263,786 |
$1,318,932 |
|
Total Funding Programmed |
$9,665,171 |
$2,416,292 |
$12,081,463 |
ID Number: 606635
Municipality: Needham, Newton
Project Name: Reconstruction of Highland Avenue, Needham Street and Charles River Bridge, from Webster Street to Route 9
Evaluation Rating: 75
MPO/CTPS Study:
Project Length (miles): 1.44
Project Description:
This project replaces project numbers 601827 and 604344. The project will reconstruct Highland Avenue, from Webster Street in Needham to Needham Street in Newton. The project also includes the rehabilitation of the Charles River Bridge (N-04-002).
Year |
Funding Program |
Federal Funds |
Non‐Federal Funds |
Total Funds |
2019 |
Congestion Mitigation and Air Quality Program |
$2,800,000 |
$700,000 |
$3,500,000 |
2019 |
Highway Safety Improvement Program |
$2,587,679 |
$287,520 |
$2,875,199 |
2019 |
Surface Transportation Program |
$4,415,979 |
$1,103,995 |
$5,519,974 |
2019 |
Transportation Alternatives |
$1,237,194 |
$309,299 |
$1,546,493 |
2020 |
Highway Safety Improvement Program |
$2,739,699 |
$304,411 |
$3,044,110 |
2020 |
Surface Transportation Program |
$8,318,045 |
$2,079,511 |
$10,397,556 |
|
Total Funding Programmed |
$22,098,596 |
$4,784,736 |
$26,883,332 |
ID Number: BN0008
Municipality: Newburyport
Project Name: Replace Hellcat Trail Boardwalk at the Parker River National Wildlife Refuge
Evaluation Rating: MPO/CTPS Study:
Project Length (miles): 1.01
Project Description:
This project will replace the Hellcat Trail Boardwalk at the Parker River National Wildlife Refuge.
Year |
Funding Program |
Federal Funds |
Non‐Federal Funds |
Total Funds |
2019 |
Other Federal Aid |
$960,000 |
$240,000 |
$1,200,000 |
|
Total Funding Programmed |
$960,000 |
$240,000 |
$1,200,000 |
ID Number: 608610
Municipality: Newton
Project Name: Bridge Maintenance, N-12-055, Clean and Paint Structural Steel
Evaluation Rating: MPO/CTPS Study:
Project Length (miles): 0.06
Project Description:
This work consists of cleaning and painting of the structural steel on bridge N-12-055 at Interstate 95 and Route 16 in Newton.
Year |
Funding Program |
Federal Funds |
Non‐Federal Funds |
Total Funds |
2021 |
Bridge On NHS System |
$1,843,200 |
$460,800 |
$2,304,000 |
|
Total Funding Programmed |
$1,843,200 |
$460,800 |
$2,304,000 |
ID Number: 608866
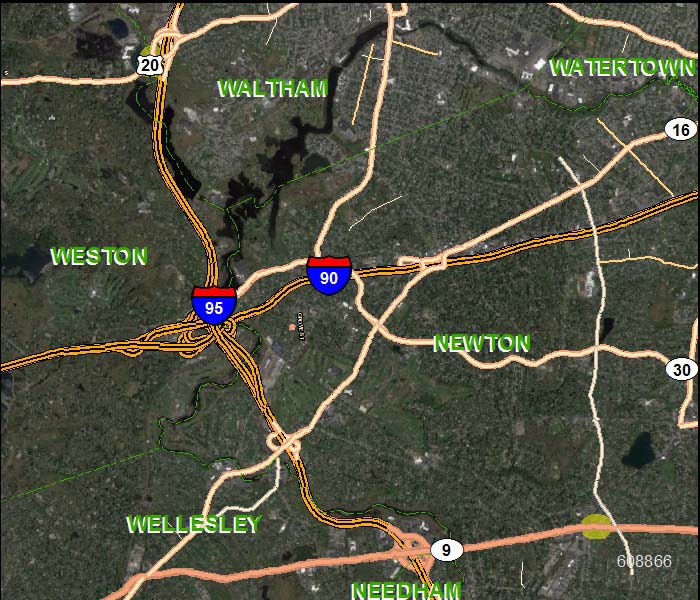
Municipality: Newton, Weston
Project Name: Steel Superstructure Cleaning (Full
Removal) and Painting of Thee Bridges: N-
12-051,W-29-011, and W-29-028
Evaluation Rating: MPO/CTPS Study:
Project Length (miles): 0.04
Project Description:
This work involves the cleaning and painting of the steel superstructure of three bridges: N-12-051 in Newton and W-29-011 and W-29-028 in Weston.
Year |
Funding Program |
Federal Funds |
Non‐Federal Funds |
Total Funds |
2022 |
Bridge On NHS System |
$1,879,920 |
$469,980 |
$2,349,900 |
|
Total Funding Programmed |
$1,879,920 |
$469,980 |
$2,349,900 |
ID Number: 608609
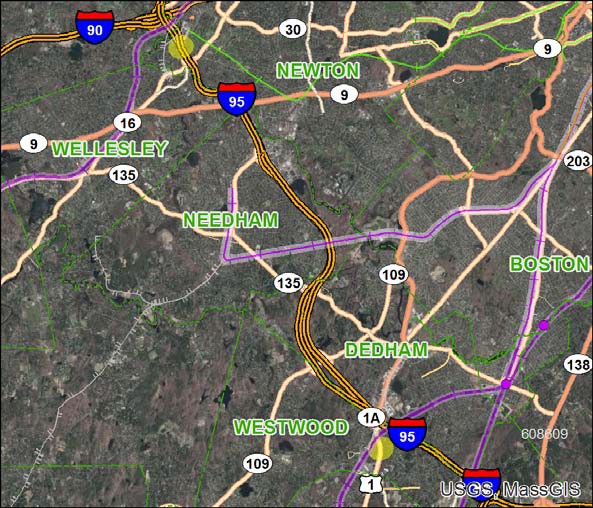
Municipality: Newton, Westwood
Project Name: Bridge Maintenance, N-12-0056 and W-31-006, Clean and Paint Structural Steel
Evaluation Rating: MPO/CTPS Study:
Project Length (miles): 0.13
Project Description:
This work consists of cleaning and painting of structural steel on two bridges: N-12-0056 in Newton and W-31-006 in Westwood.
Year |
Funding Program |
Federal Funds |
Non‐Federal Funds |
Total Funds |
2023 |
Bridge On NHS System |
$1,714,285 |
$428,571 |
$2,142,856 |
|
Total Funding Programmed |
$1,714,285 |
$428,571 |
$2,142,856 |
ID Number: 605857
Municipality: Norwood
Project Name: Intersection Improvements at Route 1 and
University Avenue/Everett Street
Evaluation Rating: 55
MPO/CTPS Study: University Avenue/Interstate 95/Interstate 93 Regional Traffic Study (1999)
Project Length (miles): 0.23
Project Description:
This project includes traffic signal upgrades and associated geometric improvements at the intersection of Route 1 with University Avenue and Everett Street. Related improvements include constructing an additional travel lane in each direction on Route 1, upgrading of traffic signals, lengthening of left-turn lanes on Route 1, upgrading of pedestrian crossings at each leg of the intersection, and upgrading of bicycle amenities (loop detectors) at the intersection. Rehabilitation of sidewalks, curbing, median structures, lighting, and guard rails are also proposed.
Year |
Funding Program |
Federal Funds |
Non‐Federal Funds |
Total Funds |
2022 |
Congestion Mitigation and Air Quality Program |
$2,400,000 |
$600,000 |
$3,000,000 |
2022 |
Highway Safety Improvement Program |
$568,552 |
$63,172 |
$631,724 |
2022 |
National Highway Performance Program |
$2,298,423 |
$574,606 |
$2,873,029 |
2022 |
Surface Transportation Program |
$2,129,326 |
$532,331 |
$2,661,657 |
|
Total Funding Programmed |
$7,396,301 |
$1,770,109 |
$9,166,410 |
ID Number: 608052
Municipality: Norwood
Project Name: Intersection and Traffic Signal Improvements at Providence Highway (Route 1) and Morse Street
Evaluation Rating: MPO/CTPS Study:
Project Length (miles): 0.13
Project Description:
The project will improve the intersection and signals at US Route 1 (Providence Highway) and Morse Street.
Year |
Funding Program |
Federal Funds |
Non‐Federal Funds |
Total Funds |
2023 |
Highway Safety Improvement Program |
$877,334 |
$97,481 |
$974,815 |
|
Total Funding Programmed |
$877,334 |
$97,481 |
$974,815 |
ID Number: 606130
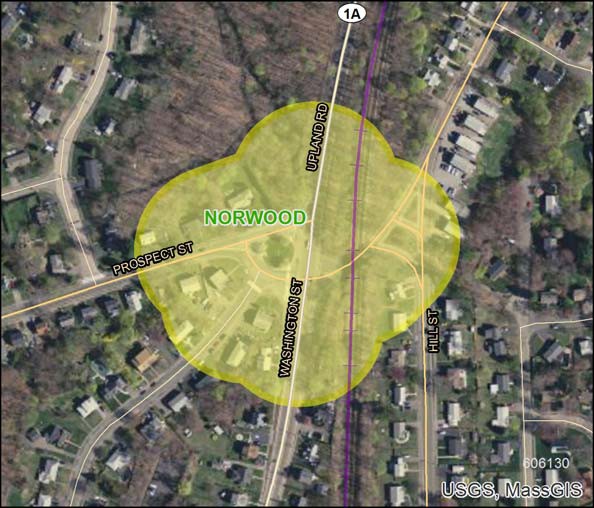
Municipality: Norwood
Project Name: Intersection Improvements at Route 1A and Upland Road/Washington Street and Prospect Street/Fulton Street
Evaluation Rating: 53
MPO/CTPS Study:
Project Length (miles): 0.21
Project Description:
This project includes traffic signal installation and associated geometric improvements at the intersections of Route 1A with Upland Road and Washington Street, and with Prospect Street and Fulton Street in Norwood.
Year |
Funding Program |
Federal Funds |
Non‐Federal Funds |
Total Funds |
2021 |
Congestion Mitigation and Air Quality Program |
$800,000 |
$200,000 |
$1,000,000 |
2021 |
Surface Transportation Program |
$2,349,425 |
$587,356 |
$2,936,781 |
|
Total Funding Programmed |
$3,149,425 |
$787,356 |
$3,936,781 |
ID Number: 608933
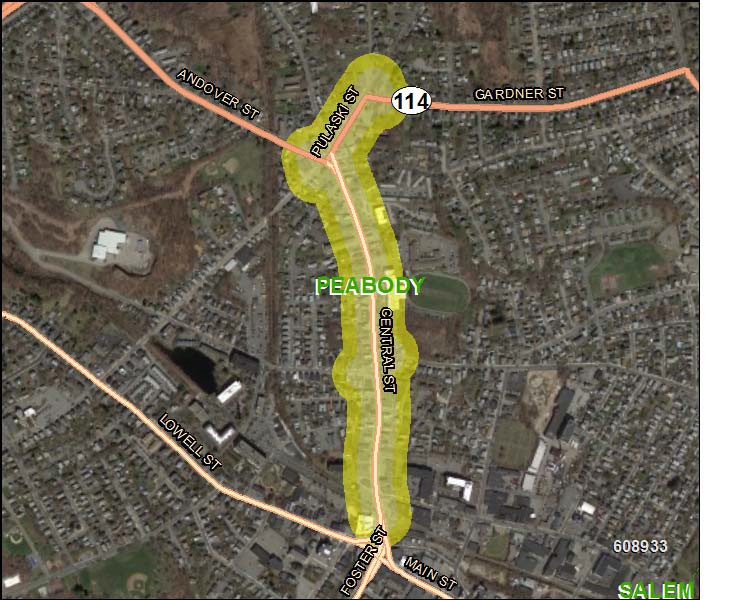
Municipality: Peabody
Project Name: Central Street Corridor and Intersection Improvements
Evaluation Rating: 61
MPO/CTPS Study:
Project Length (miles): 0.78
Project Description:
Given the condition of the existing pavement based on a visual inspection, as well as the number of utility trenches that have exhibited signs of differential settlement, the project is currently proposed to reconstruct the pavement via full depth pavement reclamation. The project will also include the reconstruction of cement concrete sidewalks and crossings with curb extensions and new granite curbing, addition of dedicated bicycle accommodations (bike lane and/or sharrows), installation of new signage and pavement markings, streetscape enhancements and amenities, and drainage system improvements corridor- wide. For the reconstructed intersections noted, new signal equipment will be provided at all locations. All signal equipment proposed will be NEMA TS2 Type 1, with countdown pedestrian heads, vibrotactile pedestrian push buttons with audible speech messages, optical emergency vehicle preemption, and video vehicle detection.
Year |
Funding Program |
Federal Funds |
Non‐Federal Funds |
Total Funds |
2023 |
Congestion Mitigation and Air Quality Program |
$2,400,000 |
$600,000 |
$3,000,000 |
2023 |
Highway Safety Improvement Program |
$1,350,000 |
$150,000 |
$1,500,000 |
2023 |
Surface Transportation Program |
$5,364,480 |
$1,341,120 |
$6,705,600 |
|
Total Funding Programmed |
$9,114,480 |
$2,091,120 |
$11,205,600 |
ID Number: 608567
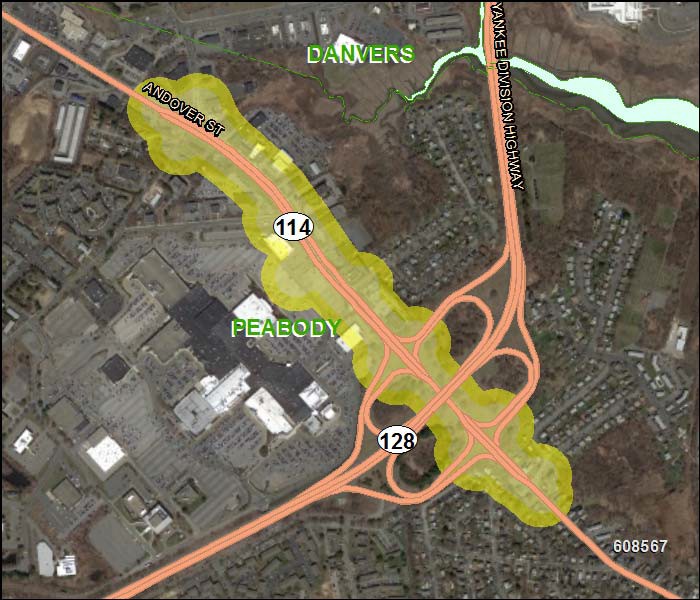
Municipality: Peabody
Project Name: Improvements at Route 114 at Sylvan Street, Cross Street, Northshore Mall, Loris Road, Route 128 Interchange and Esquire Drive
Evaluation Rating: MPO/CTPS Study:
Project Length (miles): 1.54
Project Description:
This project will make improvements at Route 114 at Sylvan Street, Cross Street, Northshore Mall, Loris Road, Route 128 Interchange, and Esquire Drive in Peabody.
Year |
Funding Program |
Federal Funds |
Non‐Federal Funds |
Total Funds |
2022 |
Highway Safety Improvement Program |
$2,880,000 |
$320,000 |
$3,200,000 |
|
Total Funding Programmed |
$2,880,000 |
$320,000 |
$3,200,000 |
ID Number: 609101
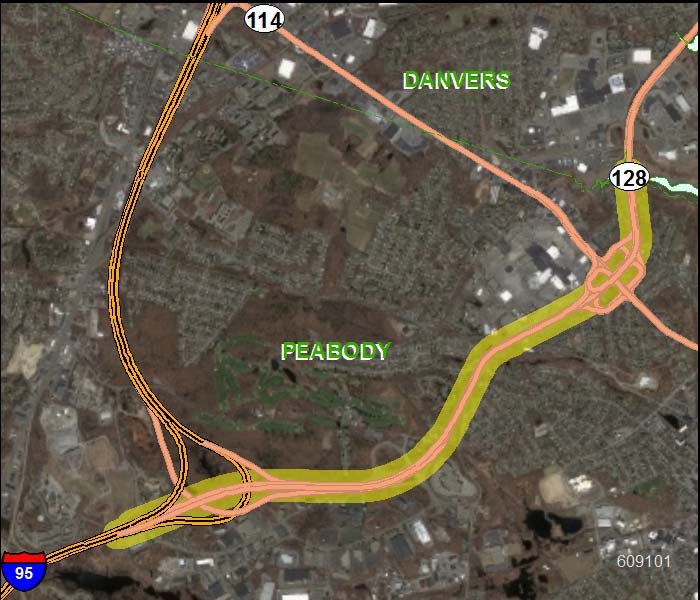
Municipality: Peabody
Project Name: Peabody-Pavement Preservation and Related Work on Route 128
Evaluation Rating: MPO/CTPS Study:
Project Length (miles): 3.35
Project Description:
This project involves pavement preservation and related work on Route 128 in Peabody.
Year |
Funding Program |
Federal Funds |
Non‐Federal Funds |
Total Funds |
2020 |
National Highway Performance Program |
$3,769,958 |
$942,490 |
$4,712,448 |
|
Total Funding Programmed |
$3,769,958 |
$942,490 |
$4,712,448 |
ID Number: 608569
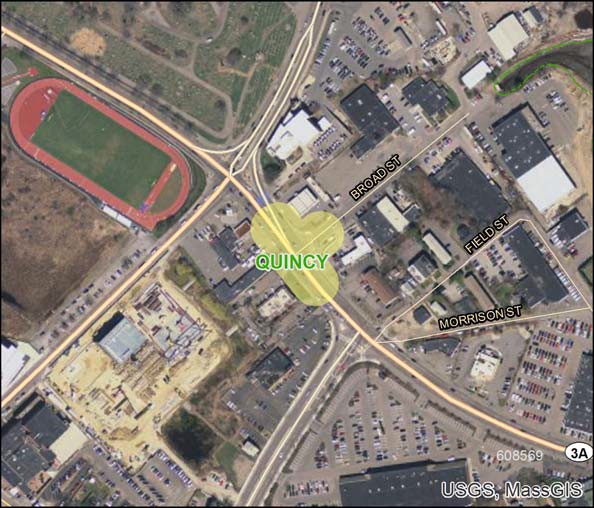
Municipality: Quincy
Project Name: Intersection Improvements at Route 3A (Southern Artery) and Broad Street
Evaluation Rating: MPO/CTPS Study:
Project Length (miles): 5.67
Project Description:
This project will improve the intersection at Route 3A (Southern Artery) and Broad Street in Quincy.
Year |
Funding Program |
Federal Funds |
Non‐Federal Funds |
Total Funds |
2022 |
Highway Safety Improvement Program |
$3,600,000 |
$400,000 |
$4,000,000 |
|
Total Funding Programmed |
$3,600,000 |
$400,000 |
$4,000,000 |
ID Number: 608707
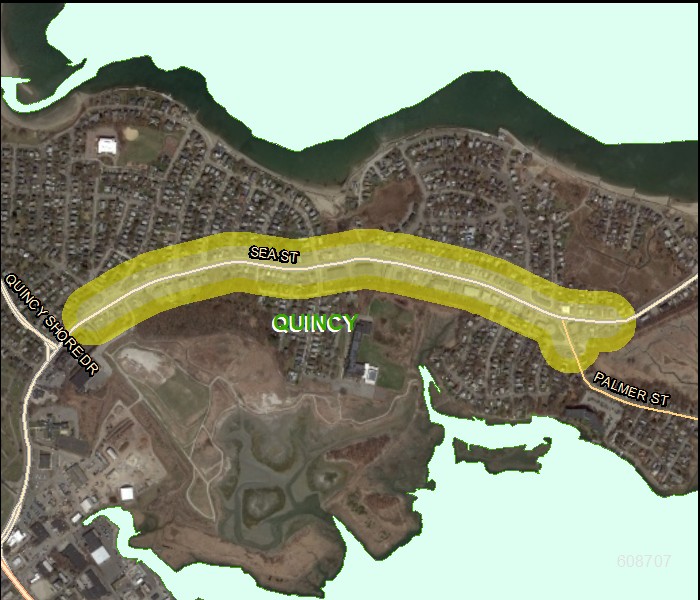
Municipality: Quincy
Project Name: Reconstruction of Sea Street
Evaluation Rating: 40
MPO/CTPS Study:
Project Length (miles): 0.92
Project Description:
This project will reconstruct Sea Street in Quincy.
Year |
Funding Program |
Federal Funds |
Non‐Federal Funds |
Total Funds |
2023 |
Surface Transportation Program |
$5,040,000 |
$1,260,000 |
$6,300,000 |
2023 |
Transportation Alternatives |
$181,003 |
$45,251 |
$226,254 |
|
Total Funding Programmed |
$5,221,003 |
$1,305,251 |
$6,526,254 |
ID Number: 607305
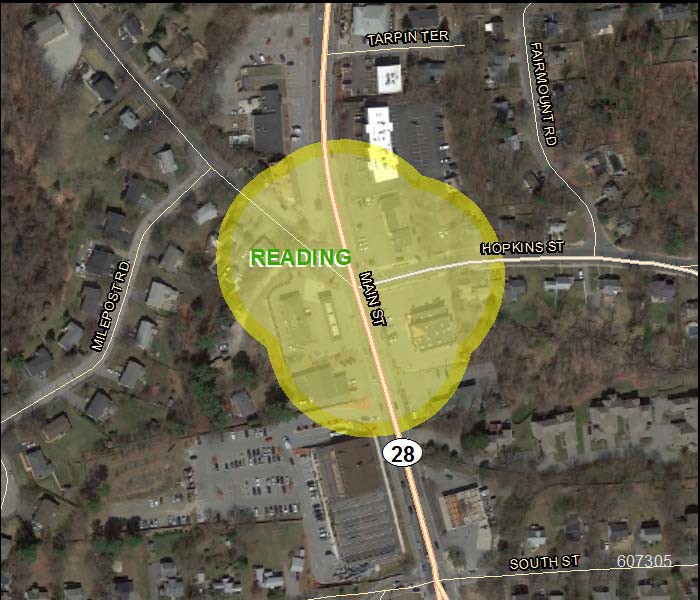
Municipality: Reading
Project Name: Intersection Signalization at Route 28 and Hopkins Street
Evaluation Rating: 38
MPO/CTPS Study: Community Technical Assisstance (2013): Reading Route 28
Project Length (miles): 0.07
Project Description:
The project will install traffic control signals at this high crash location and interconnect the new signals with the existing signals at Main Street and Summer Street and at Main Street and South Street. The project will also include construction of AAB/ADA compliant sidewalks and wheelchair ramps and geometric improvements.
Year |
Funding Program |
Federal Funds |
Non‐Federal Funds |
Total Funds |
2023 |
Highway Safety Improvement Program |
$421,455 |
$46,828 |
$468,283 |
2023 |
Surface Transportation Program |
$800,000 |
$200,000 |
$1,000,000 |
|
Total Funding Programmed |
$1,221,455 |
$246,828 |
$1,468,283 |
ID Number: BN0009
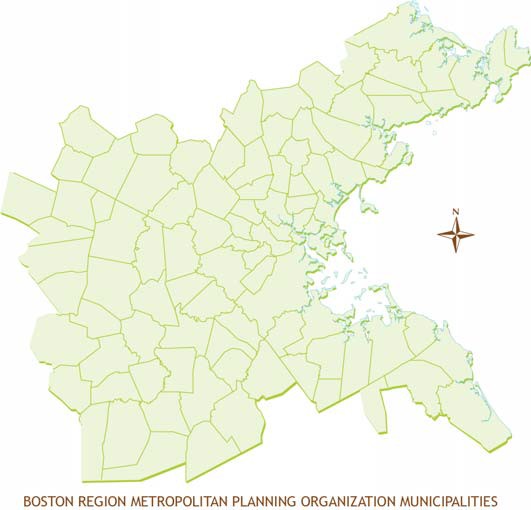
Municipality: Regional
Project Name: Community Transportation Program
Evaluation Rating: MPO/CTPS Study:
Project Length (miles): Project Description:
Community Transportation Program projects will be identified through a competitive process.
Year |
Funding Program |
Federal Funds |
Non‐Federal Funds |
Total Funds |
2021 |
Congestion Mitigation and Air Quality Program |
$1,600,000 |
$400,000 |
$2,000,000 |
2023 |
Congestion Mitigation and Air Quality Program |
$1,600,000 |
$400,000 |
$2,000,000 |
|
Total Funding Programmed |
$3,200,000 |
$800,000 |
$4,000,000 |
ID Number: 608743
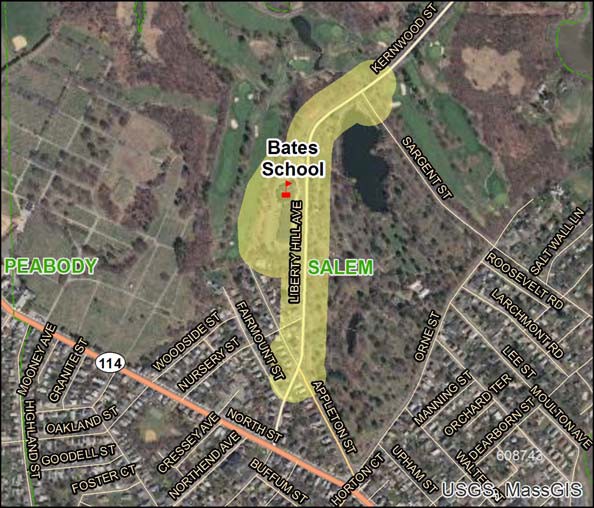
Municipality: Salem
Project Name: Safe Routes to School Improvements at Bates Elementary School
Evaluation Rating: MPO/CTPS Study:
Project Length (miles): Project Description:
This Safe Route to School project will provide safer access for students by making traffic signal upgrades, sidewalk
improvements, and bicycle accommodations around Bates Elementary School in Salem.
Year |
Funding Program |
Federal Funds |
Non‐Federal Funds |
Total Funds |
2020 |
Transportation Alternatives |
$750,000 |
$187,500 |
$937,500 |
|
Total Funding Programmed |
$750,000 |
$187,500 |
$937,500 |
ID Number: 608079
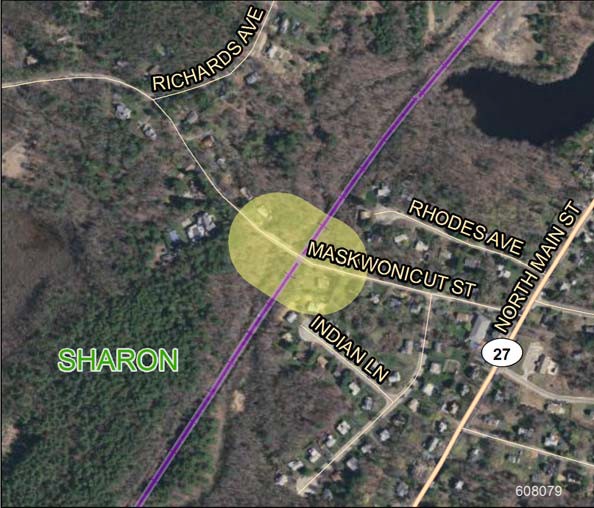
Municipality: Sharon
Project Name: Bridge Replacement, Maskwonicut Street over Amtrak/MBTA
Evaluation Rating: MPO/CTPS Study:
Project Length (miles): 0.04
Project Description:
This project will replace the bridge that carrries Maskwonicut Street over the Amtrak and MBTA tracks. The bridge is currently closed due to deterioration.
Year |
Funding Program |
Federal Funds |
Non‐Federal Funds |
Total Funds |
2019 |
Bridge Surface Transportation Program‐Bridge‐Off System |
$2,146,469 |
$536,617 |
$2,683,086 |
|
Total Funding Programmed |
$2,146,469 |
$536,617 |
$2,683,086 |
ID Number: 608562
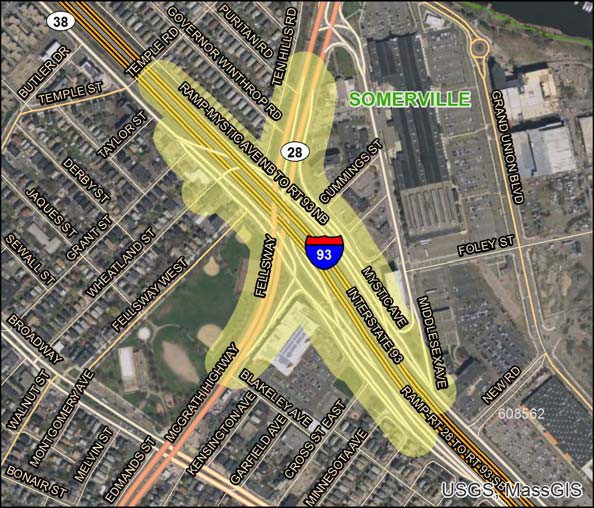
Municipality: Somerville
Project Name: Signal and Intersection Improvements on Interstate 93 at Mystic Avenue and McGrath Highway (Top 200 Crash Location)
Evaluation Rating: MPO/CTPS Study:
Project Length (miles): 2.98
Project Description:
The project includes traffic signal upgrades and safety improvements at the following locations: Mystic Avenue northbound and Route 28 (Fellsway); Route 38 southbound (Mystic Avenue) and Route 28 (McGrath Avenue) southbound; Route 38 southbound (Mystic Avenue) and Route 28 (McGrath Avenue) northbound; and Route 38 southbound at Wheatland Street.
Year |
Funding Program |
Federal Funds |
Non‐Federal Funds |
Total Funds |
2020 |
Highway Safety Improvement Program |
$4,500,000 |
$500,000 |
$5,000,000 |
|
Total Funding Programmed |
$4,500,000 |
$500,000 |
$5,000,000 |
ID Number: 605342
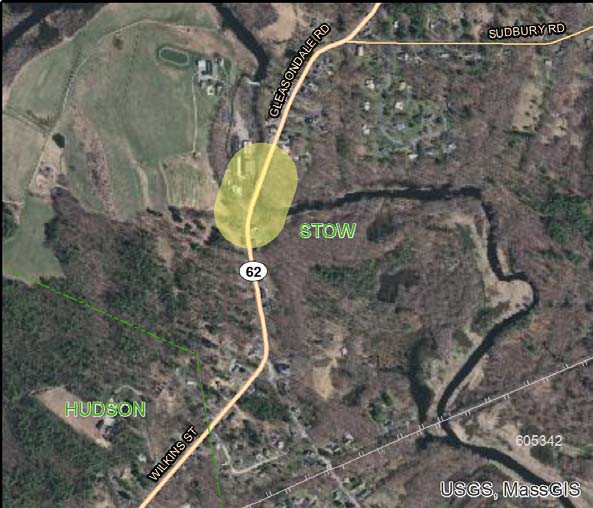
Municipality: Stow
Project Name: Bridge Rehabilitation, S-29-001, (Route 62) Gleasondale Road over the Assabet River
Evaluation Rating: MPO/CTPS Study:
Project Length (miles): 0.04
Project Description:
The project will replace bridge S-29-001, which carries Route 62 (Gleasondale Road) over the Assabet River.
Year |
Funding Program |
Federal Funds |
Non‐Federal Funds |
Total Funds |
2020 |
Bridge On NHS System |
$5,365,245 |
$1,341,312 |
$6,706,557 |
|
Total Funding Programmed |
$5,365,245 |
$1,341,312 |
$6,706,557 |
ID Number: 608255
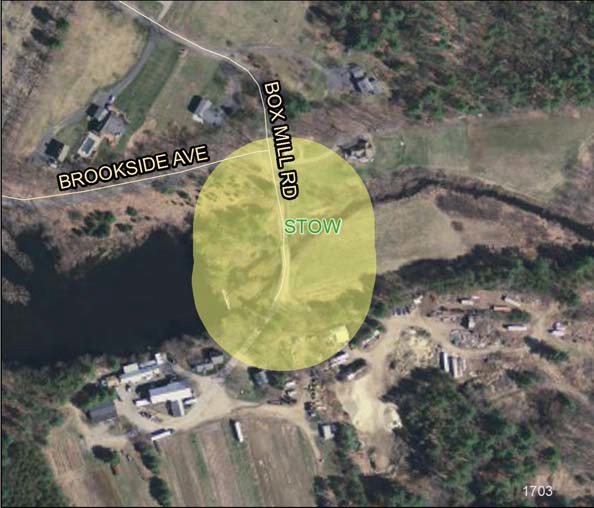
Municipality: Stow
Project Name: Bridge Replacement, S-29-11, Box Mill Road over Elizabeth Brook
Evaluation Rating: MPO/CTPS Study:
Project Length (miles): 0.02
Project Description:
Bridge S-29-11, which carries Box Mill Road over Elizabeth Brook, is a structurally deficient bridge. The full replacement will include new substructure, steel beams, and concrete deck. One sidewalk will be added to the structure.
Year |
Funding Program |
Federal Funds |
Non‐Federal Funds |
Total Funds |
2019 |
Bridge Surface Transportation Program‐Bridge‐Off System |
$2,889,779 |
$722,445 |
$3,612,224 |
|
Total Funding Programmed |
$2,889,779 |
$722,445 |
$3,612,224 |
ID Number: 608164
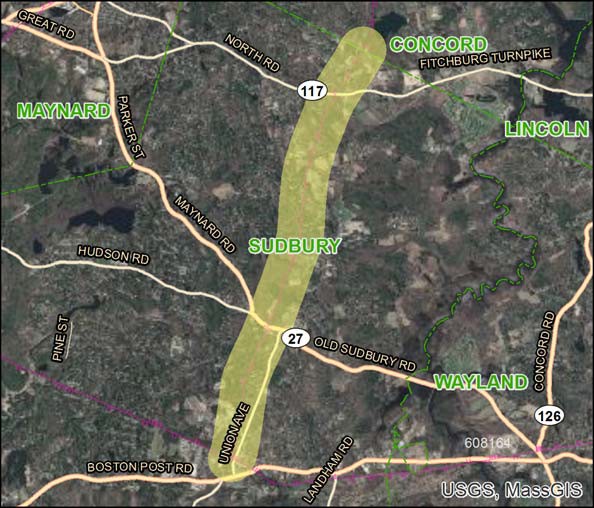
Municipality: Sudbury
Project Name: Bruce Freeman Rail Trail, Phase 2D
Evaluation Rating: 40
MPO/CTPS Study:
Project Length (miles): 4.45
Project Description:
The proposed project involves construction of a 4.6 mile trail in Sudbury, from the Concord town line to Station Road. The proposed work includes improvements to two structures and upgrades to several at-grade crossings, including Route 117 (North Road), Pantry Road, and Route 27 (Hudson Road). Related work includes pavement markings, installation of guardrails, and landscaping.
Year |
Funding Program |
Federal Funds |
Non‐Federal Funds |
Total Funds |
2022 |
Congestion Mitigation and Air Quality Program |
$7,347,822 |
$1,836,956 |
$9,184,778 |
2022 |
Transportation Alternatives |
$400,000 |
$100,000 |
$500,000 |
|
Total Funding Programmed |
$7,747,822 |
$1,936,956 |
$9,684,778 |
ID Number: 607249
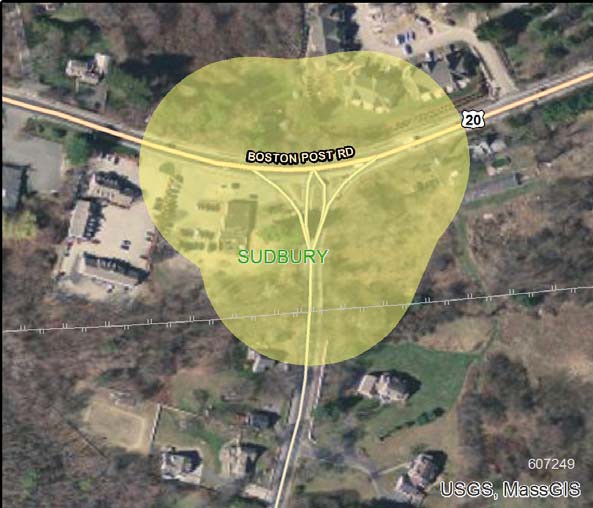
Municipality: Sudbury
Project Name: Intersection Improvements at Route 20 and Landham Road
Evaluation Rating: 36
MPO/CTPS Study: Congested and High-Crash Intersections Study (2010): Sudbury
Project Length (miles): 0.07
Project Description:
The project involves roadway reconstruction and widening for turning lanes.
Year |
Funding Program |
Federal Funds |
Non‐Federal Funds |
Total Funds |
2019 |
Highway Safety Improvement Program |
$1,937,269 |
$215,252 |
$2,152,521 |
|
Total Funding Programmed |
$1,937,269 |
$215,252 |
$2,152,521 |
ID Number: 607761
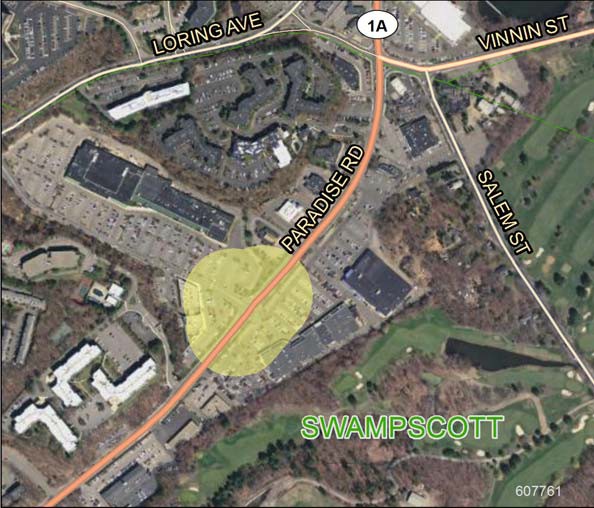
Municipality: Swampscott
Project Name: Intersection and Signal Improvements at Route 1A (Paradise Road) at Swampscott Mall
Evaluation Rating: MPO/CTPS Study:
Project Length (miles): 0.05
Project Description:
The project will make safety upgrades to the intersection of Route 1A (Paradise Road) at Swampscott Mall. The upgrades will include signs, pavement markings, and traffic signals as identified through a Road Safety Audit process.
Year |
Funding Program |
Federal Funds |
Non‐Federal Funds |
Total Funds |
2021 |
Highway Safety Improvement Program |
$1,800,000 |
$200,000 |
$2,000,000 |
|
Total Funding Programmed |
$1,800,000 |
$200,000 |
$2,000,000 |
ID Number: 608493
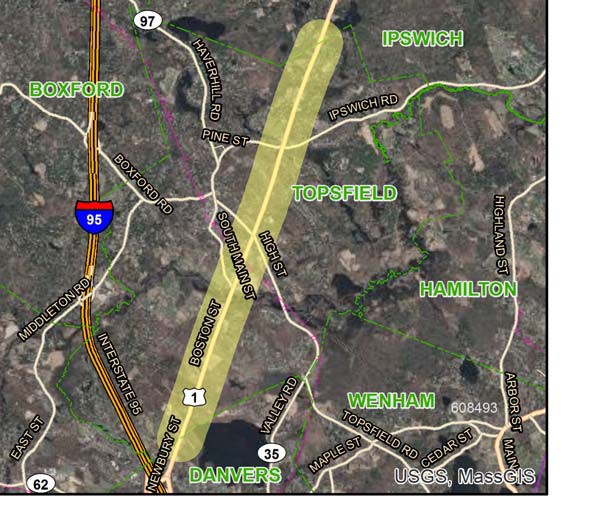
Municipality: Topsfield
Project Name: Resurfacing and Related Work on Route 1
Evaluation Rating: MPO/CTPS Study:
Project Length (miles): 4.69
Project Description:
This project involves resurfacing and related work on Route 1 in Topsfield.
Year |
Funding Program |
Federal Funds |
Non‐Federal Funds |
Total Funds |
2019 |
National Highway Performance Program |
$7,268,800 |
$1,817,200 |
$9,086,000 |
|
Total Funding Programmed |
$7,268,800 |
$1,817,200 |
$9,086,000 |
ID Number: 602261
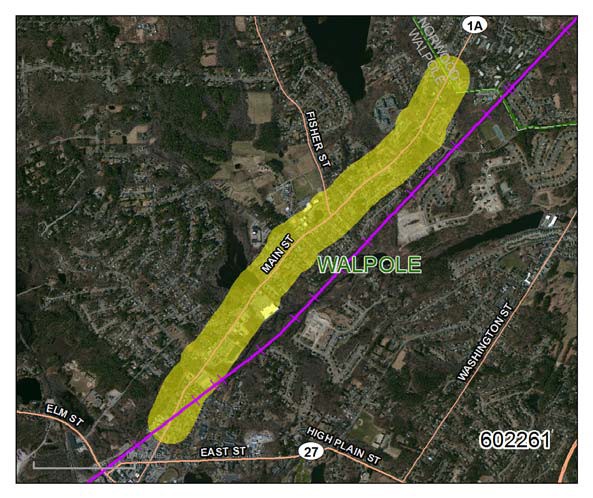
Municipality: Walpole
Project Name: Reconstruction on Route 1A (Main Street), from the Norwood town line to Route 27
Evaluation Rating: 51
MPO/CTPS Study:
Project Length (miles): 2.33
Project Description:
The proposed project consists of reconstructing 8,000 feet of Route 1A and includes improvements to the intersection and approaches at Fisher, Gould, North, Bullard/Willet Streets, and the Stop and Shop Plaza. The Route 1A bridge over the Neponset River, near the intersection with North Street, will be analyzed to determine if it can be rehabilitated or if it requires replacement. The limits of work are from approximately 2,000 feet north of Route 27 north to the Norwood town line.
Year |
Funding Program |
Federal Funds |
Non‐Federal Funds |
Total Funds |
2020 |
Congestion Mitigation and Air Quality Program
|
$800,000 |
$200,000 |
$1,000,000 |
2020 |
Surface Transportation Program |
$11,112,637 |
$2,778,159 |
$13,890,796 |
2020 |
Transportation Alternatives |
$1,486,750 |
$371,687 |
$1,858,437 |
ID Number: 607777
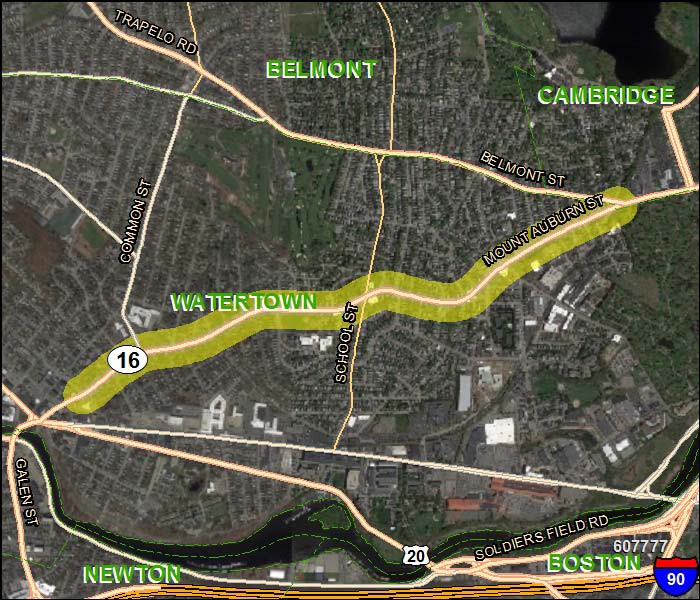
Municipality: Watertown
Project Name: Rehabilitation of Mount Auburn Street (Route 16)
Evaluation Rating: 75
MPO/CTPS Study:
Project Length (miles): 1.78
Project Description:
The project will reconstruct approximately 9,300 feet of Mount Auburn Street, from the Cambridge city line to the intersection with Summer Street, just east of Watertown Square. The project involves revisions to the roadway geometry, including a roadway diet to reduce the number of lanes; safety improvements; multi-modal accommodations, including shared or exclusive bike lanes; improvements to the existing traffic signal equipment; and improved ADA amenities at intersections.
Year |
Funding Program |
Federal Funds |
Non‐Federal Funds |
Total Funds |
2022 |
Congestion Mitigation and Air Quality Program
|
$800,000 |
$200,000 |
$1,000,000 |
2022 |
Highway Safety Improvement Program |
$1,800,000 |
$200,000 |
$2,000,000 |
2022 |
Surface Transportation Program |
$8,560,880 |
$2,140,220 |
$10,701,100 |
ID Number: 608564
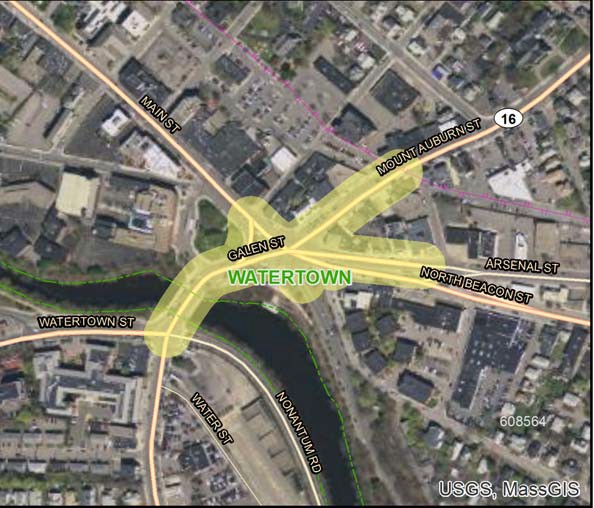
Municipality: Watertown
Project Name: Intersection Improvements at Route 16 and Galen Street
Evaluation Rating: MPO/CTPS Study:
Project Length (miles): 0.27
Project Description:
This project will improve the intersection at Route 16 and Galen Street in Watertown.
Year |
Funding Program |
Federal Funds |
Non‐Federal Funds |
Total Funds |
2023 |
Highway Safety Improvement Program |
$2,367,000 |
$263,000 |
$2,630,000 |
|
Total Funding Programmed |
$2,367,000 |
$263,000 |
$2,630,000 |
ID Number: 607327

Municipality: Wilmington
Project Name: Bridge Replacement, Route 38 (Main Street) over the B&M Railroad
Evaluation Rating: MPO/CTPS Study:
Project Length (miles): 0.03
Project Description:
This project will replace the bridge that carries Route 38 (Main Street) in Wilmington over the MBTA railroad tracks. A three-day weekend closure is recommended for this project since this route is used by school buses and emergency vehicles.
Year |
Funding Program |
Federal Funds |
Non‐Federal Funds |
Total Funds |
2022 |
Bridge On NHS System |
$8,608,768 |
$2,152,192 |
$10,760,960 |
|
Totally Funding Programmed |
$8,608,768 |
$2,152,192 |
$10,760,960 |
ID Number: 608929
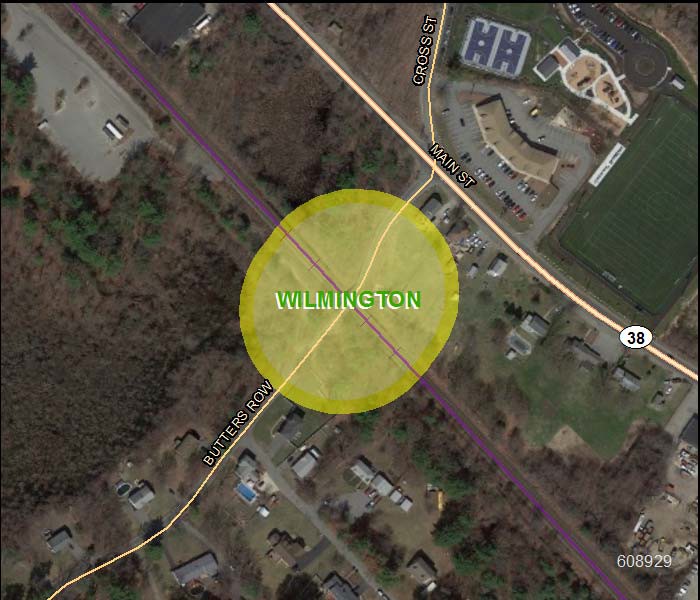
Municipality: Wilmington
Project Name: Wilmington- Bridge Replacement, W-38-003, Butters Row over MBTA
Evaluation Rating: MPO/CTPS Study:
Project Length (miles): 0.01
Project Description:
This project will replace bridge W-38-003, which carries Butters Row in Wilmington over the MBTA railroad tracks.
Year |
Funding Program |
Federal Funds |
Non‐Federal Funds |
Total Funds |
2022 |
Bridge On NHS System |
$4,146,688 |
$1,036,672 |
$5,183,360 |
|
Total Funding Programmed |
$4,146,688 |
$1,036,672 |
$5,183,360 |
ID Number: 608791
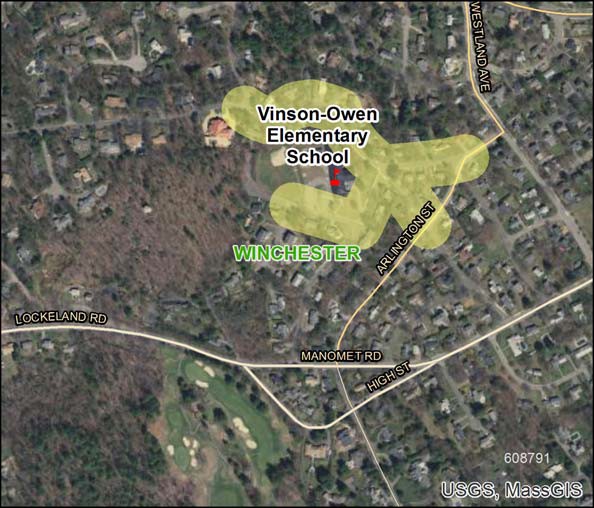
Municipality: Winchester
Project Name: Safe Routes to School Improvements at Vinson-Owen Elementary
Evaluation Rating: MPO/CTPS Study:
Project Length (miles): Project Description:
This Safe Routes to School project will make improvements around Vinson-Owen Elementary School in Winchester to provide safer access for students.
Year |
Funding Program |
Federal Funds |
Non‐Federal Funds |
Total Funds |
2020 |
Transportation Alternatives |
$1,332,960 |
$333,240 |
$1,666,200 |
|
Total Funding Programmed |
$1,332,960 |
$333,240 |
$1,666,200 |
ID Number: 607244
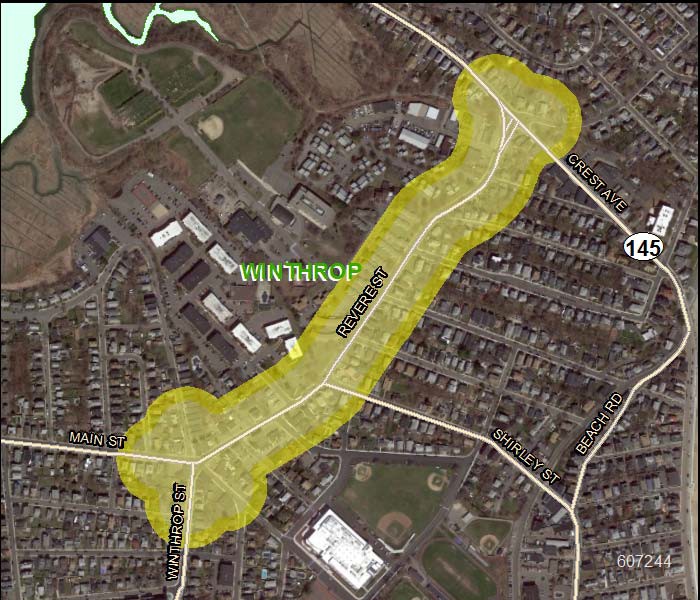
Municipality: Winthrop
Project Name: Reconstruction and Related Work along Winthrop Street and Revere Street Corridor
Evaluation Rating: 54
MPO/CTPS Study:
Project Length (miles): 0.68
Project Description:
This project will create a Complete Street. The work will include pavement reconstruction and reclamation, sidewalk reconstruction, and intersection improvements at key locations along the corridor. Improvements to the bicycle and pedestrian infrastructure will be implemented.
Year |
Funding Program |
Federal Funds |
Non‐Federal Funds |
Total Funds |
2023 |
Congestion Mitigation and Air Quality Program |
$1,600,000 |
$400,000 |
$2,000,000 |
2023 |
Surface Transportation Program |
$1,200,000 |
$300,000 |
$1,500,000 |
2023 |
Transportation Alternatives |
$448,000 |
$112,000 |
$560,000 |
|
Total Funding Programmed |
$3,248,000 |
$812,000 |
$4,060,000 |
ID Number: 604996
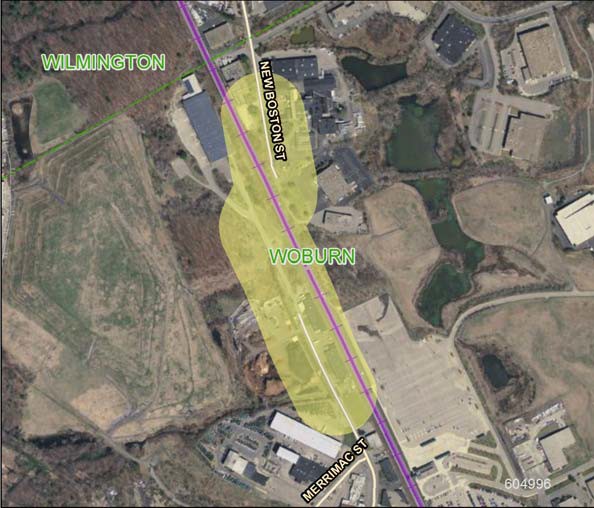
Municipality: Woburn
Project Name: Bridge Replacement, New Boston Street over MBTA
Evaluation Rating: 55
MPO/CTPS Study:
Project Length (miles): 0.34
Project Description:
The project will construct a new bridge over the NH Main Line tracks of the MBTA commuter rail in Woburn and reconstruct approximately 1,850 feet of New Boston Street.
Year |
Funding Program |
Federal Funds |
Non‐Federal Funds |
Total Funds |
2021 |
Surface Transportation Program |
$13,134,678 |
$3,283,669 |
$16,418,347 |
|
Total Funding Programmed |
$13,134,678 |
$3,283,669 |
$16,418,347 |
ID Number: 603739
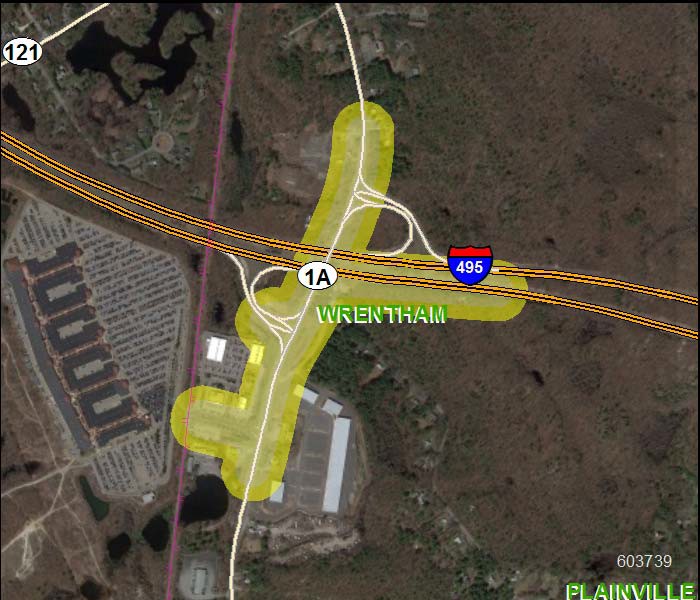
Municipality: Wrentham
Project Name: Construction of a slip ramp from Route 1A northbound to Interstate 495 southbound and associated intersection improvements
Evaluation Rating: 55
MPO/CTPS Study: Route 1 Corridor Study in Wrentham (2017)
Project Length (miles): 0.59
Project Description:
This project consists of the construction of ramps at the interchange of Route 1A and Interstate 495 in Wrentham to accommodate increased volumes resulting from development at the interchange. The project includes signal retiming at three intersections in the project area, new bike lanes, new sidewalks, and improved access within the Wrentham Outlet shops entrance with the addition of one travel lane on Outlet Boulevard westbound, which is a MassDOT Top 200 Crash location at Route 1A.
Year |
Funding Program |
Federal Funds |
Non‐Federal Funds |
Total Funds |
2023 |
Highway Safety Improvement Program |
$2,250,000 |
$250,000 |
$2,500,000 |
2023 |
Surface Transportation Program |
$6,880,000 |
$1,720,000 |
$8,600,000 |
2023 |
Transportation Alternatives Regionally Prioritized |
$400,000 |
$100,000 |
$500,000 |
|
Total Funding Programmed |
$9,530,000 |
$2,070,000 |
$11,600,000 |
Chapter four
TIP Performance Monitoring
Over the past few decades, transportation agencies have been expanding the role of performance management—a strategic approach that uses performance data to help achieve desired outcomes—in their decision-making processes. Performance management is credited with improving project and program delivery, informing investment decision making, focusing staff on leadership priorities, and providing greater transparency and accountability to the public.
Performance-based planning and programming (PBPP) refers to transportation agencies’ application of performance management in their planning and programming work to achieve desired outcomes for the multimodal transportation system. The purpose of PBPP is to ensure that transportation investment decisions—both for long-term planning and short-term funding—are oriented toward meeting established goals.
For metropolitan planning organizations (MPOs), PBPP embraces a range of activities and products developed together with other agencies, stakeholders, and the public as part of the 3C metropolitan transportation planning process. This includes developing the following:
The MPO’s PBPP process is shaped by both federal transportation performance management requirements and the MPO’s goals and objectives, which were established as part of the MPO’s current LRTP, Charting Progress to 2040.
The establishment of a performance- and outcome-based surface transportation program was a key component of the transportation authorization legislation, Moving Ahead for Progress in the 21st Century Act (MAP-21).The PBPP provisions established under MAP-21 continued under the current legislation, Fixing America’s Surface Transportation Act (FAST Act).
Under the performance management approach detailed in the FAST Act, states will invest resources that collectively will make progress toward national goals in the following areas:
Table 4-1 shows the relationship between these national goal areas and the MPO’s goal areas. (The MPO’s goals and related objectives are described in more detail in Chapter 1 of this document.)
TABLE 4-1
National and MPO Goal Areas
National Goal Area |
MPO Goal Area |
Safety |
Safety |
Infrastructure Condition |
System Preservation |
Congestion Reduction |
Capacity Management/Mobility |
System Reliability |
Capacity Management/Mobility |
Freight Movement/ Economic Vitality |
Capacity Management/Mobility and Economic Vitality |
Environmental Sustainability |
Clean Air/Clean Communities |
Reduced Project Delivery Delays |
Not applicable |
Not applicable |
Transportation Equity |
Source: Boston Region MPO.
This performance-based planning mandate is also designed to help the nation’s public transportation systems provide high-quality service to all users, including people with disabilities, people age 75 or older, and individuals who depend on public transportation.
The US Department of Transportation (USDOT), in consultation with states, MPOs, and other stakeholders,
has established measures in performance areas relevant to the aforementioned national goals. Table 4-2 lists federally required performance measures for the transit system and Table 4-3 lists federally required performance measures for the highway system.
TABLE 4-2
Federally Required Transit Performance Measures
National Goal |
Transit Performance Area or Asset Category |
Performance Measure |
Relevant MPO Goal Area |
Safety |
Fatalitiesa |
Total number of reportable fatalities and rate per total vehicle revenue-miles by mode |
Safety |
Safety |
Injuriesa |
Total number of reportable injuries and rate per total vehicle revenue-miles by mode |
Safety |
Safety |
Safety Eventsa |
Total number of reportable events and rate per total vehicle revenue-miles by mode |
Safety |
Safety |
System Reliabilitya |
Mean distance between major mechanical failures by mode |
Safety |
Infrastructure Condition |
Equipment |
Percent of vehicles that have met or exceeded their Useful Life Benchmark (ULB) |
System Preservation |
Infrastructure Condition |
Rolling Stock |
Percent of revenue vehicles within a particular asset class that have met or exceeded their ULB |
System Preservation |
Infrastructure Condition |
Infrastructure |
Percent of track segments with performance restrictions |
System Preservation |
Infrastructure Condition |
Facilities |
Percent of facilities within an asset class rated below 3.0 on the Federal Transit Administration’s Transit Economic Requirements Model scale |
System Preservation |
Note: This table reflects federally required transit performance measures as of May 31, 2018.
a The Public Transportation Agency Safety Plan Rule, which requires public transportation operators and MPOs to develop targets for safety measures identified in the National Public Transportation Safety Plan, has not been finalized.
Sources: National Public Transportation Safety Plan (January 2017), the proposed Public Transportation Agency Safety Plan Rule (49 Code of Federal Regulations Part 673), and the final Transit Asset Management Rule (49 CFR Part 625).
TABLE 4-3
Federally Required Highway Performance measures
| National Goal |
Highway Performance Area |
Performance Measure |
Relevant MPO Goal Area |
|---|---|---|---|
Safety |
Injuries and Fatalities |
|
Safety |
Infrastructure Condition |
Pavement Condition |
|
System Preservation |
Infrastructure Condition |
Bridge Condition |
|
System Preservation |
System Reliability |
Performance of the National Highway System |
|
Capacity Management/Mobility |
Environmental Sustainability |
Performance of the National Highway System |
|
Clean Air/Clean Communities |
System Reliability, Freight Movement, and Economic Vitality |
Freight Movement on the Interstate System |
|
Capacity Management/Mobility, Economic Vitality |
Congestion Reduction |
Traffic Congestion |
|
Capacity Management/Mobility |
Environmental Sustainability |
On-Road Mobile Source Emissions |
|
Clean Air/Clean Communities |
Note: This table reflects federally required highway performance measures as of May 31, 2018. Rules pertaining to these performance measures (except where noted) are now in effect.
a The provisions of the final rules for federally required highway performance measures that pertain to carbon dioxide emissions on the NHS went into effect on September 28, 2017. The Federal Highway Administration has since issued a notice of proposed rulemaking that would repeal this measure, though this rulemaking has not yet been finalized. For more information on the MPO’s response to the Commonwealth’s greenhouse gas monitoring requirements, see Chapters 1 and 2, and Appendix B.
b The Boston Region MPO includes an area designated as in maintenance for carbon monoxide, so the MPO is currently required to comply with this performance measure requirement. For more information on air quality conformity requirements that apply to the MPO, see Chapter 5.
NHS = National Highway System
Sources: Highway Safety Improvement Program Rule (23 CFR 924), National Performance Management Measures Rule (23 CFR 490).
States, public transit operators, and MPOs are required to set performance targets to address these measures and track progress toward attainment of desired outcomes for the transportation system. They also are required to coordinate with one another and to share information and data so that there is consistency across these agencies’ target-setting processes.
The MPO’s LRTP and TIP will become planning and programming mechanisms to help achieve performance targets that the MPO establishes, and they will serve as valuable reporting tools. States, public transit operators, and MPOs set targets according to federally defined schedules. As MPO targets are established, the measures and targets will be described in detail in the MPO’s LRTPs and TIPs. (For most performance measures, MPOs must set targets no later than 180 days after their respective states or public transit operators have set their targets.) The LRTPs will describe the state of the transportation system with respect to the federally required measures and will report on progress toward meeting required targets. The TIPs will describe the links between short-term capital investment priorities and these measures and targets, and discuss, to the extent practicable, how these investments are anticipated to help the MPO achieve its targets.
The MPO’s PBPP process must respond to federal performance management requirements established under MAP-21 and the FAST Act. However, the MPO’s approach to performance management addresses other areas that pertain to its 3C responsibilities and can encompass other activities that relate to the MPO’s goals and objectives.
For example, MAP-21 and the FAST Act do not specify transportation equity performance measures for states and MPOs to monitor. However, the MPO has established a transportation equity goal to provide comparable transportation access and service quality among communities, regardless of their income level or minority population. This goal and its associated objectives are rooted in several federal regulations and presidential executive orders, including Title VI of the Civil Rights Act of 1964, Executive Order 12898 (addressing environmental justice), the Americans with Disabilities Act (ADA), and other USDOT orders. (For more information on these laws and orders, see Chapter 1.) To comply with these regulations, the MPO systematically addresses the concerns of populations that these regulations protect—referred to here as transportation equity populations—throughout the MPO planning process, including when selecting projects through the TIP. Regular equity performance monitoring enables the MPO to better understand how transportation equity populations in the region may be affected by transportation investment decisions, so that it can decide whether and how to adjust its investment approach.
To create a comprehensive PBPP practice, the MPO can also choose to monitor or set targets for additional performance measures, which are not federally required, that apply to its goal areas. For example, while the federally required reliability measures discussed in Table 4-3 apply to the MPO’s Capacity Management and Mobility goal, the MPO may wish to examine measures that account for non-NHS roadways or other travel modes. Over the coming years, the MPO will examine whether and how to incorporate other performance measures and practices into its PBPP process. Future LRTPs and TIPs will provide information on these other performance measures and monitoring activities, as well as on federally required performance measures.
To date, the MPO has made strides to integrate PBPP practices into its activities, help meet FAST Act performance management requirements, and improve the MPO’s decision making. The steps the MPO has taken include the following:
For more information about next steps the MPO will take to advance its PBPP process, see the section titled Next Steps for Advancing PBPP at the end of this chapter.
The MPO programs capital investments via the TIP to achieve federal and MPO goals for the transportation system. Several aspects of the TIP development process relate the MPO’s investment decision-making to PBPP.
In Charting Progress to 2040, the MPO strengthened the link between its spending and improvements to transportation performance by establishing a series of investment programs. Each of these programs supports multiple MPO goal areas. These investment programs are as follows:
As described in Charting Progress to 2040, the MPO allocates its discretionary funds to these investment programs. These funds are assigned to projects that meet the investment programs’ criteria. Details about these programs and their relationship to MPO goals are shown in Figure 4-1.
FIGURE 4-1
MPO Investment Programs
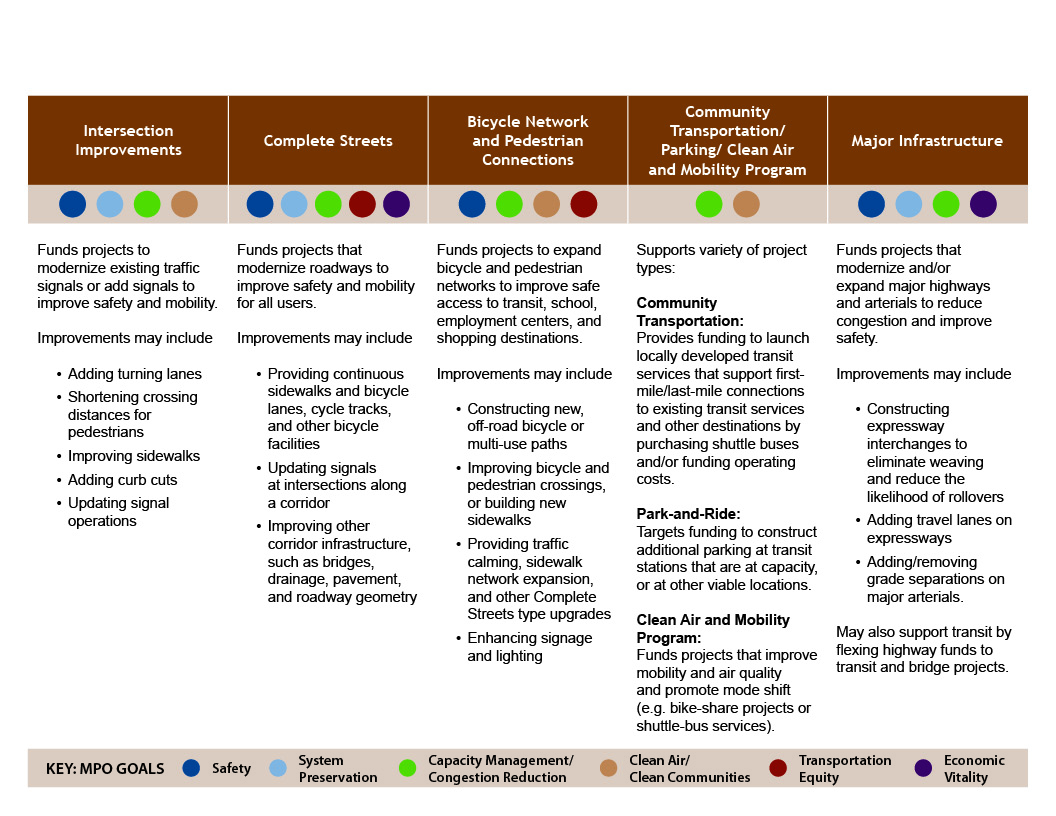
Over the past several years, this chapter of the TIP document has focused on broad performance trends pertaining to several MPO goal areas and the anticipated performance of TIP projects funded with Regional Target dollars. During FFY 2018, the MPO began to set targets for the federally required performance measures listed in Tables 4-2 and 4-3. Targets for highway safety performance measures are discussed in the Safety Performance section of this chapter.
During FFY 2019 and subsequent years, the MPO will continue setting targets for these and other federally required measures. If desired, the MPO may set targets for additional measures that are not federally required. As targets are set, the MPO will update and enhance trend and project performance data, and this chapter of the TIP will include descriptions of how TIP investments will help the MPO make progress with respect to performance measures and targets.
As discussed in Chapter 2, MassDOT’s Capital Investment Plan (CIP) update process identifies priority transit, bridge, and statewide infrastructure projects for the five MassDOT divisions and the MBTA. The CIP process uses a framework that prioritizes funding according to MassDOT’s strategic goals (listed in descending order of priority):
MassDOT and the MBTA have created investment programs that relate to these strategic goals. They prioritize individual projects for inclusion in these programs using a process recommended by the Project Selection Advisory Council (PSAC) and based on data from asset management systems maintained by MassDOT agencies. (More information about PSAC criteria is available in Chapter 2.) MassDOT and the MBTA continue to improve the project selection process by incorporating performance-based plans and data.
The other regional transit authorities (RTAs) in the Boston region—the MetroWest Regional Transit Authority (MWRTA) and the Cape Ann Transportation Authority (CATA)—coordinate with the MassDOT Rail and Transit Division to develop their capital programs, the federally funded components of which are reflected in this document. The Rail and Transit Division also distributes Federal Transit Administration (FTA) Section 5310 funds and other funds to transit providers in the region—these investments are reflected in the TIP as well.
MassDOT, the MBTA, CATA, and MWRTA continue to address federal performance management requirements and performance-based plans as these go into effect.
Table 4-4 shows the distribution of FFY 2019-23 Regional Target funds across the MPO’s investment programs and the number of projects that will receive funds in each program.
TABLE 4-4
REGIONAL TARGET FUNDING BY MPO INVESTMENT PROGRAM
Investment Program |
Projects Receiving Regional Target Funds |
Regional Target Funds |
Bicycle Network and Pedestrian Connections |
2 |
$16,524,742 |
Community Transportation/Parking/Clean Air and Mobilitya |
n/a |
$4,000,000 |
Complete Streets |
22 |
$172,930,349 |
Intersection Improvements |
8 |
$48,795,309 |
Major Infrastructure—Roadway Projects |
4 |
$167,799,442 |
Major Infrastructure—Flex to Transitb |
1 |
$105,500,000 |
Total Projects |
37 |
$515,549,841 |
a The Community Transportation / Parking / Clean Air and Mobility program is under development. Once the program is finalized, the MPO will program projects beginning in FFY 2021.
b The MPO has flexed federal highway improvement dollars to support the Green Line Extension Phase 1.
Source: Boston Region MPO.
Figure 4-2 shows the share of FFYs 2019−23 Regional Target funding in each MPO investment program.
FIGURE 4-2
REGIONAL TARGET FUNDING BY MPO INVESTMENT PROGRAM
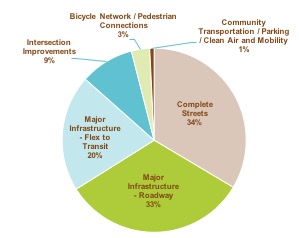
For more information about highway projects funded by MassDOT or other funding sources, such as earmarks, see Chapter 3. Also see Chapter 3 for more information about transit projects and programs funded by MassDOT or transit agencies.
The following sections provide PBPP information for each MPO goal area in detail by discussing (1) relevant trends, initiatives, and planning activities; (2) applicable performance measures and targets; (3) ways that FFYs 2019−23 TIP investments address the MPO’s goal areas and relevant performance measures, based on MPO estimates using available project data; and (4) relevant next steps to improve performance monitoring. These sections will be updated annually as the MPO integrates new performance measures, targets, and information into its PBPP practice.
MPO Goal: Transportation by all modes will be safe
Safety for all transportation modes continues to be a top priority for the Boston Region MPO. The MPO has committed to investing in projects and programs that aim to reduce the number and severity of crashes for all modes, and to reducing serious injuries and fatalities occurring on the transportation system.
The Commonwealth of Massachusetts and the MPO track traffic incidents, fatalities, and serious injuries involving motor vehicles using information from the Massachusetts Crash Data System and the Federal Highway Administration’s (FHWA) Fatality Analysis and Reporting System (FARS). During 2017 and 2018, the MPO coordinated with the Commonwealth to analyze safety data and develop targets for federally required highway safety performance measures. This process provided opportunities to examine the Boston region’s roadway safety performance in the context of roadway safety performance throughout Massachusetts.
Figure 4-3 shows the recent trend in motor vehicle crashes for both the Boston region and Massachusetts as a whole.4 In this figure and the figures that follow, safety data is shown in rolling five-year annual averages. The data in Figure 4-3 show that, for the period of analysis, motor vehicle crashes initially decreased statewide and subsequently increased, resulting in a net increase in crashes of 0.5 percent for this period. During the same period, crashes in the Boston region decreased by 7.5 percent.
FIGURE 4-3
Total Motor Vehicle Crashes
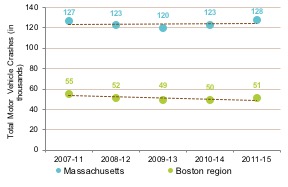
Figure 4-4 shows the number of motor vehicle crashes in Massachusetts and the Boston region that involved bicyclists and pedestrians. These crashes increased during the analysis period both statewide and in the Boston region. Crashes involving pedestrians increased by higher percentages during this period (18.8 percent for Massachusetts and 12.9 percent for the Boston region) compared to the crashes that involved bicyclists (6 percent for Massachusetts and approximately 2.7 percent for the Boston region).
FIGURE 4-4
Motor Vehicle Crashes Involving Bicyclists or Pedestrians
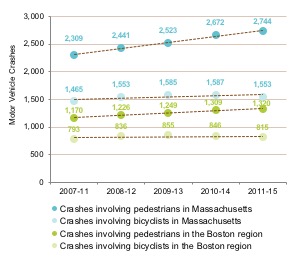
Note: The Boston Region MPO data reflect 101 municipalities.
Source: Massachusetts Crash Data System.
The Commonwealth and the Boston Region MPO also analyzed data for federally required roadway safety performance measures, which are included in Table 4-3. These measures pertain to fatalities and serious injuries from traffic incidents and apply to all public roads. Values for these measures are expressed as five-year rolling annual averages. These measures include the following:
The Commonwealth and the Boston Region MPO projected values for these measures using linear trend lines based on five-year rolling averages for the years 2007–11, 2008–12, 2009–13, 2010–14, and 2011–15.
Figure 4-5 shows historic and projected values for fatalities resulting from motor vehicle crashes, while Figure 4-6 shows
Figure 4-5
Fatalities from Motor Vehicle Crashes
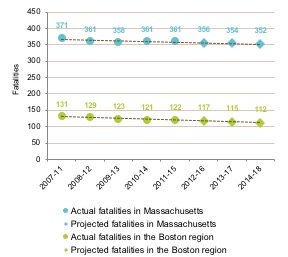
Note: The Boston Region MPO data reflect 101 municipalities.
Sources: Federal Fatality Analysis Reporting System, and MassDOT.
Figure 4-6
Fatality Rate per 100 Million Vehicle-Miles Traveled
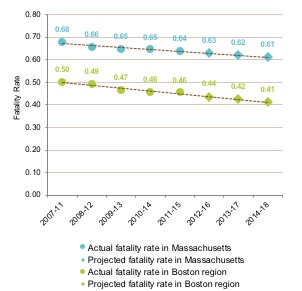
Note: The Boston Region MPO data reflect 101 municipalities.
Sources: Federal Fatality Analysis Reporting System, and MassDOT.
Figure 4-7 shows historic and projected values for people experiencing serious injuries resulting from motor vehicle crashes, and Figure 4-8 shows the serious injury rate per 100 million VMT. Serious injuries and serious injury rates per 100 million VMT are decreasing statewide and in the Boston region. Similar to the fatality trends, serious injuries have decreased by a larger percentage in the Boston region (23.1 percent) than in Massachusetts as a whole (12.4 percent), as has the serious injury rate (24.7 percent in the region as compared to 14.9 percent statewide).
Figure 4-7
Serious Injuries from Motor Vehicle Crashes
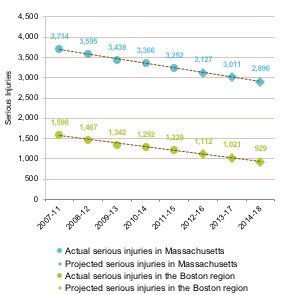
Note: The Boston Region MPO data reflect 101 municipalities.
Sources: Massachusetts Crash Data System and MassDOT.
Figure 4-8
Serious Injury Rate per 100 Million Vehicle-Miles Traveled
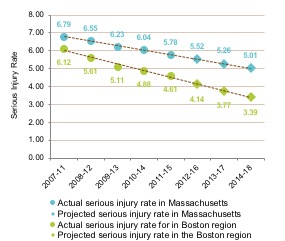
Note: The Boston Region MPO data reflect 101 municipalities.
Sources: Massachusetts Crash Data System and MassDOT.
Figure 4-9 shows historic and projected values for combined non-motorized fatalities and serious injuries for the Boston region and Massachusetts as a whole. Non-motorized fatalities and serious injuries include those experienced by bicyclists, pedestrians, and others traveling by non-motorized modes (such as skateboards). Unlike the prior measures, values for this measure have been increasing over time for both the Boston region 7.9 percent) and Massachusetts overall (20.3 percent).
Figure 4-9
Non-Motorized Fatalities and Serious Injuries
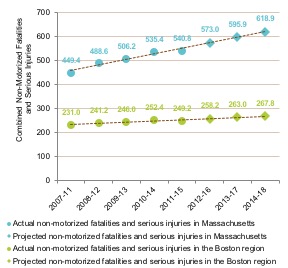
Note: The Boston Region MPO data reflect 101 municipalities.
Sources: Federal Fatality Analysis Reporting System, Massachusetts Crash Data System, and MassDOT.
Figure 4-10 provides insight about non-motorized fatalities and serious injuries by displaying a breakdown of the numbers of fatalities and serious injuries for pedestrians and bicyclists. The figure shows that for both the Boston region and Massachusetts overall, pedestrian fatalities and serious injuries comprise the bulk of total non-motorized fatalities and serious injuries.
Figure 4-10
Pedestrian and Bicyclist Fatalities and Serious Injuries
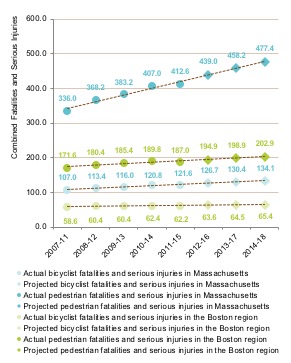
Note: The Boston Region MPO data reflect 101 municipalities.
Sources: Federal Fatality Analysis Reporting System, Massachusetts Crash Data System, and MassDOT.
To meet federal requirements, states and MPOs are required to set targets for specified highway safety performance measures on an annual basis. MPOs can decide to adopt state highway safety targets or to set quantitative targets specific to the MPO’s planning area. States and MPOs must coordinate with one another, to the extent practicable, during their respective target-setting processes.
For calendar year (CY) 2018, the Boston Region MPO has adopted the Commonwealth of Massachusetts’ highway safety targets. These performance targets for CY 2018 will reflect 2014–18 rolling annual averages, as required by FHWA. Table 4-5 shows the 2011–15 five-year rolling averages and the Commonwealth’s CY 2018 targets for each of the five measures.
TaBLE 4-5
2018 Massachusetts Statewide Highway Safety Performance Trends and Targets
Highway Safety Performance Measure |
2015 Safety Measure Value (2011–15 Rolling Average) |
2015 Safety Measure Target (Expected 2014–18 Rolling Average) |
Number of fatalities |
361.0 |
352.0 |
Rate of fatalities per 100 million VMT |
0.641 |
0.610 |
Number of serious injuries |
3,251.8 |
2,896.0 |
Rate of serious injuries per 100 million VMT |
5.779 |
5.010 |
Number of non-motorized fatalities and serious injuries |
540.8 |
540.8 |
VMT = vehicle-miles traveled.
Sources: Federal Fatality Analysis Reporting System, Massachusetts Crash Data System, MassDOT, and Massachusetts Executive Office of Public Safety and Security.
For all measures, except the non-motorized fatalities and serious injuries measure, the Commonwealth used the 2014–18 rolling average values projected by the downward trend lines as its CY 2018 targets. MassDOT recognizes that its initiatives to increase non-motorized travel throughout the Commonwealth have posed a challenge to concurrent activities to reduce non-motorized fatalities and injuries. Rather than adopt a target that reflects an increased amount of non-motorized fatalities and serious injuries, MassDOT has set a CY 2018 target that is equal to the 2011–15 rolling average value, as shown in Figure 4-11.
FIGURE 4-11
Non-motorized Fatality and Serious Injury Trends and Commonwealth Target
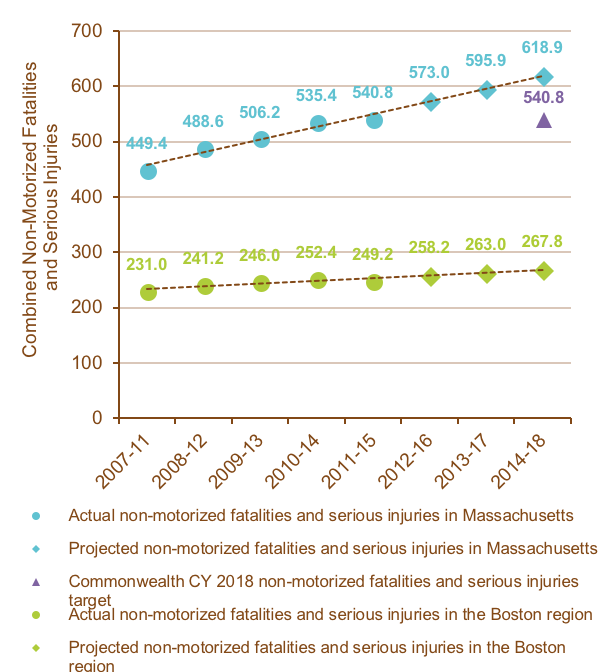
Also, while the Commonwealth has set CY 2018 targets for these five measures to meet federal requirements, it also has a long-term goal to “Move toward Zero Deaths” and eliminate fatalities and serious injuries on Massachusetts roadways.5
By adopting MassDOT’s highway safety targets, the MPO agrees to plan and program projects so that they contribute to accomplishing the Commonwealth’s highway safety targets. This commitment continues the MPO and MassDOT’s practice of investing in Complete Streets roadway reconstruction projects, bicycle and pedestrian infrastructure improvements and expansion, and intersection and safety improvement projects in the CIP and the TIP. These investments are designed to make travel safer for people who walk, bicycle, and use other non-motorized modes.
The Boston Region MPO will continue to work with MassDOT to examine how the Commonwealth’s and the MPO’s planning and programming can help reduce fatalities and serious injuries in the region. During CY 2018, the Commonwealth will be developing its next five-year Strategic Highway Safety Plan and the Boston Region MPO will be developing its next LRTP—both processes will inform future approaches for planning, programming, and monitoring performance to improve safety on Massachusetts roadways. MassDOT and the MPO will coordinate to improve the ways safety and travel data—including bicycle and pedestrian counts—are collected and analyzed. Both organizations will work together to explore other methods and factors to consider when setting future highway safety performance targets and making investments in the transportation system. In the future, TIP documents will continue to discuss MassDOT’s and the MPO’s targets, and how TIP investments may support improvements in highway safety outcomes. Other safety performance measures the MPO decides to monitor or targets that it chooses to set will be discussed also.
When prioritizing its capital investments for the TIP, the MPO uses project-evaluation criteria to determine each project’s relative ability to help reduce crash severity for all modes. These criteria assess the safety needs at locations where projects are proposed based on crash rates and crash severity. Crash severity is measured using the Equivalent Property Damage Only (EPDO) index, which weights crashes based on whether they resulted in property damage (weighted by one), injuries (weighted by five), or fatalities (weighted by 10). The MPO also assesses how well projects will address safety issues by considering proposed safety countermeasures that would be implemented. For more information on the MPO’s safety-oriented TIP criteria, see Appendix A.
Table 4-6 describes the proximity of roadway projects programmed in FFYs 2019-23 that are funded with Regional Target dollars to MassDOT-identified crash cluster locations. MassDOT establishes these crash clusters using a procedure for processing, standardizing, matching, and aggregating crash data.6 MassDOT’s all-mode Highway Safety Improvement Program (HSIP) clusters are used to identify locations that are eligible for federal HSIP funding (for more information on this funding type, see Chapter 2). These all-mode HSIP clusters rank in the top five percent of crash clusters within each regional planning agency area, based on a ranking scheme that accounts for EPDO index values, among other factors. MassDOT also used a crash aggregation methodology for identifying bicycle crash clusters and pedestrian crash clusters.7 When evaluating TIP projects, MPO staff notes where projects are located with respect to each of these types of clusters. This information helps the MPO identify whether projects are addressing locations that have relatively high crash incidences and/or high fatality and injury incidences. Table 4-6 also shows the number of areas with Regional Target projects where crashes involving fatalities, injuries, bicyclists, or pedestrians have occurred, based on data from the Massachusetts Crash Data System.
TaBLE 4-6
SAFETY MEASURES
Measure |
Total Value |
All-mode HSIP cluster locations addressed by projects |
22 clusters |
HSIP pedestrian cluster locations addressed by projects |
7 clusters |
HSIP bicycle cluster locations addressed by projects |
2 clusters |
Project areas where fatal crashes have occurred |
8 areas |
Project areas where crashes involving injuries have occurred |
33 areas |
Project areas where crashes involving pedestrians have occurred |
24 areas |
Project areas where crashes involving bicyclists have occurred |
15 areas |
Note: All-mode HSIP clusters are based on crash data from 2013 to 2015. HSIP bicycle clusters and HSIP pedestrian clusters are based on data from 2006 to 2015. Analysis of crashes in Regional Target funded project locations is based on crash data from 2013 to 2015. The group of projects reflected in this table does not include the Green Line Extension.
Source: Massachusetts Crash Data System, MassDOT, and the Boston Region MPO.
Based on these measures, the MPO expects that investments made at these locations are likely to address safety issues and help the MPO and the Commonwealth progress towards reducing fatalities and serious injuries on the roadway network. The MPO will work with MassDOT and other Commonwealth agencies to investigate other ways to anticipate the effects of TIP projects on highway safety outcomes.
The federal Public Transportation Agency Safety Plan rule, which pertains to performance monitoring for transit system safety, has not yet been finalized; therefore, requirements for transit system safety performance measures have not yet gone into effect. Once this rule is in effect, future TIP documents will include information on relevant performance targets and their relationship to TIP investments. (Table 4-2 lists federally required performance measures for transit systems, including measures pertaining to fatalities, serious injuries, safety events, and system reliability.)
MPO Goal: Maintain the transportation system
System preservation is a priority for the Boston Region MPO because the region’s transportation infrastructure is aging. The demands placed on highway and transit facilities have been taxing to the point that routine maintenance is insufficient to keep up with the need. As a result, there is a significant backlog of maintenance and state-of-good-repair work to be done on the highway and transit systems, including on bridges, roadway pavement, transit rolling stock, and other infrastructure. It is also important to improve the resiliency of the region’s transportation system to prepare for existing or future extreme conditions, such as sea level rise and flooding.
As of 2014, MassDOT’s Pavement Management Program monitored approximately 3,990 lane miles of interstate, access-controlled arterial and collector roadways, and other arterial and collector roadways in the Boston region.8 Roadway segments are assigned a pavement condition value based on the International Roughness Index (IRI), which can be converted to a good, fair, or poor rating.
Figure 4-12 shows the number of interstate, access-controlled arterial and collector, and other arterial and collector lane miles that are in good, fair, or poor condition, according to the 2014 year-end Massachusetts Road Inventory file.9 Approximately 70 percent of all monitored roadway lane miles are in good condition, 26 percent are in fair condition, and four percent are in poor condition. However, MassDOT-maintained arterial and collector roadways without access controls account for a disproportionate share of substandard roadway lane miles. This roadway type accounted for 55 percent of the monitored roadway lane miles in 2014, but about 88 percent of the roadway lane miles that were in substandard (fair or poor) condition.
Figure 4-12
Pavement Condition in the Boston Region by Roadway Classification (2014)
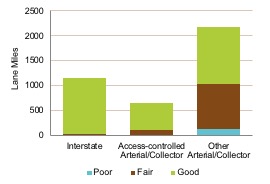
Note: This chart reflects data recorded in the 2014 year-end Massachusetts Road Inventory file, which includes pavement data collected primarily in 2013. Good, fair, and poor classifications are based on IRI ratings. This chart displays data for the 97 municipalities in the Boston region.
Source: MassDOT Pavement Management Program.
MassDOT also monitors the condition of its bridges across the state. As of calendar year 2016, there were 2,850 bridges located within the Boston region. Some are in substandard condition because they have been deemed by MassDOT bridge inspectors to be structurally deficient, functionally obsolete, or weight restricted (posted). Structurally deficient bridges are those that are not necessarily unsafe, but that have deteriorated in ways that reduce the load-carrying capacity of the bridge. Functionally obsolete bridges are not necessarily unsafe either, but they do not meet current traffic demands or are not built to current design standards. A bridge may be posted as weight restricted to ensure traveler safety.
Figure 4-13 displays the condition of substandard bridges in the Boston region between 2012 and 2016, based on data from the Massachusetts Bridge Inventory. During this period, the percentage of structurally deficient bridges ranged between five and six percent of all bridges in the region. The share of functionally obsolete bridges increased from 19 to 20 percent, and the share of posted bridges declined from five to four percent.
FIGURE 4-13
Condition of Substandard Bridges in the Boston Region
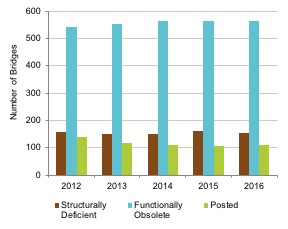
Note: This chart displays data for the 97 municipalities in the Boston region.
Source: MassDOT Bridge Inventory.
Table 4-3, which lists federally required performance measures for highway systems, includes measures pertaining to the condition of bridges and pavement on the NHS. MassDOT and the Boston Region MPO are in the process of setting their initial targets for these measures. These target-setting processes will be informed by MassDOT’s bridge and pavement management data. They also will be informed by MassDOT’s upcoming Transportation Asset Management Plan, which will describe the condition of NHS bridges and pavement, and identify investment strategies and a financial plan for making improvements. Future TIP documents will include information on NHS bridge and pavement performance targets, relevant trend data, and a description of how projects included in the TIP may support progress on these performance measures. Information about other system preservation performance measures the MPO may choose to monitor or targets that it may set may be reflected in future TIPs.
In prioritizing capital investments for the TIP, the MPO uses project-evaluation criteria to assess how well each project funded with Regional Target dollars may advance the MPO’s System Preservation goal by improving pavement, bridge, signal, and asset condition. While it has been the policy of the MPO not to fund resurfacing-only projects using Regional Target funds, the MPO funds roadway reconstruction projects that include resurfacing, usually full-depth reconstruction, in addition to other design elements. Projects funded with Regional Target dollars also improve traffic signal equipment or sidewalk infrastructure; enable improved emergency response; or improve the resiliency of the transportation system to extreme weather conditions. While the MassDOT Bridge program remains the primary funding source for replacement or rehabilitation of substandard bridges, Regional Target investments contribute modestly to bridge preservation.
Table 4-7 shows the MPO’s estimates of how FFYs 2019–23 Regional Target investments are expected to improve the condition of the region’s transportation facilities. MPO staff estimates these system preservation measures using available data from MassDOT Bridge Inventory and Roadway Inventory files, the MPO’s All-Hazards Planning Application, project plans, functional design reports, project proponents, and other sources.
TaBLE 4-7
SYSTEM PRESERVATION measures
Measure |
Total Value |
Functionally obsolete bridges improved |
4 bridges currently used by 83,400 vehicles per day |
Lane miles of substandard pavement improved |
82 lane miles currently used by 689,800 vehicles per day |
Miles of substandard sidewalks improved |
49 miles |
Projects that improve emergency response |
24 projects |
Projects that improve the ability to respond to extreme conditions |
7 projects |
Note: The group of projects reflected in this table does not include the Green Line Extension. Estimates of vehicles per day have been rounded to the nearest hundred.
Source: Boston Region MPO.
Table 4-2 lists a set of federally required infrastructure condition performance measures for transit systems. These transit asset management (TAM) measures, which focus on a specific subset of all transit assets, were established in the FTA’s TAM Rule and are detailed in Table 4-8.
Table 4-8
TAM Performance Measures by Transit Asset Category
Transit Asset Category |
Relevant Assets |
Measure |
Measure Type |
Equipment |
Service support, maintenance, and other non-revenue vehicles |
Percent of vehicles that have met or exceeded their ULB |
Age-based |
Rolling Stock |
Buses, vans, and sedans; light and heavy rail cars; commuter rail cars and locomotives; and ferry boats |
Percent of vehicles that have met or exceeded their ULB |
Age-based |
Infrastructure |
Fixed guideway track |
Percent of track segments with performance (speed) restrictions, by mode |
Performance-based |
Facilities |
Passenger stations, parking facilities, administration and maintenance facilities |
Percent of assets with condition rating lower than 3.0 on the FTA TERM Scale |
Condition-based |
FTA = Federal Transit Administration. TAM = Transit Asset Management. TERM = Transit Economic Requirements Model. ULB = Useful Life Benchmark.
Source: FTA, including the TAM Rule (49 CFR Part 625).
FTA defines ULB as “the expected lifecycle of a capital asset for a particular transit provider’s operating environment, or the acceptable period of use in service for a particular transit provider’s operating environment.” For example, FTA’s default ULB value for a bus is 14 years.10 FTA’s Transit Economic Requirements Model (TERM) scale, which pertains to the facilities measure, is a rating system that describes asset condition. The scale values are 1 (poor), 2 (marginal), 3 (adequate), 4 (good), and 5 (excellent).11 Because each measure is intended to represent the share of transit assets that are not in a state of good repair, the goal is to minimize the value for all four measures.
FTA grantees—including transit agencies and agency sponsors, such as MassDOT—are required to develop targets for these TAM measures each fiscal year. MPOs, in turn, are required to set targets for their regions. The three transit agencies that report their federally funded investments in the Boston Region MPO TIP—the MBTA, CATA, and MWRTA—submitted agency-level targets for state fiscal year (SFY) 2018 (July 2017 through June 2018) to the MPO. Their targets reflect the most recent data available on the number, age, and condition of their assets, and their expectations and capital investment plans for improving these assets during SFY 2018. The MPO coordinated with these transit agencies to develop an initial set of TAM targets for the Boston region for SFY 2018. The MPO generally adopted the MBTA, CATA, and MWRTA targets as submitted, though in some cases it aggregated or disaggregated subgroups of transit assets and their associated targets.12 These targets are listed in Tables 4-9 through 4-12, which describe the number of each agency’s relevant assets at the end of SFY 2017 (the baseline year), and the percent of assets that exceeded performance thresholds for that point in time. The tables also describe the number of assets each agency expects to have by the end of SFY 2018, as well as the SFY 2018 performance target for that asset group.
Table 4-9 describes baselines and SFY 2018 targets for the age of transit equipment (specifically, non- revenue vehicles, such as those that support system maintenance). Each agency has discretion to use FTA-identified default ULB values for non-revenue vehicles and rolling stock (described in Table 4-10) or to adjust ULB values with approval from FTA. 13
Table 4-9 shows that in SFY 2018, the MBTA anticipates there will be an increase in the share of non-revenue vehicles that meet or exceed their ULBs by the end of SFY 2018. CATA expects that all of its non-revenue vehicles will continue to be in a state of good repair. MWRTA expects to add an additional tow truck to its equipment fleet during SFY 2018, which will reduce the percentage of its equipment vehicles that meet or exceed their ULB.
Table 4-9:
Baseline Performance Measure Values and SFY 2018 Targets for non-revenue Vehicles
Asset Information |
SFY 2017 (Baseline) |
SFY 2018 |
|||
Agency |
Vehicle Type |
Number of Assets |
Percent of Assets ≥ ULB |
Anticipated Number of Assets |
Target Percentage of Baseline Assets ≥ ULB |
MBTA |
Non-revenue vehicles |
1,822 |
35% |
1,824 |
37% |
CATA |
Non-revenue vehicles |
3 |
0% |
3 |
0% |
MWRTA |
Non-revenue vehicles |
13 |
62% |
14 |
50% |
CATA = Cape Ann Transportation Authority. MBTA = Massachusetts Bay Transportation Authority.
MWRTA = MetroWest Regional Transit Authority. ULB = Useful Life Benchmark.
Source: CATA, MBTA, MWRTA, and the Boston Region MPO
Table 4-10 describes baselines and SFY 2018 targets for the age of rolling stock (vehicles that provide passenger service). Targets for MBTA light rail vehicles, vehicles that provide THE RIDE paratransit service, commuter rail coaches and locomotives, and ferryboats are equal to or lower than baseline conditions. The MBTA has set targets assuming that larger percentages of buses and heavy rail vehicles will meet or exceed their ULB, compared to the SFY 2017 baseline. To ensure the availability of vehicles for safe and reliable service, the MBTA funds bus, light rail, heavy rail, and commuter rail maintenance and service programs and initiatives. Also, a multi-year state-and-MBTA-funded procurement process for new Red and Orange Line (heavy rail) cars is underway, which will ultimately bring Red and Orange Line fleets into a state of good repair. MWRTA expects to make investments that will replace vehicles in its fleet and expand the fleet, and has set SFY 2018 targets to bring all of its rolling stock vehicles into a state of good repair. CATA expects that it will maintain the same level of state of good repair for its rolling stock vehicles in SFY 2018.
Table 4-10:
Baseline Performance Measure Values and SFY 2018 Targets for Rolling Stock
Asset Information |
SFY 2017 (Baseline) |
SFY 2018 |
|||
Agency |
Vehicle Type |
Number of Assets |
Percent of Assets ≥ ULB |
Anticipated Number of Assets |
Target Percentage of Baseline Assets ≥ ULB |
MBTA |
Bus |
1,027 |
3% |
1,023 |
25% |
MBTA |
THE RIDE Vans and Sedans |
647 |
29% |
647 |
14% |
MBTA |
Light Rail Vehicles |
203 |
45% |
206 |
45% |
MBTA |
Heavy Rail Vehicles |
424 |
45% |
430 |
58% |
MBTA |
Commuter Rail Locomotives |
87 |
23% |
90 |
20% |
MBTA |
Commuter Rail Coaches |
443 |
13% |
443 |
13% |
MBTA |
Ferries |
2 |
0% |
4 |
0% |
CATA |
Bus |
7 |
14% |
7 |
14% |
CATA |
Cutaway Vehicles a |
24 |
0% |
24 |
0% |
CATA |
Trolley (simulated)b |
2 |
100% |
2 |
100% |
MWRTA |
Cutaway Vehiclesc |
82 |
13% |
87 |
0% |
MWRTA |
Autos |
9 |
0% |
9 |
0% |
CATA = Cape Ann Transportation Authority. MBTA = Massachusetts Bay Transportation Authority.
MWRTA = MetroWest Regional Transit Authority. ULB = Useful Life Benchmark.
a The NTD defines a cutaway vehicle as a vehicle in which a bus body is mounted on a van or light-duty truck chassis, which may be reinforced or extended. CATA uses eight of these vehicles to provide fixed-route services, and 16 vehicles to provide demand-responsive service.
Simulated trolleys, also known as trolley-replica buses, have rubber tires and internal combustion engines, as opposed to steel-wheeled trolley vehicles or rubber-tire trolley buses that draw power from overhead wires.
c MWRTA uses cutaway vehicles to provide fixed-route and demand-responsive service, and uses autos to provide demand-responsive service.
Source: CATA, MBTA, MWRTA, and the Boston Region MPO
Table 4-11 describes baselines and SFY 2018 targets for transit system facility condition. All three transit agencies have set their SFY 2018 condition targets equal to the baseline percent of assets with a FTA TERM Scale condition rating lower than three.
Table 4-11:
Baseline Performance Measure Values and Proposed SFY 2018 Targets for Facilities
Asset Information |
SFY 2017 (Baseline) |
SFY 2018 |
|||
Agency |
Facility Type |
Number of Assets |
Percent of Assets with TERM Scale Rating < 3.0 |
Anticipated Number of Assets |
Target Percentage of Assets with TERM Scale Rating < 3.0 |
MBTA |
Administrative, Maintenance, and Other Facilitiesa |
141 |
46% |
141 |
46% |
MBTA |
Stations |
277 |
54% |
277 |
54% |
MBTA |
Parkingb |
99 |
65% |
99 |
65% |
CATA |
Administrative, Maintenance, and Other Facilities |
1 |
0% |
1 |
0% |
MWRTA |
Administrative, Maintenance, and Other Facilities |
1 |
0% |
1 |
0% |
CATA = Cape Ann Transportation Authority. MBTA = Massachusetts Bay Transportation Authority. MWRTA = MetroWest Regional Transit Authority. TERM = Transit Economic Requirements Model.
a The MBTA includes commuter rail layover yards and subway power substations in the category of “administrative, maintenance, and other facilities.”
b Parking facilities include garages and surface lots.
Source: CATA, MBTA, MWRTA, and the Boston Region MPO
Table 4-12 describes baselines and SFY 2018 targets for infrastructure performance, specifically for rail fixed guideway systems. The MBTA is the only transit agency in the Boston region with this asset type. These SFY 2018 targets—which are the same as SFY 2017 baseline levels—are based on historical data and enhanced track quality inspection processes, ongoing maintenance initiatives, and planned capital investment in track renewals and other assets that might affect speed restrictions, such as signals or bridges. Future target setting will also be based on these factors. The MBTA’s Department of Asset Management is currently establishing comprehensive condition assessment standards for track, signals, and communication and power systems, which will further refine condition criteria and assessment methodologies.
Table 4-12:
Baseline Performance Measure Values and SFY 2018 Targets for Rail Fixed Guideway Infrastructure
Asset Information |
SFY 2017 (Baseline) |
SFY 2018 |
|||
Agency |
Facility Type |
Directional Track Miles |
Percent of Track Miles with Performance Restrictions |
Anticipated Directional Track Miles |
Target Percentage of Track Miles with Performance Restrictions |
MBTA |
Light Rail |
45.68 |
8.58% |
45.68 |
8.58% |
MBTA |
Heavy Rail (including Mattapan High Speed Line) |
84.55 |
5.62% |
84.55 |
5.62% |
MBTA |
Commuter Rail |
663.84 |
0.35% |
663.84 |
0.35% |
MBTA = Massachusetts Bay Transportation Authority.
Note: The term “directional track miles” represents the miles managed and maintained by the MBTA with respect to each direction of travel (for example, northbound and southbound), and excludes non-revenue tracks such as yards, turnarounds, and storage tracks. The baseline and target percentages represent the annual average number of miles meeting this criterion over the 12-month reporting period.
Source: MBTA and the Boston Region MPO
The Boston Region MPO will continue to coordinate with the MBTA, CATA and MWRTA to bring the region’s transit assets into a state of good repair. These transit agencies are currently working to meet FTA TAM requirements by developing asset inventories and condition assessments. MBTA staff notes that its Department of Asset Management is in the process of establishing baselines for the MBTA’s entire asset inventory to comply with National Transit Database Asset Inventory Module reporting requirements. The MBTA expects that the full inventory, which is being compiled and validated in phases, will take at least two years to establish. The department is also establishing comprehensive condition assessment standards for different types of assets.
The transit agencies will also create TAM plans, which will provide frameworks for how these agencies will prioritize investments to improve transit asset condition. MassDOT’s Rail and Transit Division will work with other transit providers in the Boston region that receive FTA section 5310 funding to develop a group TAM Plan, asset inventories and condition assessments, and performance targets. All of these activities will inform future performance monitoring, target setting, and decision making by transit agencies, MassDOT, and the MPO.
To date, FTA dollars—as programmed by the region’s transit agencies and MassDOT—fund projects and programs to improve the condition of the region’s transit assets. For more information on these processes, see the “MassDOT and Transit Agency Investment Decisions” section of this chapter.
Chapter 3 describes the investments these agencies plan to make in their systems in FFYs 2019–23, including investments designed to bring transit assets into a state of good repair. Table 3-2 describes the investments and their timing over the TIP’s five-year horizon period. Several projects and programs in the FFYs 2019-23 TIP may address TAM performance as it relates to the TAM measures (see Table 4-8) in future years:
CATA and MWRTA also coordinate with MassDOT’s Rail and Transit Division to maintain vehicle state of good repair through competitive grant applications, including to the Commonwealth’s Community Transit Grant Program. The Rail and Transit Division awards funding, including FTA 5310 funds, through this program on an annual basis, with award announcements typically made in the third quarter of the calendar year.
As discussed above, transit agencies and MassDOT are gathering TAM data and developing TAM plans. These data and plans will guide program development and project selection for future CIPs and TIPs, and will inform future target-setting processes.
MPO Goal: Use existing facility capacity more efficiently and increase healthy transportation capacity
Through its goal and objectives for capacity management and mobility, the MPO seeks to maximize the region’s existing transportation system so that both people and goods can move reliably and connect to key destinations. Much of the Boston region is densely developed, which creates challenges to making major changes to its transportation infrastructure to address access, reliability, and congestion mitigation needs.
In order to determine how well the region’s roadways are performing with respect to mobility, the MPO applies performance measures that gauge the duration, extent, intensity, and reliability (or regularity) of the occurrence of congestion. MPO staff analyzes congestion in the region using the Congestion Management Process (CMP) Express Highway and Arterial Performance Dashboards, which can be viewed at bostonmpo.org/applications.
MPO staff established congestion thresholds for the region’s express highways and arterial roadways based on travel time index (TTI), which is the average peak-period travel time divided by free-flow travel time. When the average peak-period travel time equals free-flow travel time, the index equals one (1); higher values indicate more congestion.
The MPO’s TTI-based congestion thresholds are as follows:
Speed and travel time data help the Boston Region MPO to understand how congestion is changing on the region’s express highways and arterial roadways. Figures 4-14 through 4-17 compare congestion levels based on data from 2012 to congestion levels based on data from 2015. Each figure reflects a different combination of roadway type and time of day. These figures show both the total lane miles experiencing each level of congestion and the percent of CMP-monitored roadways experiencing each level of congestion.
Congestion is getting worse on the region’s expressways. While 28 percent of CMP-monitored express highways experienced some congestion during the AM peak period in 2012, this share increased to 37 percent in 2015 (Figure 4-14). The number of lane miles experiencing moderate congestion increased by 53 lane miles (21 percent) between these two time periods, while the number of lane miles experiencing severe congestion increased by approximately 47 lane miles (60 percent).
Figure 4-14
Lane Miles of Congestion on CMP-Monitored Expressways in the AM Peak Period, 2012 and 2015
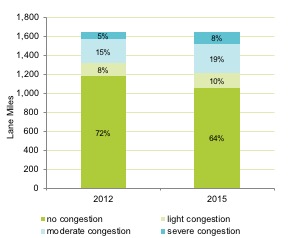
Note: This chart displays data for the 97 municipalities in the Boston Region. The AM peak period for expressways is from 6:00 AM to 10:00 AM.
Source: Boston Region MPO Congestion Management Process, 2012 and 2015 INRIX data.
During the PM peak period, 30 percent of monitored expressways experienced some level of congestion in 2012—by 2015, this increased to 41 percent (Figure 4-15). The number of lane miles experiencing moderate congestion increased by 97 lane miles (33 percent), while the number of lane miles experiencing severe congestion increased by 83 lane miles (258 percent).
Figure 4-15
Lane Miles of Congestion on CMP-Monitored Expressways in the PM Peak Period, 2012 and 2015
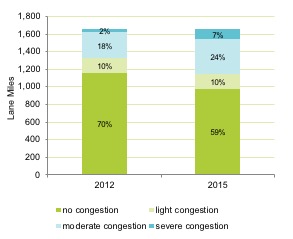
Note: This chart displays data for the 97 municipalities in the Boston Region. The PM peak period for expressways is from 3:00 PM to 7:00 PM.
Source: Boston Region MPO Congestion Management Process, 2012 and 2015 INRIX data.
Congestion was worse on arterial roadways than on expressways even in 2012, and arterial roadway congestion has become worse based on 2015 data. In the AM peak period, 51 percent of arterial roadways experienced congestion to some degree in 2012. In 2015, 79 percent experienced congestion (Figure 4-16). The number of lane miles experiencing moderate congestion increased by approximately 742 lane miles (124 percent) between these two time periods, while the number of lane miles experiencing severe congestion increased by approximately 117 lane miles (287 percent).
FIGURE 4-16
Lane Miles of Congestion on CMP-Monitored Arterial Roadways in the AM Peak Period, 2012 and 2015
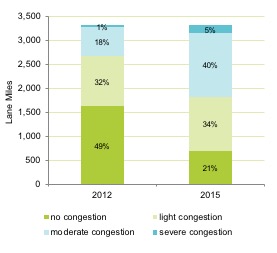
Note: This chart displays data for the 97 municipalities in the Boston Region. The AM peak period for arterial roadways is from 6:30 AM to 9:30 AM.
Source: Boston Region MPO Congestion Management Process, 2012 and 2015 INRIX data.
During the PM peak period, 49 percent of monitored expressways experienced some degree of congestion in 2012. By 2015, congestion increased to 81 percent (Figure 4-17). The number of lane miles experiencing moderate congestion increased by 1,016 lane miles (179 percent), while the number of lane miles experiencing severe congestion increased by 224 lane miles (more than 1,000 percent).
FIGURE 4-17
Lane Miles of Congestion on CMP-Monitored Arterial Roadways in the PM Peak Period, 2012 and 2015
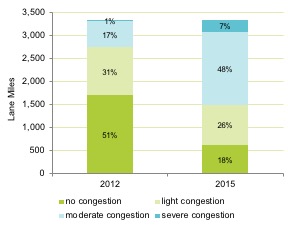
Note: This chart displays data for the 97 municipalities in the Boston region. The PM peak period for arterial roadways is from 3:30 PM to 6:30 PM.
Source: Boston Region MPO Congestion Management Process, and 2012 and 2015 INRIX data.
Overall, the trends presented here highlight the need to address growing congestion on the region’s roadways. The MPO will work to gather and analyze data to capture capacity management and mobility trends for other modes, such as transit, bicycle, and pedestrian travel, which can be incorporated into future TIPs.
Table 4-3, which lists federally required performance measures for highway systems, includes measures pertaining to reliability of person-miles traveled on the interstates and the non-interstate National Highway System (NHS). FHWA also requires states and MPOs to monitor and set targets related to the following:
These target-setting processes will be informed by a variety of data sources, including FHWA’s National Performance Management Research Data Set (NPMRDS). MassDOT and the Boston Region MPO are in the process of setting initial targets for these measures, and will coordinate with other states and MPOs in the Boston urbanized area—which extends into New Hampshire and Rhode Island— for the PHED and non-SOV travel measures. Future TIP documents will include information on these targets, relevant trend data, and a description of how projects included in the TIP may help improve reliability, reduce delay, and enable more travel by non-SOV modes.
The MPO has not yet established other performance measures specific to capacity management and mobility, such as measures that could be used to track access to transit service or bicycle and pedestrian facilities. In future TIP documents, this chapter may also include information about other MPO capacity management and mobility measures and targets.
The MPO seeks to make investments that help manage capacity on the transportation network and improve mobility for travelers in a variety of ways, including the following:
When prioritizing projects funded with Regional Target dollars, the MPO uses evaluation criteria to assess how well each project expands transportation options (and mode choice) or helps reduce congestion and delay. For more information on the MPO’s capacity management and mobility-oriented TIP criteria, see Appendix A.
Table 4-13 shows the MPO’s estimates of how FFYs 2019–23 Regional Target-funded highway investments address these areas. MPO staff estimates multimodal facilities, connections, and access measures using available data from project plans, functional design reports, project proponents, and other sources. Staff estimates aggregate changes in vehicle hours of delay using project-level information on vehicle volumes and changes in delay times at intersections from project improvements.
Table 4-13
Capacity Management and Mobility Measures
Measure |
Total Value |
Net reduction in vehicle hours of delay per daya |
13,900 hours per day |
Miles of new sidewalks added |
16 miles |
Lane miles of new bicycle accommodations and shared-use paths |
61 lane miles |
Projects that improve intermodal connections or access to transit |
29 projects |
Note: The group of projects reflected in this table does not include the Green Line Extension.
a Calculations for reduced daily vehicle delay were conducted for a set of projects that exclude several highway projects that were included in the air quality modeling results in Charting Progress to 2040. This aggregate estimate is based on projected future conditions for project locations and has been rounded to the nearest hundred.
Source: Boston Region MPO.
MPO Goal: Create an environmentally friendly transportation system
When making investments in the region’s transportation system, the Boston Region MPO seeks to invest in projects and programs that reduce greenhouse gases (GHGs) and other transportation-related pollutants, and otherwise minimize negative environmental impacts. The MPO agrees that GHG emissions contribute to climate change. If climate change trends continue as projected, the conditions in the Boston region will include a rise in sea level coupled with storm-induced flooding, and warmer temperatures that would affect the region’s infrastructure, economy, human health, and natural resources. Massachusetts is responding to this challenge by taking action to reduce the GHGs produced in the state, including those generated by the transportation sector. To that end, Massachusetts passed its Global Warming Solutions Act (GWSA), which requires reductions of GHGs by 2020, and further reductions by 2050, relative to 1990 baseline conditions. To meet GWSA requirements, the MPO works with MassDOT and other stakeholders to anticipate the GHG impacts of projects included in the TIP.
Table 4-3, which lists federally required performance measures for highway systems, including a measure for total reduction of on-road mobile source emissions for specific pollutants and precursors that apply to state or MPO areas.14 The Boston Region MPO includes an area designated as in maintenance for carbon monoxide, so the MPO is currently required to comply with this performance measure requirement. For more information on air quality conformity requirements that apply to the Boston Region MPO, see Chapter 5.
MassDOT and the Boston Region MPO are in the process of setting their initial targets for this emissions performance measure. Future TIP documents will include information on this this measure and related targets, as well as a description of how projects included in the TIP may support progress on this measure. The MPO also will continue to monitor and evaluate the GHG impacts of projects to meet GWSA requirements—for more information about these activities, see Chapters 1 and 2 and Appendix B. This chapter may also reflect information about other air quality or environmental performance measures the MPO may choose to monitor or targets that it has set.
The MPO uses evaluation criteria to assess the projected transportation-related emissions of each project that is a candidate for Regional Target funding and to advance the MPO’s goal of promoting clean air and clean communities. Transportation projects can support reductions in CO2, volatile organize compounds (VOCs), nitrogen oxides (NOx) and carbon monoxide (CO) by improving traffic flow and bicycle and pedestrian travel. MPO staff estimates emissions for projects using MassDOT’s air quality analysis worksheets for each project type and the Environmental Protection Agency’s Mobile Source Emission Simulator (MOVES) emission factors.
Table 4-14 shows the MPO’s estimates of how projects funded with FFYs 2019–23 Regional Target dollars are expected to reduce CO2 and other emissions.
Table 4-14
Clean Air/Clean Communities MEasures
Measure |
Total Value |
Annual kilograms of CO2 reduced |
12,999,000 kilograms |
Annual kilograms of VOCs, NOx, and CO reduced |
21,200 kilograms |
Note: The group of projects reflected in this table does not include the Green Line Extension.
Calculations for reduced daily vehicle delay exclude results for several highway projects that were included in the air quality modeling results in Charting Progress to 2040. Estimates in this table are based on projected future conditions for project locations and have been rounded to the nearest hundred.
CO = carbon monoxide; CO 2 = carbon dioxide; NOx = nitrogen oxides; VOCs = volatile organic compounds. Source: Boston Region MPO. MPO Goal: Provide comparable transportation access and service quality among communities, regardless of income level or minority population The MPO aims to ensure that all residents in the Boston region fairly share in the benefits and burdens of its transportation planning investments, have opportunities to participate in the transportation planning process, and have a voice in the selection of transportation investments in their communities. To this end, the MPO systematically integrates the concerns of specific populations it has identified as transportation equity populations into its planning process and strives to address these concerns through its selection of transportation projects. When making investment decisions, the MPO considers whether projects would serve and benefit several transportation equity populations: people who identify as minorities, have limited English proficiency (LEP), are 75 or older, or have a disability; or members of low-income households or zero-vehicle households.15 These populations include those protected by federal laws and regulations—such as minorities and people with disabilities—as well as those not protected by federal laws or regulations but of interest to the MPO from an equity standpoint because they have specific transportation needs (such as members of zero-vehicle households). The analyses that follow apply only to projects that receive the MPO's Regional Target funding, the source of which is the FHWA Highway Program (see Chapter 2). Most of the MPO’s FFYs 2019-23 Regional Target funds have been invested in highway projects, except for funds that have been flexed to the Transit Program to support the MBTA’s Green Line Extension project. These analyses do not reflect other highway projects in the region that are funded by MassDOT or transit projects funded by public transit agencies, including the MBTA, MWRTA, and CATA. As a result, these analyses only partially reflect the distribution of funds in the Boston region, and may not fully capture the number of people served or the shares of funding received by transportation equity populations. Tables 4-15 through 4-18 show how they are served by FFYs 2019-23 TIP projects funded with Regional Target dollars.16 Table 4-15 shows the total number of people or households in each transportation equity population in the MPO region, as well as their share of the total population or households. Table 4-15 Transportation Equity Populations in the Boston Region Transportation Equity Category Transportation Equity Population Boston Region Total Population Share of Boston Region Total Population Minorities 870,459 3,087,796 28.2% People with Limited English Proficiencya 308,770 2,915,559 10.6% Elderly (age 75 or older) 206,578 3,087,796 6.7% People with Disabilitiesa 306,776 3,056,697 10.0% Low-Income Householdsa 393,192 1,216,550 32.3% Zero-Vehicle Households 196,460 1,216,550 16.1% Note: For the minority population, people with limited English proficiency, elderly population, and people with disabilities categories, the amounts in the “Transportation Equity Population” and “Boston Region Total Population” columns reflect numbers of people. For the low-income and zero-vehicle household categories, the amounts in these columns reflect numbers of households. The table reflects the change in the Boston Region MPO membership starting in FFY 2018, from 101 to 97 municipalities. a Footnote 13 in this chapter describes the methods MPO staff uses to tabulate these transportation equity populations. Source: Data from 2010 US Census and 2010–14 American Community Survey. During project evaluation, the MPO identifies projects that would benefit transportation equity populations by giving points to projects with the potential to serve those populations. A project is considered to serve people who live within one-half mile of the project’s limits. A project receives points if the share of the transportation equity population served meets or exceeds the population's share of the region’s total population, or threshold, as shown in Table 4-15.The number of points awarded to each qualifying project is based on the total number of people or households in the transportation equity population. Appendix A shows the scores for projects evaluated during the FFYs 2019–23 development cycle. While the TIP project criteria are designed to evaluate individual projects, MPO staff also analyzes the transportation equity population that is served by the full set of projects funded with Regional Target dollars. Table 4-16 shows the size of the transportation equity populations that are served by these projects and the share of the total number of people or households that would be served by them (based on proximity to the project, as defined above). The results show that the share of each transportation equity population that would be served by the Regional Target projects approaches or exceeds the share that each group comprises of the total Boston region population. Table 4-16 Transportation Equity Populations Within One-Half Mile of Projects funded with Regional Target FUNDs Transportation Equity Category Transportation Equity Population in Project Area Total Population in Project Area Share of Population in Project Area Share of Boston Region Total Population Minorities 153,593 445,108 34.5% 28.2% People with Limited English Proficiencya 66,365 421,447 15.7% 10.6% Elderly (age 75 or older) 30,656 445,108 6.9% 6.7% People with Disabilitiesa 42,573 440,305 9.7% 10.0% Low-Income Householdsa 71,100 180,130 39.5% 32.3% Zero-Vehicle Households 44,080 180,130 24.5% 16.1% Note: For the minority population, people with limited English proficiency, elderly population, and people with disabilities categories, the numbers in the “Transportation Equity Population in Project Area” and “Share of Population in Project Area” columns reflect numbers of people. For the low-income and zero-vehicle household categories, the numbers in these columns reflect the number of households. This analysis examines populations located within a one-half mile buffer of projects programmed in the FFYs 2019-23 TIP with Regional Target dollars. The table reflects the change in the Boston Region MPO membership starting in FFY 2018, from 101 to 97 municipalities. The table does not include the Community Transportation/Parking/Clean Air and Mobility investment program because specific projects have not yet been identified for the program. a Footnote 13 in this chapter describes the methods MPO staff uses to tabulate these transportation equity populations. Sources: 2010 U S Census, 2010–14 American Community Survey, and the Boston Region MPO. Table 4-17 shows the number of households or people in each transportation equity population served by the projects funded with Regional Target dollars, sorted by MPO investment program. The share of people or households served varies across investment programs. Overall, transportation equity populations are well-served by most MPO investment programs. In particular, the share of people or households served by the Complete Streets, Major Infrastructure—Roadway Projects, and Major Infrastructure—Flex to Transit investment programs far exceeds the regional share for nearly every transportation equity population. On the other hand, projects in the Bicycle Network and Pedestrian Connections investment program serve a smaller share of transportation equity populations compared to their regional shares. As noted in the table, the number of projects within each MPO investment program varies. The number of projects in an investment program could affect the extent to which the overall program is able to serve transportation equity populations. TABLE 4-17 MPO INVESTMENT PROGRAMS SERVING TRANSPORTATION EQUITY POPULATIONS MPO Investment Program Number of Projects Receiving Regional Target Funding Minorities in Project Area People with Limited English Proficiency in Project Areaa Elderly (age 75 or older) in Project Area People with Disabilities in Project Areaa Low-Income Households in Project Areaa Zero-Vehicle Households in Project Area Population Share Population Share Population Share Population Share Population Share Population Share Bicycle Network and Pedestrian Connections 2 849 12.6% 163 2.5% 483 7.1% 412 6.1% 328 13.5% 92 3.8% Complete Streets 22 96,333 36.1% 45,429 18.1% 17,896 6.7% 26,610 10.0% 43,727 41.2% 24,231 22.8% Intersection Improvements 8 2,665 10.8% 3,639 15.5% 2,478 10.0% 2363 6.7% 3,491 31.7% 1,039 9.4% Major Infrastructure–Roadway Projects 4 31,114 42.7% 8,583 12.4% 6,296 8.6% 7,320 10.4% 13,241 45.3% 11,272 38.6% Major Infrastructure–Flex to Transitb 1 22,632 30.6% 8,551 12.1% 3,503 4.7% 5,868 7.9% 10,313 32.9% 7,446 23.8% Total 37 153,593 34.5% 66,365 15.7% 30,656 6.9% 42,573 9.7% 71,100 39.5% 44,080 24.5% Share of Boston Region Total Population N/A 870,459 28.2% 308,770 10.6% 206,578 6.7% 306,776 10.0% 393,192 32.3% 196,460 16.1% Note: For the minority population, people with limited English proficiency, elderly population, and people with disabilities categories, the numbers in the “Population” columns for each transportation equity population reflect numbers of people. For the low-income and zero-vehicle household categories, the numbers in these columns reflect the number of households. This analysis examines populations located within a one-half mile buffer of projects programmed in the FFYs 2019–23 TIP with Regional Target dollars. The table reflects the change in the Boston Region MPO municipalities starting in FFY 2018, from 101 to 97 municipalities. The table does not include the Community Transportation/Parking/Clean Air and Mobility investment program because specific projects have not yet been identified for the program. a Footnote 13 in this chapter describes the methods MPO staff uses to tabulate these transportation equity populations. b The MPO has flexed federal highway improvement dollars to support the Green Line Extension Phase 1. Sources: 2010 U S Census, 2010–14 American Community Survey, and the Boston Region MPO. Table 4-18 shows the total funding allocated to transportation equity populations based on the number of people or households the MPO estimates would be served by the set of Regional Target projects. As shown in Table 4-4 and Figure 4-2, the MPO has programmed approximately $516 million in Regional Target funding in the FFYs 2019–23 TIP. Equity populations receive slightly less funding when compared to non-equity populations. The MPO will continue to track these data and ensure that equity populations are considered when projects are evaluated for inclusion in the TIP. In future TIPs, the MPO may make appropriate programming adjustments to ensure the equitable distribution of funds. Table 4-18 Funding per person or household for Equity Populations Within One-Half Mile of Projects programmed with Regional Target FUNDS Transportation Equity Category Funding per Person or Household Minorities $825 Non-Minorities $1,320 People with Limited English Proficiencya $789 People fluent in English $1,293 Elderly (age 75 or older) $1,085 People under age 75 $1,154 People with Disabilitiesa $1,050 People without Disabilities $1,174 Low-Income Householdsa $2,238 Non-Low-Income Households $3,233 Zero-Vehicle Households $2,131 Households With at Least One Vehicle $3,070 Note: For the minority population, people with limited English proficiency, elderly population, and people with disabilities categories, the numbers in the “Funding per Person or Household” column for each equity population reflect funding per person. For the low-income and zero-vehicle household categories, the numbers in this column reflect the funding per household. The table does not include the Community Transportation/Parking/Clean Air and Mobility investment program because specific projects have not yet been identified for the program. a Footnote 13 in this chapter describes the methods MPO staff uses to tabulate these transportation equity populations. Sources: 2010 U S Census, 2010–14 American Community Survey, Boston Region MPO. These analyses are basic approaches to understanding whether transportation equity populations would benefit from projects programmed in the TIP. They assume that projects only provide benefits to the people who live nearby, which is not always the case. They also do not identify burdens that a project may impose. Recognizing these limitations, the MPO is exploring more sophisticated methods for identifying the specific benefits and burdens of Regional Target projects on transportation equity populations. Key to this approach will be linking the analyses to existing project criteria and tracking the results over time. Staff anticipates enhancing these analyses each year. MPO Goal: Ensure our transportation network provides a strong foundation for economic vitality The MPO’s economic vitality goal supports the Boston region’s land-use plan, MetroFuture, which was developed by the Metropolitan Area Planning Council (MAPC). One of MetroFuture’s strategies is to coordinate transportation investments to guide economic growth in the region. MAPC worked with its state partners at the Executive Office of Housing and Economic Development (EOHED) and the Executive Office of Energy and Environmental Affairs (EOEEA), as well as municipalities, to identify locations throughout the region appropriate for building housing stock and siting employers, and for preserving open space in the future. These agencies identified the infrastructure improvements required to support the outcomes planned for these local, regional, and state-level priority development and preservation areas. This process identified locations that are best suited to support the type of continued economic vitality and future growth that the market demands and communities desire. Identifying these key growth and preservation locations also helps MAPC, the Boston Region MPO, and state agencies to understand both the infrastructure and technical-assistance needs required to support MetroFuture’s vision and to prioritize limited regional and state funding for development and land preservation. When evaluating TIP projects, the MPO assesses how well each project considered for TIP funding advances MetroFuture’s land-use planning. This means supporting investments in locations that have already been developed for residential, commercial, or industrial use; locations with adequate sewer and water infrastructure; areas identified for economic development by state, regional, and local planning; and areas with a relatively high density of existing development. Table 4-3, which lists federally required performance measures for highway systems, includes a measure pertaining to the reliability of freight movement on the interstate highway system. While this measure has the most direct implications for the MPO’s Capacity Management/Mobility goal, reliable freight movement also supports economic vitality. MassDOT and the Boston Region MPO are in the process of setting their initial targets for this measure. Future TIP documents will include information on these targets, relevant trend data, and a description of how projects included in the TIP may support more reliable freight movement on interstate highways. The MPO has not yet established other performance measures specific to economic vitality, such as measures that could be used to track the coordination of land-use development and transportation investments. Future TIP documents may include information about other economic vitality measures and targets set by the MPO. The MPO’s transportation investments advance economic vitality by prioritizing projects that provide access by multiple transportation modes to targeted development areas and to areas of concentrated development. Table 4-19 shows the MPO’s estimates of how projects programmed in FFYs 2019–23 with Regional Target funds address economic vitality. MPO staff estimates these economic vitality measures using MAPC-provided information on targeted development sites and areas of concentrated development, and available data from project plans, functional design reports, project proponents, and other sources. Table 4-19 Economic Vitality MEasures Measure Total Value Projects that improve access to targeted development sites 22 projects Projects that serve areas of concentrated development 34 projects Note: The group of projects reflected in this table does not include the Green Line Extension. Source: Boston Region MPO. Figure 4-18 describes how the projects programmed in FFYs 2019–23 with Regional Target dollars address various performance areas. Figure 4-18 The MPO’s performance-based planning and programming activities are ongoing and will continue to evolve as the MPO monitors and evaluates its planning and investments. The future of PBPP at the Boston Region MPO will be shaped by a number of processes and factors, including the following: In this continually changing environment, the MPO expects to continue or undertake these PBPP activities over the next few years: Going forward, the MPO will continue to monitor progress toward meeting targets and modify its investment strategies and policies, as necessary, to achieve the best possible outcomes across the MPO’s goal areas. Chapter five Determination of Air Quality Conformity
The Commonwealth of Massachusetts—with the exception of the islands of Dukes County—meets federal air quality standards for ground-level ozone. Therefore, the Boston Region Metropolitan Planning Organization (MPO) is not required to perform a conformity determination for ozone for its Long-Range Transportation Plan (LRTP) or Transportation Improvement Program (TIP) to prove that new transportation projects will not result in emission levels that violate the National Ambient Air Quality Standards (NAAQS) for ozone. In addition, the requirement to perform a conformity determination for carbon monoxide for several cities in the Boston region has expired. On April 1, 1996, the US Environmental Protection Agency (EPA) classified the cities of Boston, Cambridge, Chelsea, Everett, Malden, Medford, Quincy, Revere, and Somerville as in attainment (in compliance) for carbon monoxide emissions. Subsequently, a carbon monoxide maintenance plan was set up through the Massachusetts State Implementation Plan (SIP) to ensure that emission levels did not increase. While the maintenance plan was in effect, past LRTPs included an air quality conformity analysis for these communities. As of April 1, 2016, however, the 20-year maintenance period for this carbon monoxide maintenance area expired and transportation conformity is no longer required for this pollutant in these communities. This ruling is documented in a letter from the EPA dated May 12, 2016. On April 22, 2002, the City of Waltham was re-designated as being in attainment for carbon monoxide emissions with an EPA-approved limited-maintenance plan. In areas that have approved limited-maintenance plans, federal actions requiring conformity determinations under the EPA’s transportation conformity rule are considered to satisfy the “budget test” (as budgets are not treated as being constraining in these areas for the length of the initial maintenance period). Any requirements for future “project-level” conformity determinations for projects located within this community will continue to use a “hot-spot” analysis to ensure that any new transportation projects in this area do not cause or contribute to violations of the NAAQS for carbon monoxide. While the MPO is not required to perform modeling analyses for a conformity determination for ozone or carbon monoxide, the MPO still is required to provide a status report on the timely implementation of projects and programs that will reduce emissions from transportation sources—so-called transportation control measures—which are included in the Massachusetts SIP. This status report is provided below. Transportation control measures (TCMs) were submitted to EPA as SIP revisions in 1979 and 1982, and also as part of the Central Artery/Tunnel (CA/T) project. The TCMs in the 1979 and 1982 submissions were accomplished through construction of ongoing projects or implementation of ongoing programs. The TCMs submitted as part of the mitigation for the CA/T project have been documented in the LRTP as recommended or completed projects, except for the following two projects: MassDOT works with the Massachusetts Department of Environmental Protection (DEP) to implement TCMs documented in the SIP. The Boston Region MPO will continue to include relevant projects—including those implemented to provide equal or better emissions outcomes when the primary TCMs do not meet deadlines—in the LRTP and TIP until the process for completing all active TCMs has concluded. When the process has been completed, the MPO will amend the LRTP and future TIPs and their conformity determinations to document any changes (including any interim projects or programs). The status of the TCMs has been updated in the SIP Transit Commitments Status Report, which was submitted to DEP by MassDOT in August 2017. Highlights from the report are presented below. For a detailed description of the status of these projects, please visit the MassDOT website: The Four Corners and Newmarket Stations on the Fairmount commuter rail line opened for service on July 1, 2013. All change orders have been paid and the project is officially closed out. The Talbot Avenue Station opened in November 2012. A station at Blue Hill Avenue has been the subject of significant community controversy during the past seven years. Redesign of the station reached the 100 percent design phase, and those plans were submitted to MassDOT in March 2016. In October 2016, MassDOT updated the public on the design plans and the next steps toward implementing the project. The project team is now advancing with the understanding that continued coordination with the community is paramount. Construction began in spring 2017, and the station is expected to open in spring 2019. MassDOT and the MBTA prepared a Petition to Delay and an Interim Emission Offset Plan to be implemented for the duration of the delay of the Fairmount Line Improvement Project. MassDOT estimated the amount of emission reduction that would be expected from the implementation of the new Fairmount Line stations. With input from Fairmount Line stakeholders, MassDOT proposed offset measures that would meet emission reduction targets while the project remains under construction. The measures include providing shuttle bus service in Boston connecting Andrew Square to Boston Medical Center and increasing service on MBTA bus Route 31, which serves the Boston neighborhoods of Dorchester and Mattapan. These measures were implemented on January 2, 2012, and currently are in place. Funding Source: The Commonwealth The Green Line Extension project is a top transportation priority of the Commonwealth and the largest expansion of the MBTA rapid transit system in decades. This project will extend the MBTA Green Line from a relocated Lechmere Station in East Cambridge to College Avenue in Medford, with a branch to Union Square in Somerville. The project is a collaborative effort of MassDOT and the MBTA, with the MBTA taking the lead in design, engineering, construction, and project management. The project includes the relocation of the existing commuter rail tracks, the construction of 4.3 miles of new Green Line tracks and systems, one relocated station (Lechmere) and six new stations (Union Square, College Avenue, Ball Square, Magoun Square, Gilman Square, and East Somerville), and a new vehicle maintenance facility. Construction of the project has been phased. Initial construction started in 2013. The first phase was funded entirely by the Commonwealth of Massachusetts. The Federal Transit Administration (FTA) then approved funding for the project through the New Starts Program of its Capital Investment Grants Program; a Full Funding Grant Agreement (FFGA), which committed nearly $1 billion in federal funds to the project, was announced in January 2015. Late in 2015, MassDOT launched a review that ultimately concluded that the project was significantly over budget and that total project costs could reach $3 billion if the existing trends continued. As a result, the MBTA Fiscal and Management Control Board and the MassDOT Board of Directors suspended the project until costs could be brought back under control. Construction contracts and program management contracts were terminated. The boards created a multidisciplinary Interim Project Management Team (IPMT) tasked with redesigning all aspects of the project to reduce its costs while maintaining the core functionality, projected benefits, and environmental mitigation commitments. During the redesign process, MassDOT and the MBTA conducted a public outreach process. The IPMT presented a revised plan and design for the project to the boards in May of 2016. The redesign addressed revisions to the stations, vehicle maintenance facility, viaducts, bridges, power and signal systems, and the associated shared-use Somerville Community Path. The station locations, platform size, and functionality all remained unchanged in the redesign. The revised total program cost was estimated at nearly $2.3 billion. (This total value includes monies that have already been spent.) There was a difference of approximately $300 million between the last official program cost of $1.992 billion, as stated in the FFGA, and the revised estimate of $2.289 billion. To make up the difference, the Boston Region MPO committed $157 million in federal highway funding to the project, the cities of Cambridge and Somerville committed a total of $75 million ($50 million from Somerville and $25 million from Cambridge), and MassDOT committed approximately $64 million. In June 2017, the MassDOT Board of Directors voted to transfer the latter funds to the MBTA for the project. The FTA presented its review of the redesigned project in an August 25, 2016, letter to the MBTA. The FTA found that the redesigned project is consistent with the FFGA and this determination allows MassDOT and the MBTA to use federal monies to fund the project. The FTA also found that the latest cost estimates are complete and well documented, and that the project schedule is sound, but possibly optimistic. On August 8, 2016, the MBTA began the process of procuring a new construction team using the design-build procurement method. Changes to the Green Line Extension Project: The 2016 redesign of the Green Line Extension project modified many design elements and proposed changes to the project implementation methods, but the redesign maintains the core functionality of the project and provides the same benefits. As with the original project design, the revised design consists of a 4.3 mile extension of the existing Green Line light rail service to College Avenue in Medford and Union Square in Somerville. It includes the relocation of existing commuter/freight rail track, construction of light rail track and systems, construction or rehabilitation of viaduct structures, and implementation of new power systems, signals, and communications equipment. The revised design includes the same stations in the same locations as originally planned. Factors that affect the potential number of transit trips that would be generated and the air quality benefits that would be achieved as a result of this new light rail extension are the same for the redesign concept as originally proposed. These factors include the number and location of stations, platform size, hours of service, and frequency of service. (The Community Path was not considered in determining the number of transit trips the new rail line would generate, however.) The Green Line Extension, as redesigned, will still provide trains travelling on six minute headways in the weekday peak period, eight to 11 minutes in the weekday off-peak period, 13-14 minutes on weekday evenings, and eight to 10 minutes on weekends. Project cost reductions were realized through modification of project design elements, including the following: Somerville Community Path: The Somerville Community Path has been the subject of extensive discussion and planning throughout the development of the Green Line Extension project. The project, as described in its environmental documents, included planning, design, and engineering for the proposed extension of the Somerville Community Path between Lowell Street and Inner Belt Road in the vicinity of East Somerville Station; however, there was no commitment to construct the path. After the completion of the state and federal environmental review processes, the MBTA decided to incorporate the construction of the path into the Green Line Extension project. However, the MBTA did not commit to build the Community Path as part of its mitigation for delays in the construction time line for the extension. This design for the Somerville Community Path has been identified as a major driver of the forecasted cost increases for the overall project. The cost of the previous design of the path was driven by two factors in particular: To reduce the cost of constructing the Community Path, two options were evaluated: The strong public desire for the Community Path to be constructed in its entirety led the MBTA to include a series of “additive options” as part of the procurement of a construction team. The MBTA asked bidders to provide estimated costs for project elements (such as additional elevators, improved canopies, and improvements to the vehicle maintenance facility, etc.) that the MBTA would like to include, if they are affordable. One of the potential add-ons was a complete Community Path to Lechmere Station. As part of the design-build procurement, the MBTA asked for costs for the base proposal as well as costs for these add-ons. In December 2017, the MBTA issued a notice to proceed to the selected contractor to build the Green Line Extension project, including the Community Path to Lechmere Station. That element is now part of the project under contract. SIP Requirement Status MassDOT has committed substantial resources to the Green Line Extension project and has transitioned the project from the planning and environmental review phases to design, engineering, and eventual construction, while completing the tasks associated with applying for federal New Starts funding. By filing an Expanded Environmental Notification Form, procuring multiple design consultants, and publishing Draft and Final Environmental Impact Reports (DEIR and FEIR), MassDOT met the first four interim milestones established by the Massachusetts SIP for the Green Line Extension project. By completing the design, securing all permits and approvals, executing the FFGA, and acquiring the necessary property for the project, MassDOT met the fifth interim milestone, which states, “On or before 18 months after MEPA’s issuance of a certificate on an FEIR or an SEIR, MassDOT must complete final design, apply for all necessary permits, funds and grants, file any required legislation, and initiate all public and private land acquisition.” Milestones for project completion have been established and made part of the design-build contract. The milestones will be incorporated into that contract. By establishing these milestones, MassDOT has met the sixth and final interim milestone found in the SIP regulation, which states, “Upon completion of all of the above milestones, DEP and MassDOT shall establish a schedule for project construction and deadlines for project completion.” In the 2011 SIP Status Report, MassDOT reported that the Green Line Extension project would not be completed by the legal deadline of December 31, 2014. The time line for overall project completion represents a substantial delay beyond the current SIP deadline of December 31, 2014. This delay triggered the need to provide interim emission reduction offset measures for the period of the delay (beginning January 1, 2015). These offset measures would have to bring about emission reductions equal to or greater than those projected for the Green Line Extension, as specified in the SIP regulation, for the period of the delay. Working with the Central Transportation Planning Staff, MassDOT and the MBTA calculated the reductions of non-methane hydrocarbon, carbon monoxide, and nitrogen oxide required as mitigation for the delay. In June 2012, MassDOT released a list of potential mitigation ideas received from the public that could be used as offset measures. In the summer and fall of 2012, MassDOT elicited public comments on these potential measures. The MBTA created an internal working group to determine a final portfolio of interim mitigation measures to implement by December 31, 2014, the legal deadline for implementation of the Green Line Extension. This work resulted in a recommendation to implement the following three interim mitigation measures, which collectively would meet the emission reduction targets for the project: MassDOT submitted a Petition to Delay to DEP on July 22, 2014. The petition expands further on the analysis and determination of the interim offset measures. DEP conditionally approved MassDOT’s request to delay the project and the implementation of the above mitigation measures. Both the Petition to Delay and the Conditional Approval are available on MassDOT’s website. These measures went into effect at the beginning of 2015 and will remain in place for as long as necessary. Funding Source: The Commonwealth, the Boston Region MPO, the City of Cambridge, and the City of Somerville Former MassDOT Secretary Richard Davey approved construction of the permitted Russia Wharf Ferry Terminal in South Boston and a $460,000 ferry-service startup subsidy in October 2012. The 2005 facility plans and specifications were revised to meet the latest MassDOT Highway Division standards. The bid package was issued in the fall of 2013. A contractor was selected and the notice to proceed was issued in April 2014. Pre-construction activities progressed, but contractual issues associated with the project design led MassDOT to decide to rebid the contract. There is no regularly scheduled passenger water transportation service in this area, nor are there any plans to provide such a service. The City of Boston, however, is undertaking design and engineering work to address the Old Northern Avenue Bridge and will consider ferry vessel clearance. The city received a grant in 2012 to purchase two ferry vessels for use in Boston’s inner harbor, and these vessels could serve the Russia Wharf Ferry Terminal. The Massachusetts Convention Center Authority (MCCA) is working with the City of Boston, MassDOT, and other agencies to develop a business plan for potential ferry service from Lovejoy Wharf to the South Boston waterfront, as recommended in the 2015 South Boston Waterfront Sustainable Transportation Plan. This business plan will include current and future demand projections for ferry ridership, the number and size of ferries needed to satisfy the demand, and the cost for this service. Once the business plan is completed, the MCCA could take over the City of Boston’s grant to help with future costs. Funding Source: The Commonwealth Appendix A Universe of Unprogrammed Projects This appendix lists information about transportation projects that cities and towns in the region prioritized for the Boston Region MPO to consider funding through the Highway Discretionary (“Regional Target”) Program (Table A-1). The evaluation results of those projects scored by MPO staff, using the MPO’s evaluation criteria, also are included in this appendix (Tables A-2 and A-3). Through an outreach process that seeks input from local officials (mainly via municipal TIP contacts) and MassDOT highway district program managers, the MPO staff compiles a list of projects that are active within MassDOT’s design review process and that align with the investment programs established in the Long-Range Transportation Plan (LRTP). This list, known as the Universe of Unprogrammed Projects, includes projects in various stages of development, from conceptual to fully designed and ready to be advertised for construction (Table A-1). Typically, the MPO will only include projects in the Universe if they have been approved by MassDOT’s Project Review Committee (PRC). The MPO uses evaluation criteria to make the process of selecting projects for programming in the TIP both objective and transparent. The criteria are based on the MPO’s goals and objectives, which were adopted for the current LRTP, Charting Progress to 2040. The MPO staff collects data on each project and evaluates those projects for which there are sufficient data. Table A-3 summarizes the evaluation results of projects considered for funding in this year’s TIP. The MPO staff prepares a First-Tier List of Projects—a list of the evaluated projects that received high scores and could be made ready for construction advertising in the five-year time frame of the TIP. The MPO staff then prepares a staff recommendation for a programming scenario for the Regional Target funds that considers the First-Tier List ratings, the construction readiness of the project, the estimated project cost, municipal priority, geographic equity (to ensure that needs are addressed throughout the region), and consistency with the MPO’s LRTP. The MPO reviews and discusses the First-Tier List of Projects, the staff recommendation, and other information before voting to release a draft TIP for a 30-day public review and comment period. Table A-1 FFYs 2019-23 TRANSPORTATION IMPROVEMENT PROGRAM (TIP) DEVELOPMENT UNIVERSE OF UNPROGRAMMED PROJECTS TABLE A-2 Projects Programmed in FFYs 2017-2021 with MPO Target Funds CRITERIA SUBCRITERIA/SCORING SAFETY: Transportation by all modes will be safe. Reduce the number and severity of crashes, for all modes Crash Severity Value: EPDO index +5 EPDO value of 300 or more Crash Rate (either intersection or corridor): Intersection: Corridor: Improves truck-related safety issue +3 High total effectiveness of truck safety countermeasures If project scores points above, then it is eligible for additional points below: Improves bicycle safety +3 High total effectiveness of bicycle safety countermeasures If project scores points above, then it is eligible for additional points below: Improves pedestrian safety +3 High total effectiveness of pedestrian safety countermeasures If project scores points above, then it is eligible for additional points below: Improves safety or removes an at-grade railroad crossing +5 Removes an at-grade railroad crossing SAFETY (30 possible points) Equivalent Property Damage Only (EPDO) Vehicle-Miles Traveled (VMT) Highway Safety Improvement Program (HSIP) SYSTEM PRESERVATION: Maintain the transportation system. Improve the condition of on- and off-system bridges Improves substandard roadway bridge(s) +3 Condition is structurally deficient and improvements are included in the project Improves substandard pavement +6 IRI rating greater than 320: Poor condition and pavement improvements are included in the project Improves substandard traffic signal equipment +6 Poor condition — improvements are included in the project Improves transit asset(s) +2 Brings transit asset into state of good repair Improves substandard sidewalk(s) +3 Poor condition and sidewalk improvements are included in the project Improves emergency response +1 Project improves an evacuation route, diversion route, or alternate diversion route +1 Project improves an access route to or in proximity to an emergency support location Improves ability to respond to extreme conditions +2 Addresses flooding problem and/or sea level rise and enables facility to function in such a condition +1 Brings facility up to current seismic design standards +1 Addresses critical transportation infrastructure +1 Protects freight network elements +1 Implements hazard mitigation or climate adaptation plans SYSTEM PRESERVATION (29 possible points) International Roughness Index (IRI) CAPACITY MANAGEMENT/MOBILITY: Use existing facility capacity more efficiently and increase healthy transportation options. Improve reliability of transit Reduces transit vehicle delay +3 5 hours or more of daily transit vehicle delay reduced If project scores points above, then it is eligible for additional points below: Improves pedestrian network and ADA accessibility +2 Adds new sidewalk(s) (including shared-use paths) +2 Improves ADA accessibility +1 Closes a gap in the pedestrian network +0 Does not improve pedestrian network Improves bicycle network +3 Adds new physically separated bicycle facility (including shared-use paths) +1 Closes a gap in the bicycle network Improves intermodal accommodations/connections to transit +6 Meets or addresses criteria to a high degree Improves truck movement +3 Meets or addresses criteria to a high degree If project scores points above, then it is eligible for additional points below: Reduces vehicle congestion +6 400 hours or more of daily vehicle delay reduced CAPACITY MANAGEMENT/MOBILITY (29 possible points) Americans with Disabilities Act (ADA) CLEAN AIR/CLEAN COMMUNITIES: Create an environmentally friendly transportation system. Reduce GHGs generated in the Boston region by all transportation modes as outlined in the Global Warming Solutions Act Reduces CO2 +5 1,000 or more annual tons of CO2 reduced Reduces other transportation-related emissions (VOC, NOx, CO) +5 2,000 or more total kilograms of VOC, NOx, CO reduced Addresses environmental impacts +1 Addresses water quality +1 Addresses cultural resources or open space +1 Addresses wetlands or resource areas +1 Addresses wildlife preservation or protected habitats +0 Does not meet or address criteria Is in an EOEEA-certified "Green Community" +2 Project is located in a “Green Community” CLEAN AIR/CLEAN COMMUNITIES (16 possible points) Carbon Monoxide (CO) Carbon Dioxide (CO2) Greenhouse Gas (GHG) Nitrogen Oxides (NOx) Volatile Organic Compounds (VOC) Executive Office of Energy and Environmental Affairs (EOEEA) TRANSPORTATION EQUITY: Provide comparable access and service quality among communities, regardless of income level or minority population. Target investments to areas that benefit a high percentage of low-income and minority populations Serves Title VI/non-discrimination populations +2 Serves minority (high concentration) population (> 2,000 people) +2 Serves low-income (high concentration) population (> 2,000 people) +2 Serves limited-English proficiency (high concentration) population (> 1,000 people) +2 Serves elderly (high concentration) population (> 2,000 people) +2 Serves zero-vehicle households (high concentration) population (> 1,000 people) +2 Serves persons with disabilities (high concentration) population (> 1,000 people) +0 Does not serve Title VI or non-discrimination populations TRANSPORTATION EQUITY (12 possible points) ECONOMIC VITALITY: Ensure our transportation network provides a strong foundation for economic vitality. Prioritize transportation investments that serve targeted development sites Serves targeted development site +2 Provides new transit access to or within site Provides for development consistent with the compact growth strategies of MetroFuture +2 Mostly serves an existing area of concentrated development Provides multimodal access to an activity center +1 Provides transit access (within a quarter mile) to an activity center +1 Provides truck access to an activity center +1 Provides bicycle access to an activity center +1 Provides pedestrian access to an activity center +0 Does not provide multimodal access Leverages other investments (non-TIP funding) +3 Meets or addresses criteria to a high degree (>30% of the project cost) ECONOMIC VITALITY (18 possible points) TOTAL SCORE (134 possible points) TABLE A-3 Project Evaluation Results Table A-4 FFYs 2019‐23 Transportation Improvement Program (TIP), Final Project Evaluations and Programming Information TIP ID Municipality Project Name MAPC Subregion MAPC Community Type MassDOT Highway District Estimated Construction Cost Design Status Year of PRC Approval Earliest FFY of Advertising for Construction Contract CTPS Study Location-specific Initial Total Score (out of 134) Revised Total Score (out of 134) SAFETY SYSTEM PRESERVATION CAPACITY MANAGEMENT/MOBILITY CLEAN AIR/CLEAN COMMUNITIES TRANSPORTATION EQUITY ECONOMIC VITALITY Bicycle/Pedestrian 608006 Framingham (MassDOT) Pedestrian Hybrid Beacon Installation at Route 9 and Maynard Rd MWRC RUC 3 $886,228 25% submitted 2014 FFY 21 27 27 12 6 2 2 1 4 Complete Streets 608348 Beverly Rehabilitation of Bridge St NSTF RUC 4 $5,280,000 25% submitted 2016 FFY 20 59 66 13 14 16 9 4 10 608933 Peabody Rehabilitation of Central St NSTF RUC 4 $9,660,000 PRC approved 2017 FFY 23 58 61 21 17 9 3 7 4 608275 Malden Exchange St Downtown Improvement Project ICC IC 4 $1,494,000 PRC approved 2016 FFY 22 57 59 10 10 12 5 10 12 607244 Winthrop Revere St Roadway Improvements ICC IC 6 $3,500,000 PRC approved 2012 FFY 23 46 54 11 14 12 8 4 5 605168 Hingham Summer St/Rockland St Roadway and Streetscape Improvements SSC MS 5 $7,500,000 PRC approved 2009 FFY 22 X CMM 51 52 10 16 16 8 0 2 608045 Milford Rehabilitation on Route 16 (East Main St) from Route 109 to Beaver St SWAP RUC 3 $2,700,000 PRC approved 2014 FFY 23 Safety 49 49 21 8 9 3 3 5 605743 Ipswich Resurfacing and related work on Central and South Main Sts NSTF DS 4 $2,624,154 25% submitted 2009 FFY 22 39 47 11 10 10 6 2 8 602310 Danvers Reconstruction on Collins St NSTF MS 4 $5,183,121 75% approved 1997 FFY 19 46 46 6 12 12 7 2 7 608887 Bellingham South Main St (Route 126) - Douglas Dr to Mechanic St Reconstruction (Route 140) SWAP DS 3 $6,000,000 25% submitted 2017 FFY 23 X 37 45 12 12 12 5 0 4 601704 Newton Reconstruction and signal improvements on Walnut St ICC IC 6 $4,648,360 25% submitted 1996 FFY 20 43 43 11 12 7 4 0 9 606707 Quincy Reconstruction of Sea St ICC RUC 6 $5,626,081 25% submitted 2016 FFY 23 31 40 10 16 7 4 2 1 608007 Cohasset Corridor improvements and related work on Justice Cushing Highway (Route 3A), from Beechwood St to Henry Turner Bailey Rd SSC DS 5 $4,000,200 25% submitted 2014 FFY 22 X CMM 37 37 16 4 8 5 1 3 607899 Dedham Pedestrian improvements along Bussey St TRIC MS 6 $3,902,755 25% submitted 2014 FFY 21 23 35 5 8 5 5 7 5 Intersection Improvements 603739 Wrentham (MassDOT) Construction of I-495/Route 1A ramps SWAP DS 5 $7,554,557 PRC approved 2002 FFY 22 X Safety 55 55 23 11 12 9 0 0 607305 Reading (MassDOT) Intersection signalization at Route 28 and Hopkins St NSPC MS 4 $1,069,038 25% approved 2012 FFY 19 X 38 38 10 12 5 2 2 7 607249 Sudbury (MassDOT) Intersection improvements at Route 20 and Landham Rd MAGIC MS 3 $2,100,000 100% submitted 2013 FFY 20 X 36 36 14 7 4 5 1 5 608443 Littleton, Ayer (MassDOT) Intersection improvements on Route 2A at Willow Rd and Bruce St MAGIC DS 3 $2,200,000 PRC approved 2016 FFY 23 36 36 17 4 9 4 1 1 604231 Marlborough Intersection and signal improvements on Route 20 (East Main Street/Boston Post Rd) at Concord Rd MWRC RUC 3 $2,500,000 PRC approved 2007 FFY 21 X Safety 34 34 7 6 6 7 3 5 Major Infrastructure 605313 Natick (MassDOT) Bridge replacement, Route 27 (North Main St) over Route 9 (Worcester St) MWRC MS 3 $25,793,370 25% submitted 2011 LRTP 2021-25 Safety, CMM 58 58 20 19 10 2 1 6 607981 Somerville McGrath Boulevard Project ICC IC 4 $82,500,000 PRC approved No Date LRTP 2026-30 Safety 68 68 13 14 11 8 10 12 608449 Boston Commonwealth Avenue, phases 3 and 4 ICC IC 6 $25,000,000 25% submitted 2016 Not Programmed 66 66 16 12 11 8 8 11 87790 Canton, Westwood (MassDOT) Interchange improvements at I-95/I-93/ University Ave and I-95 widening TRIC MS 6 $189,750,000 25% submitted 2011 Not Programmed CMM 45 45 19 6 14 -1 0 7 601513 Saugus (MassDOT) Interchange reconstruction at Walnut St and Route 1 (phase 2) ICC MS 4 $19,581,123 75% submitted 1995 Not Programmed Safety, CMM 46 46 13 13 9 6 1 4 604638 Peabody (MassDOT) Mainline improvements on Route 128 (phase 2) NSTF RUC 4 $25,082,496 100% submitted 2005 Not Programmed 36 36 12 10 5 3 3 3 Key: BLUE text = newly evaluated project; BOLD text = project is in the LRTP. MAPC subregions: ICC = Inner Core Committee; MAGIC = Minuteman Advisory Group on Interlocal Coordination; MWRC = MetroWest Regional Collaborative; NSPC = North Suburban Planning Council; NSTF = North Shore Task Force; SSC = South Shore Coalition; SWAP = South West Advisory Planning Committee; TRIC = Three Rivers Interlocal Council. MAPC community types: DS = developing suburb; IC = inner core; MS = maturing suburb; RUC = regional urban center. LRTP-identified Need: CMM = Capacity Management and Mobility need included in the list of priority bicycle gaps or priority congested locations; Safety = project is included in the list of top 25 Highway Crash Locations and/or list of locations with multiple safety needs. Other: CTPS = Central Transportation Planning Staff; FFY = federal fiscal year; LRTP = Long-Range Transportation Plan; PRC = MassDOT Project Review Committee. Appendix B Greenhouse Gas Monitoring and Evaluation The Global Warming Solutions Act of 2008 (GWSA) requires statewide reductions in greenhouse gas (GHG) emissions of 25 percent below 1990 levels by the year 2020, and 80 percent below 1990 levels by 2050. As part of the GWSA, the Executive Office of Energy and Environmental Affairs developed the Massachusetts Clean Energy and Climate Plan (CECP), which outlines programs to attain the 25 percent reduction by 2020—including a 7.6 percent reduction to be attributed to the transportation sector. The Commonwealth’s 13 metropolitan planning organizations (MPOs) are integrally involved in helping to achieve GHG emissions reductions mandated under the GWSA. The MPOs work closely with the Massachusetts Department of Transportation (MassDOT) and other involved agencies to develop common transportation goals, policies, and projects that will help to reduce GHG emissions levels statewide, and meet the specific requirements of the GWSA regulation, Global Warming Solutions Act Requirements for the Transportation Sector and the Massachusetts Department of Transportation (310 CMR 60.05). The purpose of this regulation is to assist the Commonwealth in achieving its adopted GHG emissions reduction goals by requiring the following: The Commonwealth’s MPOs are meeting the requirements of this regulation through the transportation goals and policies contained in their 2016 LRTPs, the major projects planned in their LRTPs, and the mix of new transportation projects that are programmed and implemented through their TIPs. The GHG tracking and evaluation processes enable the MPOs and MassDOT to identify the anticipated GHG impacts of the planned and programmed projects, and to use GHG impacts as criteria to prioritize transportation projects. This approach is consistent with the GHG emissions reduction policies that promote healthy transportation modes through prioritizing and programming an appropriate balance of roadway, transit, bicycle, and pedestrian investments, as well as policies that support smart growth development patterns by creating a balanced multi-modal transportation system. MassDOT coordinated with MPOs and regional planning agencies to implement GHG tracking and to evaluate projects during the development of the LRTPs that were adopted in September 2011. This collaboration continued during the development of the LRTPs and amendments adopted in 2016, and for the TIPs produced for federal fiscal years (FFYs) 2016–19, 2017–21, 2018–22, and 2019–23. Working together, MassDOT and the MPOs have attained the following milestones: In addition to monitoring the GHG impacts of projects in the LRTP that will add capacity to the transportation system, it also is important to monitor and evaluate the GHG impacts of all transportation projects that are programmed in the TIP. The TIP includes both the larger, capacity-adding projects from the LRTP and smaller projects, which are not included in the LRTP but that may affect GHG emissions. The principal objective of this tracking is to enable the MPOs to evaluate the expected GHG impacts of different projects and to use this information as criteria to prioritize and program projects in future TIPs. In order to monitor and evaluate the GHG impacts of TIP projects, MassDOT and the MPOs have developed approaches for identifying anticipated GHG emissions impacts of different types of projects. Since carbon dioxide (CO2) is the largest component of GHG emissions overall and is the focus of regulation 310 CMR 60.05, CO2 has been used to measure the GHG emissions impacts of transportation projects in the TIP and LRTP. All TIP projects have been sorted into two categories for analysis: 1) projects with quantified CO2 impacts, and 2) projects with assumed CO2 impacts. Projects with quantified impacts consist of capacity-adding projects from the LRTP and projects from the TIP that underwent a Congestion Mitigation and Air Quality Improvement (CMAQ) program spreadsheet analysis. Projects with assumed impacts are those that would be expected to produce a minor decrease or increase in emissions, and those that would be assumed to have no CO2 impact. Projects with quantified impacts include capacity-adding projects in the LRTP that were analyzed using the Boston Region MPO’s travel demand model set. No independent calculations were done for these projects during the development of the TIP. MassDOT’s Office of Transportation Planning provided spreadsheets that are used to determine projects’ eligibility for funding through the CMAQ program. Typically, MPO staff uses data from projects’ functional design reports, which are prepared at the 25-percent design phase, to conduct these calculations. Staff used these spreadsheets to calculate estimated projections of CO2 for each project, in compliance with GWSA regulations. These estimates are shown in Tables B-1 and B-2. A note of “to be determined” is shown for those projects for which a functional design report was not yet available. As part of the development of the FFYs 2019–23 TIP, analyses were done for the types of projects described below. A summary of steps performed in the analyses is provided. For an intersection reconstruction or signalization project that typically reduces delay and, therefore, idling, the following steps are taken: For a shared-use path that would enable more walking and biking trips and reduce automobile trips, the following steps are taken: For a program that replaces old buses with new buses that reduce emissions or run on cleaner fuel, the following steps are taken: Calculations may be performed on the project types listed below; however, there are no projects of these types in this TIP: Projects with assumed CO2 impacts are those that could produce a minor decrease or increase in emissions, but the change in emissions cannot be calculated with any precision. Examples include a bicycle rack installation, Safe Routes to School project, or transit marketing or customer service improvement. These projects are categorized as producing an assumed nominal increase or decrease in emissions. Projects that do not change the capacity or use of a facility—for example, a resurfacing project that restores a roadway to its previous condition, or a bridge rehabilitation or replacement that restores the bridge to its previous condition—are assumed to have no CO2 impact. More details about these projects, including a description of each project’s anticipated CO2 impacts, are discussed in Chapter 3. The following tables display the GHG impact analyses of projects funded in the Highway Program (Table B-1) and Transit Program (Table B-2). Table B-3 summarizes the GHG impact analyses of highway projects completed in FFY 2018. Table B-4 summarizes the GHG impact analyses of transit projects completed in FFY 2018. A project is considered completed when the construction contract has been awarded or the transit vehicles have been purchased. Table b-1 Greenhouse Gas Regional Highway Project Tracking MassDOT Project Description GHG Analysis Type GHG CO2 Impact (kg/yr) GHG Impact Description 608229 Acton - Intersection and signal improvements at Kelley's Corner Quantified 111,958 Quantified decrease in emissions from Complete Streets project 606223 Acton-Concord - Bruce Freeman Rail Construction (Phase II-B) Quantified 10,315 Quantified decrease in emissions from bicycle and pedestrian infrastructure 607748 Acton - Intersection and signal improvements on Route 2 and Route 111 (Massachusetts Ave) at Piper Rd and Taylor Rd Qualitative 0 Qualitative decrease in emissions 604123 Ashland - Reconstruction on Route 126 (Pond St) from Framingham town line to Holliston town line Quantified 148,097 Quantified decrease in emissions from Complete Streets project 607738 Bedford - Minuteman Bikeway extension from Loomis St to the Concord town line Quantified 21,098 Quantified decrease in emissions from bicycle and pedestrian infrastructure 608887 Bellingham - South Main St (Route 126) - Douglas Dr to Mechanic St reconstruction (Route 140) Quantified 24,363 Quantified decrease in emissions from Complete Streets project 608911 Belmont - Improvements at Wellington Elementary School (SRTS) Qualitative 0 Qualitative decrease in emissions 608347 Beverly - Intersection improvements at 3 locations: Cabot St (Route 1A/97) at Dodge St (Route 1A), County Way, Longmeadow Rd and Scott St, McKay St at Balch St and Veterans Memorial Bridge (Route 1A) at Rantoul, Cabot, Water, and Front Sts Quantified 582,422 Quantified decrease in emissions from traffic operational improvement 608348 Beverly - Rehabilitation of Bridge St Quantified 387,153 Quantified decrease in emissions from Complete Streets project 607888 Boston-Brookline - Multi-use path construction on New Fenway Quantified 54,724 Quantified decrease in emissions from bicycle and pedestrian infrastructure 606453 Boston - Improvements on Boylston St, from Intersection of Brookline Ave and Park Dr to Ipswich St Quantified 1,920,790 Quantified decrease in emissions from Complete Streets project 605789 Boston - Reconstruction of Melnea Cass Boulevard Quantified 2,872,641 Quantified decrease in emissions from Complete Streets project 606226 Boston - Reconstruction of Rutherford Ave, from City Square to Sullivan Square Quantified 0 LRTP project included in the statewide model 609090 Boston-Milton-Quincy - Highway lighting system replacement on Interstate 93, from Neponset Ave to the Braintree split Qualitative 0 No assumed impact/negligible impact on emissions 608755 Boston - Intersection improvements at Morton St and Harvard St Qualitative 0 Qualitative decrease in emissions 607759 Boston - Intersection improvements at the VFW Parkway and Spring St Qualitative 0 Qualitative decrease in emissions 604173 Boston - Bridge replacement, B-16-016, North Washington St Bridge over the Boston Inner Harbor Qualitative 0 No assumed impact/negligible impact on emissions 608614 Boston - Bridge substructure repairs, B-16-179, Austin St over I-93 ramps, MBTA commuter rail and Orange Line Qualitative 0 No assumed impact/negligible impact on emissions 606902 Boston - Bridge Reconstruction/Rehab, B-16-181, West Roxbury Parkway over MBTA Qualitative 0 No assumed impact/negligible impact on emissions 606728 Boston - Bridge replacement, B-16-365, Bowker Overpass over Storrow Drive (eastbound) Qualitative 0 No assumed impact/negligible impact on emissions TBA Boston - Superstructure replacement, B-16-107, Canterbury St over Amtrak/MBTA Qualitative 0 No assumed impact/negligible impact on emissions 608608 Braintree - Highway lighting improvements at Interstate 93 and Route 3 interchange Qualitative 0 No assumed impact/negligible impact on emissions 606316 Brookline - Pedestrian bridge rehabilitation, B-27-016, over MBTA off Carlton St Qualitative 0 Qualitative decrease in emissions 608482 Cambridge-Somerville - Resurfacing and related work on Route 28 Qualitative 0 No assumed impact/negligible impact on emissions 608611 Canton-Milton-Randolph - Replacement and rehabilitation of the highway lighting system at the Route 24 and Interstate 93 interchange Qualitative 0 No assumed impact/negligible impact on emissions 608484 Canton-Milton - Resurfacing and related work on Route 138 Qualitative 0 No assumed impact/negligible impact on emissions 609053 Canton-Dedham-Norwood - Highway lighting improvements at Interstate 93 and Interstate 95/Route 128 Qualitative 0 No assumed impact/negligible impact on emissions 608599 Canton-Sharon-Foxborough-Norwood-Walpole – Storm water improvements along Route 1, Route 1A, and Interstate 95 Qualitative 0 No assumed impact/negligible impact on emissions 608078 Chelsea - Reconstruction on Broadway (Route 107) from City Hall to Revere city line Quantified 93,278 Quantified decrease in emissions from Complete Streets project 608206 Chelsea to Danvers - Guide and traffic sign replacement on a section of US Route 1 Qualitative 0 No assumed impact/negligible impact on emissions 605287 Chelsea - Route 1 Viaduct rehabilitation (southbound/northbound) on C-09-007 and C-09-011 Qualitative 0 No assumed impact/negligible impact on emissions 608007 Cohasset - Corridor improvements and related work on Justice Cushing Highway (Route 3A) from Beechwood St to Henry Turner Bailey Rd Quantified 5,849 Quantified decrease in emissions from Complete Streets project BN1800 Community Transportation Program Quantified TBD TBD 608495 Concord-Lexington-Lincoln - Resurfacing and related work on Route 2A Qualitative 0 No assumed impact/negligible impact on emissions 608378 Danvers-Topsfield-Boxford-Rowley - Interstate maintenance and related work on Interstate 95 Qualitative 0 No assumed impact/negligible impact on emissions 608818 Danvers - Resurfacing and related work on Route 114 Qualitative 0 No assumed impact/negligible impact on emissions 607899 Dedham - Pedestrian improvements along Bussy St Quantified 3,331 Quantified decrease in emissions from bicycle and pedestrian infrastructure 608587 Dedham - Reconstruction and related work on Bridge St (Route 109) Qualitative 0 Qualitative decrease in emissions 607901 Dedham - Pedestrian improvements along Elm St and Rustcraft Rd corridors Quantified 14,046 Quantified decrease in emissions from bicycle and pedestrian infrastructure 608596 Essex - Superstructure replacement, E-11-001 (2TV), Route 133\Main St over Essex River Qualitative 0 No assumed impact/negligible impact on emissions 607652 Everett - Reconstruction of Ferry St, South Ferry St and a portion of Elm St Quantified 435,976 Quantified decrease in emissions from Complete Streets project 608480 Foxborough-Walpole - Resurfacing and related work on Route 1 Qualitative 0 No assumed impact/negligible impact on emissions 608210 Foxborough-Plainville-Wrentham-Franklin – Interstate maintenance resurfacing work on Interstate 495 Qualitative 0 No assumed impact/negligible impact on emissions 608228 Framingham - Reconstruction of Union Ave, from Proctor St to Main St Quantified -217,978 Quantified increase in emissions 608498 Hingham-Weymouth-Braintree - Resurfacing and related work on Route 53 Qualitative 0 No assumed impact/negligible impact on emissions 606501 Holbrook - Reconstruction of Union St (Route 139), from Linfield St to Centre St and Water St Quantified 4,097 Quantified decrease in emissions from Complete Streets project 607428 Hopedale-Milford - Resurfacing and intersection improvements on Route 16 (Main St), from Water St west to approximately 120 feet west of the Milford/Hopedale town line and the intersection of Route 140 Quantified 201,148 Quantified decrease in emissions from Complete Streets project 606043 Hopkinton - Signal and intersection improvements on Route 135 Quantified 1,298,625 Quantified decrease in emissions from Complete Streets project 607977 Hopkinton-Westborough - Reconstruction of Interstate 90/Interstate 495 interchange Quantified 0 LRTP project included in the statewide model 601607 Hull - Reconstruction of Atlantic Ave and related work Quantified 6,586 Quantified decrease in emissions from Complete Streets project 605743 Ipswich - Resurfacing and related work on Central and South Main Sts Quantified 4,356 Quantified decrease in emissions from Complete Streets project 608443 Littleton/Ayer - Intersection improvements on Route 2A at Willow Rd and Bruce St Quantified 52,102 Quantified decrease in emissions from traffic operational improvement 602077 Lynn - Reconstruction on Route 129 (Lynnfield Street), from Great Woods Road to Wyoma Square Quantified 12,761 Quantified decrease in emissions from Complete Streets project 604952 Lynn-Saugus - Bridge replacement, L-18-016=S-05-008, Route 107 over the Saugus River (AKA – Belden G. Bly Bridge) Qualitative 0 No assumed impact/negligible impact on emissions 607477 Lynnfield- Peabody - Resurfacing and related work on Route 1 Qualitative 0 No assumed impact/negligible impact on emissions 609060 Lynnfield-Peabody-Danvers - Guide and traffic sign replacement on Interstate 95/Route 128 (Task ‘A’ interchange) Qualitative 0 No assumed impact/negligible impact on emissions 608275 Malden - Exchange St downtown improvement project Quantified 13,519 Quantified decrease in emissions from Complete Streets project 608146 Marblehead - Intersection improvements at Pleasant St and Village, Vine, and Cross St Quantified 531 Quantified decrease in emissions from traffic operational improvement 608467 Marlborough - Resurfacing and related work on Route 20 Qualitative 0 No assumed impact/negligible impact on emissions 608566 Marlborough - Improvements at Route 20 (East Main St) at Curtis Ave Qualitative 0 Qualitative decrease in emissions 608637 Maynard - Bridge replacement, M-10-006, carrying Florida Rd over the Assabet River Qualitative 0 No assumed impact/negligible impact on emissions 608835 Medford - Improvements at Brook Elementary School Qualitative 0 Qualitative decrease in emissions 607330 Milton - Deck reconstruction over Southeast Expressway (East Milton Square), includes parking and new landscaped area Qualitative 0 No assumed impact/negligible impact on emissions 607342 Milton - Intersection and signal improvements at Route 28 (Randolph Ave and Chickatawbut Rd Qualitative 0 Qualitative decrease in emissions 605034 Natick - Reconstruction of Route 27 (North Main St), from North Ave to the Wayland town line Quantified 189,410 Quantified decrease in emissions from Complete Streets project 606635 Needham-Newton - Reconstruction of Highland Ave, Needham St and Charles River Bridge, N-04-002, from Webster St (Needham) to Route 9 (Newton) Quantified 1,186,210 Quantified decrease in emissions from Complete Streets project 608866 Newton-Weston - Steel superstructure cleaning (full removal) and painting of 3 bridges: N-12-051, W-29-011, and W-29-028 Qualitative 0 No assumed impact/negligible impact on emissions 608610 Newton - Steel superstructure cleaning (full removal) and painting of N-12-055 Qualitative 0 No assumed impact/negligible impact on emissions 608609 Newton-Westwood - Steel superstructure cleaning (full removal) and painting of 2 bridges: N-12-056 and W-31-006 Qualitative 0 No assumed impact/negligible impact on emissions 605857 Norwood - Intersection improvements at Route 1 and University Avenue/Everett St Quantified 1,092,131 Quantified decrease in emissions from traffic operational improvement 606130 Norwood - Intersection improvements at Route 1A and Upland Rd Quantified 72,964 Quantified decrease in emissions from traffic operational improvement 608052 Norwood - Intersection and signal improvements at Route 1 (Providence Highway) and Morse St Qualitative 0 Qualitative decrease in emissions 608933 Peabody - Rehabilitation of Central St Quantified 150,913 Quantified decrease in emissions from Complete Streets project 609101 Peabody - Pavement preservation and related work on Route 128 Qualitative 0 No assumed impact/negligible impact on emissions 608567 Peabody - Improvements at Route 114 at Sylvan St, Cross St, Northshore Mall, Loris Rd, Route 128 interchange, and Esquire Dr Qualitative 0 Qualitative decrease in emissions 608468 Peabody-Danvers - Resurfacing and related work on Route 1 Qualitative 0 No assumed impact/negligible impact on emissions 609058 Peabody to Gloucester - Guide and traffic sign replacement on Route 128 Qualitative 0 No assumed impact/negligible impact on emissions 608707 Quincy - Reconstruction of Sea St Quantified -30,437 Quantified increase in emissions 608569 Quincy - Intersection improvements at Route 3A (Southern Artery) and Broad St Qualitative 0 Qualitative decrease in emissions 608208 Quincy-Milton-Boston - Interstate maintenance and related work on Interstate 93 Qualitative 0 No assumed impact/negligible impact on emissions 608234 Randolph - Bridge preservation of 2 bridges: R-01-005 and R-01-007 Qualitative 0 No assumed impact/negligible impact on emissions 607305 Reading - Intersection signalization at Route 28 and Hopkins St Quantified 7,088 Quantified decrease in emissions from traffic operational improvement 608219 Reading-Wakefield - Interstate maintenance and related work on Interstate 95 Qualitative 0 No assumed impact/negligible impact on emissions 608205 Reading to Lynnfield - Guide and traffic sign replacement on a section of Interstate 95 Qualitative 0 No assumed impact/negligible impact on emissions 608743 Salem - Improvements at Bates Elementary School Qualitative 0 Qualitative decrease in emissions 608817 Salem-Lynn - Resurfacing and related work on Route 107 Qualitative 0 No assumed impact/negligible impact on emissions 608079 Sharon - Bridge replacement, S-09-003 (40N), Maskwonicut St over Amtrak/MBTA Qualitative 0 No assumed impact/negligible impact on emissions BN1570 Somerville-Medford - Green Line Extension Project - extension to College Ave with the Union Square spur Quantified 0 LRTP project included in the statewide model 608562 Somerville - Signal and intersection improvement on Interstate 93 at Mystic Ave and McGrath Highway (top 200 crash location) Qualitative 0 Qualitative decrease in emissions 608255 Stow - Bridge replacement, S-29-011, Box Mill Rd over Elizabeth Brook Qualitative 0 No assumed impact/negligible impact on emissions 605342 Stow - Bridge replacement, Route 62 (Gleasondale Rd) over the Assabet River Qualitative 0 No assumed impact/negligible impact on emissions 608164 Sudbury - Bike path construction (Bruce Freeman Rail Trail) Quantified 49,903 Quantified decrease in emissions from bicycle and pedestrian infrastructure 607249 Sudbury - Intersection improvements at Route 20 and Landham Rd Quantified 30,150 Quantified decrease in emissions from traffic operational improvement 607761 Swampscott - Intersection and signal improvements at Route 1A (Paradise Rd) at Swampscott Mall Qualitative 0 Qualitative decrease in emissions 608493 Topsfield - Resurfacing and related work on Route 1 Qualitative 0 No assumed impact/negligible impact on emissions 607329 Wakefield-Lynnfield - Rail trail extension, from the Galvin Middle School to Lynnfield/Peabody town line Quantified 158,032 Quantified decrease in emissions from bicycle and pedestrian infrastructure 602261 Walpole - Reconstruction on Route 1A (Main Street), from the Norwood town line to Route 27, includes W-03-024 over the Neponset River Quantified 230,473 Quantified decrease in emissions from Complete Streets project 607777 Watertown - Rehabilitation of Mount Auburn St (Route 16) Quantified 536,769 Quantified decrease in emissions from Complete Streets project 608564 Watertown - Intersection improvements at Route 16 and Galen St Qualitative 0 Qualitative decrease in emissions 609102 Wenham-Manchester-Essex-Gloucester - Pavement preservation and related work on Route 128 Qualitative 0 No assumed impact/negligible impact on emissions 608929 Wilmington - Bridge replacement, W-38-003, Butters Row over MBTA Qualitative 0 No assumed impact/negligible impact on emissions 607327 Wilmington - Bridge replacement, W-38-002, Route 38 (Main St) over the B&M Railroad Qualitative 0 No assumed impact/negligible impact on emissions 608791 Winchester - Improvements at Vinson-Owen Elementary School Qualitative 0 Qualitative decrease in emissions 607244 Winthrop - Revere St Roadway Improvements Quantified 252,816 Quantified decrease in emissions from Complete Streets project 603739 Wrentham - Construction of Interstate 495/Route 1A ramps Quantified 1,233,486 Quantified decrease in emissions from traffic operational improvement 604996 Woburn - Bridge replacement, W-43-017, New Boston St over MBTA Quantified 0 LRTP project included in the statewide model CO2 = carbon dioxide; GHG = greenhouse gas; kg = kilogram; LRTP = Long-Range Transportation Plan; TBD = to be determined; yr = year. Table B-2 Greenhouse Gas Regional Transit Project Tracking Project Description GHG Analysis Type GHG CO2 Impact (kg/yr) GHG Impact Description CATA Rehab/renovate-repave parking lot Qualitative 0 No assumed impact/negligible impact on emissions CATA Acquire - Shop equipment/software maintenance Qualitative 0 No assumed impact/negligible impact on emissions CATA Buy replacement 35-foot buses (2) Quantified 2,720 Quantified decrease in emissions from bus replacement CATA Preventative maintenance Qualitative 0 No assumed impact/negligible impact on emissions MBTA Bridge and Tunnel Program Qualitative 0 No assumed impact/negligible impact on emissions MBTA Green Line Extension Project - Extension to College Ave with the Union Square spur Quantified 0 LRTP project included in the statewide model MBTA Stations and Facilities Qualitative 0 No assumed impact/negligible impact on emissions MBTA Bus Program Qualitative 0 No assumed impact/negligible impact on emissions MBTA Elevator and Escalator Program Qualitative 00 No assumed impact/negligible impact on emissions MBTA Revenue Vehicle Program Qualitative TBD Quantified decrease in emissions from bus replacement MBTA Systems/Signal Upgrade Qualitative 0 No assumed impact/negligible impact on emissions MWRTA Acquisition of Bus Support Equipment/Facilities Qualitative 0 No assumed impact/negligible impact on emissions MWRTA Buy Replacement Capitol Bus (3) Qualitative 5681 Quantified decrease in emissions from bus replacement MWRTA Mobility Management Qualitative 0 No assumed impact/negligible impact on emissions MWRTA Non-Fixed Route ADA Paratransit Services Qualitative 0 No assumed impact/negligible impact on emissions MWRTA Terminal, Intermodal (Transit) Qualitative 0 No assumed impact/negligible impact on emissions ADA = Americans with Disabilities Act; CO2 = carbon dioxide; GHG = greenhouse gas; kg = kilogram; LRTP = Long-Range Transportation Plan; TBD = to be determined; yr = year. Table b-3 Greenhouse Gas Regional Highway “Completed” Project Tracking MassDOT Project Description GHG Analysis Type GHG CO2 Impact (kg/yr) GHG Impact Description FFY of Contract Award 601579 Wayland - Signal and intersection improvements at Route 27 (Main St) and Route 30 (Commonwealth Rd) Quantified 205,105 Quantified decrease in emissions from traffic operational improvement 2016 29492 Bedford-Billerica - Middlesex Turnpike improvements, from Crosby Dr north to Manning Rd, includes reconstruction of B-04-006 (Phase III) Quantified LRTP LRTP project included in the statewide model 2017 604761 Boston - Multi-Use Trail Construction (South Bay Harbor), from Ruggles Station to Fort Point Channel Quantified 767,491 Quantified decrease in emissions from bicycle and pedestrian infrastructure 2017 607309 Hingham- Reconstruction and related work on Derby St, from Pond Park Rd to Cushing St Quantified -113,400 Quantified decrease in emissions from Complete Streets project 2017 604810 Marlborough - Reconstruction of Route 85 (Maple St) Quantified 589,680 Quantified decrease in emissions from Complete Streets project 2017 602165 Stoneham - Signal and intersection improvements at Route 28/North St Quantified 139,709 Quantified decrease in emissions from traffic operational improvement 2017 604935 Woburn - Reconstruction of Montvale Ave, from Interstate 93 interchange to Central St (approximately 1,850 feet) Quantified 98,885 Quantified decrease in emissions from Complete Streets project 2017 605110 Brookline- Intersection and signal improvements at Route 9 and Village Square (Gateway East) Quantified 67,056 Quantified decrease in emissions from Complete Streets project 2018 600518 Hingham - Intersection improvements at Derby St, Whiting St, and Gardner St Quantified -145,683 Quantified increase in emissions 2018 608352 Salem - Canal Street Rail Trail construction (Phase 2) Quantified 6,651 Quantified decrease in emissions from bicycle and pedestrian infrastructure 2018 604989 Southborough - Reconstruction of Main St (Route 30), from Sears Rd to Park St Quantified 231,813 Quantified decrease in emissions from Complete Streets project 2018 CO2 = carbon dioxide; GHG = greenhouse gas; kg = kilogram; LRTP = Long-Range Transportation Plan; yr = year Table B-4 Greenhouse Gas Regional Transit “Completed” Project Tracking Project Description GHG Analysis Type GHG CO2 Impact (kg/yr) GHG Impact Description FFY of Contract Award CATA Bus replacement 30-foot buses (4) Quantified 1,660 Quantified decrease in emissions from bus replacement 2016 CATA Bus replacement - less than 30-foot buses (3) Quantified 10,151 Quantified decrease in emissions from bus replacement 2016 MBTA Revenue Vehicle Program - bus replacement (369) Quantified 1,264,520 Quantified decrease in emissions from bus replacement 2016 MWRTA Bus replacement - less than 30-foot buses (5) Quantified 20,107 Quantified decrease in emissions from bus replacement 2016 CATA Buy replacement 30-foot buses (3) Quantified 1,278 Quantified decrease in emissions from bus replacement 2017 MWRTA Non-fixed route ADA paratransit vehicles (4) Quantified 6,653 Quantified decrease in emissions from bus replacement 2017 CATA Buy replacement 30-foot buses (3) Quantified 60,730 Quantified decrease in emissions from bus replacement 2018 MWRTA Buy replacement - less than 30-foot CNG buses (6) Quantified -125,266 Quantified decrease in emissions from bus replacement 2018 MWRTA Buy Replacement paratransit vehicles (9) Quantified 23,069 Quantified decrease in emissions from bus replacement 2018 ADA = Americans with Disabilities Act; CO2 = carbon dioxide; GHG = greenhouse gas; kg = kilogram; yr = year. Appendix C Public Outreach and Comments In the course of the developing the Transportation Improvement Program (TIP), the Boston Region MPO staff regularly engages with municipalities and the general public to provide information about the milestones, deadlines, and decision points in the development process. (Please see Chapter 2 for details.) Staff publicly shares materials and information used by the MPO board for decision-making via the TIP development web page: www.bostonmpo.org/tip-dev. This process affords the public ongoing opportunities to give input to the MPO board prior to the release the draft TIP for the official public review period. This appendix documents the input received during the development of the FFYs 2019-23 TIP and comments received during the public review period. MPO staff initiated outreach activities for the FFYs 2019–23 TIP in September 2017 and maintained communication with municipal, state agency, and public stakeholders throughout the TIP development process. The primary in-person/direct-engagement events at which staff received input were the subregional committee meetings held by the Metropolitan Area Planning Council (MAPC); the TIP How-To conference call “workshops” with municipal TIP contacts, MAPC subregional coordinators, and MassDOT district project engineers; and the monthly Office Hours with MPO Staff (dedicated times when members of the public may have one-on-one conversations with the MPO staff). These events offered individuals the opportunity to directly engage with staff to ask questions, voice concerns, provide suggestions, and propose projects. The MPO board held a series of discussions at its regular meetings as the TIP development work advanced through stages (project solicitation, project evaluation, and programming of funds). Staff informed the public at each stage via its standard communications channels (email, Twitter, and the website). As a result, the MPO received oral and written comments while developing the draft TIP. The comments directed to the MPO board are summarized below in Table C-1. The MPO board voted to release a draft FFYs 2019-23 TIP document for public review at its April 12, 2018, meeting. This vote initiated an official 30-day public review period, which began on April 18, 2018, and closed on May 18, 2018. The comments received during this public review period and responses from the MPO to the commenters are summarized in Table C-2. TABLE C-1: SUMMARY OF PUBLIC COMMENTS FFYs 2019-23 Transportation Improvement Program (TIP) Development SUPPORT OPPOSE REQUEST COMMENTER(S) COMMENT (SUMMARIZED) RESPONSE Projects being considered for programming in FFYs 2019-23 TIP Intersection Support Municipal: Sudbury Board of Selectman; Melissa Murphy-Rodrigues, Town Manager; Dan Carty, Sudbury Board of Selectmen; Pat Brown, Sudbury Board of Selectmen; Stephen Garvin, Planning Board Chair; Beth Suedmeyer, Sudbury Environmental Planner; Scott Nix, Sudbury Chief of Police; William L. Miles, Sudbury Fire Chief; Dan Nason, Sudbury DPW Director Requests inclusion of the Intersection Improvements at Route 20 and Landham Road project in the FFYs 2019-23 TIP. The intersection is the greatest transportation safety concern for the Town of Sudbury; there have been 170 reported accidents there in the past ten years, including one fatality, and near-collisions daily. The project will improve safety and traffic flow through widening the roadway, introducing turning lanes, and signalization. The project is at 100% design and is anticipated to be ready to advertise in 2019. This project is programmed in FFY 2019 for $1,974,736. Exchange Street Downtown Improvement Project Support Legislative: Senator Jason M. Lewis, Representative Steve Ultrino Requests inclusion of the Exchange Street Downtown Improvement Project in the FFYs 2019-23 TIP. Exchange Street is a top location of pedestrian-involved crashes. New developments, the opening of the casino in Everett, and the reopening of Pleasant Street will increase pedestrian volumes. Existing sidewalks are narrow and not ADA compliant, and the road design encourages high vehicle speeds. The proposed improvements will provide safer bicycle and pedestrian access through the area and to the Malden Center MBTA station. This project is programmed in FFY 2020 for $1,553,760. Rehabilitation and Related Work on Route 126 Support Municipal: Don DiMartino, Director, Bellingham Department of Public Works; Dennis Fraine, Bellingham Town Administrator; Michael Soter, Chair, Bellingham Board of Selectmen; Jim Kupfer, Bellingham Town Planner Requests inclusion of the Rehabilitation and Related Work on Route 126 project in the FFYs 2019-23 TIP. In addition to needed pavement rehabilitation and drainage improvements, the project will improve pedestrian and bicycle connections to Bellingham Middle and High School and Bellingham Center. The project area has incomplete sidewalk facilities and is not safe for pedestrians and bicyclists. The corridor serves residential and commercial development, several churches, and the aforementioned schools. This project is programmed in FFY 2023 for $6,960,000. Construction of Support Municipal: Kevin A. Sweet, Wrentham Town Administrator Requests inclusion of the Construction of I-495/Route 1A Ramps project in the FFYs 2019-23 TIP. The interchange operates well beyond its intended capacity, and perennial congestion has hindered economic development in an area where prime commercial properties exist. The existing ramp intersections and the Wrentham Outlets entrance and exit pose ongoing traffic safety concerns. This project is programmed in FFY 2023 for $11,600,000. Resurfacing and Related Work on Central and South Main Streets Support Municipal: Frank Ventimiglia, Operations Manager, Ipswich Department of Public Works Requests inclusion of the Resurfacing and Related Work on Central and South Main Streets project in the FFYs 2019-23 TIP. Ipswich and Coneco Engineers are updating the 25 percent design to current standards and anticipate a resubmittal by the end of February 2018. The project is a priority for the Town of Ipswich. This project is programmed in FFY 2023 for $3,019,550. Rehabilitation of Central Street Support Municipal: William Paulitz, Peabody City Engineer Requests inclusion of the Rehabilitation of Central Street in the FFYs 2019-23 TIP. The project has the full support of Mayor Edward A. Bettencourt, Jr. and the Peabody City Council. This project is programmed in FFY 2023 for $11,205,600. Rehabilitation of Bridge Street Support Municipal: Mayor Michael Cahill Requests inclusion of the Rehabilitation of Bridge Street project in the FFYs 2019-23 TIP. Bridge Street connects downtown Beverly to the Beverly Depot Commuter Rail Station and communities to the west. Regional housing needs and transit-orient developments planned along the Bass River waterfront underscore the importance of the proposed improvements. This project is programmed in FFY 2023 for $6,124,800. Pedestrian Improvements along Bussey Street Support Municipal: Dedham Board of Selectmen Requests inclusion of the Pedestrian Improvements along Bussey Street project in the FFY 2023 element of the TIP. Bussey Street is a major corridor in East Dedham, heavily used by pedestrians, bicyclists, and motorists. The intersection of Bussey Street at Colburn Street is crossed by many children who walk to school. The proposed project will boost economic development and improve safety, accessibility, and connectivity to nearby amenities. This project is programmed in FFY 2023 for $4,527,196. Intersection Signalization at Route 28 and Hopkins Street Support Organization: NSPC Requests inclusion of the Intersection Signalization at Route 28 and Hopkins Street project in the FFYs 2019-23 TIP. The project will improve traffic operations, vehicular and pedestrian safety, and pedestrian mobility. This project is programmed in FFY 2023 for $1,468,283. Corridor Improvements and Related Work on Justice Cushing Highway Support Organization: SSC MassDOT: Tim Kochan, Highway District 5 Requests inclusion of the Corridor Improvements and Related Work on Justice Cushing Highway (Route 3A) project in the FFYs 2019-23 TIP. The project will improve safety and provide bicycle and pedestrian accommodations. Route 3A is an important regional corridor which warrants more options for safe walking and biking. This project is programmed in FFY 2023 for $4,640,232. Revere Street Roadway Improvements Support Organization: ICC Requests inclusion of the Revere Street Roadway Improvements project in the FFYs 2019-23 TIP. Revere Street handles the majority of traffic flowing into and out of Revere and is the major route by which most students from Winthrop travel to school. This project is programmed in FFY 2023 for $4,060,000. Intersection Improvements on Route 2A at Willow Road and Bruce Street Support Organization: MAGIC Requests inclusion of the Intersection Improvements on Route 2A at Willow Road and Bruce Street project in the FFYs 2019-23 TIP. The project area is a high traffic, high speed intersection which has seen an increase in accidents and traffic over the past five years. The proposed improvements will improve traffic flow and safety, and facilitate commerce. This project is programmed in FFY 2023 for $2,784,000. Reconstruction of Sea Street Support Organization: ICC Requests inclusion of the Reconstruction of Sea Street project in the FFYs 2019-23 TIP. The project will improve bus operations, truck access, bicyclist and pedestrian safety, air quality, and pedestrian access and MBTA access to and from Quincy Center businesses and the Germantown Community Center. This project is programmed in FFY 2023 for $6,526,254. Currently programmed projects (FFYs 2018-22 TIP) Reconstruction of Rutherford Avenue, from City Square to Sullivan Square Support Charlestown residents: Ryan Gavin, Jonathan Weiss Supports continued inclusion of the Reconstruction of Rutherford Avenue project in FFYs 2020-22 of the TIP. The new design provides most of the improvements provided by the surface option, including the buffered green space and linear park, and is supported by the majority of Charlestown residents. The corridor needs immediate improvements and the project should not be delayed. This project is programmed starting in FFY 2020 and is currently planned to be funded over five years, for a total of $152,000,000. Reconstruction of Ferry Street Support Municipal: Jay Monty, Everett Transportation Planner Requests that the Reconstruction of Ferry Street project remain in the FFY 2019 TIP element. The project has been flagged by MassDOT as a candidate for moving into a later TIP element due to schedule concerns regarding right-of-way issues. Many of the construction easements can be obtained through right of entry, and the City and its consultant believe the project will be ready for advertisement in 2019. MassDOT determined that due to extensive right-of-way that has to be acquired, this project would not be ready to be advertised for construction in FFY 2019. This project was moved to FFY 2020 and is programmed for $16,764,338. Bridge Replacement, Route 111 over I-495 Support Municipal: Adam Duchesneau, Boxborough Town Planner Requests that when the project to replace the bridge that carries Route 111 over I-495 begins (currently programmed in FFYs 2020-21), a new sidewalk be included on at least one side, if not both, of the new bridge. The Town of Boxborough is improving pedestrian access throughout the town. Approximately 3,000 feet of sidewalk have been completed along Route 111, and a new grant will add another 2,500 feet; the Town's goal is to have sidewalks along the entire length of Route 111. Your comment will be transmitted to MassDOT and the MPO for their consideration. Reconstruction on Route 1A Support Legislative: Senator Paul F. Feeney; Michael Gallant, Office of Senator Feeney; William Buckley, Office of Rep. John H. Rogers Requests continued inclusion of the Reconstruction of Route 1A project in the FFY 2020 TIP element, rather than reprogramming it in FFY 2021. The safety issues in the corridor are highly important to the region, and the Town of Walpole anticipates submitting the 100 percent design in April 2018. The right-of-way issues will still exist if the project is delayed, and the Town of Walpole believes it will address these issues in a timely manner. MassDOT determined that this project could remain programmed in FFY 2020 for $16,749,233. Reconstruction of Main Street Support Municipal: Jamie Errickson, Director of Natick Community & Economic Development Requests continued inclusion of the Reconstruction of Route 27 project in the FFY 2019 TIP element, rather than reprogramming it in FFY 2020. Right-of-way issues will be addressed in the 75 percent design, which the Town of Natick plans to submit in July 2018. The Town will vote on the necessary easements at the spring 2019 town meeting. The Town has allocated the needed funds for the full design. MassDOT determined that this project could remain programmed in FFY 2019 for $12,081,464. Reconstruction on Route 126 (Pond Street) Support Municipal: Sheila Page, Ashland Town Planner; Michael Herbert, Ashland Town Manager; Yolanda Greaves, Ashland Board of Selectmen; Holliston Board of Selectmen; David R. Williams, Sherborn Town Administrator Supports continued inclusion of the Reconstruction on Route 126 project in the FFY 2020 TIP element. The project area is a vital economic corridor to Ashland, Holliston, Sherborn, and Framingham. Approximately 20,000 vehicles travel the roadway each day, and residents in the region rely on the roadway for daily errands, professional services, and commuting. The current design discourages bicycle and pedestrian travel. The project is essential to the region's economic development, and the proposed improvements will enhance quality of life for all roadway users. This project remains programmed in FFY 2020 for $14,094,251. Intersection and (Acton) Support Municipal: Acton Board of Selectmen; Roland Bartl, Acton Town Planner Organization: MAGIC Supports continued inclusion of the Intersection Improvements at Kelley's Corner project in the FFY 2022 TIP element. The project has become more complex and the projected cost has increased significantly, yet the modified 25 percent design provides safety and capacity advantages over the preliminary plans. Capacity on the Route 111 and Route 27 intersection will improve in both the AM and PM peak hours, and the modified design is more effective in addressing significant safety and capacity problems at the adjacent intersections of Massachusetts Avenue with Charter Road and Community Lane. This project remains programmed in FFY 2022 for $14,718,378. Intersection Improvements at Three Locations Support Municipal: Mayor Michael Cahill; Aaron Clausen, Director of Planning and Community Development Supports continued inclusion of the Intersection Improvements at Three Locations project in the FFY 2021 TIP element, if not sooner. Improved bicycle and pedestrian safety is important to the City; a new middle school will open in August 2018 and will be served by two of the three intersections. WorldTech Engineering believes the project will be ready for advertisement in June 2019. This project was advanced from FFY 2021 to FFY 2019 and is programmed for $4,394,886. Reconstruction of Union Street (Route 139), from Linfield Street to Centre Street / Water Street Support Legislative: Senator John F. Keenan Requests reprogramming the Reconstruction of Union Street project from the FFY 2021 to an earlier TIP element. The project area is a critical connection to the Holbrook/Randolph Commuter Rail Station yet lacks sidewalks. The Town of Holbrook will be ready to advertise the project in FFY 2020, and recently passed a town-wide rezoning bylaw that allows new forms of development along the corridor. MassDOT determined that, based on when this project will be ready to advertise for construction as well as fiscal constraint issues, this project will remain programmed in FFY 2021 for $757,918 (MPO target funds) and $1,527,250 (earmark funding) for a total federal participating cost of $2,285,168. Reconstruction on Route 129 (Lynnfield Street) Support Municipal: Mayor Thomas M. McGee Supports continued inclusion of the Reconstruction of Route 129 project in the FFY 2020 TIP element. The project is important to the community, and the City is advancing the project design in anticipation of advertisement in 2020. This project is programmed in FFY 2020 for $4,579,576. Signal and Intersection Improvements on Route 135 Support Municipal: David Daltorio, Hopkinton Town Engineer Requests continued inclusion of the Signal and Intersection Improvements on Route 135 project in the FFY 2019 TIP element, rather than reprogramming the project in FFY 2020. The Town of Hopkinton anticipates a 75 percent design submission in the summer 2018. The Town of Hopkinton understands the readiness concerns, but is proceeding with the hope of completing milestones for FFY 2019. There are two draft warrants for easements and utility undergrounding funding that will be taken up at the next town meeting. MassDOT determined that, due to extensive right-of-way that has to be acquired, this project would not be ready to be advertised for construction in FFY 2019. This project was moved to FFY 2020 and is programmed for $8,264,619. Projects in the MetroWest Region Support Organization: MWRC Supports continued inclusion of the following projects in the FFYs 2019-23 TIP: All of these projects are programmed in the FFYs 2019-23 TIP. Projects in the SWAP Region Support Organization: SWAP Supports continued inclusion of the following projects in the FFYs 2019-23 TIP: The Signal and Intersection Improvements on Route 135 project in Hopkinton is programmed in FFY 2020 for $8,264,619. Rehabilitation of Mount Auburn Street Support Organization: ICC Supports continued inclusion of the Rehabilitation of Mount Auburn Street project in the FFY 2022 TIP element. This project is programmed in FFY 2022 for $13,701,100. Minuteman Bikeway Extension, from Loomis Street to the Concord Town Line Support Organization: MAGIC Supports continued inclusion of the Minuteman Bikeway Extension project in the FFY 2022 element of the TIP. This project is programmed in FFY 2022 for $6,839,964. Intersection Improvements at Route 1A and Upland Road / Washington Street and Prospect Street / Fulton Street Support Organization: TRIC Supports continued inclusion of the Intersection Improvements at Route 1A and Upland Road / Washington Street and Prospect Street / Fulton Street project in the FFYs 2019-23 TIP, and requests programming the project in the earliest possible TIP element. This project is programmed in FFY 2021 for $3,936,781. Intersection Improvements at Route 1 and University Ave. / Everett St. (Norwood) Support Organization: TRIC Supports continued inclusion of the Intersection Improvements at Route 1A and University Avenue / Everett Street project in the FFYs 2019-23 TIP, and requests programming the project in the earliest possible TIP element. This project is programmed in FFY 2022 for $9,166,410. Bruce Freeman Rail Trail Support Municipal: Melissa Murphy-Rodrigues, Town Manager Supports continued inclusion of the Bruce Freeman Rail Trail (Phase 2D) project in the FFY 2022 TIP element. The project will improve pedestrian facilities, provide bicycle accommodations, and offer healthy transportation options to reduce greenhouse gas emissions. The Town of Sudbury has substantially completed the 25 percent design for MassDOT's review. This project is programmed in FFY 2022 for $9,684,778. Wakefield / Lynnfield Rail Trail Support Organization: Vince Inglese on behalf of the Friends of the Lynnfield Rail Trail Supports continued inclusion of the Wakefield/Lynnfield Rail Trail project in the FFY 2021 TIP element. In 2017, the Town of Lynnfield voted in favor of the Rail Trail warrant article, authorizing the selectmen to take a lease with the MBTA and construct a recreational path on the rail bed. The Friends of the Lynnfield Rail Trail are seeking final design funds from sources outside of the Town budget; if necessary, the balance of what is not raised will be sought via a town meeting vote. This project is programmed in FFY 2021 for $10,316,559. Reconstruction of Melnea Cass Boulevard Oppose Organization: Ken Kruckemeyer, LivableStreets Alliance Requests modification of the project design for the Reconstruction of Melnea Cass Boulevard project (FFY 2019). The separated bicycle facilities included in the current design are difficult to maintain, especially with regard to snow removal. In addition, the facilities are next to the roadway, rather than behind the trees lining the corridor. Mr. Kruckemeyer provided alternative designs, stating they are affordable and more appropriate for the neighborhood. Your comment will be transmitted to MassDOT and the MPO for their consideration. Reconstruction of Melnea Cass Boulevard Oppose Organization: Madeligne Tena, Mandela Residents Cooperative Association; Friends of Melnea Cass Boulevard Opposes the design of the Reconstruction of Melnea Cass Boulevard project (FFY 2019), including the removal of sixty trees and the absence of bus rapid transit lanes. The Boston Transportation Department's public process has been insufficient; important abutters have not been consulted, and the BTD has not communicated with the Friends of Melnea Cass Boulevard since April 2017. Further analysis of the project, including environmental and public health impacts, is needed. Your comment will be transmitted to MassDOT and the MPO for their consideration. Intersection and Signal Oppose Acton resident: Terra Friedrichs Opposes inclusion of the Intersection Improvements at Kelley's Corner project in the FFYs 2019-23 TIP. States the project is project is unnecessary, and the funds could be better spent in communities with higher priority projects. Adds that the project supports a large development and should be funded privately. Your comment will be transmitted to MassDOT and the MPO for their consideration. Intersection and Signal Oppose Organization: Kelley's Corner LLC Opposes the design of the Intersection Improvements at Kelley's Corner project. The proposed design includes the removal of many old growth trees along Massachusetts Avenue, including historic large oak trees; planting new trees in their place will not provide the benefits (shade for pedestrians, CO2 reduction, and aesthetic appeal) of the mature trees. The addition of left-turn lanes will negatively affect pedestrians, as there will be greater crossing distances and higher vehicle speeds. The proposed widening will also reduce on-street parking, adversely affecting local businesses. Your comment will be transmitted to MassDOT and the MPO for their consideration. Reconstruction of Rutherford Avenue, from City Square to Sullivan Square Oppose Organizations: Rutherford Corridor Improvement Coalition, WalkBoston Requests that the Reconstruction of Rutherford Avenue project (FFYs 2020-22) be deferred one year to allow for a more comprehensive examination of possible alternatives. The City of Boston's preferred design proposes to rebuild underpasses on Rutherford Avenue at Austin Street and Sullivan Square. In its most recent design process, the City of Boston did not provide the community with a surface design for its consideration. A viable surface design for Austin Street has been prepared by Professor Peter Furth of Northeastern University, which allows for better traffic movement than the underpass design and provides safer conditions for bicyclists and pedestrians. This design is potentially less costly and has not been analyzed and compared to the underpass design. This project remains programmed starting in FFY 2020. Your comment will be transmitted to MassDOT and the MPO for their consideration. Currently unprogrammed projects Interchange Improvements at I-95/I-93/University Avenue and I-95 Widening Support Municipal: Michael Jaillet, Westwood Town Administrator; Charles Aspinwall, Canton Town Administrator Requests that the MPO and the Commonwealth advance the Interchange Improvements at I-95/I-93/University Avenue and I-95 Widening project. The current project area has constrained economic development in Westwood, Norwood, Canton, and other towns in the region. Notes that lost tax revenue has been a significant burden to Westwood. This project can be reevaluated and considered for inclusion in the MPO's new Long-Range Transportation Plan (LRTP), which will be endorsed by the MPO in FFY 2019. Prior to being programmed in the TIP to receive federal funding, this project would need to be included as a priority in the LRTP. More information about the development of the LRTP is available online: http://www.bostonmpo.org/lrtp-dev. Reconstruction on Route 38 (Main Street) Support Municipal: Jeffrey M. Hull, Wilmington Town Manager Requests inclusion of the Reconstruction of Route 38 project in the FFYs 2019-23 TIP. Route 38 is a regionally important urban arterial, connecting to I-95/Route 128 and Route 129. The corridor is a deteriorating and congested regional bottleneck. The project will improve safety, reduce congestion, and provide from regional economic and transportation benefits. Proposed improvements include accommodations for all roadway users. MPO staff spoke to the town and received a draft functional design report on May 3, 2018. MPO staff will follow up with the Town’s TIP contact during development of the FFYs 2020-24 TIP to see if this project can be evaluated and scored with the MPO's project evaluation criteria and considered for funding by the MPO. Improvements along Commonwealth Avenue, from Alcorn Street to Warren/Kelton Streets Support Organization: ICC Requests inclusion of the Improvements along Commonwealth Avenue project in the FFYs 2019-23 TIP. The proposed improvements, including improved sidewalks and a separated bike lane, will improve safety and comfort for motorists, pedestrians, and bicyclists in a rapidly developing area. This project can be re-evaluated and considered for inclusion in the MPO's new Long-Range Transportation Plan (LRTP), which will be endorsed by the MPO in FFY 2019. Prior to being programmed in the TIP to receive federal funding, this project would need to be included as a priority in the LRTP. More information about the development of the LRTP is available online: http://www.bostonmpo.org/lrtp-dev. Intersection Improvements at Route 3A/Summer Street Rotary Support Municipal: Roger Fernandes, Hingham Town Engineer Requests inclusion of the Intersection Improvements at Route 3A/Summer Street Rotary project in the FFYs 2019-23 TIP. The corridor is heavily impacted by seasonal travel and has safety issues. The project will improve roadway operations, traffic control operations, bicycle and pedestrian safety, and ADA accessibility. The Town of Hingham will run a pilot program through the summer of 2018, which will temporarily change the lane configuration along the corridor prior to submitting the 25 percent design. Notes the project received a high evaluation score. This project is high scoring and MPO staff will continue to coordinate with the Town of Hingham to understand the results of the pilot program. Based on the results of the pilot program, when the design of the proposed project is determined, MPO staff will make sure the project score is up-to-date and will bring this project to the MPO to consider for funding in the FFYs 2020-24 TIP. McGrath Boulevard Project Support Organization: ICC Requests inclusion of the McGrath Boulevard Project in the FFYs 2019-23 TIP. The project will enhance access for multiple travel modes, improve connections along the corridor, and potentially facilitate development in the area. This project is programmed in the MPO's LRTP. In order for it to be programmed in the TIP, this project will need to remain programmed in the next LRTP and project proponents will need to make sure MPO staff has the most up-to-date functional design report or 25 percent design plans. Project proponents should be in contact with MassDOT and MPO staff to understand the full process required to keep this project in the LRTP and to eventually get it programmed in the TIP. Reconstruction and Signal Improvements on Walnut Support Organization: ICC Requests inclusion of the Reconstruction and Signal Improvements on Walnut Street project in the FFYs 2019-23 TIP. The project will improve traffic flow and bicycle and pedestrian safety. The City of Newton communicated to MPO staff that this project is not currently a priority for the City. Members of ICC should coordinate with the City of Newton to advance this project and help ensure that it is considered for funding during future TIP development. Rehabilitation and Related Work on Route 16, from Route 109 to Beaver Street Support Organization: SWAP Requests inclusion of the Rehabilitation and Related Work on Route 16 project in the FFYs 2019-23 TIP. The project will enhance improvements already programmed for 2019 (project #607428) by reconstructing sidewalks, delineating preferred bicycle routes, and improving roadway safety. MassDOT and the MPO realize this is a priority project for the subregion and the Town. This project will be reconsidered for funding during development of the FFYs 2020-24 TIP. Intersection Improvements, Squantum Street at Adams Street Support Organization: ICC Noting that the project has not been identified on the TIP, requests inclusion of the Intersection Improvements at Squantum Street and Adams Street project in any of the upcoming TIP years should a funding gap be identified. The project will install a signal at a busy and dangerous unsignalized intersection. The Town of Milton submitted a project initiation form (PIF) in 2016 and is currently appropriating design funds. The estimated preliminary construction cost is slightly under $1 million. Before this project can be programmed in the TIP with the MPO's share of federal funds, it needs to be evaluated and scored with the MPO's evaluation criteria. Project evaluation typically happens annually around December/January. MPO staff will coordinate with the Town of Milton’s TIP contact around October/November 2018 to understand if this project is ready to be evaluated and considered for funding by the MPO during development of the FFYs 2020-24 TIP. In order to evaluate a project, MPO staff needs the level of information and project data included in a functional design report. Other comments MPO Assistance with Project Design Request Organization: NSPC Requests that the MPO assess how it may help communities find the resources to start the design of priority local projects. Notes that communities put a significant amount of time and money into reaching 25 percent design, and would benefit greatly from any help and resources the MPO can provide. Under the current structure for federal highway funding in Massachusetts, the local project proponent is responsible for funding all stages of project engineering design, environmental permitting, and right-of-way acquisition. MassDOT, through the TIP, completely funds the construction cost, including the federal portion and required local match funding. Your continued input will be considered during development of the FFYs 2020-24 TIP. Underground Utilities Request Sudbury resident: Bill Schineller Requests that transportation projects include burying existing overhead utilities within the project area. States that the majority of long duration power outages are largely due to overhead lines. Your comment was transmitted to MassDOT and the MPO. Undergrounding utilities is not currently a cost that MassDOT covers through the TIP. The MPO encourages you to stay involved in regional transportation planning. ADA = Americans with Disabilities Act. MAPC subregions: ICC = Inner Core Committee; MAGIC = Minuteman Advisory Group on Interlocal Coordination; MWRC = MetroWest Regional Collaborative; NSPC = North Suburban Planning Council; NSTF = North Shore Task Force; SSC = South Shore Coalition; SWAP = South West Advisory Planning Committee; TRIC = Three Rivers Interlocal Council. Table C-2 SUMMARY OF PUBLIC COMMENTS FFYs 2019-23 Transportation Improvement Program (TIP) Public Comment Period REQUEST/ SUPPORT/ OPPOSE COMMENTER(S) COMMENT RESPONSE Regional Transportation Advisory Council Funding Allocation Support Organization: RTAC Supports the MPO's direction to redirect funding from major investments to Complete Streets, intersection improvements, bicycle and pedestrian projects, and community transportation. Notes that major investments comprise 52 percent of overall TIP allocation, short of the 44 percent target. The investment programs and targets for funding established through the current Long-Range Transportation Plan (LRTP), Charting Progress to 2040, are guidelines. These programs and targets will be re-examined by the MPO during development of the next LRTP (to be adopted in FFY 2019). The MPO does commit to priority major infrastructure projects in the LRTP and a desired timeline for when these projects should be programmed in the TIP. The programming of major infrastructure projects in the FFYs 2019-23 TIP reflects the MPO's recommended projects in the current LRTP. Public Comment Period Support Organization: RTAC Supports the 30-day public comment period for the TIP, which allows sufficient time for input from citizen groups that may meet once a month or less frequently. Your comment was transmitted to MassDOT and the MPO. Your continued input will be considered during development of the FFYs 2020-24 TIP. Community Transportation Program Request Organization: RTAC Acknowledging that the Community Transportation Program is still being developed, RTAC requests that a consistent dollar amount for the program be set aside annually to provide stability and predictability for the program when it is fully operational. The annual funding of the Community Transportation Program and the specific projects selected to be programmed in the TIP under this investment program will be deliberated during development of the FFYs 2020-24 TIP. Your continued input will be considered as more details about funding availability and project status are determined by MassDOT and the MPO during FFY 2019. Universe of Projects Development Request Organization: RTAC Requests that the MPO consider whether there may be equity issues associated with the process for selecting the Universe of Projects. Small communities or those that are not affluent may not have the resources to perform the initial design, engineering, and permitting work needed to advance projects. Requests that the MPO consider setting aside resources in addition to the existing technical assistance provided by MAPC and CTPS if this is a barrier to developing beneficial projects. Under the current structure for federal highway funding in Massachusetts, the local project proponent is responsible for funding all stages of project engineering, design, environmental permitting, and right-of-way acquisition. MassDOT, through the TIP, completely funds the construction cost, including the federal portion and required local match funding. Your continued input will be considered during development of the FFYs 2020-24 TIP. Adherence to Complete Streets Principles Request Organization: RTAC Noting that most projects in the TIP adhere to Complete Streets principles, RTAC states that several projects may need clarified descriptions in the TIP Interactive Database or the project design revisited to ensure multimodal accommodations are fully provided: MPO staff is in the process of reviewing and revising both our internal and public online TIP databases. Regionally-Focused Organizations Interchange Improvements at I-95/I-93/University Ave/I-95 Widening Support Organization: Neponset Valley TMA Requests inclusion of the Interchange Improvements at I-95/I-93 in the FFYs 2019-23 TIP. The project is critical to achieve the full economic envisioned with the University Station project in Westwood. Proposed improvements will reduce congestion and address safety issues at the interchange. This project can be re-evaluated and considered for inclusion in the MPO's new LRTP, which will be endorsed by the MPO in FFY 2019. Prior to being programmed in the TIP to receive federal funding, this project would need to be included as a priority in the LRTP. More information about the development of the LRTP is available online: http://www.bostonmpo.org/lrtp-dev. Reconstruction of Route 1A Support Organization: Neponset Valley TMA Supports inclusion of the Reconstruction of Route 1A project in the FFYs 2019-23 TIP. The project will reduce congestion and create improved multimodal infrastructure. Improved intersections and pedestrian facilities will enhance bicyclist and pedestrian safety; safety is particularly important due to several MBTA bus stops within the project area. This project is programmed in FFY 2020 for $16,749,233. Pedestrian Improvements along Bussey Street Support Organization: Neponset Valley TMA Supports inclusion of the Pedestrian Improvements along Bussey Street in the FFYs 2019-23 TIP. Improvements to sidewalk accessibility, bike lanes, and enhancements to the intersections will improve connectivity and safer access in the area. The project will align with the Town of Dedham's revitalization project and will improve economic vitality for the Town. This project is programmed in FFY 2023 for $4,527,196. Project Selection in the 495/MetroWest Region Support Organization: 495/MetroWest Partnership Supports inclusion of 22 projects within the 495/MetroWest Region in the FFYs 2019-23 TIP. Expresses particular support for the slip ramp construction and associated intersection improvements at I-495 and Route 1A (Wrentham) and MWRTA funding, both of which address 495/MetroWest Partnership-defined "transportation nightmares." Appreciates the inclusion of a variety of new projects that traverse several subregions, including projects in Bellingham, Littleton, Sudbury, and Wrentham, that have lingered on the TIP Universe of Unprogrammed Projects. As the comment states, many of these priority projects in the 495/MetroWest Region were able to be programmed in the FFYs 2019-23 TIP. Others will continue to be considered during the development of the FFYs 2020-24 TIP, contingent on project proponents remaining committed to funding and advancing the engineering design and permitting processes. Appendix E Support Organization: 495/MetroWest Partnership Expresses appreciation of the transparency offered in Appendix E of the TIP. Thank you for your comment. Bridge Replacement, B18-002, Route 111 over I-495 Support Organization: 495/MetroWest Partnership Asks why the Route 111 over I-495 Bridge Replacement is not included in the FFYs 2019-23 TIP. Your comment will be transmitted to MassDOT and the MPO for their consideration. Geographic Distribution of Funding Request Organization: 495/MetroWest Partnership Requests that the MAGIC, MetroWest, SWAP, and TRIC subregions receive more than 26 percent of target funding, given that they represent 42 percent of federal-aid roadway miles. The Inner Core has greater resources and staffing, as well as greater access to transit options. Many residents in the 495/MetroWest region use the highway and transit systems to travel to jobs in the Inner Core. The MPO and MPO staff continue to analyze the transportation needs throughout the region as well as the distribution of funding. These issues are considered every year during TIP development. All of the projects that could be funded from these subregions during this TIP cycle were programmed in the TIP with the MPO's share of funding. In order for certain subregions to receive more funding, it is incumbent on the municipality to initiate a project with MassDOT and secure funding for the engineering design and environmental permitting. MPO staff recognizes that this can be a challenge to certain municipalities, and this issue can continue to be considered by the MPO. Economic Impact of Project Delays Request Organization: 495/MetroWest Partnership Requests that the MPO recognize the economic impact of project delays in the 495/MetroWest region. Projects such as the Improvements at I-495 and Route 9 (Southborough and Westborough) and the Reconstruction of I-90/I-495 Interchange (Hopkinton and Westborough) must be addressed to successfully confront congestion, safety, air quality, and sustainable development issues in the region. MassDOT and the MPO appreciate your input and encourage you to continue to be involved in the MPO process. Each year, during TIP development, there are certain project cost changes that result in the need to reprogram some projects to different annual elements of the TIP in order to continue to fund all priority projects throughout the region and the Commonwealth as well as to stay within fiscal constraint. Geographic Distribution of Funding Other Organization: 495/MetroWest Partnership Notes that several communities with projects in the Universe of Unprogrammed Projects are not scheduled to receive funding in the FFYs 2019-23 and have not received any TIP funding as far back as 2008, and possibly longer. The communities include Holliston, Medfield, and Millis. Other communities in the 495/MetroWest region have received no TIP funding from 2008-22 and have no projects ready for consideration. This speaks to the challenge for municipalities to fund project designs, only to have the designs be outdated by the time they would be considered for the TIP. The 495/MetroWest Partnership recommends consideration of state design funding in exchange for partial municipal funding for projects. Under the current structure for federal highway funding in Massachusetts, the local project proponent is responsible for funding all stages of project engineering design, environmental permitting, and right-of-way acquisition. MassDOT, through the TIP, completely funds the construction cost, including the federal portion and required local match funding. Your continued input will be considered during development of the FFYs 2020-24 TIP. Project Selection Support Organization: CrossTown Connect TMA Supports inclusion of 11 projects in the FFYs 2019-23 TIP, stating they will improve infrastructure and access to the region. Due to cost and/or schedule changes to other programmed priority projects as well as changes to federal funding levels, MassDOT annually re-evaluates each of its statewide priority funding programs. In order to stay within fiscal constraint and accomplish all priority projects, this project had to be reprogrammed to a different annual element of the TIP. Bridge Replacement, B18-002, Route 111 over I-495 Oppose Organization: CrossTown Connect TMA Expresses disappointment that the Route 111 over I-495 Bridge Replacement project has been removed from the FFYs 2019-23 TIP. Your comment will be transmitted to MassDOT and the MPO for their consideration. Project Selection Support Organization: A Better City Supports six highway and four transit projects in the FFYs 2019-23 TIP. Your comment was transmitted to MassDOT and the MPO. Project Evaluation Request Organization: A Better City Asks why the Replacement of Allston I-90 Elevated Viaduct project was not evaluated, noting that construction is scheduled to begin in FFY 2022. States that the project should move forward as soon as funds become available, and requests that the evaluation be completed. Your comment was transmitted to MassDOT and the MPO. Universe of Unprogrammed Projects Request Organization: A Better City Requests that Bus Rapid Transit projects, as they develop, and the South Station Expansion Project be added to the Universe of Unprogrammed Projects and considered for future TIP funding. These projects can be considered in future TIPs as they develop. MBTA Funding Support Organization: MBTA Rider Oversight Committee, Capital Investment & Finance Subcommittee Supports inclusion of the Bridge and Tunnel Program, the Stations and Facilities Program, the Signals/System Upgrade Program, and the Bus Program in the FFYs 2019-23 TIP. Your comment was transmitted to MassDOT and the MPO. Performance-Based Planning and Programming Support Organization: MBTA Rider Oversight Committee, Capital Investment & Finance Subcommittee Supports activities for advancing Performance-Based Planning and Programming as described in Chapter Four of the TIP. Your comment was transmitted to MassDOT and the MPO. TIP Appendices Support Organization: MBTA Rider Oversight Committee, Capital Investment & Finance Subcommittee Expresses appreciation of the ability to review the Universe of Unprogrammed Projects provided in Appendix A and the public comments provided in Appendix C. Your comment was transmitted to MassDOT and the MPO. Community Transportation Program Request Organization: MBTA Rider Oversight Committee, Capital Investment & Finance Subcommittee Requests that future TIPs will increase the funding for the Community Transportation Program from the 0.8 percent in the current cycle to the 2 percent recommended by the LRTP. These funding targets will be revisited during development of the next Long-Range Transportation Plan. Please refer to the website for more information about how and when to be involved in that process and make your priorities known to MassDOT and the MPO: http://www.bostonmpo.org/lrtp-dev. Bruce Freeman Rail Trail, Phases 2B and 2D Bruce Freeman Rail Trail Support Legislative: Sen. Jamie Eldridge, Rep. Cory Atkins, Rep. Jennifer E. Benson, Sen. Mike Barrett, Rep. Carmine L. Gentile Supports inclusion of the Bruce Freeman Rail Trail (Phases 2B and 2D) project in the FFYs 2019-23 TIP. The completed project will provide a safe transportation option for bicyclists and pedestrians to travel from Sudbury to Lowell, encourage mode shift, and reduce CO2 emissions. The trail will provide recreational opportunities, increase use of local businesses along the trail, and provide health benefits. Completed portions of the trail have already benefitted the surrounding communities. This project is programmed in FFY 2019 (Phase 2B) for $9,196,638 and FFY 2022 (Phase 2D) for $9,684,778. Bruce Freeman Rail Trail Support Sudbury residents: Vincent Lamenzo, Chris Menge, Lucia Ballantine, Margo Creelman, Jason Viehland, Fred Taylor, Clyde Newton, Chad Trexler, Jan Hardenbergh, Alex Glover, Richard Williamson, Anne McCarthy, Terry McCarthy, John C. Drobinski, Sandy Lasky, Thomas Mead Supports inclusion of the Bruce Freeman Rail Trail (Phases 2B and 2D) project in the FFYs 2019-23 TIP. The completed project will provide a safe transportation option for bicyclists and pedestrians to travel from Sudbury to Lowell, encourage mode shift, and reduce CO2 emissions. The trail will provide recreational opportunities, increase use of local businesses along the trail, and provide health benefits. Completed portions of the trail have already benefitted the surrounding communities. This project is programmed in FFY 2019 (Phase 2B) for $9,196,638 and FFY 2022 (Phase 2D) for $9,684,778. Bruce Freeman Rail Trail Support Arlington residents: Russ Cohen, Tom Michelman, Sharon Green Supports inclusion of the Bruce Freeman Rail Trail (Phases 2B and 2D) project in the FFYs 2019-23 TIP. The completed project will provide a safe transportation option for bicyclists and pedestrians to travel from Sudbury to Lowell, encourage mode shift, and reduce CO2 emissions. The trail will provide recreational opportunities, increase use of local businesses along the trail, and provide health benefits. Completed portions of the trail have already benefitted the surrounding communities. This project is programmed in FFY 2019 (Phase 2B) for $9,196,638 and FFY 2022 (Phase 2D) for $9,684,778. Bruce Freeman Rail Trail Support Acton resident: Jim Snyder Grant Supports inclusion of the Bruce Freeman Rail Trail (Phase 2B) project in the FFYs 2019-23 TIP. Traveling across Route 2 poses safety risks for bicyclists and pedestrians. The project will provide a safe transportation option and provide key connections for local travel and commuting. This project is programmed in FFY 2019 for $9,196,638. Bruce Freeman Rail Trail Support Acton resident: Jim Salem Supports inclusion of the Bruce Freeman Rail Trail (Phase 2D) project in the FFYs 2019-23 TIP. This project is programmed in FFY 2022 for $9,684,778. Intersection and Signal Improvements at Kelley's Corner Intersection and Support Municipal: Acton Board of Selectmen Supports inclusion of the Intersection and Signal Improvements at Kelley's Corner project in the FFY 2022 element of the TIP. The Town of Acton fell three votes short of the required two-thirds majority to bond additional funds for supplemental engineering and appraisal costs needed to advance the project. The Board of Selectmen voted unanimously to continue supporting the project and request that MassDOT move forward with the 25 percent design public hearing. The board unanimously agreed to bring a request to either a Special Town Meeting or the Annual Town Meeting in April 2019 for funding needed to reach 100 percent design and conduct appraisals, and will also bring forward a warrant article authorizing acquisitions and takings subsequent to the appraisals. The board feels confident that this work will be completed in time for construction in FFY 2022. This project is programmed in FFY 2022 for $14,718,378. It will be important to continue to demonstrate to MassDOT and the MPO that this project will be able to be advertised for construction in FFY 2022. Intersection and Request Organization: Green Acton Requests modification to the design of the Intersection Improvements at Kelley's Corner project (FFY 2022). The current 25 percent design will destroy a significant number of large growth trees, increase curb-to-curb distance for pedestrians, and negatively impact local businesses by removing parking. Green Acton proposes a number of solutions to these issues. Your comment was transmitted to MassDOT and the MPO. The MPO encourages you to continue to be involved in regional transportation planning. Intersection and Request Acton residents: Terra Friedrichs, Danny Factor, Dennis G. Caristi, Karen Boulet, Michaela Moran, Eleanor Mathews, Greg Bishop, Claudia Bishop, Joann Witek, Matthew Liebman, Kathryn Acerbo-Bachmann, Todd Bachmann Requests modification to the design of the Intersection Improvements at Kelley's Corner project (FFY 2022). The current 25 percent design will destroy a significant number of large growth trees, as well as increase curb-to-curb distance for pedestrians, particularly where left-turn lanes are planned. The project will also negatively impact local businesses by removing a significant portion of an already minimal parking area. Your comment was transmitted to MassDOT and the MPO. The MPO encourages you to continue to be involved in regional transportation planning. Intersection and Oppose Acton resident: Dave Lunger Opposes inclusion of the Intersection and Signal Improvements at Kelley's Corner project in the FFYs 2019-23 TIP. States that the taking of easements will destroy a viable business (unspecified), and roadway widening will cut down old-growth trees that are vital for shade and town character. Additionally, increased vehicular traffic will create a more dangerous condition for pedestrians. Notes that Acton residents voted against a funding request at the town meeting, and intentions to restructure the funding to require a majority re-vote has increased local opposition to the project. The Town of Acton is leading the development of the engineering design for this project. The design plans are reviewed and approved by MassDOT when they comply with applicable local, state, and federal policies and regulations. In order for this project to remain programmed in the TIP in FFY 2022, the town must take the necessary steps to complete approved 100 percent engineering design plans. Other projects (currently programmed) Reconstruction on Route 126 Support Organization: 495/MetroWest Partnership Supports inclusion of the Reconstruction on Route 126 project in the FFYs 2019-23 TIP. States the project will drive economic development and improve safety conditions. This project is programmed in FFY 2020 for $14,094,252. Minuteman Bikeway Extension Support Organization: CrossTown Connect TMA Supports inclusion of the Minuteman Bikeway Extension project in the FFYs 2019-23 TIP. States the project will promote health and provide new commuting possibilities. This project is programmed in FFY 2022 for $6,839,964. Reconstruction of Melnea Cass Boulevard Oppose Organization: Friends of Melnea Cass Boulevard Opposes the project design for the Reconstruction of Melnea Cass Boulevard (FFY 2019), noting a lack of adequate safety for pedestrians at the Tremont Street intersection. The proposed intersections are overly complex and are unlikely to provide convenience or safety improvements. Snow clearance will require plowing snow into the bike path, and pedestrians will face puddles and snow when crossing the street. Additionally, sixty mature trees will be removed. Your comment will be transmitted to MassDOT and the MPO for their consideration. Community Transportation Program Support Organizations: CrossTown Connect TMA; MBTA Rider Oversight Committee, Capital Investment & Finance Subcommittee Supports inclusion of the Community Transportation Program in the FFYs 2019-23 TIP. The program will be a valuable source of seed funding for suburban and rural mobility initiatives, as well as for creating a better transportation network for some of the most vulnerable populations. MPO staff is currently conducting a research study to determine the most sustainable way to use the MPO's federal funding to address the community transportation and first-and-last mile transit connection needs of municipalities in the region. Staff plans to complete this study in October so that the MPO can establish a process (including the development of evaluation criteria) for funding sustainable community transportation projects with the Community Transportation Program set-aside funding in the TIP. The current plan is to either amend projects into the 2019-23 TIP or select projects for programming during development of the 2020-24 TIP. Green Line Extension Support Organization: MBTA Rider Oversight Committee, Capital Investment & Finance Subcommittee; A Better City Supports inclusion of the Green Line Extension project in the FFYs 2019-23 TIP. This project is programmed in FFYs 2016-2021. The total funding provided by the MPO is $190 million. Additional funding is provided by Section 5309 (transit) as well as local contributions. FFY 2018 is the third year of funding for this project. Reconstruction on Route 129 (Lynnfield Street), from Great Woods Road to Wyoma Square Support Legislative: Senator Brendan P. Crighton Requests reprogramming the Reconstruction on Route 129 project from the FFY 2020 to the FFY 2019 TIP element. Lynnfield Street is a main artery for commuters and commercials vehicles, and daily traffic will further deteriorate the roadway before FFY 2020 causing safety issues before work can begin as currently programmed. This project is currently programmed in FFY 2020 and, based on its progression and readiness for advertisement, MassDOT decided that the appropriate year of programming continues to be FFY 2020. Bridge Replacement, Route 107 over the Saugus River (a.k.a. Belden G. Bly Bridge) Support Legislative: Senator Brendan P. Crighton Requests that the Route 107 over the Saugus River bridge replacement project remain programmed in FFY 2019 and not be reprogrammed to a later year. The project will address critical public safety and access concerns both on the roadway and the waterway. Detours and the construction of the temporary bridge have affected local roads since 2009, and the project was originally scheduled for completion in 2014. This project was programmed for a total cost of $51.5 million over two years, FFYs 2018 and 2019. Due to cost changes on some other bridge projects as well as a $22 million cost increase on this project, and the fiscally constrained nature of the TIP, funding for this project was removed from FFY 2018 and is now spread over five years in the TIP, FFYs 2019-23. Reconstruction of Union Street Support Legislative: Senator John F. Keenan Requests reprogramming the Reconstruction of Union Street project from FFY 2021 to an earlier TIP element. The proposed improvements will greatly improve the connection between the Town of Holbrook's economic center and the commuter rail station. The project will capitalize on existing commuter infrastructure and will improve conditions for pedestrians, bicyclists, transit riders, and motorists. This project is currently programmed in FFY 2021 for $2,285,168. Based on project readiness, MassDOT's Highway Division recommends FFY 2021 as the appropriate year for advertising this project. Earlier years of the TIP are fully programmed. If more funding becomes available in an earlier year of the TIP and MassDOT determines this project could be advertised sooner than FFY 2021, the MPO could consider advancing this project to an earlier TIP year. Exchange Street Downtown Improvement Project Support Municipal: Malden Advisory Committee on Walkability Supports inclusion of the Exchange Street Downtown Improvement Project in the FFYs 2019-23 TIP. Malden Center is in a period of revitalization; numerous development projects have been undertaken, and more are planned in the near future. Exchange Street is a major route through the area, and its deficiencies could hinder revitalization efforts and further investments. Inadequate lighting, deficient sidewalks and crossings, and a lack of bicycle accommodations pose significant safety risks to cyclists and pedestrians; these risks are compounded by a roadway configuration which encourages high vehicular speeds. The proposed improvements will enhance connections for all modes of travel and bolster current and future economic development. This project is programmed in FFY 2020 for $1,553,760. Intersection Improvements to Pleasant Street at Village, Vine, and Cross Streets Support Legislative: Senator Brendan P. Crighton, Representative Lori A. Ehrlich Supports inclusion of the Intersection Improvements to Pleasant Street at Village, Vine, and Cross Streets project in the FFYs 2019-23 TIP. The project will improve public safety and ease traffic congestion. Many students use the intersection to access two nearby middle schools, and a student was killed in the intersection in 2009. This project was programmed for $959,378 in FFY 2022 and MassDOT determined that the project would be ready to advertise for construction in FFY 2021. It was advanced to FFY 2021 and is programmed for a total of $726,570. Improvements at Brooks Elementary School Support Medford resident: Ken Krause Supports inclusion of the Improvements at Brooks Elementary School project in the FFYs 2019-23 TIP. The project will improve mobility, safety, and air quality in a heavily populated, congested, and polluted region. This project is programmed in FFY 2020 for $1,200,000. Intersection Improvements at Route 1A and Upland Road / Washington and Prospect Streets / Fulton Street Support Municipal: Tony Mazzucco, Norwood General Manager Supports inclusion of the Intersection Improvements at Route 1A and Upland Road project in the FFYs 2019-23 TIP. Improvements to sidewalk accessibility, bike lanes, and enhancements to the intersections will improve connectivity and safer access in the area. The project will align with the Town of Dedham's revitalization project and will improve economic vitality for the Town. The Town has leveraged $450,000 from nearby developments to fund the design, and will submit 75 percent design documents in June. The project is the top priority on the TIP for the Town of Norwood. This project is programmed in FFY 2021 for $3,936,781. Intersection Improvements at Route 1A and University Avenue / Everett Street Support Municipal: Tony Mazzucco, orwood General Manager Supports inclusion of the Intersection Improvements at Route 1A and University Avenue / Everett Street project on the TIP. The project will improve capacity and reduce congestion, particularly during peak hours, address the high crash rate, and improve pedestrian facilities. The project is currently at 25 percent design and a Design Public Hearing date is anticipated soon. The project is the Town of Norwood's second priority on the TIP. This project is programmed in FFY 2022 for $9,166,410. Intersection and Signal Improvements at Route 1A (Paradise Road) at Swampscott Mall Support Legislative: Senator Brendan P. Crighton, Representative Lori A. Ehrlich Supports inclusion of the Intersection and Signal Improvements at Route 1A at Swampscott Mall project in the FFYs 2019-23 TIP. The project will have a significant affect on vehicular and pedestrian safety. This project is programmed in FFY 2021 for $2,000,000. Rehabilitation of Mount Auburn Street Support Municipal: Matthew Shuman, Town Engineer Supports inclusion of the Rehabilitation of Mount Auburn Street project in the FFYs 2019-23 TIP. The project area has several safety issues, including a lack of bicycle accommodations and substandard sidewalks. The Coolidge Square segment of the corridor has been identified as a high-crash location. The proposed improvements will transform the corridor from a four-lane arterial into a bicyclist and pedestrian-friendly street. Lane reduction, where feasible, will allow for bicycle lanes and wider sidewalks. Curb extensions at crosswalks will reduce crosswalk lengths and increase visibility. This project is programmed in FFY 2022 for $13,701,100. TIP Process and Documentation Equitable Project Selection Support Acton resident: Franny Osman Supports the MPO's efforts to study and improve equity in project selection. Your comment was transmitted to MassDOT and the MPO. BTD = Boston Transportation Department; CTPS = Central Transportation Planning Staff; LRTP = Long-Range Transportation Plan; MAPC = Metropolitan Area Planning Council; MWRTA = MetroWest Regional Transit Authority; RTAC = Regional Transportation Advisory Council; TMA = Transportation Management Association. MAPC subregions: ICC = Inner Core Committee; MAGIC = Minuteman Advisory Group on Interlocal Coordination; MWRC = MetroWest Regional Collaborative; NSPC = North Suburban Planning Council; NSTF = North Shore Task Force; SSC = South Shore Coalition; SWAP = South West Advisory Planning Committee; TRIC = Three Rivers Interlocal Council. Appendix D Glossary of Acronyms Acronym Definition 3C continuous, comprehensive, cooperative [metropolitan transportation planning process] A&F Administration and Finance Committee ADA Americans with Disabilities Act of 1990 BRT bus rapid transit BTD Boston Transportation Department CA/T Central Artery/Tunnel [project also known as “the Big Dig”] CATA Cape Ann Transportation Authority CECP Massachusetts Clean Energy and Climate Plan CFR Code of Federal Regulations CIP Capital Investment Plan [MassDOT] CMAQ Congestion Mitigation and Air Quality [federal funding program] CMP Congestion Management Process CO carbon monoxide CO2 carbon dioxide CTPS Central Transportation Planning Staff CY calendar year DEIR draft environmental impact report DEP Department of Environmental Protection [Massachusetts] ENF environmental notification form EOEEA Massachusetts Executive Office of Energy and Environmental Affairs EOHED Massachusetts Executive Office of Housing and Economic Development EPA Environmental Protection Agency [federal] EPDO equivalent property damage only [a traffic-related index] FARS Fatality Analysis and Reporting System [FHWA] FAST Act Fixing America’s Surface Transportation Act FDR functional design report FEIR final environmental impact report FFGA full funding grant agreement FFY federal fiscal year FHWA Federal Highway Administration FMCB MBTA Fiscal and Management Control Board FTA Federal Transit Administration GANS grant anticipation notes [municipal bond financing] GHG greenhouse gas GWSA Global Warming Solutions Act of 2008 [Massachusetts] HOV high-occupancy vehicle HSIP Highway Safety Improvement Program [federal funding program] HTC Healthy Transportation Compact ICC Inner Core Committee [MAPC municipal subregion] IPMT Interim Project Management Team [Green Line Extension project] IRI International Roughness Index ITS intelligent transportation systems LEP limited English proficiency LRTP Long-Range Transportation Plan [MPO certification document] MAGIC Minuteman Advisory Group on Interlocal Coordination [MAPC municipal subregion] MAP-21 Moving Ahead for Progress in the 21st Century Act MAPC Metropolitan Area Planning Council MARPA Massachusetts Association of Regional Planning Agencies MassDOT Massachusetts Department of Transportation Massport Massachusetts Port Authority MBTA Massachusetts Bay Transportation Authority MEPA Massachusetts Environmental Policy Act MOVES Motor Vehicle Emissions Simulator [EPA air quality model] MPO metropolitan planning organization [Boston Region MPO] MWRC MetroWest Regional Collaborative [MAPC municipal subregion] MWRTA MetroWest Regional Transit Authority NAAQS National Ambient Air Quality Standards NHFP National Highway Freight Program NHPP National Highway Performance Program NHS National Highway System NOx nitrogen oxides NPMRDS National Performance Measure Research Data Set [FHWA] NSPC North Suburban Planning Council [MAPC municipal subregion] NSTF North Shore Task Force [MAPC municipal subregion] OTP MassDOT Office of Transportation Planning PBPP performance-based planning and programming PEHD peak hours of excessive delay PIF project initiation form [MassDOT] PL metropolitan planning funds [FHWA] or public law funds PMT Program for Mass Transportation [MBTA] PRC Project Review Committee [MassDOT] PSAC Project Selection Advisory Council [MassDOT] RMV Registry of Motor Vehicles [MassDOT division] RTA regional transit authority RTAC Regional Transportation Advisory Council [of the Boston Region MPO] SEIR Single Environmental Impact Report [MEPA] SFY state fiscal year SIP State Implementation Plan SOV single-occupancy vehicle SPR Statewide Planning and Research SRTS Safe Routes to School [federal program] SSC South Shore Coalition [MAPC municipal subregion] STBGP Surface Transportation Block Grant Program [federal funding program; replaced STP] STIP State Transportation Improvement Program STP Surface Transportation Program [federal funding program; replaced by STBGP] SWAP South West Advisory Planning Committee [MAPC municipal subregion] TAM transit asset management TAP Transportation Alternatives Program [federal funding program] TCM transportation control measure TERM Transit Economic Requirements Model [FTA] TIP Transportation Improvement Program [MPO certification document] TRIC Three Rivers Interlocal Council [MAPC municipal subregion] TTI travel time index ULB Useful Life Benchmark UPWP Unified Planning Work Program [MPO certification document] USDOT United States Department of Transportation [oversees FHWA and FTA] UZA urbanized area VMT vehicle-miles traveled VOCs volatile organic compounds [pollutants] VRM vehicle revenue-miles WMM weMove Massachusetts [MassDOT planning initiative] YMM youMove Massachusetts [MassDOT planning initiative] Appendix E Geographic Distribution of TIP Funding Appendix E provides information about the geographic distribution of federal highway funding in the Boston region between federal fiscal years (FFYs) 2018 and 2022, including the distribution of the Boston Region MPO’s Regional Target Program funding (the MPO’s discretionary funding) and funding for projects and programs prioritized by the Massachusetts Department of Transportation. (Following the MPO’s endorsement of this FFYs 2019–23 TIP, this funding analysis will be updated to reflect the distribution of the MPO’s Regional Target Program funding and all federal highway funding programmed from FFY 2019 through FFY 2023.) Funding amounts shown include the state’s matching funds that leverage the federal funds. Table E-1 shows the breakdown of the MPO’s Regional Target Program funding and all federal highway funding for each municipality in the Boston region. Figures E-1 through E-4 summarize this data by subregion and municipality type. The analysis presented here provides details about how the MPO has allocated its federal transportation highway dollars across its geographic region by showing which municipalities and areas of the Boston region have received highway funding for the construction of transportation projects. This data was first compiled for FFYs 2008-13 in response to the Boston Region MPO’s 2014 Certification Review by the Federal Highway Administration and Federal Transit Administration. MPO staff took the following steps to develop the dataset: The data summarized in this appendix could be used in various ways to help guide programming decisions for future TIPs. Some analyses that the MPO could perform in the future include examining TIP funding by municipality and comparing that data to the number of road miles, the Chapter 90 apportionment, and the distribution of needs—as identified in the Needs Assessment of the Long-Range Transportation Plan—for each community. A database that tracks the geographic distribution of TIP funding can serve as an important input into the funding decisions made each year. Along with the data described above, this data on geographic distribution of highway funding can help guide the MPO’s public outreach and decision-making to help ensure that, over time, the transportation needs of the region are met. Figure E-1: Regional Distribution of Target Funding by Subregion (FFYS 2018–22) Inner Core = Inner Core Committee, MAGIC = Minuteman Advisory Group on Interlocal Coordination, MetroWest = MetroWest Regional Collaborative, NSPC = North Shore Planning Council, NSTF = North Shore Task Force, SSC = South Shore Coalition, SWAP = South West Advisory Planning Committee, TRIC = Three Rivers Interlocal Council Figure E-2: Regional Distribution of Target Funding by Municipality Type (FFYs 2018–22) Inner Core = Inner Core Committee, MAGIC = Minuteman Advisory Group on Interlocal Coordination, MetroWest = MetroWest Regional Collaborative, NSPC = North Shore Planning Council, NSTF = North Shore Task Force, SSC = South Shore Coalition, SWAP = South West Advisory Planning Committee, TRIC = Three Rivers Interlocal Council Figure E-3: All federaL HIGHWAY FUNDING in the Boston Region BY SUBREGION (FFYS 2018–22) Inner Core = Inner Core Committee, MAGIC = Minuteman Advisory Group on Interlocal Coordination, MetroWest = MetroWest Regional Collaborative, NSPC = North Shore Planning Council, NSTF = North Shore Task Force, SSC = South Shore Coalition, SWAP = South West Advisory Planning Committee, TRIC = Three Rivers Interlocal Council Figure E-4: All federaL HIGHWAY FUNDING in the Boston region BY mUNICIPALITY TYPE (FFYS 2018–22) Inner Core = Inner Core Committee, MAGIC = Minuteman Advisory Group on Interlocal Coordination, MetroWest = MetroWest Regional Collaborative, NSPC = North Shore Planning Council, NSTF = North Shore Task Force, SSC = South Shore Coalition, SWAP = South West Advisory Planning Committee, TRIC = Three Rivers Interlocal Council Table E-1: federal highway Programming for Municipalities in the Boston Region (FFYs 2018–22) Inner Core = Inner Core Committee, MAGIC = Minuteman Advisory Group on Interlocal Coordination, MetroWest = MetroWest Regional Collaborative, NSPC = North Shore Planning Council, NSTF = North Shore Task Force, SSC = South Shore Coalition, SWAP = South West Advisory Planning Committee, TRIC = Three Rivers Interlocal Council 1 Section 134 of the Federal-Aid Highway Act and Section 5303 of the Federal Transit Act, as amended. 2 The most recent authorization act, Fixing America’s Surface Transportation Act (FAST Act), was signed into law on December 4, 2015. 3 Title 23 Code of Federal Regulations (CFR) 450.324(e). 4 The data for all figures in the Safety Performance section reflects 101 municipalities in the Boston region. In FFY 2018, the total number of municipalities represented by the Boston Region MPO was reduced to 97, with Duxbury, Hanover, Pembroke, and Stoughton transferring to other MPOs. Data analysis for this section began prior to this membership change, and safety data sections in future TIP documents will reflect the change to 97 municipalities. 5 Massachusetts Strategic Highway Safety Plan, 2013, p. 1. See also MassDOT’s 2017 Tracker Annual Performance report, p. 22. 6 For more information, see MassDOT’s Top Crash Locations and Maps page at http://www.massdot.state.ma.us/highway/Departments/TrafficandSafetyEngineering/CrashData/TopCrashLocationsandMaps.aspx. 7 For more information, see MassDOT’s 2014 Top Crash Locations Report, http://www.massdot.state.ma.us/Portals/8/docs/traffic/CrashData/14TopCrashLocationsRpt.pdf, pp. 4-5. 8 This monitoring accounts for approximately 46 percent of the interstate, arterial, and collector roadways (approximately 8,742 lane miles) and approximately 18 percent of all roadways (22,639 lane miles) in the Boston region, according to the Boston Region MPO lane miles listed in the MassDOT’s 2014 Road Inventory Year-End Report. 9 For this analysis, pavement is considered in good condition if its IRI rating is 190 or less, in fair condition if its IRI rating is 190 to 320, and in poor condition if its IRI rating is greater than 320. 10 FTA. Default Useful Life Benchmark Cheat Sheet. October 26, 2016. www.transit.dot.gov/TAM/ULBcheatsheet. 11 FTA. Performance Management. November 15, 2017. www.transit.dot.gov/PerformanceManagement. 12 For more information on FTA’s Transit Asset Management Rule and the MPO’s SFY 2018 TAM targets, see the MPO staff memorandum titled “Proposed SFY 2018 Transit Asset Management Targets for the Boston Region” (updated April 27, 2018). 13 CATA used useful life criteria as defined in FTA Circular 5010.1E (Award Management Requirements) for ULB values. MWRTA used useful life criteria as defined in MassDOT’s Fully Accessible Vehicle Guide and in FTA Circular 5010.1E for ULB values. The MBTA used FTA default ULB values. 14 A precursor is a chemical compound that reacts with other chemical compounds in the presence of solar radiation to form pollutants. 15 People who identify as minorities are those who identify as Hispanic or Latino/Latina/x and/or a race other than "white." 16 MPO staff identifies transportation equity populations using US Census and American Community Survey data. Staff tabulates Limited English Proficiency for the population ages five and older, and tabulates disability status for the non-institutionalized population. The low-income threshold for the Boston region is set using the region’s median household income, which was $75,654 according to the 2010-14 American Community Survey data. The MPO’s low-income threshold is 60 percent of this value, or $45,392. Transportation Equity Performance
Economic Vitality Performance
Economic Vitality Measures and Targets
MPO Projects Supporting Economic Vitality Performance
Summary: MPO Projects Supporting MPO Goal Areas
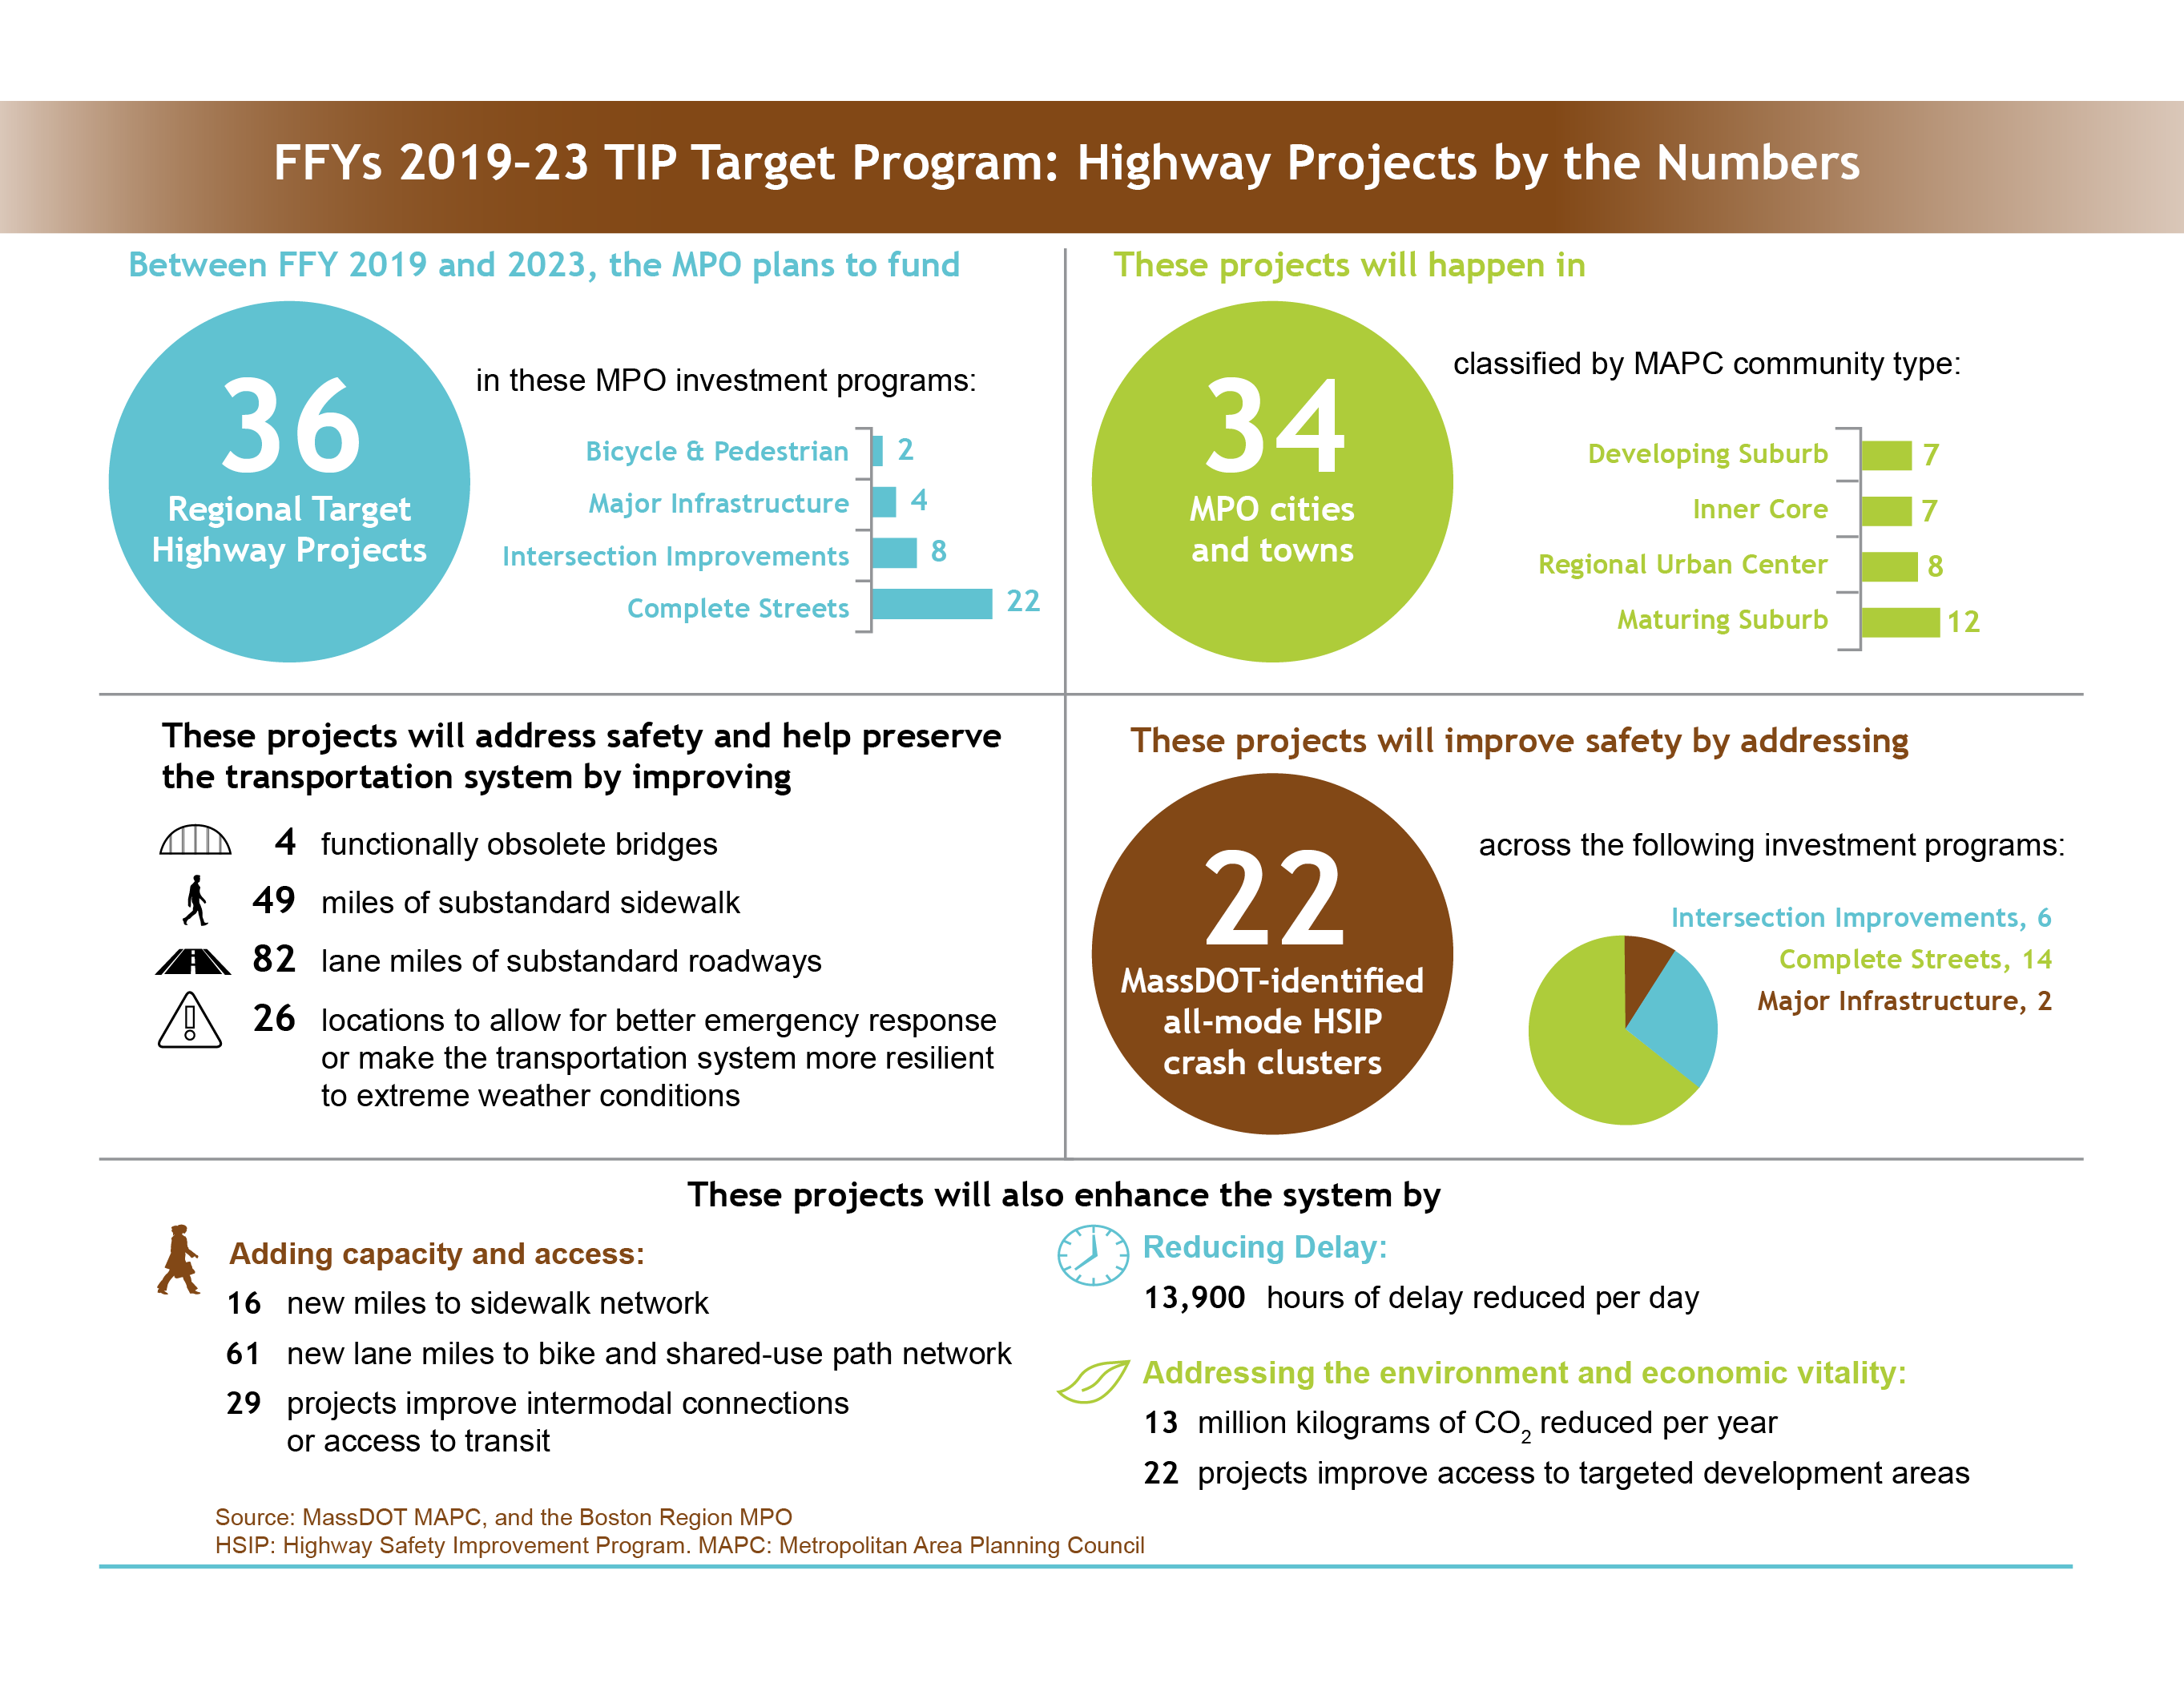
Next Steps for Advancing PBPP
Background
Timely Implementation of Transportation Control Measures
A Status Report of Uncompleted SIP Projects
www.massdot.state.ma.us/planning/Main/PlanningProcess/StateImplementationPlan/SIPTransitCommitmentSubmissions.aspx
Fairmount Line Improvement Project –
SIP Required Completion by December 2011
Green Line Extension to Somerville and Medford Project − SIP Required Completion by December 2014
Russia Wharf Ferry Terminal
Legend (Highlighted Rows)
Priority projects; planned for evaluation in FFY 2018 and consideration for funding in TIP
Priority projects; evaluated in previous years will be reconsidered for funding in the TIP
Other active projects; no information has been provided in order to evaluate in FFY 2018
Projects no longer being considered for TIP funding; these are either deactivated, no longer proponent priorities, or have been accomplished with other funding sources
n/a: Not Applicable; these projects are not programmed in the Long Range Transportation Plan (LRTP) and do not need to be prior to being considered for TIP funding
Municipality
Proponent
Project Name
PROJIS or TIP ID
Design Status
Cost Estimate
(if known at this time)MAPC Subregion
Investment Category
MassDOT Highway District
Evaluation Score
First Tier List 2017
Evaluate in 2018
LRTP Status
Quincy
Quincy
Reconstruction of Sea Street
608707
PRC approved (2016); no FDR on file
$5,626,081
ICC
Complete Streets
6
-
-
Yes
n/a
Winthrop
Winthrop
Reconstruction and related work along Winthrop Street and Revere Street Corridor
607244
PRC approved (2012); no FDR on file
-
ICC
Complete Streets
6
-
-
Yes
n/a
Boston, Brookline
Boston, Brookline
Mountfort Street and Commonwealth Avenue Connection
608956
PRC approved (2017)
$916,883
ICC
Complete Streets
6
-
-
Yes
n/a
Boston
Boston
Improvements along Commonwealth Avenue (Route 30), from Alcorn Street to Warren/Kelton Streets (Phase 3 and Phase 4)
608449
PRC approved (2016)
-
ICC
Major Infrastructure
6
66
Yes
-
not programmed in LRTP
Malden
Malden
Lighting and sidewalk improvements on Exchange Street
608275
PRC approved (2016)
$1,290,586
ICC
Complete Streets
4
59
Yes
-
n/a
Newton
Newton
Reconstruction and signal improvements on Walnut Street, from Homer Street to Route 9
601704
25% design
$4,648,360
ICC
Complete Streets
6
43
Yes
-
n/a
Saugus
MassDOT
Saugus - Interchange reconstruction at Walnut Street and Route 1 (Phase II)
601513
75% design
$19,581,122
ICC
Major Infrastructure
4
46
Yes
-
not programmed in LRTP
Somerville
Somerville
Mcgrath Boulevard Project
607981
PRC approved; no FDR on file
$82,500,000
ICC
Major Infrastructure
4
68
Yes
-
LRTP
2026-30
Boston
Boston
Reconstruction of Tremont Street, from Court Street to Boylston Street
601274
25% design; no FDR on file
$2,681,260
ICC
Complete Streets
6
-
-
-
n/a
Boston
Boston
Reconstruction of Tremont Street, from Stuart Street to Marginal Road (1,830 ft)
601507
PRC approved (1996); no FDR on file
$4,400,000
ICC
Complete Streets
6
-
-
-
n/a
Boston
Boston
Intersection improvements at Gallivan Boulevard (Route 203) and Morton Street
606318
100% design; no FDR on file
-
ICC
Intersection Improvements
6
-
-
-
n/a
Boston
Boston
Grade separated multi-use path construction along the Paul Dudley White Path at North Harvard Street Bridge over Charles River (Anderson Memorial Bridge)
608055
PRC approved (2014); no FDR on file
-
ICC
Bicycle and Pedestrian
6
-
-
-
n/a
Boston
Boston
Replacement of Allston I-90 elevated viaduct, B-16-359, including interchange reconstruction Beacon Park Yard Layover and West Station
606475
PRC approved (2011); no FDR on file
$433,750,000
ICC
Major Infrastructure
6
-
-
-
not programmed in LRTP
Cambridge
Cambridge
Intersectio iImprovements at 7 intersections on Route 28 (Monsignor O'Brien Highway)
604911
25% design; no FDR on file
$13,185,790
ICC
Intersection Improvements
6
-
-
-
n/a
Cambridge
Cambridge
Innovation Boulevard streetscape and pedestrian improvements, between Main Street and Binney Street (Phase I)
604993
25% design; no FDR on file
$992,163
ICC
Complete Streets
6
-
-
-
n/a
Everett, Chelsea
Everett, Chelsea
Reconstruction of Beacham Street
na
Pre-PRC
-
ICC
Complete Streets
4
-
-
-
n/a
Newton
Newton
Reconstruction on Route 30 (Commonwealth Avenue), from Weston town line to Auburn Street
600932
PRC approved (1996); no FDR on file
$2,208,000
ICC
Complete Streets
6
-
-
-
n/a
Newton
Newton
Breakdown lane construction at various locations, from Route 128 to Exit 17
606472
PRC approved (2011); no FDR on file
-
ICC
Major Infrastructure
6
-
-
-
n/a
Newton
Newton
Improvements of Route 128/I-95 and Grove Street
607940
PRC approved (2014); no FDR on file
$10,000,055
ICC
Complete Streets
6
-
-
-
n/a
Newton
Newton
Intersection improvements at Oak Street, Christina Street and Needham Street
608137
100% design; no FDR on file
-
ICC
Intersection Improvements
6
-
-
-
n/a
Revere, Saugus
Revere, Saugus
Reconstruction and widening on Route 1, from Route 60 to Route 99
605012
PRC approved; no FDR on file
$172,500,000
ICC
Major Infrastructure
4
-
-
-
not programmed in LRTP
Woburn
Woburn
Intersection reconstruction at Route 3 (Cambridge Road) and Bedford Road and South Bedford Street
608067
PRC approved (2014); no FDR on file
$1,440,000
ICC
Intersection Improvements
4
-
-
-
n/a
Milton
Milton
Reconstruction on Granite Avenue, from Neponset River to Squantum Street
608406
PRC approved (2015); no FDR on file
$3,665,146
TRIC, ICC
Complete Streets
6
-
-
-
n/a
Needham
Needham
Intersection improvements at Highland Avenue and First Avenue
607889
Final design; no FDR on file
-
TRIC, ICC
Intersection Improvements
6
-
-
-
n/a
Quincy
Quincy
Intersection improvements at Sea Street and Quincy Shore Drive
608013
25% design; FDR on file
$1,853,101
ICC
Intersection Improvements
6
-
-
-
Boston
Boston
Improvements at Audubon Circle
606460
Constructed
-
ICC
Complete Streets
6
78
-
-
Boston
Boston
Reconstruction of South Bank Park
608070
PRC approved (2014); no FDR
-
ICC
Bicycle and Pedestrian
6
-
-
-
Chelsea
Chelsea
Reconstruction on Washington Avenue, from Revere Beach Parkway to Heard Street
605974
PRC approved (2010); no FDR on file
-
ICC
Complete Streets
6
-
-
-
Melrose
Melrose
Intersection and signal improvements at Main Street and Essex Street
601551
PRC approved (1995); no FDR on file
-
ICC
Intersection Improvements
4
-
-
-
Milton
Milton
Rehabilitation of Central Avenue, from Brook Road to Eliot Street
604206
25% design; no FDR on file
-
TRIC, ICC
Complete Streets
6
-
-
-
Littleton, Ayer
MassDOT
Intersection improvements on Route 2A at Willow Road and Bruce Street
608443
PRC approved (2016); no FDR on file
$2,200,000
MAGIC
Intersection Improvements
3
-
-
Yes
n/a
Sudbury
MassDOT
Intersection improvements at Route 20 and Landham Road
607249
75% design
$1,655,050
MAGIC
Intersection Improvements
3
36
Yes
-
n/a
Concord
Concord
Improvements and upgrades to Concord Rotary (Routes 2/2A/119)
602091
25% design; no FDR on file
$103,931,250
MAGIC
Major Infrastructure
4
-
-
-
not programmed in LRTP
Concord
Concord
Reconstruction and widening on Route 2, from Sandy Pond Road to Bridge over MBTA/B&M Railroad
608015
PRC approved (2014); no FDR on file
$8,000,000
MAGIC
Major Infrastructure
4
-
-
-
not programmed in LRTP
Hudson, Marlborough
Hudson, Marlborough
Reconstruction on Routes I-290 and 495 and bridge replacement
603345
PRC approved (2001); no FDR on file
-
MAGIC, MWRC
Major Infrastructure
3
-
-
-
not programmed in LRTP
Bolton
Bolton
Reconstruction of Route 110 (Still River Road)
602252
PRC approved (1997); no FDR on file
-
MAGIC
Complete Streets
3
-
-
-
Bolton
Bolton
Intersection improvements at I-495/Route 117 Interchange
606666
PRC approved (2011); no FDR on file
-
MAGIC
Intersection Improvements
3
-
-
-
Hudson
Hudson
Bridge replacement, Cox Street over the Assabet River
601906
PRC approved (1996); no FDR on file
-
MAGIC
Major Infrastructure
3
-
-
-
Framingham
MassDOT
Pedestrian hybrid beacon installation at Route 9 and Maynard Road
608006
25% design
$886,228
MWRC
Bicycle and Pedestrian
3
27
Yes
-
n/a
Marlborough
MassDOT
Intersection and signal improvements on Route 20 (East Main Street/Boston Post Road) at Concord Road
604231
25% design; FDR on file
$1,706,600
MWRC
Intersection Improvements
3
34
Yes
-
n/a
Natick
MassDOT
Bridge replacement, Route 27 (North Main St) over Route 9 (Worcester St) and interchange improvements
605313
Partial scope programmed in FFYs 2021-22; 25% submitted (2015)
$26,000,000 ($11,800,000 programmed in FFYs 2021-22)
MWRC
Major Infrastructure
3
58
Yes
-
LRTP
2021-25
Ashland
Ashland
Rehabilitation and rail crossing improvements on Cherry Street
608436
PRC approved; no FDR on file
$1,200,000
MWRC
Complete Streets
3
-
-
-
n/a
Framingham
Framingham
Intersection improvements at Route 126/135/MBTA and CSX Railroad
606109
PRC approved (2010); no FDR on file
$115,000,000
MWRC
Major Infrastructure
3
-
-
-
LRTP
2026-30
Framingham
Framingham
Traffic signal installation at Edgell Road at Central Street
608889
PRC approved
$1,440,000
MWRC
Intersection Improvements
3
-
-
-
n/a
Holliston
Holliston
Signal installation at Route 16/126 and Oak Street
602462
25% submitted (1999)
-
MWRC
Intersection Improvements
3
-
-
-
n/a
Holliston
Holliston
Resurfacing and related work on Route 126 (Concord Street)
602154
PRC approved
$600,000
MWRC
Complete Streets
3
-
-
-
n/a
Southborough, Westborough
Southborough, Westborough
Improvements at I-495 and Route 9
607701
PRC approved (2013); no FDR on file
$11,615,000
MWRC
Major Infrastructure
3
-
-
-
n/a
Weston
Weston
Boston Post Road (Route 20) at Wellesley Street intersection improvement project
na
PNF and PIF submitted August 2017
-
MWRC
Intersection Improvements
6
-
-
-
n/a
Framingham
Framingham
Edgell Road corridor project
602038
PRC approved (1996); no FDR on file
-
MWRC
Complete Streets
3
-
-
-
Framingham
Framingham
Signal and intersection improvements at Route 9 (Worcester Road) and Temple Street
603865
PRC approved (2003); no FDR on file
-
MWRC
Intersection Improvements
3
-
-
-
Holliston
Holliston
Multi-use trail construction on a section of the upper Charles Rail (2 miles of proposed 27 miles - Phase I)
602929
75% design; no FDR on file
-
MWRC
Bicycle and Pedestrian
3
-
-
-
Holliston
Holliston
Reconstruction of Norfolk Street, from Sabina Drive to Holly Lane
602155
PRC approved (1997); no FDR on file
-
MWRC
Complete Streets
3
-
-
-
Holliston
Holliston
Reconstruction on Route 16 (Washington Street), from Quail Run to the Sherborn T.L.
605745
PRC approved (2010); no FDR on file
-
MWRC
Complete Streets
3
-
-
-
Marlborough
Marlborough
Reconstruction of Route 20 (East Main Street), from Main Street easterly to Lincoln Street
604811
75% design; FDR on file
-
MWRC
Complete Streets
3
44
-
-
Reading
Reading
Resurfacing and related work on Route 28 (Main Street)
604804
PRC approved (2006); no FDR on file
$5,625,174
NSPC
Complete Streets
4
-
-
Yes
n/a
Reading
MassDOT
Intersection signalization at Route 28 and Hopkins Street
607305
25% design
$843,976
NSPC
Intersection Improvements
4
38
Yes
-
n/a
Reading, Stoneham, Wakefield
Reading, Stoneham, Wakefield
Improvements along Route 128/95, from North of Interchange 37 to Interchange 40, including modifications to Interchange 38
608096
PRC approved (2014); no FDR on file
$10,521,261
NSPC
Complete Streets
4
-
-
-
n/a
Reading, Stoneham, Wakefield, Woburn
Reading, Stoneham, Wakefield, Woburn
Interchange Improvements to I-93/I-95
605605
PRC approved (2009); no FDR on file
$276,708,768
NSPC
Major Infrastructure
4
-
-
-
not programmed in LRTP
Wilmington
Wilmington
Reconstruction on Route 38 (Main Street), from Route 62 to the Woburn C.L.
608051
25% design; no FDR on file
-
NSPC
Major Infrastructure
4
-
-
-
n/a
Woburn
Woburn
Middlesex Canal Park improvements, from Alfred Street to School Street (Phase II - Segment 5)
606304
PRC approved (2010); no FDR on file
-
NSPC
Bicycle and Pedestrian
4
-
-
-
n/a
Woburn
Woburn
Bridge replacement and related work, W-43-028, Washington Street over I-95
608097
PRC approved (2014); no FDR on file
-
NSPC
Major Infrastructure
4
-
-
-
n/a
Peabody
Peabody
Rehabilitation of Central Street
608933
PRC approved (2017)
-
NSTF
Complete Streets
4
-
-
Yes
n/a
Beverly
Beverly
Reconstruction of Bridge Street
608348
25% design (2017)
$5,280,000
NSTF
Complete Streets
4
66
Yes
-
n/a
Danvers
Danvers
Reconstruction on Collins Street, from Sylvan Street to Centre and Holten Streets
602310
75% design
$5,183,121
NSTF
Complete Streets
4
46
Yes
-
n/a
Ipswich
Ipswich
Resurfacing and related work on Central and South Main Streets
605743
25% design resubmitted (2018)
$2,624,154
NSTF
Complete Streets
4
47
Yes
-
n/a
Peabody
MassDOT
Mainline improvements on Route 128 (Phase II)
604638
100% design
$24,031,419
NSTF
Major Infrastructure
4
36
Yes
-
not programmed in LRTP
Beverly
Beverly
Interchange reconstruction at Route 128/Exit 19 at Brimbal Avenue (Phase II)
607727
PRC approved (2014); no FDR on file
over $20,000,000
NSTF
Major Infrastructure
4
-
-
-
not programmed in LRTP
Manchester By The Sea
Manchester By The Sea
Pine Street - Central Street (Route 127) to Rockwood Heights Road
na
PNF submitted 12/27/16
-
NSTF
Complete Streets
4
-
-
-
n/a
Salem
Salem
Reconstruction of Bridge Street, from Flint Street to Washington Street
5399
25% design; no FDR on file
$24,810,210
NSTF
Complete Streets
4
-
-
-
not programmed in LRTP
Gloucester
Gloucester
Washington Street and Railroad Avenue
604377
25% design; FDR on file
-
NSTF
Complete Streets
4
49
-
-
Salem
Salem
Boston Street
600986
PRC approved (1994); no FDR on file
-
NSTF
Complete Streets
4
-
-
-
Hingham
Hingham
Improvements on Route 3A from Otis Street/Cole Road including Summer Street and rotary; Rockland Street to George Washington Boulevard
605168
PRC approved (2009); FDR on file
$7,500,001
SSC
Complete Streets
5
-
-
Yes
n/a
Cohasset
MassDOT
Corridor improvements and related work on Justice Cushing Highway (Route 3A), from Beechwood Street to the Scituate town line
608007
25% design
-
SSC
Complete Streets
5
37
Yes
-
n/a
Hingham
Hingham
Intersection improvements on Route 3A at Kilby Street
603137
PRC approved (2000); no FDR on file
$250,000
SSC
Intersection Improvements
5
-
-
-
n/a
Holbrook
Holbrook
Corridor improvements on South Franklin Street (Route 37) from Snell Street to King Road
na
PNF submitted 6/30/16
-
SSC
Complete Streets
5
-
-
-
n/a
Hull
Hull
Corridor improvements along Nantasket Avenue from Moutford Road to A Street
na
PNF submitted 6/30/16
-
SSC
Complete Streets
5
-
-
-
n/a
Weymouth
Weymouth
Reconstruction on Route 3A,including pedestrian and traffic signal improvements
608231
PRC approved
-
SSC
Complete Streets
6
-
-
-
n/a
Duxbury
Duxbury
Signal installation at Route 3 (NB and SB) ramps and Route 3A (Tremont St)
606002
PRC approved (2010); FDR on file
-
SSC
Intersection Improvements
5
33
-
-
Holbrook
Holbrook
Intersection improvements and related work at Weymouth Street, Pine Street and Sycamore Street
607255
25% design
$1,016,543
SSC
Intersection Improvements
5
-
-
-
Weymouth
Weymouth
New roadway connection between Trotter Road and East West Parkway
608092
Final design; no FDR on file
-
SSC
Complete Streets
6
-
-
-
Bellingham
Bellingham
South Main Street (Route 126) - Douglas Drive to Mechanic Street reconstruction (Route 140)
608887
PIF submitted 6/26/17; draft FDR on file
$6,900,000
SWAP
Complete Streets
3
-
-
Yes
n/a
Milford
MassDOT
Rehabilitation on Route 16, from Route 109 to Beaver Street
608045
PRC approved (2014); information to evaluate
$2,700,000
SWAP
Complete Streets
3
-
-
Yes
n/a
Wrentham
MassDOT
Construction of I-495/Route 1A ramps
603739
25% design
$3,056,093
SWAP
Intersection Improvements
5
55
Yes
-
n/a
Bellingham
Bellingham
South Main Street (Route 126) - Elm Street to Douglas Drive reconstruction
na
PNF submitted 3/13/17
-
SWAP
Complete Streets
3
-
-
-
n/a
Bellingham
Bellingham
Ramp construction and relocation, I-495 at Route 126 (Hartford Avenue)
604862
PRC approved (2006); no FDR on file
$13,543,400
SWAP
Major Infrastructure
3
-
-
-
not programmed in LRTP
Bellingham
Bellingham
Improvements at 2 locations: Mechanic Street/Mendon Street (Route 140) and North Main Street/South Main Street (Route 126)
604453
PRC approved (2005)
-
SWAP
Intersection Improvements
3
-
-
-
Franklin
Franklin
Reconstruction of Pleasant Street, from Main Street to Chestnut Street
601359
75% design; FDR on file
-
SWAP
Complete Streets
3
32
-
-
Millis
Millis
Reconstruction of Village Street, from Main Street (Route 109) to the Medway town line
602364
PRC approved (2006); no FDR on file
-
SWAP
Complete Streets
3
-
-
-
Dedham
Dedham
Pedestrian improvements along Bussey Street, including superstructure replacement, D-05-010, Bussey Street over Mother Brook
607899
25% design
$3,902,755
TRIC
Complete Streets
6
35
Yes
-
n/a
Canton, Westwood
Canton, Westwood
Interchange improvements at I-95/I-93/University Avenue/I-95 widening
87790
25% design; information to evaluate
$202,205,993
TRIC
Major Infrastructure
6
-
-
-
not programmed in LRTP
Westwood
Westwood
Route 109 traffic operational improvements
na
PNF submitted September 2017
-
TRIC
Complete Streets
6
-
-
-
n/a
Westwood
Westwood
Reconstruction of Canton Street and Everett Street
608158
PRC approved (2015); no FDR on file
-
TRIC
Complete Streets
6
-
-
-
n/a
Norwood, Westwood
Norwood, Westwood
Intersection improvements at University Avenue and Canton Street
607557
100% design; no FDR on file
-
TRIC
Intersection Improvements
6
-
-
-
n/a
Sharon
Sharon
Signal and intersection improvements on South Main Street
605708
75% design; no FDR on file
-
TRIC
Intersection Improvements
5
-
-
-
n/a
Canton
Canton
Reconstruction on Route 138, from I-93 to Dan Road
603883
PRC approved (2003); no FDR on file
-
TRIC
Complete Streets
6
-
-
-
Medfield
Medfield
Reconstruction of North Street, from Frairy Street to Pine Street
604735
25% design
$2,210,050
TRIC
Complete Streets
3
30
Yes
-
Stoughton
Stoughton
Reconstruction of Turnpike Street
607214
PRC approved (2012); no FDR on file
-
TRIC
Complete Streets
5
-
-
-
Stoughton
Stoughton
Intersection Improvements and related work at Central Street, Canton Street and Tosca Drive
608279
PRC approved (2016); no FDR on file
-
TRIC
Intersection Improvements
5
-
-
-
Walpole
Walpole
Reconstruction of Route 1A, from Common Street to the Norfolk town line
600671
25% design; no FDR on file
-
TRIC
Complete Streets
5
-
-
-
Reduce serious injuries and fatalities from transportation
Protect transportation customers and employees from safety and security threats
(up to 5 points)
+4 EPDO value between 200 and 299
+3 EPDO value between 100 and 199
+2 EPDO value between 50 and 99
+1 EPDO value less than 50
+0 No EPDO value
(up to 5 points)
Evaluation Score Signalized Unsignalized
+5 ≥ 1.69 ≥ 1.36
+4 1.31 - 1.69 1.03 - 1.36
+3 0.70 - 1.31 0.70 - 1.03
+2 0.55 - 0.93 0.37 - 0.70
+1 0.36 - 0.55 0.21 - 0.37
+0 < 0.36 < 0.21
Interstate Principal Arterials-Other
Evaluation Other Freeways Minor Arterials Score Expressways Major-Minor Collectors +5 ≥ 1.81 ≥ 6.45
+4 1.40 - 1.81 5.35 - 6.45
+3 1.00 - 1.40 4.25 - 5.35
+2 0.59 - 1.00 3.15 - 4.25
+1 0.40 - 0.59 2.05 - 3.15
+0 < 0.40 < 2.05
(up to 5 points)
+2 Medium total effectiveness of truck safety countermeasures
+1 Low total effectiveness of truck safety countermeasures
+0 Does not implement truck safety countermeasures
+2 Improves truck safety at HSIP Cluster
(up to 5 points)
+2 Medium total effectiveness of bicycle safety countermeasures
+1 Low total effectiveness of bicycle safety countermeasures
+0 Does not implement bicycle safety countermeasures
+2 Improves bicycle safety at HSIP Bicycle Cluster
+1 Improves bicycle safety at HSIP Cluster
(up to 5 points)
+2 Medium total effectiveness of pedestrian safety countermeasures
+1 Low total effectiveness of pedestrian safety countermeasures
+0 Does not implement pedestrian safety countermeasures
+2 Improves pedestrian safety at HSIP Pedestrian Cluster
+1 Improves pedestrian safety at HSIP Cluster
(up to 5 points)
+3 Significantly improves safety at an at-grade railroad crossing
+1 Improves safety at an at-grade railroad crossing
+0 Does not include a railroad crossing
Improve pavement condition on the MassDOT-monitored roadway system
Maintain and modernize capital assets throughout the system
Maintain and modernize capital assets throughout the system (surface condition of sidewalks)
Prioritize projects that support planned response capability to existing or future extreme conditions (sea level rise, flooding, and other natural and security-related man-made hazards)
Protect freight network elements, such as port facilities, that are vulnerable to climate-change impacts
(up to 3 points)
+1 Condition is functionally obsolete and improvements are included in the project
+0 Does not improve substandard bridge or does not include a bridge
(up to 6 points)
+4 IRI rating between 320 and 191: Fair condition and pavement improvements are included in the project
+0 IRI rating less than 190: Good or better condition
(up to 6 points)
+4 Fair condition — improvements are included in the project
+0 Does not meet or address criteria
(up to 3 points)
+1 Meets an identified need in an Asset Management Plan
+0 Does not meet or address criteria
(up to 3 points)
+2 Fair condition and sidewalk improvements are included in the project
+0 Sidewalk condition is good or better
(up to 2 points)
(up to 6 points)
Implement roadway management and operations strategies, constructing improvements to the bicycle and pedestrian network, and supporting community-based transportation
Create connected network of bicycle and accessible sidewalk facilities (at both regional and neighborhood scale) by expanding existing facilities and closing gaps
Increase automobile and bicycle parking capacity and usage at transit stations
Increase the percentage of population and places of employment within one-quarter mile of transit stations and stops
Increase the percentage of population and employment with access to bicycle facilities
Improve access to and accessibility of transit and active modes
Enhance intermodal connections
Support community-based and private-initiative services and programs to meet last-mile, reverse-commute and other non-traditional transit and transportation needs, including those of the elderly and persons with disabilities
Eliminate bottlenecks on the freight network
(up to 4 points)
+2 1-5 hours of daily transit vehicle delay reduced
+1 Less than one hour of daily transit vehicle delay reduced
+0 Does not reduce transit delay
(up to 5 points)
(up to 4 points)
+2 Adds new buffered bicycle facility
+1 Adds new standard bicycle facility
+0 Does not improve bicycle network
(up to 6 points)
+4 Meets or addresses criteria to a medium degree
+2 Meets or addresses criteria to a low degree
+0 Does not meet or address criteria
(up to 4 points)
+2 Meets or addresses criteria to a medium degree
+1 Meets or addresses criteria to a low degree
+0 Does not meet or address criteria
+1 Addresses MPO-identified bottleneck location
(up to 6 points)
+4 100-400 hours of daily vehicle delay reduced
+2 Less than 100 hours of daily vehicle delay reduced
+0 Does not meet or address criteria
Reduce other transportation-related pollutants
Minimize negative environmental impacts of the transportation system, when possible
Support land-use policies consistent with smart and healthy growth
(up to 5 points)
+4 500-999 annual tons of CO2 reduced
+3 250-499 annual tons of CO2 reduced
+2 100-249 annual tons of CO2 reduced
+1 Less than 100 annual tons of CO2 reduced
0 No impact
-1 Less than 100 annual tons of CO2 increased
-3 250-499 annual tons of CO2 increased
-4 500-999 annual tons of CO2 increased
-5 1,000 or more annual tons of CO2 increased
(up to 5 points)
+4 1,000-1,999 total kilograms of VOC, NOx, CO reduced
+3 500-999 total kilograms of VOC, NOx, CO reduced
+2 250-499 total kilograms of VOC, NOx, CO reduced
+1 Less than 250 total kilograms of VOC, NOx, CO reduced
0 No impact
-1 Less than 250 total kilograms of VOC, NOx, CO increased
-2 250-499 total kilograms of VOC, NOx, CO increased
-3 500-999 total kilograms of VOC, NOx, CO increased
-4 1,000-1,999 total kilograms of VOC, NOx, CO increased
-5 2,000 or more total kilograms of VOC, NOx, CO increased
(up to 4 points)
(up to 2 points)
+0 Project is not located in a "Green Community"
Minimize any burdens associated with MPO-funded projects in low income and minority areas
Break down barriers to participation in MPO-decision making
(up to 12 points)
Regional Thresholds:
- Elderly: 6.7%
- Minority: 28.2%
- People with a disability: 10.0%
- Limited-English proficiency population: 10.6%
- Low-income households: 32.2%
- Zero-vehicle households: 16.1%
+1 Serves minority (low concentration) population (≤ 2,000 people)
+1 Serves low-income (low concentration) population (≤ 2,000 people)
+1 Serves limited-English proficiency (low concentration) population (≤ 1,000 people)
+1 Serves elderly (low concentration) population (≤ 2,000 people)
+1 Serves zero-vehicle households (low concentration) population (≤ 1,000 people)
+1 Serves persons with disabilities (low concentration) population (≤ 1,000 people)
-10 Creates a burden for Title VI or non -discrimination populations
Prioritize transportation investments that support development consistent with the compact growth strategies of MetroFuture
Minimize the burden of housing and transportation costs for residents in the region
(up to 6 points)
+1 Improves transit access to or within site
+1 Provides for bicycle access to or within site
+1 Provides for pedestrian access to or within site
+1 Provides for improved road access to or within site
+0 Does not provide any of the above measures
(up to 5 points)
+1 Partly serves an existing area of concentrated development
+1 Supports local zoning or other regulations that are supportive of smart growth development
+2 Complements other local financial or regulatory support that fosters economic revitalization in a manner
consistent with smart growth development principles
+0 Does not provide any of the above measures
(up to 4 points)
(up to 3 points)
+2 Meets or addresses criteria to a medium degree (10-30% of the project cost)
+1 Meets or addresses criteria to a low degree (<10% of the project cost)
+0 Does not meet or address criteria
TIP ID
Municipality
Project Name
Initial Total Score
(out of 134)Revised Total Score
(out of 134)SAFETY
(30 possible points)Crash Rate
(up to 5 points) Crash Severity Value: EPDO index
(up to 5 points) Improves truck-related safety issue
(up to 5 points) Improves bicycle safety
(up to 5 points) Improves pedestrian safety
(up to 5 points) Improves safety or removes an at-grade railroad crossing
(up to 5 points) SYSTEM PRESERVATION
(29 possible points) Improves substandard roadway bridge(s)
(up to 3 points) Improves substandard pavement
(up to 6 points) Improves substandard traffic signal equipment
(up to 6 points) Improves transit asset(s)
(up to 3 points) Improves substandard sidewalk(s)
(up to 3 points) Improves emergency response
(up to 2 points) Improves ability to respond to extreme conditions
(up to 6 points) CAPACITY MANAGEMENT/MOBILITY
(29 possible points) Reduces transit vehicle delay
(up to 4 points) Improves pedestrian network and ADA accessibility
(up to 5 points) Improves bicycle network
(up to 4 points) Improves intermodal accommodations or connections to transit (up to 6 points)
Improves truck movement
(up to 4 points) Reduces vehicle congestion
(up to 6 points) CLEAN AIR/CLEAN COMMUNITIES
(16 possible points) Reduces CO2
(up to 5 points) Reduces other transportation-related emissions (VOC, Nox, CO) (up to 5 points)
Addresses environmental impacts
(up to 4 points) Located in an EOEEA-certified "Green Community"
(up to 2 points) TRANSPORTATION EQUITY
(12 possible points)
ECONOMIC VITALITY
(18 possible points) Serves targeted development site
(up to 6 points) Provides for development consistent with the compact growth strategies of MetroFuture
(up to 5 points) Provides multimodal access to an activity center
(up to 4 points) Leverages other investments (non-TIP funding)
(up to 3 points)
Bicycle/Pedestrian
608006
Framingham (MassDOT)
Pedestrian Hybrid Beacon Installation at Route 9 and Maynard Road
27
27
12
4
2
0
0
5
1
6
0
0
4
0
0
1
1
2
0
2
0
0
0
0
2
0
0
0
2
1
4
0
2
2
0
Complete Streets
608348
Beverly
Rehabilitation of Bridge Street
59
66
13
2
3
2
3
3
0
14
0
6
4
0
3
1
0
16
1
3
2
4
0
6
9
3
3
1
2
4
10
4
3
3
0
608933
Peabody
Rehabilitation of Central Street
58
61
21
5
5
3
3
5
0
17
0
5
6
0
3
1
2
9
1
2
1
0
1
4
3
2
1
0
0
7
4
0
3
1
0
608275
Malden
Exchange Street Downtown Improvement Project
57
59
10
2
1
0
2
5
0
10
0
6
0
0
3
1
0
12
0
4
2
6
0
0
5
1
1
1
2
10
12
4
3
2
3
607244
Winthrop
Revere Street Roadway Improvements
46
54
11
2
3
1
2
3
0
14
0
6
4
0
3
1
0
12
1
2
2
2
1
4
8
3
3
0
2
4
5
0
3
0
2
605168
Hingham
Summer Street/Rockland Street Roadway and Streetscape Improvements
51
52
10
1
3
0
3
3
0
16
0
4
4
0
3
1
4
16
2
4
3
1
0
6
8
3
2
3
0
0
2
0
0
2
0
608045
Milford
(MassDOT)Rehabilitation on Route 16 (East Main Street) from Route 109 to Beaver Street
49
49
21
5
5
4
3
4
0
8
0
0
4
0
3
1
0
9
1
4
2
0
2
0
3
1
1
1
0
3
5
3
1
1
0
605743
Ipswich
Resurfacing and related work on Central and South Main Streets
39
47
11
3
2
2
2
2
0
10
0
4
0
0
3
1
2
10
0
5
1
4
0
0
6
1
1
4
0
2
8
3
3
2
0
602310
Danvers
Reconstruction on Collins Street
46
46
6
0
1
1
2
2
0
12
0
6
6
0
0
0
0
12
0
4
1
2
1
4
7
2
1
2
2
2
7
3
2
2
0
608887
Bellingham
South Main Street (Route 126) - Douglas Drive to Mechanic Street Reconstruction (Route 140)
37
45
12
3
3
1
2
3
0
12
0
4
4
0
3
1
0
12
1
5
1
2
1
2
5
1
1
3
0
0
4
0
1
2
1
601704
Newton
Reconstruction and signal improvements on Walnut Street
43
43
11
2
4
1
2
2
0
12
0
6
4
0
2
0
0
7
0
0
1
6
0
0
4
-1
1
2
2
0
9
4
2
3
0
608707
Quincy
Reconstruction of Sea Street
31
40
10
2
3
0
2
3
0
16
0
5
6
0
3
2
0
7
0
3
1
2
1
0
4
-1
1
2
2
2
1
0
1
0
0
608007
Cohasset
(MassDOT)Corridor improvements and related work on Justice Cushing Highway (Route 3A), from Beechwood Street to Henry Turner Bailey Road
37
37
16
3
3
3
3
4
0
4
0
0
4
0
0
0
0
8
0
5
1
1
1
0
5
1
1
1
2
1
3
0
1
2
0
607899
Dedham
Pedestrian improvements along Bussey Street
23
35
5
1
1
0
1
2
0
8
1
0
2
0
3
1
1
5
0
2
2
0
1
0
5
1
1
1
2
7
5
0
3
2
0
Intersection Improvements
603739
Wrentham (MassDOT)
Construction of I-495/Route 1A ramps
55
55
23
5
5
5
4
4
0
11
0
4
4
0
3
0
0
12
0
3
1
0
2
6
9
5
4
0
0
0
0
0
0
0
0
607305
Reading (MassDOT)
Intersection signalization at Route 28 and Hopkins Street
38
38
10
5
1
0
0
4
0
12
0
4
4
0
2
1
1
5
0
2
0
0
1
2
2
1
1
0
0
2
7
2
3
2
0
607249
Sudbury (MassDOT)
Intersection improvements at Route 20 and Landham Road
36
36
14
3
2
3
3
3
0
7
0
4
0
0
3
0
0
4
0
0
1
0
1
2
5
1
1
1
2
1
5
3
0
2
0
608443
Littleton, Ayer (MassDOT)
Intersection Improvements on Route 2A at Willow Road and Bruce Street
36
36
17
5
2
3
3
4
0
4
0
4
0
0
0
0
0
9
0
4
1
0
2
2
4
1
1
0
2
1
1
0
1
0
0
604231
Marlborough
(MassDOT)Intersection and signal improvements on Route 20 (East Main Street/Boston Post Road) at Concord Road
34
34
7
4
1
0
0
2
0
6
0
4
0
0
2
0
0
6
1
0
0
0
1
4
7
2
2
1
2
3
5
3
1
1
0
Major Infrastructure
605313
Natick (MassDOT)
Bridge replacement, Route 27 (North Main Street) over Route 9 (Worcester Street)
58
58
20
5
5
3
3
4
0
19
3
6
6
0
3
0
1
10
0
4
1
4
1
0
2
-1
-1
2
2
1
6
0
3
3
0
607981
Somerville
McGrath Boulevard Project
68
68
13
2
3
0
4
4
0
14
0
6
6
0
2
0
0
11
0
0
1
6
0
4
8
3
3
0
2
10
12
4
5
3
0
608449
Boston
Commonwealth Avenue, phases 3 and 4
66
66
16
1
3
0
5
4
3
12
0
4
4
0
2
2
0
11
0
0
4
6
1
0
8
2
3
1
2
8
11
4
4
3
0
87790
Canton, Westwood (MassDOT)
Interchange improvements at I-95/I-93/University Avenue and I-95 widening
45
45
19
1
5
5
4
4
0
6
3
0
0
0
0
0
3
14
0
4
3
4
3
0
-1
-2
-5
4
2
0
7
3
1
3
0
601513
Saugus (MassDOT)
Interchange reconstruction at Walnut Street and Route 1 (phase 2)
46
46
13
4
4
2
3
0
13
0
6
6
0
0
1
0
9
1
4
1
0
1
2
6
1
1
2
2
1
4
0
1
3
0
604638
Peabody (MassDOT)
Mainline improvements on Route 128, phase 2
36
36
12
3
5
4
0
0
0
10
3
6
0
0
0
1
0
5
1
0
0
0
2
2
3
1
1
1
0
3
3
1
1
1
0
LRTP-identified need
(30 possible points)
(29 possible points)
(29 possible points)
(16 possible points)
(12 possible points)
(18 possible points)
(MassDOT)
(MassDOT)
(MassDOT)
Background
Regional Tracking and Evaluating Long-Range Transportation Plans
Tracking and EvaluatiNG The Transportation Improvement Program
Analyzing Projects with Quantified Impacts
Travel Demand Model
Off-Model Methods
Traffic Operational Improvement
Pedestrian and Bicycle Infrastructure
Bus Replacement
Other Types of Projects
Analyzing Projects with Assumed Impacts
Qualitative Decrease or Increase in CO2 Emissions
No CO2 Impact
Overview of Contents
summary of Comments received during TIP development
summary of Comments received during the PUBLIC REVIEW Period
Improvements at Route 20 and Landham Road
(Sudbury)
Organization: MAGIC
Sudbury residents: Ann Bischoff, Renata Aylward, Christine Barrett, Lisa Silverman, Margaret Landry, Bill Schineller, Laura Fisher, Linda Daley, Frances Peters, Regina Letteri, Tricia Conboy, Jennifer O'Keefe, Ellen Gitelman, Margaret Chunias, Colette Reagan, Chris MacKinnon, Janie Dretler
Marlborough resident: Barbara Nahoumi
(Malden)
Municipal: Mayor Gary Christenson; Councillor Ryan O'Malley; Deborah Burke, Malden Redevelopment Authority
Organization: ICC
(Bellingham)
Organization: SWAP
Bellingham resident: Larry Sposato
I-495/Route 1A Ramps
(Wrentham)
Organization: SWAP
MassDOT: Tim Kochan, Highway District 5
(Ipswich)
(Peabody)
(Beverly)
(Dedham)
Organization: TRIC
(Reading)
(Route 3A)
(Cohasset)
(Winthrop)
(Littleton)
(Quincy)
(Boston)
(Everett)
(Boxborough)
This project was removed from the TIP through Amendment Four to the FFYs 2018-22 TIP. Due to cost and/or schedule changes to other programmed priority projects as well as changes to federal funding levels, MassDOT re-evaluates each of its statewide priority funding programs every federal fiscal year. In order to stay within fiscal constraint, this project had to be moved out of the TIP. This project is still being advanced by MassDOT; however, it is now outside of the FFY 2019-23 programming window.
Please remain involved in the design process, which will be conducted by MassDOT. MassDOT will be responsible for the design, engineering, and permitting of this project.
(Main Street)
(Walpole)
Municipal: Jim Johnson, Walpole Town Administrator
Organization: TRIC
(Route 30)
(Natick)
Organization: MAGIC
(Ashland)
Organizations: MWRC, 495/MetroWest Partnership, SVN, Ashland Business Association, 126 Self Storage, The Residence at Valley Farm
Signal
Improvements at
Kelley's Corner,
Route 111, and
Route 27
(Beverly)
Organization: Beverly Crossing
(Holbrook)
Municipal: Tim Gordon, Holbrook Town Administrator; Chris Pellitteri, Holbrook DPW Superintendent
(Lynn)
(Hopkinton)
Cochituate Rail Trail, Phase 2 (Natick and Framingham)
Reconstruction of Main Street (Route 30) (Southborough)
Reconstruction of Route 27 (North Main Street) (Natick)
Reconstruction of Union Avenue (Framingham)
Reconstruction of Route 126 (Pond Street) (Ashland)
Resurfacing and Intersection Improvements on Route 16 (Main Street) (Milford)
Signal and Intersection Improvements on Route 135 (Hopkinton)
MassDOT and the MPO realize that the Resurfacing and Intersection Improvements on Route 16 project in Milford is a priority project for the subregion and the Town. This project will be reconsidered for funding during development of the FFYs 2020-24 TIP.
(Route 16)
(Watertown)
(Bedford)
(Norwood)
(Phase 2D)
Organization: MAGIC
(Wakefield and Lynnfield)
Wakefield resident: Anu Gerweck
(Boston)
Please remain involved in the design process, which is conducted by the City of Boston. The City of Boston is responsible for the design, engineering, permitting, and related public process.
(Boston)
Please remain involved in the design process, which is conducted by the City of Boston. The City of Boston is responsible for the design, engineering, permitting, and related public process.
Improvements at Kelley's Corner, Route 111, and
Route 27
(Acton)
Please remain involved in the design process, which is conducted by the Town of Acton. The Town of Acton is responsible for the design, engineering, permitting, and related public process.
Improvements at Kelley's Corner, Route 111, and
Route 27
(Acton)
Acton residents: Terra Friedrichs, Lee Ketelson, Eleanor Mathews,
Other issues raised include lack of protection for the proposed bicycle lanes and the negative impact of additional signalization.
Please remain involved in the design process, which is conducted by the Town of Acton. The Town of Acton is responsible for the design, engineering, permitting, and related public process.
(Boston)
The Rutherford Corridor Improvement Coalition has collected almost 560 signatures from area residents and businesspersons who seek a solution to the Rutherford corridor that provides the greatest community benefit.
Please remain involved in the design process, which is conducted by the City of Boston. The City of Boston is responsible for the design, engineering, permitting, and related public process.
(Canton)
Organization: TRIC
(Wilmington)
(Phases 3 and 4)
(Boston)
(Hingham)
Organization: SSC
(Somerville)
Street
(Newton)
(Milford)
(Milton)
Signal and Intersection Improvements on Route 135 (Hopkinton): No bicycle accommodations are described.
Reconstruction of Ferry Street (Everett): No bicycle accommodations are described.
Reconstruction of Melnea Cass Boulevard (Boston): The project description references on-road existing and proposed bike lanes. Asks if an off-road street path is still planned.
Improvements on Boylston Street (Boston): Asks if a separated bike lane could be considered, as opposed to the proposed on-street bike lanes.
The current designs of the projects listed include the following:
Signal and Intersection Improvements on Route 135 (Hopkinton): Proposed two-way separated bicycle lane between Wood Street and Hayden Rowe Street, for 0.63 miles. The remainder of the corridor will be sharrows or bicycle accommodating shoulders.
Reconstruction of Ferry Street (Everett): The current bicycle accommodation planned consists of roadway cross sections and shoulder widths that meet MassDOT design standards for urban minor arterials. The City of Everett is the project proponent and is responsible for engineering design of the project and compliance with MassDOT requirements. In part, resulting from the recommendations of an MPO-supported study, specific bicycle and pedestrian improvements are planned to improve safety for these roadway users, including bulb-outs, new signal equipment with video detection for bicycles, and a widened median on Ferry Street. Shared lane markings are also being considered.
Reconstruction of Melnea Cass Boulevard (Boston): Currently, the South Bay Harbor Trail is the only existing facility that serves bicycles along the Melnea Cass Boulevard corridor. The trail is approximately 8 feet wide and runs along the north side of the corridor for the full east-west length. The project would add single-direction separated bike lanes, averaging between 6.5 and 8 feet wide, on both sides of the roadway. Due to right of way and environmental constraints between Hampden Street and Massachusetts Avenue, the eastbound direction will include a side path that averages 10 feet wide for shared pedestrian and bicycle accommodations. Protections for bicyclists will be provided at each signalized intersection; these features include bicycle boxes and signal upgrades to improve safety for bicyclists. Raised crossings for pedestrians and bicycles will be constructed between Tremont Street and Washington Street in addition to raised intersections at Washington Street and Albany Street for enhanced visibility of bicycle and pedestrian crossings. Along Columbus Avenue, south of Melnea Cass Boulevard, the Southwest corridor will be reconstructed adjacent to the roadway to more clearly designate the space between pedestrians and bicyclists. A separated bike lane for northbound travel will be constructed on the east side. North of Melnea Cass Boulevard, the Southwest Corridor will be reconstructed in place. The cross-section will be reconfigured to provide buffered bike lanes adjacent to the curb line with on-street parking provided adjacent to travel lanes. (This application is consistent with a corridor reconstruction project along Columbus Avenue under design for the City of Boston).
Improvements on Boylston Street (Boston): The current design includes exclusive 5 foot bicycle lanes in each direction. The City of Boston is the project proponent and is responsible for engineering design of the project and compliance with MassDOT requirements.
The municipalities are responsible for working with MassDOT to design these projects. While the MPO programs funding for construction and can be a forum for discussion of engineering design issues on a particular project, specific design elements should be discussed with the project proponent. As these projects progress through the design phase with MassDOT oversight and approval, they either are determined to comply with MassDOT policies and regulations, or they must be granted exceptions, as approved by MassDOT.
(Canton, Dedham, Norwood, and Westwood)
(Walpole)
(Dedham)
Requests that the MPO consider 23 projects within the 495/MetroWest region for TIP funding; eight of these projects have been designated as "transportation nightmares" by the 495/MetroWest Partnership. States that a lack of sound financial footing for transportation infrastructure results in major projects that would have significant regional impact remaining idle in the TIP Universe of Unprogrammed Projects.
(Boxborough)
Supports the request by Adam Duchesneau, Boxborough Town Planner, to include new sidewalks on the project.
This project was removed from the TIP through Amendment Four to the FFYs 2018-22 TIP. Due to cost and/or schedule changes to other programmed priority projects and changes to federal funding levels, MassDOT re-evaluates each of its statewide priority funding programs every federal fiscal year. In order to stay within fiscal constraint, this project had to be moved out of the TIP. The project will be reconsidered for programming as more funding becomes available.
Please remain involved in the design process, which will be conducted by MassDOT. MassDOT will be responsible for the design, engineering, and permitting of this project.
Expresses disappointment that the Resurfacing and Related Work on Route 2A project in Concord, Lexington, and Lincoln has been reprogrammed to FFY 2023.
(Boxborough)
This project was removed from the TIP through Amendment Four to the FFYs 2018-22 TIP. Due to cost and/or schedule changes to other programmed priority projects as well as changes to federal funding levels, MassDOT re-evaluates each of its statewide priority funding programs every federal fiscal year. In order to stay within fiscal constraint, this project had to be removed from the TIP and will be reconsidered for programming as more funding becomes available.
Please remain involved in the design process, which will be conducted by MassDOT. MassDOT will be responsible for the design, engineering, and permitting of this project.
Adds that the following projects should be evaluated and considered for the TIP, in either the FFYs 2019-23 document or in future amendments:
Improvements along Commonwealth Avenue (Boston)
McGrath Boulevard Project (Somerville)
Mountfort Street and Commonwealth Ave Connection (Boston)
MassDOT is leading the design and engineering of the Allston I-90 project. This project is not currently programmed in the FFYs 2019-23 TIP. Please remained involved in the process of designing and funding this project.
The Commonwealth Avenue and McGrath Boulevard projects can be reevaluated and considered for inclusion in the MPO's new Long-Range Transportation Plan (LRTP), which will be endorsed by the MPO in FFY 2019. Prior to being programmed in the TIP to receive federal funding, this project would need to be included as a priority in the LRTP. More information about the development of the LRTP is available online: http://www.bostonmpo.org/lrtp-dev.
(Phase 2B and 2D)
Municipal: Len Simon, Vice Chair, Sudbury Board of Selectmen
Organizations: CrossTown Connect TMA, 495/MetroWest Partnership
Acton residents: Emily McDowell, Lauren Pollak, Ray Andrews, Maria Kuffner, Nancy Kerr, Franny Osman, Anne Anderson, Greg Antonioli, Kathy Peebles, Judith A. Aronstein, Martin Burke, Barbara Dowds, Joseph Holmes, Bill Smith, Dot Keyworth, Carol Domblewski, Geraldine Abrams, Irwin Abrams
Concord residents: Charles Jennings, Barbara Pike, Diane Kerr, Judy Perrin, Dean Sullender, Suzanne Knight, David Clarke, Stuart Johnstone, Caroline Partridge, Elizabeth Seabury, Steve Sutter, Pat Goldstein, Roy Westerberg
(Phase 2B and 2D)
Westford residents: Wendy Wolfberg, Emily Teller, David Martin, William Harman, Chris Barrett, Carol S. Engel, Elizabth Galya, Donald Galya, Dawn-Marie Sutton, Molly (no surname given)
(Phase 2B and 2D)
Billerica residents: Paula LeClerc, Lynn Barstow, Ricky Hull
Boxborough resident: Barry Harsip
Carlisle residents: Bob Macauley, Robin Hillyard, Martha Supnik, Bob Stegmaier
Chelmsford residents: Kaari Mai Tari, Andrew Barber
Charlestown resident: Mary Christine Corr
Hudson resident: Nancy Powers
Lowell residents: Julia Huestis, Sheila Anderson Kirschbaum
Medford resident: John Sieber
Weston resident: David Hutcheson
Jaffrey, NH resident: Timothy A. Coll
Pelham, NH resident: Linda Irish-Simpsons
(Phase 2B)
Concord residents: Bob Armstrong, Sue Armstrong
(Phase 2D)
Signal Improvements at
Kelley's Corner, Route 111, and Route 27
(Acton)
Organizations: 495/MetroWest Partnership, CrossTown Connect TMA
Acton residents: Franny Osman, Jim Salem
Signal Improvements at
Kelley's Corner, Route 111, and Route 27
(Acton)
The Town of Acton is leading the development of the engineering design for this project. The design plans are reviewed and approved by MassDOT when they comply with applicable local, state, and federal policies and regulations. In order for this project to remain programmed in the TIP in FFY 2022, the town must take the necessary steps to complete approved 100 percent engineering design plans.
Signal Improvements at
Kelley's Corner, Route 111, and Route 27
(Acton)
Requests that the 25 percent design public hearing be delayed until the plan minimizes the destruction of trees, removes the planned left-turn lane and additional turning lane, and decreases speed limits to 20-25 miles per hour for all approaches to the intersection.
The Town of Acton is leading the development of the engineering design for this project. The design plans are reviewed and approved by MassDOT when they comply with applicable local, state, and federal policies and regulations. In order for this project to remain programmed in the TIP in FFY 2022, the town must take the necessary steps to complete approved 100 percent engineering design plans.
Signal Improvements at
Kelley's Corner, Route 111, and Route 27
(Acton)
(Pond Street)
(Ashland)
Municipal: Yolanda Greaves, Ashland Board of Selectmen
(Bedford)
Acton resident: Franny Osman
(Boston)
States that the Boston Transportation Department's public outreach has been insufficient. BTD has not addressed public comments made at the 25 percent design public hearing. Representative Rushing requested the creation of a task force to develop a more workable plan for the Tremont Street intersection. This task force was not created, and the alternative designs developed by project consultants did not reflect community feedback. A collaborative approach is needed to reach mutually acceptable design decisions.
Please remain involved in the design process, which is conducted by the City of Boston. The City of Boston is responsible for the design, engineering, permitting, and related public process.
Acton resident: Franny Osman
Medford resident: Ken Krause
Funding in FFYs 2019-23 TIP is as follows:
FFY 2019 = $56,368,800
FFY 2020 = $20,031,200
FFY 2021 = $29,100,000
(Lynn)
Municipal: Mayor Thomas M. McGee
(Lynn and Saugus)
Municipal: Mayor Thomas M. McGee
(Route 139)
(Holbrook)
(Malden)
Organizations: Preotle, Lane & Associates; Jefferson Apartment Group; Exchange Street Bistro; Combined Properties; Boda Borg Boston; Berkeley Investments; 126-150 Pleasant Street Associates; Myer Dana and Sons; Kendall Capital; Bike to the Sea
(Marblehead)
Senator Crighton requests that the MPO work to advance the project on or ahead of schedule, and that any changes to the timeline of the project be proactively communicated to the Town of Marblehead.
(Safe Routes to School)
(Medford)
(Norwood)
Organization: Neponset Valley TMA
(Norwood)
Organization: Neponset Valley TMA
(Swampscott)
Senator Crighton requests that the MPO work to advance the project on or ahead of schedule, and that any changes to the timeline of the project be proactively communicated to the Town of Swampscott.
Representative Ehrlich requests that some funding be allocated to improve crosswalk safety at 990 Paradise Road and submits a petition with over 100 signatures requesting installation of a pedestrian signal.
(Watertown)
Overview of Contents
Purpose
Methodology
NEXT STEPS