Technical Memorandum
DATE: January 22, 2015
TO: Boston Region MPO
FROM: Chen-Yuan Wang, MPO Staff
RE: Washington Street Subregional Priority Roadway Study in Newton
The roadway segment of Washington Street between Chestnut Street and Church Street in Newton was selected for analysis in a project funded by the Boston Region MPO for federal fiscal year (FFY) 2014, “Addressing Safety, Mobility, and Access on Subregional Priority Roadways.” The work program for this corridor study was approved on September 12, 2013, and the selection was approved on December 19, 2013.
This memorandum summarizes the existing conditions and issues, roadway operations and safety analyses, and proposed short- and long-term improvements for the entire study corridor and for specific locations. It contains the following sections:
This memorandum also includes technical appendices that contain the data and methods that were applied in the study.
During the MPO’s outreach for the development of the Unified Planning Work Program (UPWP) and the Long-Range Transportation Plan (LRTP), Metropolitan Area Planning Council (MAPC) subregional groups and other entities submit comments and identify transportation problems and issues that concern them. These issues are related to some or all of the following: bicycle, pedestrian, and freight accommodation; bottlenecks; safety; and lack of safe or convenient access for abutters along roadway corridors. They can affect not only mobility and safety along a roadway and its side streets, but also quality of life, including economic development and air quality.
This study was undertaken to identify roadway corridors in the MPO region that are of concern to Boston Region MPO subregional groups but that have not been identified in the LRTP regional Needs Assessment. It focused on the issues that were identified by relevant subregional groups, and developing improvement recommendations to address those issues. In addition to mobility, safety, and access, the study considered transit feasibility, truck issues, bicycle and pedestrian transportation, and other topics.
The Washington Street corridor was selected through a comprehensive process. First, MPO staff identified potential study locations using various sources: soliciting suggestions during the outreach process for the FFY 2014 UPWP; reviewing meeting records from the UPWP outreach process for the past five years; and appraising potential locations from the list of monitored roadways in the MPO’s Congestion Management Process (CMP) program.
MPO staff identified 29 roadway corridors in the MPO region as potential study locations. The staff then assembled detailed data on the identified roadways and evaluated them according to five selection criteria:
The selected corridor is a four-lane roadway that serves residents, commuters, and local businesses, and supports transit—Massachusetts Bay Transit Authority (MBTA) bus service and access to commuter rail stations on the Framingham/Worcester Line. The City of Newton expressed interest in this corridor study, which focused on 1) urban design and multiuse roadways that have pedestrian and bicycle facilities; 2) improved transportation access and mobility; and 3) safety enhancements.
The objectives of this study were to:
This study focused on a two-mile corridor of Washington Street between Chestnut Street in West Newton and Church Street near Newton Corner. The selected roadway segment is under the jurisdiction of the City of Newton, but the Massachusetts Department of Transportation (MassDOT) Highway Division District 6 Office oversees the area’s roadway improvement projects.
With the assistance of MassDOT and the City, MPO staff collected extensive roadway traffic and speed data; intersection turning-movement counts, including pedestrian and bicycle movements and the percentages of heavy vehicles (trucks and buses); information about on-street parking regulations and adjacent developments; and multiple-year crash reports.
During the course of the study, MPO staff worked closely with the City’s transportation team. Three major meetings were conducted to support the study.
The purpose of the first meeting, hosted by the City on February 26, 2014, was to introduce the study and to get input on the issues and concerns about the study corridor from members of the public, including the area’s residents, business owners, and citizen groups. The second meeting, conducted by MPO staff on July 31, 2014, focused on reviewing the findings and preliminary improvement proposals with the City’s transportation team and MassDOT District 6 staff.
At the last meeting, which was held on November 19, 2014, and was open to the public, MPO staff presented the study findings and improvement proposals to the City’s Public Facilities Committee and Public Safety and Transportation Committee.
This section examines the corridor’s location; roadway configurations; adjacent developments; public transportation facilities; parking regulations; and observed traffic, pedestrian, and bicycle conditions. It also summarizes the issues and concerns raised in the first public meeting and issues identified from observations of the existing conditions.
Washington Street is a major regional roadway for Newton and the adjacent communities. It begins at the Wellesley-Natick border as part of state Route 16, continuing northeast through Wellesley into Newton Lower Falls, where it intersects Interstate 95/Route 128 at Exit 21. It connects with Interstate 90 at Exit 16 in Auburndale before turning east, running parallel with I-90 into Newton Corner. After crossing I-90 again at Exit 17, it turns southeast into Brighton and Brookline, ending at state Route 9 in Brookline Village.
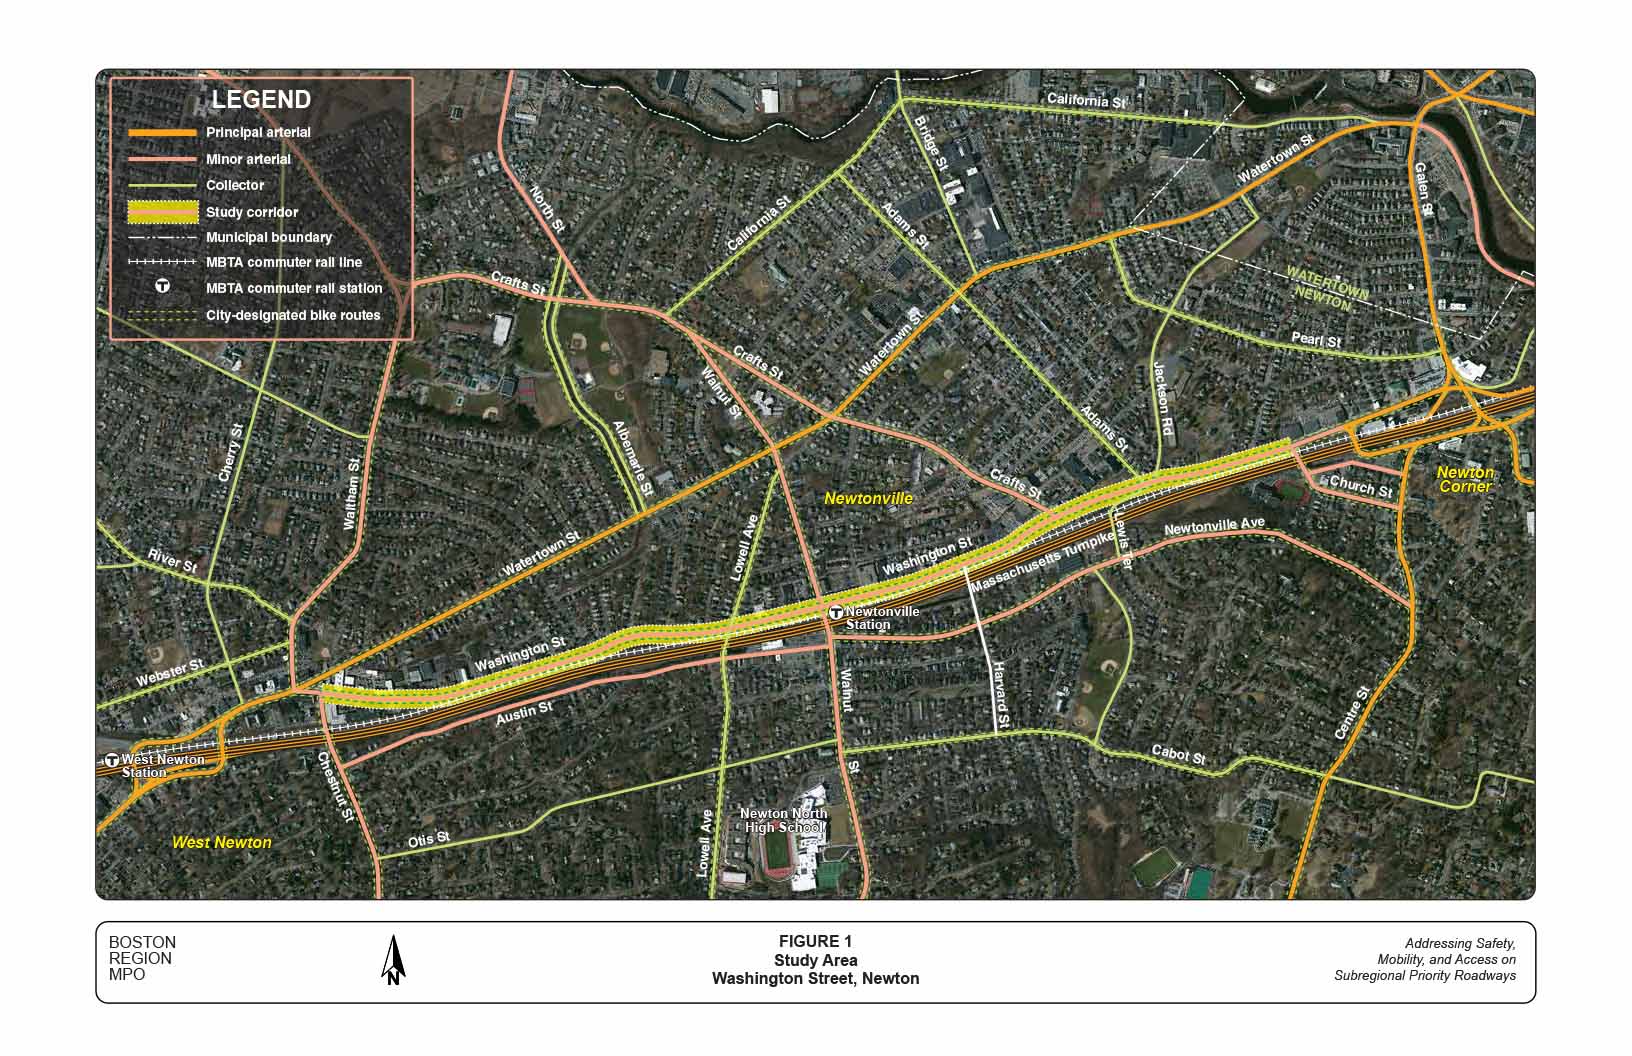
The study corridor, between Chestnut Street and Church Street, contains most of Washington Street that is parallel to I-90 and carries a high proportion of commuting traffic. In addition, it functions like a service road for I-90 between Exit 16 (West Newton) and Exit 17 (Newton Corner), providing access to the neighborhoods in Newton, Waltham, and Watertown on both sides of I-90. Locally, the corridor links three major Newton villages (neighborhoods): West Newton, Newtonville, and Newton Corner.
Figure 1 shows the location of the study corridor and major transportation facilities in the area. Located on the north side of I-90, the entire corridor is classified as a minor urban arterial. It is a four-lane roadway with on-street parking allowed on both sides for most of its length. There are sidewalks on both sides of the roadway. The roadway, which currently contains no separate bicycle lanes, is designated as a bicycle route for advanced (experienced) cyclists (see Appendix A: Newton Bicycle Map).
The adjacent land uses are mainly multifamily residential and business, with some institutional and parkland use. The land uses in the area between Chestnut Street and Lowell Avenue are mainly residential, except the area near West Newton (business and office). Land use in the area adjacent to Newtonville (between Lowell Avenue and Harvard Street) is mainly business. Land use in the area between Harvard Street and Church Street) is mixed, with businesses, offices, apartments and condos, schools, institutions, and parkland (see Appendix B, Newton Zoning Map).
The study area contains a dense roadway network. The selected Washington Street corridor intersects three other minor arterials—Chestnut Street, Walnut Street, and Crafts Street—and a few collector roadways: Lowell Avenue, Lewis Terrace, Adams Street, and Jackson Road. In total, there were seven signalized intersections and a few major unsignalized intersections that had stop controls on side streets. The corridor also contains a high number of driveways from adjacent business developments.
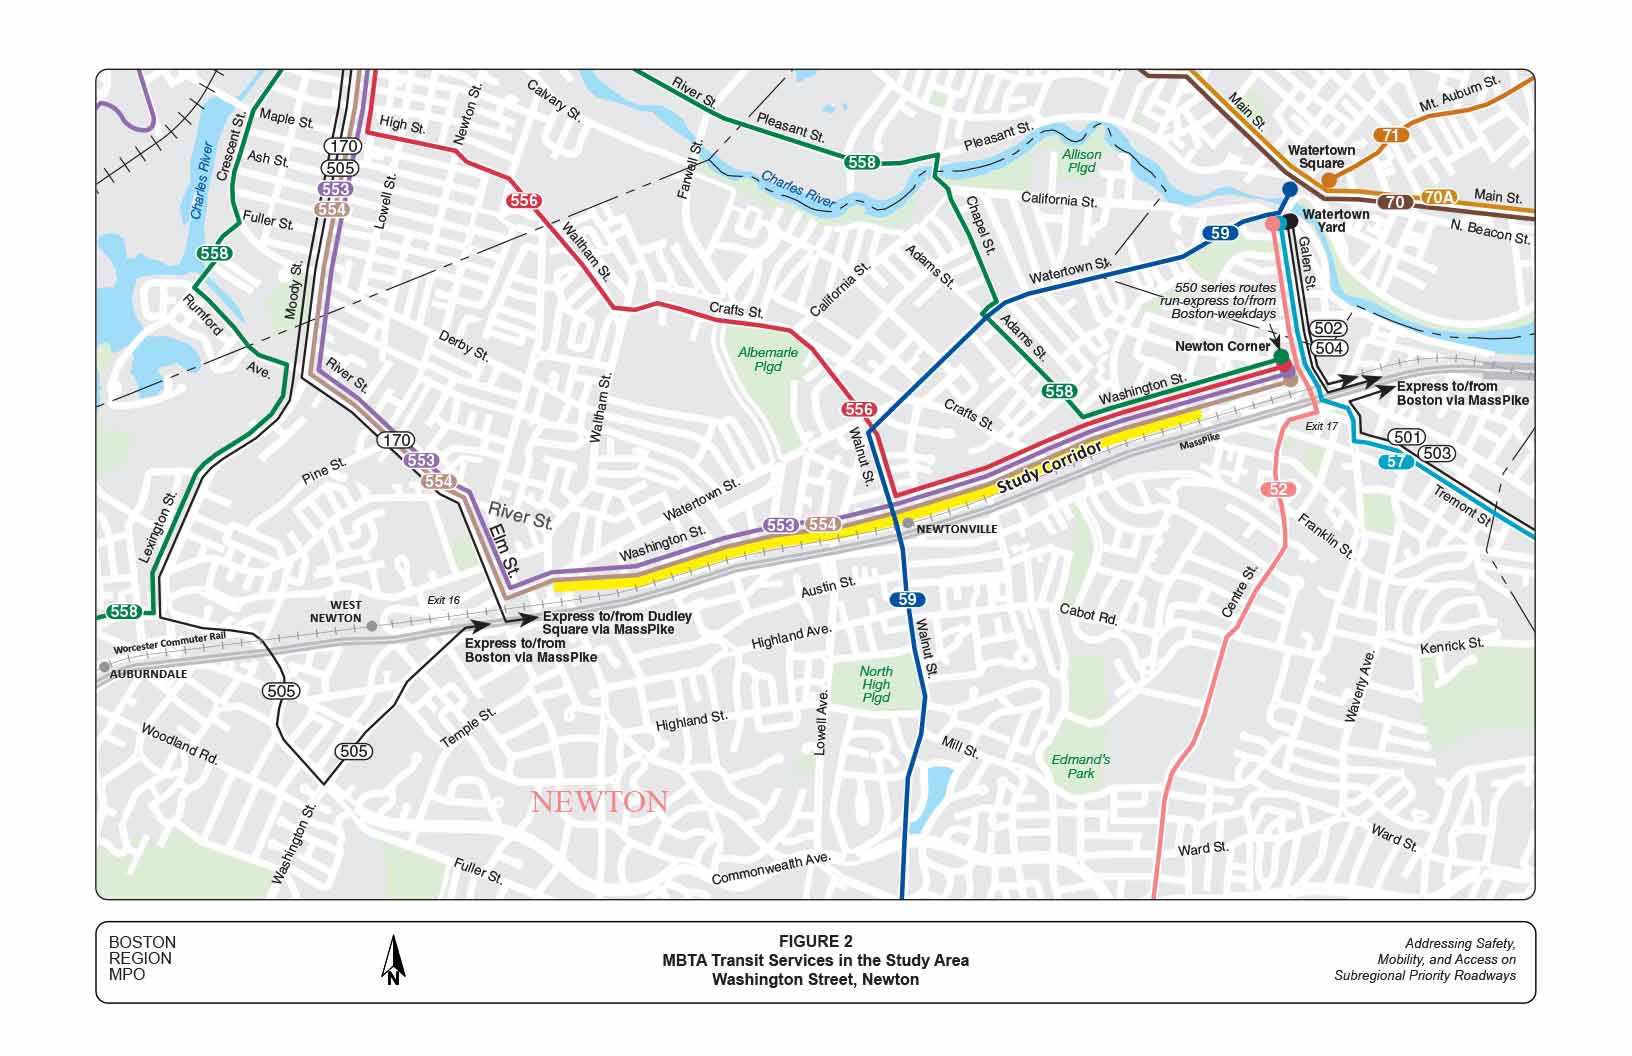
In the study area, there are various transit services provided by the MBTA, including several express and local buses and the Framingham/Worcester commuter rail line. The bus routes run mainly along arterials and major collector roadways. The commuter rail line runs along the north side of I-90 just south of the study corridor. Figure 2 shows these services in the study area.
Transit services in the study corridor consist of four express bus routes (Routes 553, 554, 556, and 558) that run to and from Downtown Boston, and two commuter rail stations, Newtonville and West Newton, on the Framingham/Worcester Line. The four bus routes mainly serve commuters and local travelers in Newton and Waltham. Routes 553 (Brandeis/Roberts–Downtown Boston) and 554 (Waverley Square–Downtown Boston) traverse the entire corridor, with about 10 stops in each direction. Routes 556 (Waltham Highlands–Downtown Boston) and 558 (Auburndale–Downtown Boston), traversing only part of the corridor, divert from the corridor at Walnut Street and Adams Street, respectively.
The MBTA 2014 bus ridership and service statistics indicate that the four bus routes together serve about 1,400 riders (about 2,600 inbound and outbound boardings) per weekday. According to the 2008–09 MBTA Systemwide Passenger Survey, 56.9 percent of the total trips on the four bus routes are regional (Newton/Waltham–Boston), 19.1 percent are local (Newton–Newton, Waltham–Waltham, or Newton–Waltham), and 24 percent are trips to and from other communities.
For commuter rail service, the survey focused on inbound riders, whose purpose is predominantly commuting (which is referred to as a “home-based work” trip purpose in the MPO’s regional travel demand model) from Newton to Downtown Boston. The survey data indicate that there were 240 riders boarding the line at Newtonville Station, and 230 riders at West Newton Station. Walking and driving-parking are two major means of access. At Newtonville, about 20 percent of the riders parked their cars near the station.
Further analyses of the ridership and trip characteristics of the four bus routes and the two commuter rail stations are presented in Appendix C.
In the study area, there are also a number of bus connections at various locations along Washington Street. At Newton Corner, the bus routes that connect are Route 52 (Watertown–Dedham), Route 57 (Watertown–Kenmore Square), and two other express buses: Route 502 (Watertown–Copley Square) and Route 504 (Watertown–Downtown Boston). At Newtonville Station, the connecting bus route is Route 59, which runs between Needham and Watertown. At West Newton Station, the connecting bus is Route 170, which travels to Downtown Boston from Waltham. Among these bus connections, Newton Corner is especially attractive because of high number of express bus routes to Downtown Boston.
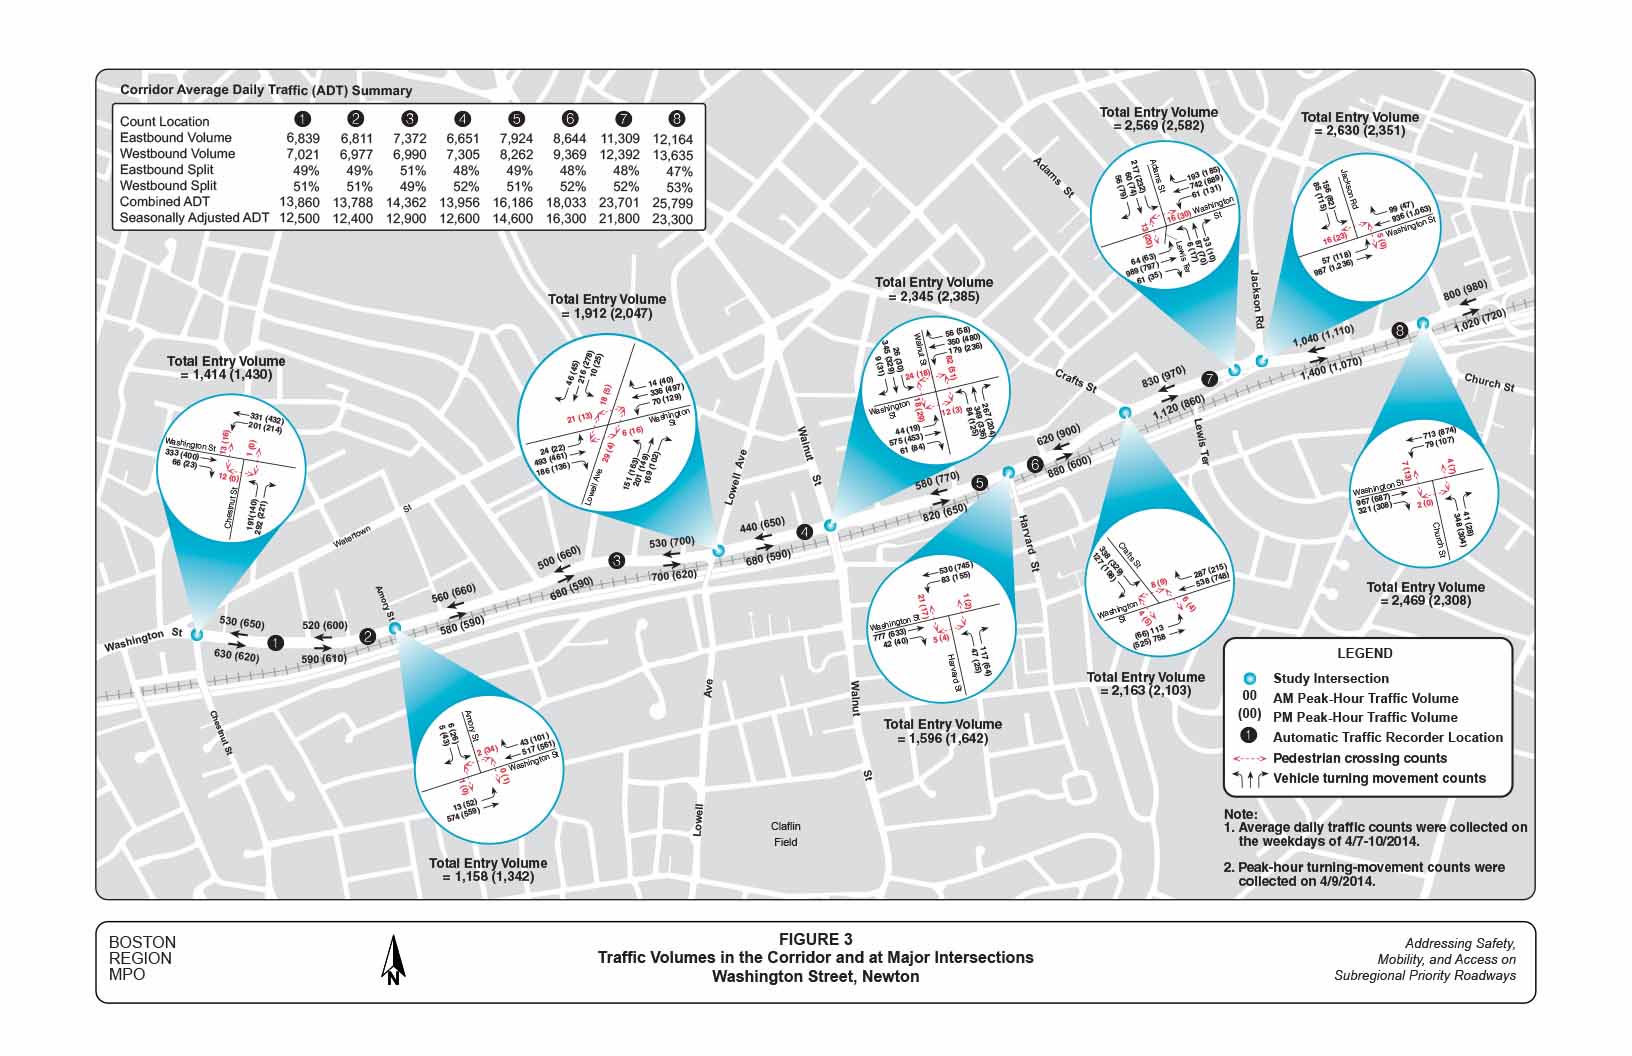
The study corridor carries both local and regional traffic from residents and businesses in the study area and vicinity. It is also an alternative to I-90 for people commuting to Boston, Brookline, Newton, and adjacent communities. Based on the traffic counts conducted in April 2014 by MassDOT for this study, the corridor carried about 14,000 to 26,000 vehicles per weekday.
Figure 3 shows traffic volumes on Washington Street and at major intersections in the study corridor. The volumes represent recently observed traffic flows in the morning and evening peak hours of a typical weekday. As a reference, average daily traffic (ADT) volumes at eight locations in the corridor are also cited in Figure 3. Generally the daily volumes in the westbound direction are about 3 to 4 percent higher than in the eastbound direction at almost all of the count locations.
The traffic volumes increase gradually from the western to the eastern segments of the corridor. In the morning, traffic gradually feeds into the corridor from local streets—Lowell Avenue, Walnut Street, Harvard Street, Crafts Street, Adams Street, and Jackson Road—mainly in the eastbound direction. Some traffic leaves the corridor, but most of the traffic continues to Newton Corner. In the evening, the corridor has a reverse traffic pattern, with traffic peaking in the westbound direction and gradually leaving the corridor.
Turning movements at major intersections in the corridor were also collected for the study, in 15-minute intervals between 7:00 to 9:00 AM and 4:00 to 6:00 PM. Traffic movements in the morning and evening peak hours were then identified and summarized for operational analyses. In general, each of the signalized intersections carries a total volume of entering vehicles ranging from 1,450 (at Chestnut Street) to 2,650 vehicles (at Jackson Road) per peak hour, and each of the unsignalized intersections carries a total volume ranging from 1,150 (at Armory Street) to 1,650 vehicles (at Harvard Street) per peak hour.
It is essential to examine the proportion of heavy-vehicle traffic in a corridor, since an unusually high share of heavy vehicles may seriously affect roadway and intersection operations. The recent counts indicate that the study corridor carries a heavy-vehicle percentage that is lower than the average for urban minor arterials, with about 2 percent to 3 percent of the daily traffic and 1 percent to 2 percent of the peak-hour traffic.
The intersection turning-movement counts also included pedestrian crossings and bicycle counts. The pedestrian crossing counts indicate that pedestrians are active in the study corridor, especially in the business districts in Newtonville. The intersection of Washington Street at Walnut Street experiences about 100 to 150 pedestrian crossings per peak hour.
The bicycle counts at major intersections indicate that on average 5 to 10 bicycles traveled on or crossed the corridor per peak hour on a spring weekday. Intersections on major bicycle routes, such as Jackson Road, Adams Street, and Walnut Street, carried higher bicycle volumes (about 11 to 14 bicycles per peak hour). It should be noted that these observations were performed on April 9, 2014, which was a relatively cold early spring day. The volumes are assumed to be higher in the late spring, summer, and early fall, when the weather is warmer.
There is on-street parking on both sides of the roadway in most segments of the corridor. In total, there are 558 parking spaces, under varying regulations depending on their locations. They comprise 357 spaces on the south side and 201 spaces on the north side.2
Table 1 summarizes the parking regulations for these spaces. For some of the spaces, the number of spaces was estimated by using 22 feet per space length, since those spaces are not metered and have no space delineation.
TABLE 1
Summary of Parking Spaces by Regulation
Parking Regulation |
South Side |
North Side |
Both Sides |
|---|---|---|---|
Meter: 1-hour limit |
0 |
60 |
60 |
Meter: 2-hour limit |
19 |
21 |
40 |
Meter: 12-hour limit |
107 |
0 |
107 |
Free: 1-hour limit |
4 |
12 |
16 |
Free: 2-hour limit |
50 |
25 |
75 |
No regulation |
177 |
83 |
260 |
Total |
357 |
201 |
558 |
Tables 2 and 3 further summarize the parking spaces, by the street segment, by the associated land use, and by regulation, for the south and north side, respectively. In general, the spaces are metered, with a 1-, 2-, or 12-hour limit in the business areas, or free, with a 1-hour limit, 2-hour limit, or no limit, in the residential and other areas. The 12-hour metered parking spaces, 107 in total, are distributed around Newtonville Station and are mainly intended for commuter rail riders.
TABLE 2
Summary of South Side Parking Spaces by Location and Regulation
Street Segment |
Land Use |
Regulation |
Number of Spaces |
|---|---|---|---|
Chestnut Street - Armory Street |
Commercial |
No regulation |
30 |
Chestnut Street - Armory Street |
N/A |
No regulation |
24 |
Armory Street - Lowell Avenue |
N/A |
No regulation |
100 |
Lowell Avenue - Walnut Street |
N/A |
Meter: 2-hour limit |
7 |
Lowell Avenue - Walnut Street |
N/A |
Meter: 12-hour limit |
17 |
Walnut Street - Harvard Street |
N/A |
Meter: 2-hour limit |
12 |
Walnut Street - Harvard Street |
N/A |
Meter: 12-hour limit |
69 |
Harvard Street - Crafts Street |
N/A |
Meter: 12-hour limit |
21 |
Harvard Street - Crafts Street |
Commercial |
Free: 1-hour limit |
4 |
Crafts Street - Jackson Road |
Commercial/office/ |
No regulation |
23 |
Jackson Road - Church Street |
N/A |
Free: 2-hour limit |
50 |
Total |
|
|
357 |
N/A = not applicable (vacant or adjacent to commuter rail tracks)
TABLE 3
Summary of North Side Parking Spaces by Location and Regulation
Street Segment |
Land Use |
Regulation |
Number of Spaces |
|---|---|---|---|
Church Street - Jackson Road |
Residential/office |
Free: 1-hour limit |
12 |
Church Street - Jackson Road |
School/office/residential |
Free: 2-hour limit |
25 |
Jackson Road - Crafts Street |
Institutional |
Prohibited |
0 |
Jackson Road - Crafts Street |
Residential |
No regulation |
7 |
Crafts Street - Harvard Street |
Commercial |
Prohibited |
0 |
Crafts Street - Harvard Street |
Commercial |
Meter: 2-hour limit |
9 |
Harvard Street - Walnut Street |
Commercial |
Meter: 1-hour limit |
30 |
Harvard Street - Walnut Street |
Commercial |
Meter: 2-hour limit |
12 |
Walnut Street - Lowell Avenue |
Commercial |
Meter: 1-hour limit |
20 |
Lowell Avenue - Armory Street |
Residential/commercial/office |
No regulation |
52 |
Armory Street - Chestnut Street |
Commercial/office/residential |
No regulation |
24 |
Armory Street - Chestnut Street |
Commercial |
Meter:1-hour limit |
10 |
Total |
|
|
201 |
The corridor has a wide range of land use activities, including commercial, office, residential, institutional (school and others), and recreational (parkland). Most of the land use activities are on the north side, since land use on the south side is limited because the area is adjacent to commuter rail tracks and I-90. The corridor has about 150 more parking spaces on the south side than on the north side. To reach the developments on the north side of Washington Street, people parking on the south side of the street have to cross four lanes of fast-moving traffic and that are busy during the peak hours.
Field observations indicate that parking utilization varies widely along the corridor. The metered and free parking spaces in the commercial areas between Chestnut Street and Armory Street are generally utilized during daylight business hours (about 70 percent to 80 percent of the spaces are occupied then). The free parking spaces in the residential areas between Cross Street and Lowell Avenue are sparsely occupied, except the section adjacent to Lowell Avenue, where the south side’s free spaces are usually fully occupied during daylight business hours.3
The short-term (1-hour and 2-hour) metered spaces in Newtonville are frequently utilized (about 80 percent or more of the spaces are occupied), especially in the area adjacent to Walnut Street. The 12-hour parking spaces distributed between Lowell Avenue and Crafts Street are generally underutilized (about only half of the spaces are occupied).
Between Crafts Street and Jackson Road, the free and metered parking spaces for adjacent businesses, offices, and residences are generally utilized during business hours. Between Jackson Road and Church Street, the free short-term parking spaces are generally fully occupied during the day. They are intended for visitors of the adjacent schools, institutions, offices, Newton Veterans Memorial Park, and the residences and offices near Church Street. However, some of the spaces might be used by Boston-bound commuters and visitors who are transferring to buses at Newton Corner.
In the February 2014 study-scoping meeting, which was also a listening session, residents and business owners raised a number of issues and concerns related to the safety and operations of the corridor. Their comments, summarized by location and issue category, are in Appendix D.
The issues and concerns related to the corridor in general, based on comments from the meeting and the above existing-conditions analyses, are summarized below:
Crash data are an essential source for identifying safety and operational problems in a study area. Analyses of crash locations, collision types, time-of-day, roadway conditions, and other factors also assist in developing improvement strategies. MPO staff collected two sets of data for the analyses. The two datasets are:
The five-year MassDOT data were used to examine the crash locations and crash rates. The Newton police reports were used to construct collision diagrams for further analysis of safety and operational problems at major intersections and in different segments.
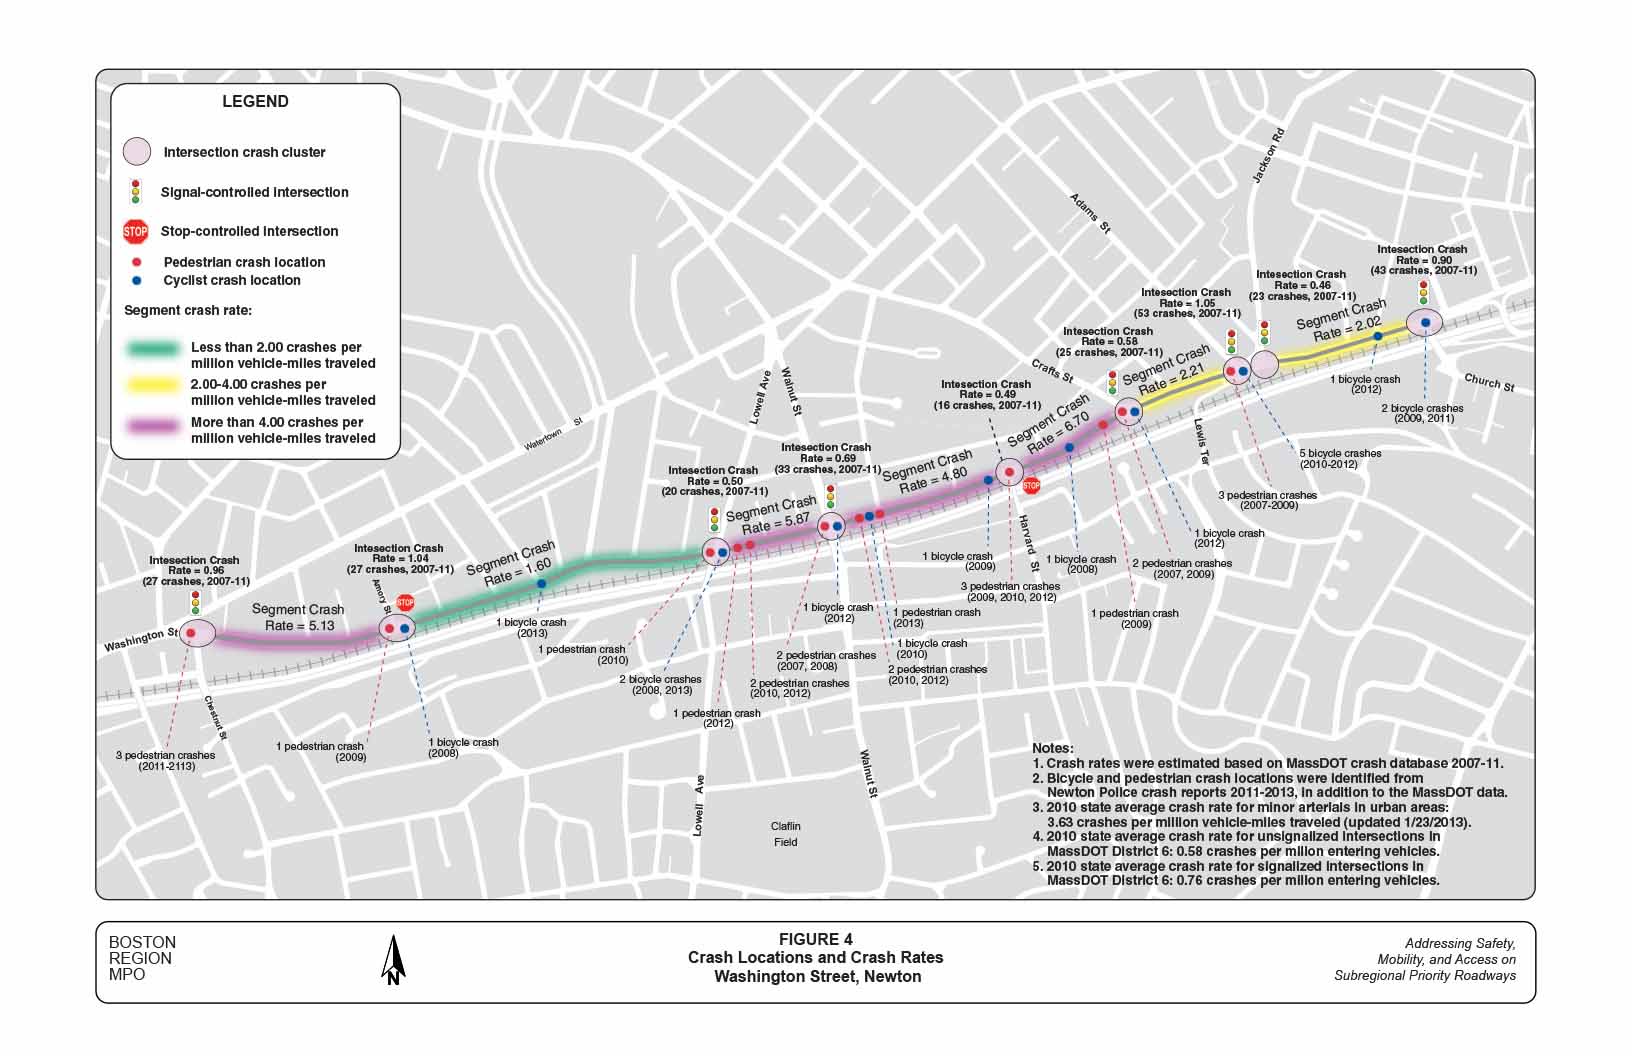
Figure 4 shows the crash locations and crash rates at major intersections and in different segments of the corridor during the five-year period 2007–11. Among the 434 crashes that occurred in the corridor during that time period, 267 were identified as having occurred at the nine major intersections, and 167 in the segments between those intersections.
The crash rates at the intersections and in the roadway segments were calculated. Among the seven signalized intersections, the crash rates at Chestnut Street (0.96), Adams Street/Lewis Terrace (1.05), and Church Street (0.90) are higher than the MassDOT District 6 average of 0.76 crashes per million entering vehicles. The crash rate at the Walnut Street intersection is calculated as 0.69 crashes per million entering vehicles, which is slightly lower than the District 6 average.
For unsignalized intersections, the crash rate at Armory Street (1.04) is higher than the MassDOT District 6 average of 0.58 crashes per million entering vehicles, and the crash rate at Harvard Street is 0.49 crashes per million entering vehicles, which is slightly lower than the District 6 average.
The segment crash analysis indicated that the crash rates in the segments that have primarily business uses—Chestnut Street–Armory Street (5.13), Lowell Avenue–Walnut Street (5.87), Walnut Street–Harvard Street (4.80), and Harvard Street–Crafts Street (6.70)—are all higher than the state average for urban minor arterials of 3.63 crashes per million miles traveled. The crash rates in the segments with mostly institutional and office land uses— Crafts Street–Adams Street (2.21) and Jackson Road–Church Street (2.02)—are lower than the state average. The crash rate in the segment that is mostly residential—Armory Street–Lowell Avenue (1.60)—is much lower than the state average.
Figure 4 also shows the pedestrian and bicycle crash locations in the corridor that were identified from both of the datasets in the recent period of slightly more than seven years. In total, 21 pedestrian crashes and 16 bicycle crashes were identified at various locations in the corridor.4
On average, about five crashes involved at least one pedestrian or cyclist per year in this corridor. The locations with a high rate of pedestrian and bicycle crashes are:
To further investigate safety and operational problems, MPO staff summarized the crash data for the study intersections according to crash severity (property damage only, non-fatal injury, fatality, unknown), collision type (single-vehicle, rear-end, angle, sideswipe, head-on, rear-to-rear, unknown), pedestrian or bicycle involvement, time of day, pavement conditions, and light conditions.
Crash statistics for the intersections in each dataset are summarized in Table E-1 and Table E-2 in Appendix E, respectively. The data show that the number of crashes in the three recent years at Chestnut Street, Armory Street, Lowell Avenue, Harvard Street, and Church Street has been decreasing slightly, while the number of crashes at Walnut Street Intersection has increased slightly. The other intersections remain about the same.
The collision diagrams for the intersections, which cover more than three years, were constructed by using recent crash reports provided by the Newton Police Department. The crash reports contain detailed information about how and where those crashes occurred. The collision diagrams for the intersections, in order from west to east, are in Appendix F. The date and time, severity, collision type, road conditions, and contributing factors for each of the crashes used in the analysis are also summarized in tables, which follow their respective collision diagrams, in Appendix F.
Major factors affecting intersection operations and findings from the collision diagrams for each of the intersections are summarized below:
Based on the Newton Police crash reports, MPO staff constructed collision diagrams for the segments between major intersections. The collision diagrams for these segments, in order from west to east, are included in Appendix G. The date and time, severity, collision type, road conditions, and contributing factors for each of the crashes used in the analysis are summarized in tables that follow their respective segments, in Appendix G.
In general, the segments that have commercial developments experience many more crashes than those with residences, offices, and institutions. The major findings from the analyses of all of the segment collision diagrams are summarized below:
To address issues and concerns related to roadway operations, this section examines the roadway’s prevailing travel speeds, existing roadway cross-sections, and operations at major intersections, and explores an alternative roadway design for accommodating pedestrians and bicycles and improving access to and from adjacent developments. It also examines the roadway’s operations under various projected future-year traffic conditions.
High travel speeds in the corridor are a major concern of the area’s residents. In order to understand how fast drivers travel in the corridor, MPO staff requested MassDOT’s assistance in collecting spot speeds during the period when automatic traffic counts were being conducted, in April 2014. The speed counts were collected at five selected locations in the corridor from April 7 to April 9. Appendix H summarizes the average and 85th percentile speeds for each location.
The “85th percentile” is the principal value used for establishing speed controls. It is the speed at or below which 85 percent of vehicles passing a given point are traveling. Currently most segments in the corridor are posted with a 35 mph (miles per hour) speed limit, except for the segments west of Davis Court and east of Jewett Street, where the speed limits are 25 mph.
Table 4 shows the observed 85th percentile speeds and the posted speed limits at the five selected locations in the corridor.7 In general, the eastbound speeds gradually decrease from west to east and the westbound speeds gradually increase from east to west. The 85th percentile speeds indicate that most vehicles in the corridor travel within a range of plus or minus 5 mph of the 35-mph speed limit. Note that there was roadside construction work on water supplies in the corridor at the time of the observations, and most of the speed counts were performed only on the curb lane in both directions (except the last location). Because of these factors, the actual travel speeds should be assumed to be somewhat higher than those shown in Table 4.
TABLE 4
Observed 85th Percentile Speeds in the Corridor
Speed Study Location |
Eastbound |
Westbound |
Posted |
|---|---|---|---|
1. Washington Street west of Armory Street |
37.2 mph |
35.3 mph |
35 mph |
2. Washington Street west of Cross Street |
38.9 mph |
33.9 mph |
35 mph |
3. Washington Street west of Walker Street |
37.6 mph |
35.1 mph |
35 mph |
4. Washington Street west of Harvard Street |
34.0 mph |
33.7 mph |
35 mph |
5. Washington Street west of Adams Street |
29.4 mph |
33.9 mph |
35 mph |
The nearly 40 mph travel speeds observed at various locations in the corridor are not considered unusual for roadways with a speed limit of 35 mph. The current speed regulations in the corridor generally comply with the MassDOT speed zoning requirements.8
Operating speeds on roadways generally conform to design conditions. Lowering the posted speed limit without related design reconfigurations is unlikely to meaningfully reduce travel speeds.
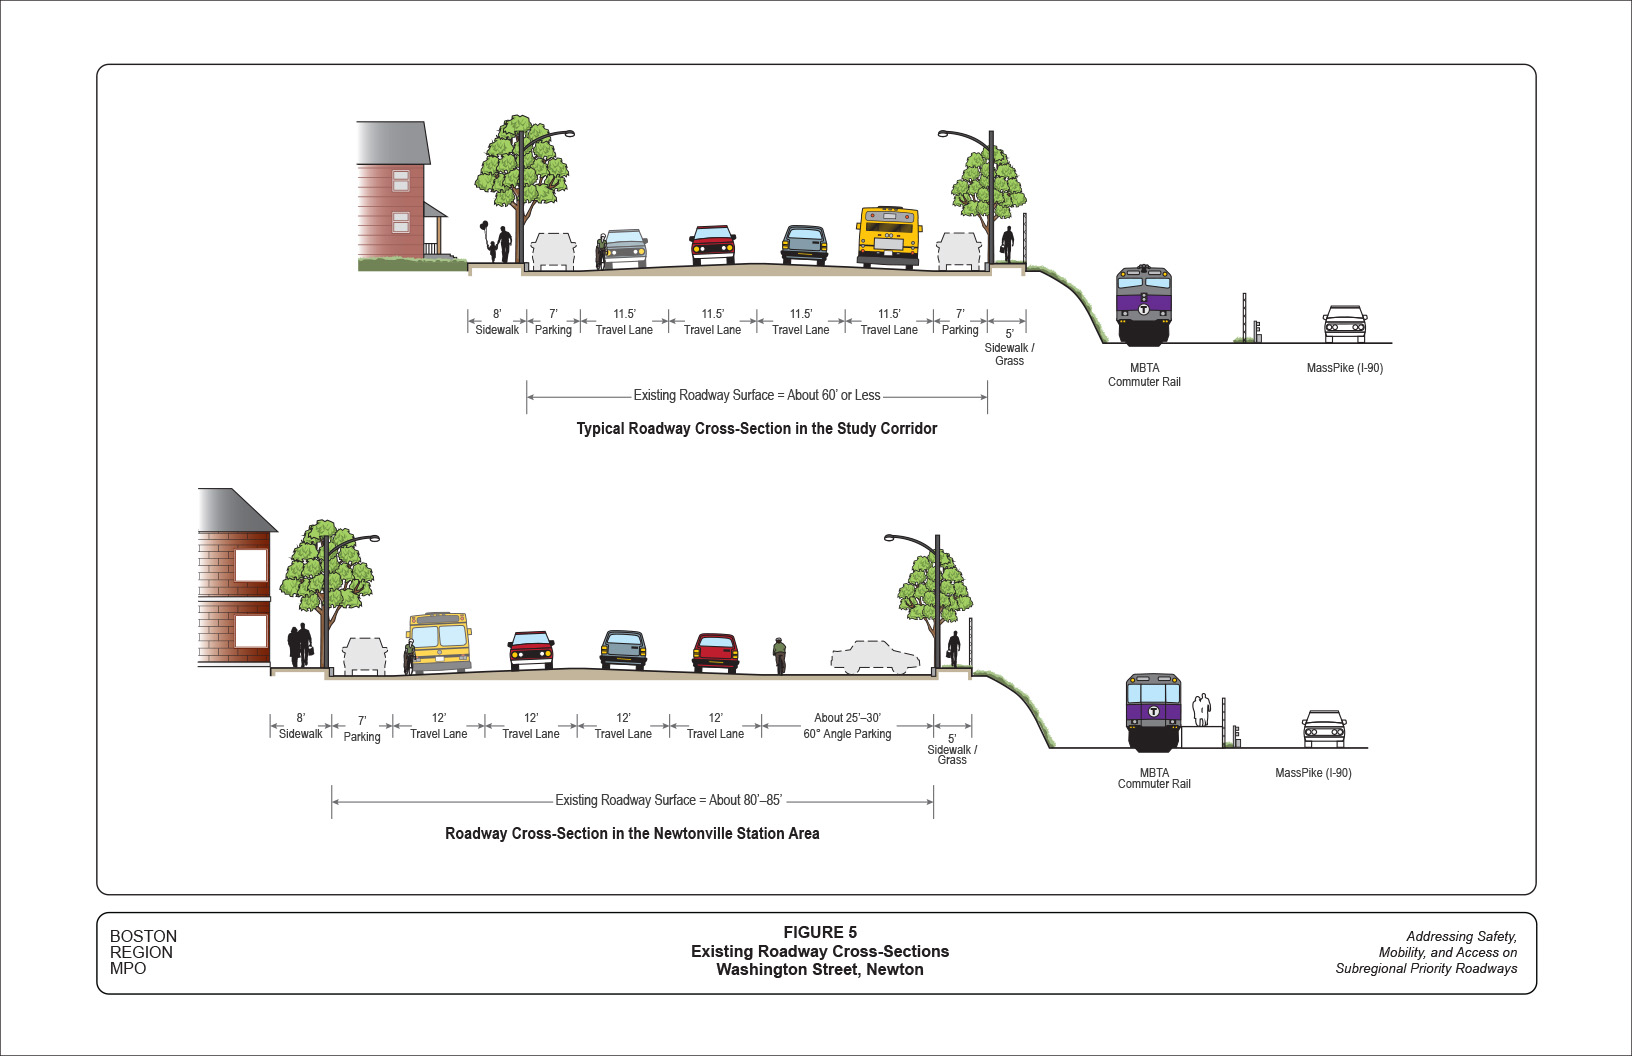
The top graphic in Figure 5 shows a roadway cross-section that is typical of most segments of the study corridor, presenting the street view of an eastbound driver. The four-lane roadway generally has two travel lanes, each of them about 11.5 feet wide and on-street parking (about seven feet wide) in each direction. There are no separate bicycle lanes. Cyclists have to ride with the outside-lane traffic and close to the parked (or parking) vehicles.
There are sidewalks on both sides of the roadway. On the north side, they are eight feet wide in most of the corridor segments. Some sidewalks in the commercial districts have a width of 10 to 12 feet, mainly in the area west of Armory Street. On the south side, the sidewalks are generally located next to the commuter rail fence, and have a width of five feet or less. Some are unpaved in the areas that are far from the commercial districts.
Most of the segments in the corridor have a roadway surface width (curb to curb) of about 60 feet. Some segments in the residential districts, from Armory Street to Lowell Avenue, have a surface width of 58 feet or less. The segment adjacent to Newtonville Station has a roadway surface that is wider than the other segments in the corridor, of about 80 to 85 feet.
The bottom graphic in Figure 5 shows that the segment adjacent to Newtonville Station has a roadway width of about 80 to 85 feet. It contains four 12-foot travel lanes, 7-foot parallel parking on the north side, and 60-degree angle parking on the south side that takes about 25 to 30 feet of roadway width. There are sidewalks on both sides of the roadway. There are no bicycle lanes. Although on the south side bicycles have a wider space between the angle parking and the outside-lane traffic, it is difficult for drivers who are backing out from the angle parking to see them, making this an unsafe area for cyclists.
Some of the major issues and concerns related to the existing roadway include:
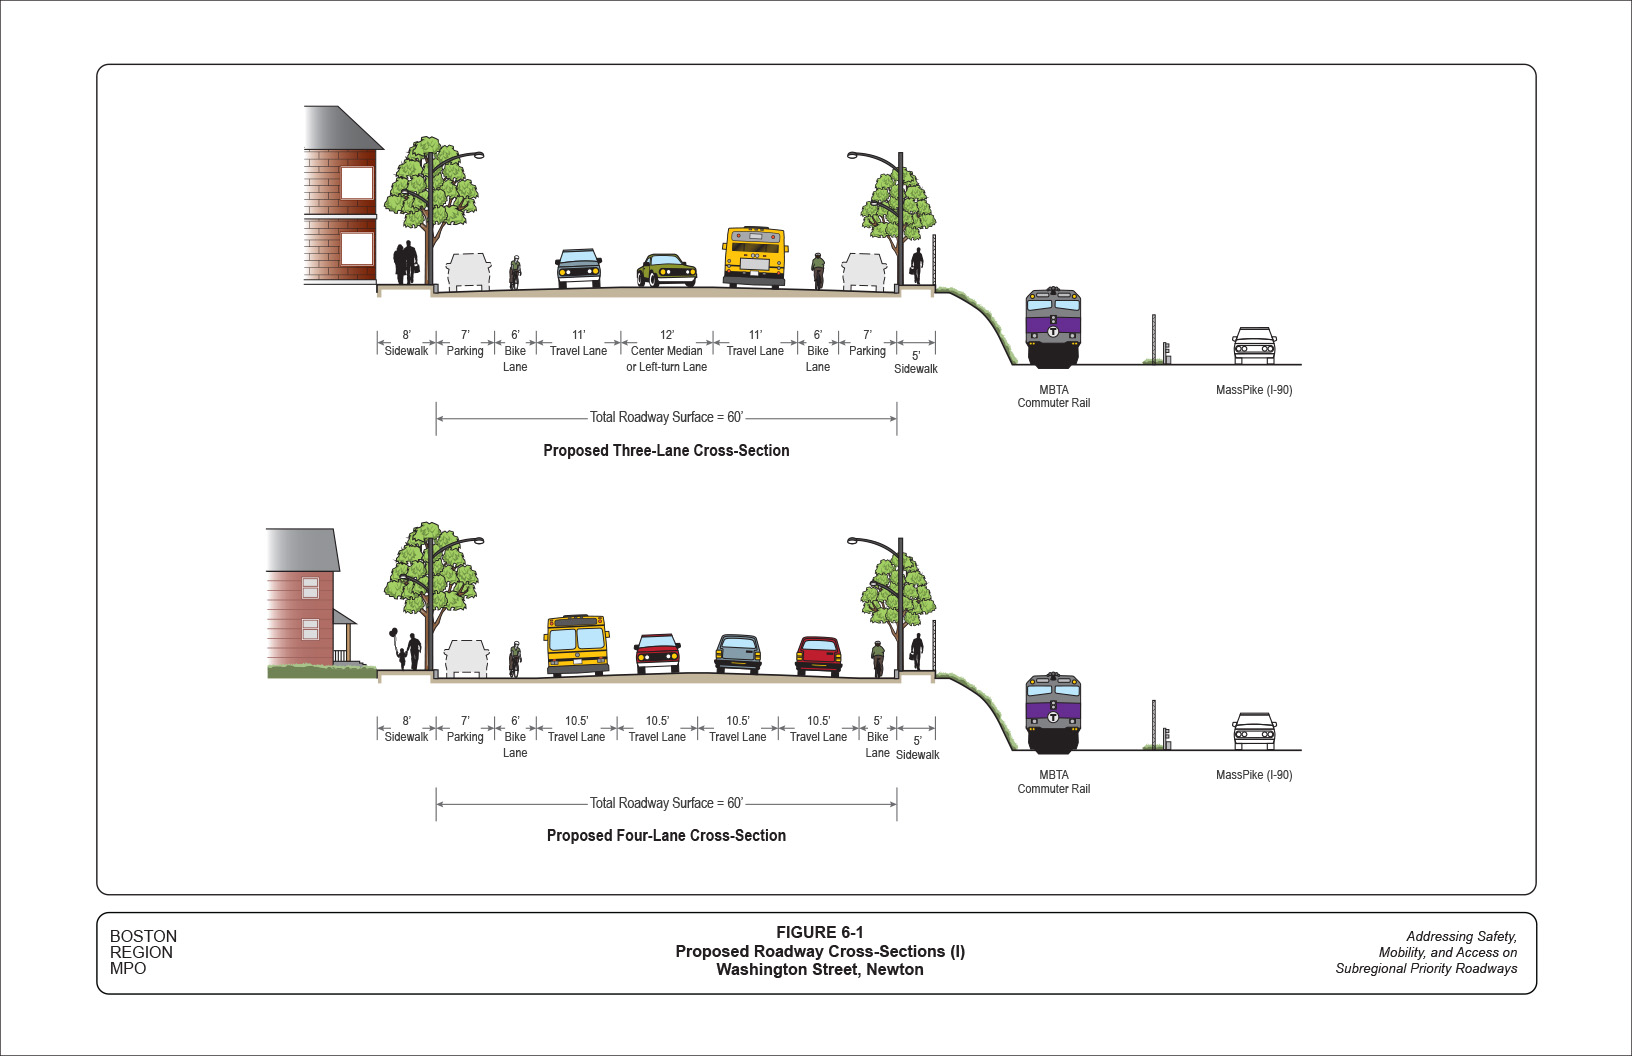
The recent counts indicate that most segments of the corridor (about 70 percent) carry an average daily traffic of fewer than 20,000 vehicles. These segments have the potential for a “road diet” application, which would involve reducing the number of travel lanes from four to three in order to accommodate bicycles and to improve safety for pedestrians crossing the roadway and for vehicles accessing adjacent developments.
The top graphic in Figure 6-1 shows the potential three-lane roadway cross-section that could be applied to most of the existing four-lane roadway. The cross-section contains a 12-foot center median or left-turn-only lane, two 11-foot travel lanes (one in each direction), two 6-foot bicycle lanes (one in each direction), and a 7-foot parking lane on both sides.9
The 6-foot bicycle lane would provide a slightly wider buffer zone separating bicycles from the parking lane and from adjacent traffic than a standard 5-foot bicycle lane. In this cross-section, pedestrians could stop at the center median and cross only one lane of traffic at a time. Meanwhile, vehicles could stay in the center left-turn lane to access the adjacent developments. It would be much safer for both the turning and through vehicles than under the existing conditions.
For the roadway segments that are not suitable for the “road diet” application, the bicycle accommodations could be accomplished by slightly reducing the width of travel lanes and removing on-street parking from one side of the roadway (mainly the south side). As shown in the bottom graphic in Figure 6-1, the proposed cross-section contains four 10.5-foot travel lanes (two in each direction), two 6-foot bicycle lanes (one in each direction), and a 7-foot parking lane on one side of the roadway.
The analysis in Section 2.4 indicates that many on-street parking spaces are currently not fully utilized, especially on the south side, but removing parking in these segments would likely impact adjacent developments. However, it would provide a safe separate accommodation for bicycles and would reduce unsafe pedestrian crossings. The goal of this study was to preserve as many of the parking spaces in the business districts of the corridor as possible.
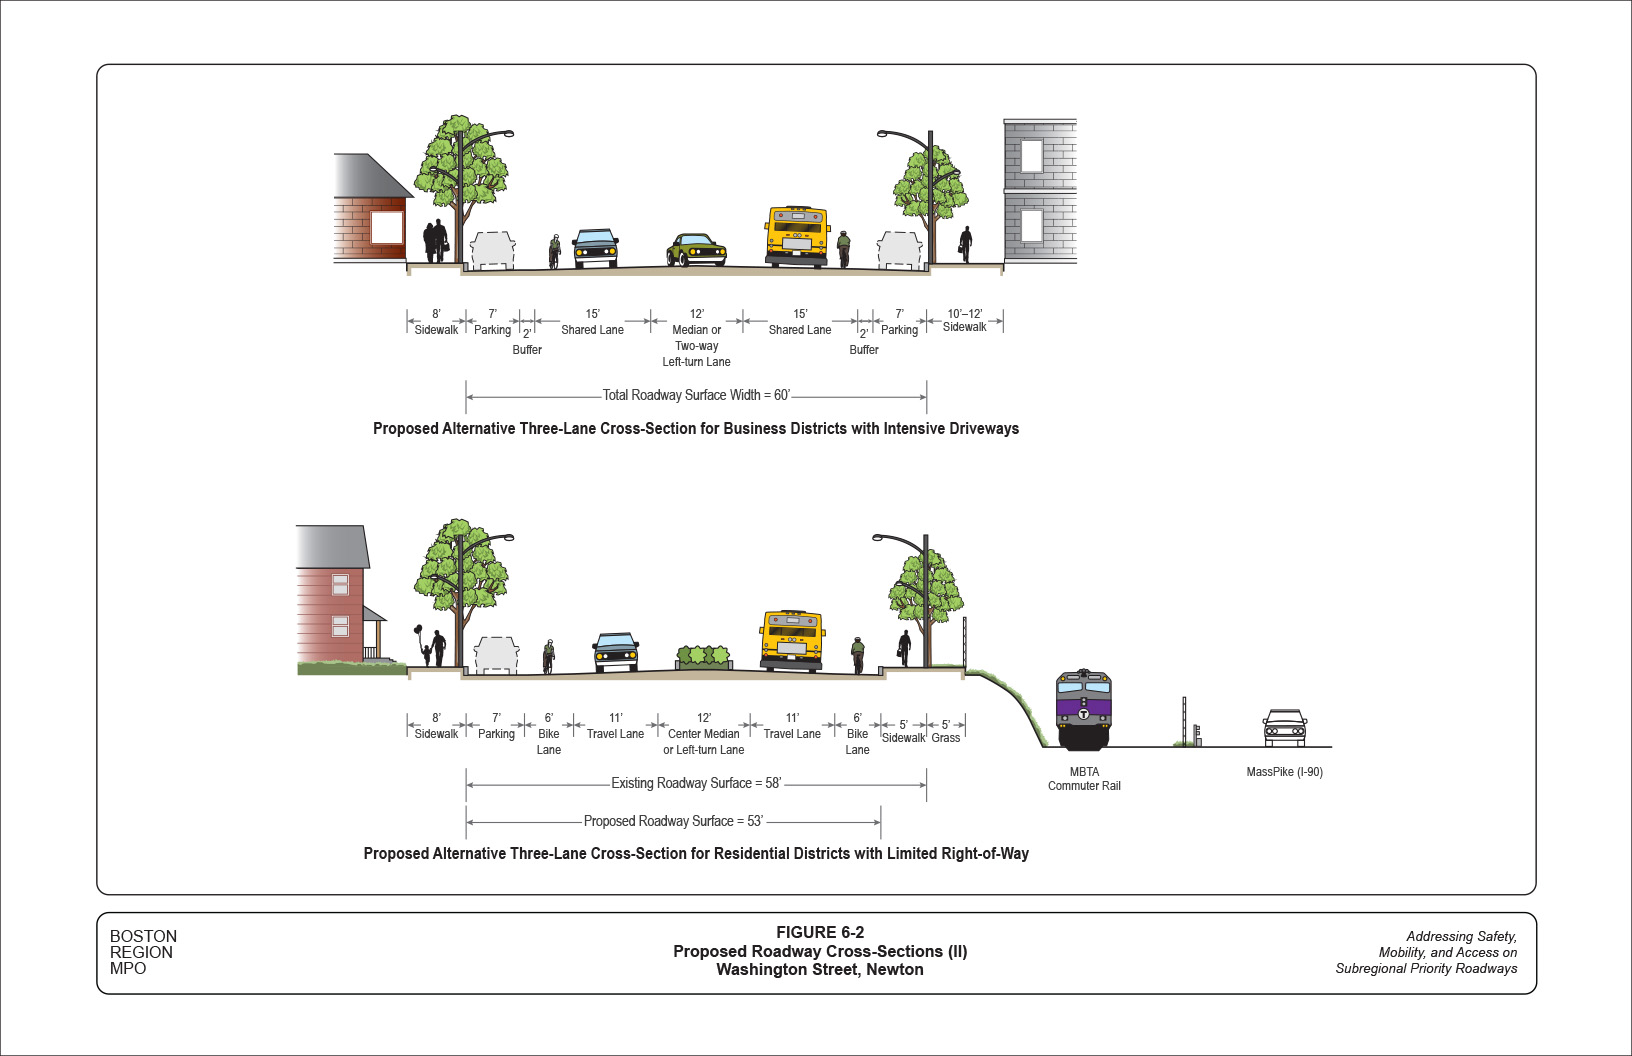
Taking into consideration the variations in roadway configurations, adjacent land uses, and pedestrian and bicycle activities, MPO staff proposed two alternative three-lane cross-sections. Figure 6-2 shows the two alternative cross-sections—one for business districts with closely spaced driveways and one for residential districts with limited roadway surface width.
The top graphic in Figure 6-2 shows the potential three-lane roadway cross-section for business districts with closely spaced driveways. The cross-section contains a 12-foot two-way left-turn (TWLT) lane or center median (striped or concrete-stamped), two 15-foot shared lanes for motor vehicles and bicycles (one in each direction), and a 7-foot parking lane with a 2-foot buffer from the shared lane, on both sides of the roadway.
This cross-section could potentially be applied to the business district near West Newton between Chestnut Street and Kempton Place. The TWLT lane would provide access to the dense business developments on both sides of the roadway. The wide shared lane would be more practical than separate bicycle lanes, which would be discontinuous and would have frequent intrusion by turning vehicles.
The bottom graphic in Figure 6-2 shows the potential three-lane roadway cross-section for residential districts that have limited roadway width. The cross-section contains a 12-foot center median (raised) or left-turn-only lane: two 11-foot travel lanes (one in each direction), two 6-foot bicycle lanes (one in each direction), and a 7-foot parking lane on the north side of the roadway.
This cross-section could potentially be applied to the residential districts between Cross Street and Walker Street, where the roadway surface width (about 58 feet or less) is narrower than in other segments of the corridor and most of the on-street parking areas on the south side are rarely utilized. The proposed roadway surface would be about 53 feet wide. The remaining space, which is 5 feet or less, could be used to increase the sidewalk space on the south side so that pedestrians would have more buffer space from the adjacent commuter rail tracks.
The corridor contains seven signalized intersections and two major unsignalized intersections. These are the major locations that could affect traffic flow and pedestrian and bicycle movements in the corridor.
Based on the recently collected turning-movement data, MPO staff constructed AM and PM peak-hour traffic models for the entire corridor by using the Synchro traffic capacity and simulation program.10 Table 5 summarizes the capacity analyses for six of the seven signalized intersections. The intersection of Washington Street at Chestnut Street is not included in the table, as its traffic signal is part of a coordinated system of a series of signals in the West Newton Square area. The signal system is currently being reviewed by the City.
TABLE 5
Intersection Capacity Analyses
Existing (2014) Conditions
Name of |
AM Peak Hour |
|
PM Peak Hour |
|
||||||||
|---|---|---|---|---|---|---|---|---|---|---|---|---|
LOS1 |
Avg. |
50th |
95th |
Cong. |
|
LOS |
Avg. |
50th |
95th |
Cong. |
|
|
Lowell Avenue |
C |
21.8 |
100 |
260 |
None |
|
C |
25.7 |
145 |
300 |
None |
|
Walnut Street |
D |
38.3 |
300 |
435 |
None |
D |
36.7 |
160 |
570 |
None |
|
|
Crafts Street |
E |
73.9 |
370 |
495 |
SB |
D |
50.9 |
295 |
380 |
SB |
|
|
Adams Street/ |
D |
37.1 |
250 |
325 |
SB |
|
D |
35.7 |
30 |
120 |
SB |
|
Jackson Road |
D |
48.9 |
100 |
150 |
None |
C |
25.4 |
375 |
470 |
None |
|
|
Church Street |
C |
21.3 |
190 |
570 |
None |
C |
20.5 |
160 |
535 |
None |
|
|
1 Level of service: A to F, based on 2010 Highway Capacity Manual criteria. LOS F is considered undesirable in urban areas. |
|
|||||||||||
2 Average delay at the intersection: estimated in seconds per entering vehicle. |
|
|||||||||||
3 50th percentile queue: length estimated in feet on Washington Street in the peak direction (AM: eastbound, PM: westbound). |
|
|||||||||||
4 95th percentile queue: length estimated in feet on Washington Street in the peak direction (AM: eastbound, PM: westbound). |
|
|||||||||||
5 Congested approach: any approach of the intersection evaluated as operating at LOS F. |
|
|||||||||||
|
||||||||||||
In general, the existing lane assignments and timing settings for the six intersections all appear to be appropriate. They were evaluated as operating at an acceptable level of service (LOS) E or better. However, Synchro signal timing optimization tests indicated that the signal timings of three of the intersections could be adjusted slightly in order to improve pedestrian safety or traffic operations.
The three intersections are:
Table 6 summarizes the capacity analyses for the three intersections with the proposed signal timing adjustments under existing traffic conditions.
TABLE 6
Intersection Capacity Analyses
Existing Conditions with Signal Timing Adjustments
Name of |
AM Peak Hour |
|
PM Peak Hour |
||||||||
|---|---|---|---|---|---|---|---|---|---|---|---|
LOS1 |
Avg. |
50th |
95th |
Cong. |
|
LOS |
Avg. |
50th |
95th |
Cong. |
|
Adams Street./ |
C |
27.4 |
250 |
325 |
NB |
C |
23.3 |
30 |
120 |
NB |
|
Crafts Street |
E |
66.0 |
215 |
280 |
SB |
D |
45.3 |
325 |
410 |
None |
|
Lowell Avenue |
C |
25.5 |
115 |
260 |
None |
|
C |
25.9 |
145 |
300 |
None |
1 Level of service: A to F based on 2010 Highway Capacity Manual criteria. LOS F is considered undesirable in urban areas. |
|||||||||||
2 Average delay at the intersection: estimated in seconds per entering vehicle. |
|||||||||||
3 50th percentile queue: length estimated in feet on Washington Street in the peak direction (AM: eastbound, PM: westbound). |
|||||||||||
4. 95th percentile queue: length estimated in feet on Washington Street in the peak direction (AM: eastbound, PM: westbound). |
|||||||||||
5. Congested approach: any approach of an intersection evaluated as operating at LOS F. |
|||||||||||
MPO staff also conducted future-year analyses based on projected traffic conditions for an approximately 10-year period for the horizon year 2025. One major concern about future-year conditions is the MassDOT’s plan to reinstate tolls at I-90 Exits 16 and 17.11
Taking this recent development into consideration, the staff developed two sets of future-year projections for this study. The first set is a trend-extending projection that assumes that the toll reinstatement would have a minimal impact on future-year conditions. It predicts that the study corridor would have 0.3 percent annual traffic growth in the AM peak hour and 0.4 percent annual growth in the PM peak hour.12
The second set assumes that toll reinstatement would have a significant impact on the study corridor. Based on a previous MPO study of an adjacent area, the staff estimated that toll reinstatement would cause an increase in total traffic during the peak hours of approximately 5 percent in 2025.13
Table 7 summarizes the total percentage of traffic growth from 2014 to 2025 for each of the peak-hour models.
TABLE 7
Future-Year (2025) Traffic Growth Projections
2014–25 Total Growth |
AM Peak Hour |
PM Peak Hour |
|---|---|---|
Moderate traffic growth |
3% |
5% |
Significant traffic growth |
8% |
10% |
Based on the projections, the staff analyzed three different future-year scenarios:
Table 8 summarizes capacity analyses of six major intersections in these scenarios. For the scenarios that use existing layouts, signal timings were adjusted within reasonable ranges to accommodate future traffic conditions. In general, traffic would deteriorate from the existing conditions but would still operate at an acceptable LOS (of E or better) at all locations.
TABLE 8 Future-Year (2025) Capacity Analyses
|
|||||||||||
|---|---|---|---|---|---|---|---|---|---|---|---|
Name of |
AM Peak Hour |
|
PM Peak Hour |
||||||||
LOS1 |
Avg. |
50th |
95th |
Cong. |
|
LOS |
Avg. |
50th |
95th |
Cong. |
|
Lowell Avenue |
C |
26.5 |
130 |
270 |
None |
C |
27 |
155 |
350 |
None |
|
Walnut Street |
D |
39.8 |
325 |
460 |
None |
D |
41.1 |
170 |
620 |
None |
|
Crafts Street |
E |
70.1 |
410 |
540 |
SB |
D |
50.7 |
350 |
440 |
SB |
|
Adams Street/ |
C |
33.6 |
265 |
345 |
NB |
C |
28 |
100 |
130 |
NB |
|
Jackson Road |
D |
50.2 |
100 |
150 |
None |
C |
28.5 |
405 |
505 |
None |
|
Church Street |
C |
22.5 |
210 |
600 |
None |
|
C |
23.6 |
190 |
585 |
None |
Scenario 2: Existing Corridor Layout with Significant Traffic Growth |
|||||||||||
Name of |
AM Peak Hour |
|
PM Peak Hour |
||||||||
LOS |
Avg. |
50th |
95th |
Cong. |
|
LOS |
Avg. |
50th |
95th |
Cong. |
|
Lowell Avenue |
C |
27.9 |
145 |
285 |
None |
C |
28.8 |
170 |
385 |
None |
|
Walnut Street |
D |
42.9 |
390 |
500 |
None |
D |
48.3 |
195 |
660 |
None |
|
Crafts Street |
E |
71.4 |
460 |
595 |
SB |
E |
56.8 |
375 |
470 |
SB |
|
Adams Street/ |
D |
46.8 |
290 |
380 |
NB |
D |
39.4 |
120 |
150 |
NB |
|
Jackson Road |
D |
53.2 |
100 |
150 |
None |
D |
35.6 |
435 |
580 |
None |
|
Church Street |
C |
24.9 |
240 |
650 |
None |
|
C |
30.8 |
225 |
635 |
None |
Scenario 3: Proposed "Road Diet" Layouts with Significant Traffic Growth |
|||||||||||
Name of |
AM Peak Hour |
|
PM Peak Hour |
||||||||
LOS |
Avg. |
50th |
95th |
Cong. |
|
LOS |
Avg. |
50th |
95th |
Cong. |
|
Lowell Avenue |
D |
48.6 |
425 |
900 |
None |
D |
45.5 |
295 |
635 |
None |
|
Walnut Street |
E |
61.1 |
420 |
880 |
SB |
D |
45.2 |
230 |
600 |
None |
|
Crafts Street |
E |
71.4 |
460 |
595 |
SB |
E |
56.5 |
375 |
470 |
SB |
|
Adams Street/ |
D |
46.8 |
290 |
380 |
NB |
D |
39.4 |
120 |
150 |
NB |
|
Jackson Road |
D |
53.2 |
100 |
150 |
None |
D |
35.6 |
435 |
580 |
None |
|
Church Street |
C |
24.9 |
240 |
650 |
None |
|
C |
30.8 |
225 |
635 |
None |
1 Level of service: A to F based on 2010 Highway Capacity Manual criteria. |
|||||||||||
2 Average delay at the intersection: estimated in seconds per entering vehicle. |
|||||||||||
3 50th percentile queue: length estimated in feet on Washington Street in the peak direction (AM: eastbound, PM: westbound). |
|||||||||||
4 95th percentile queue: length estimated in feet on Washington Street in the peak direction (AM: eastbound, PM: westbound). |
|||||||||||
5 Congested approach: any approach of an intersection evaluated as operating a LOS F. |
|||||||||||
The proposed “road diet” layouts include two major modifications:
As shown in Table 8, the “road-diet” scenario would maintain the same levels of service at all of the locations except the Walnut Street intersection. However, the Walnut Street intersection would operate at an acceptable LOS of E during peak hours.14 Most significantly, the safety and operations of pedestrians, cyclists, and vehicles in the entire corridor would be greatly improved under the “road diet” scenario.
Based on the above analyses, MPO staff developed a series of short- and long-term improvements to address the identified safety and operational problems. The short-term improvements could be implemented within a year, at relatively low cost. The long-term improvements are generally more complicated and cover large areas, which would require extensive planning and design efforts, as well as sufficient funding.
In the short term, a number of improvements could be considered for the corridor in order to enhance safety for pedestrians and cyclists and to moderately improve traffic operations. These improvements are:
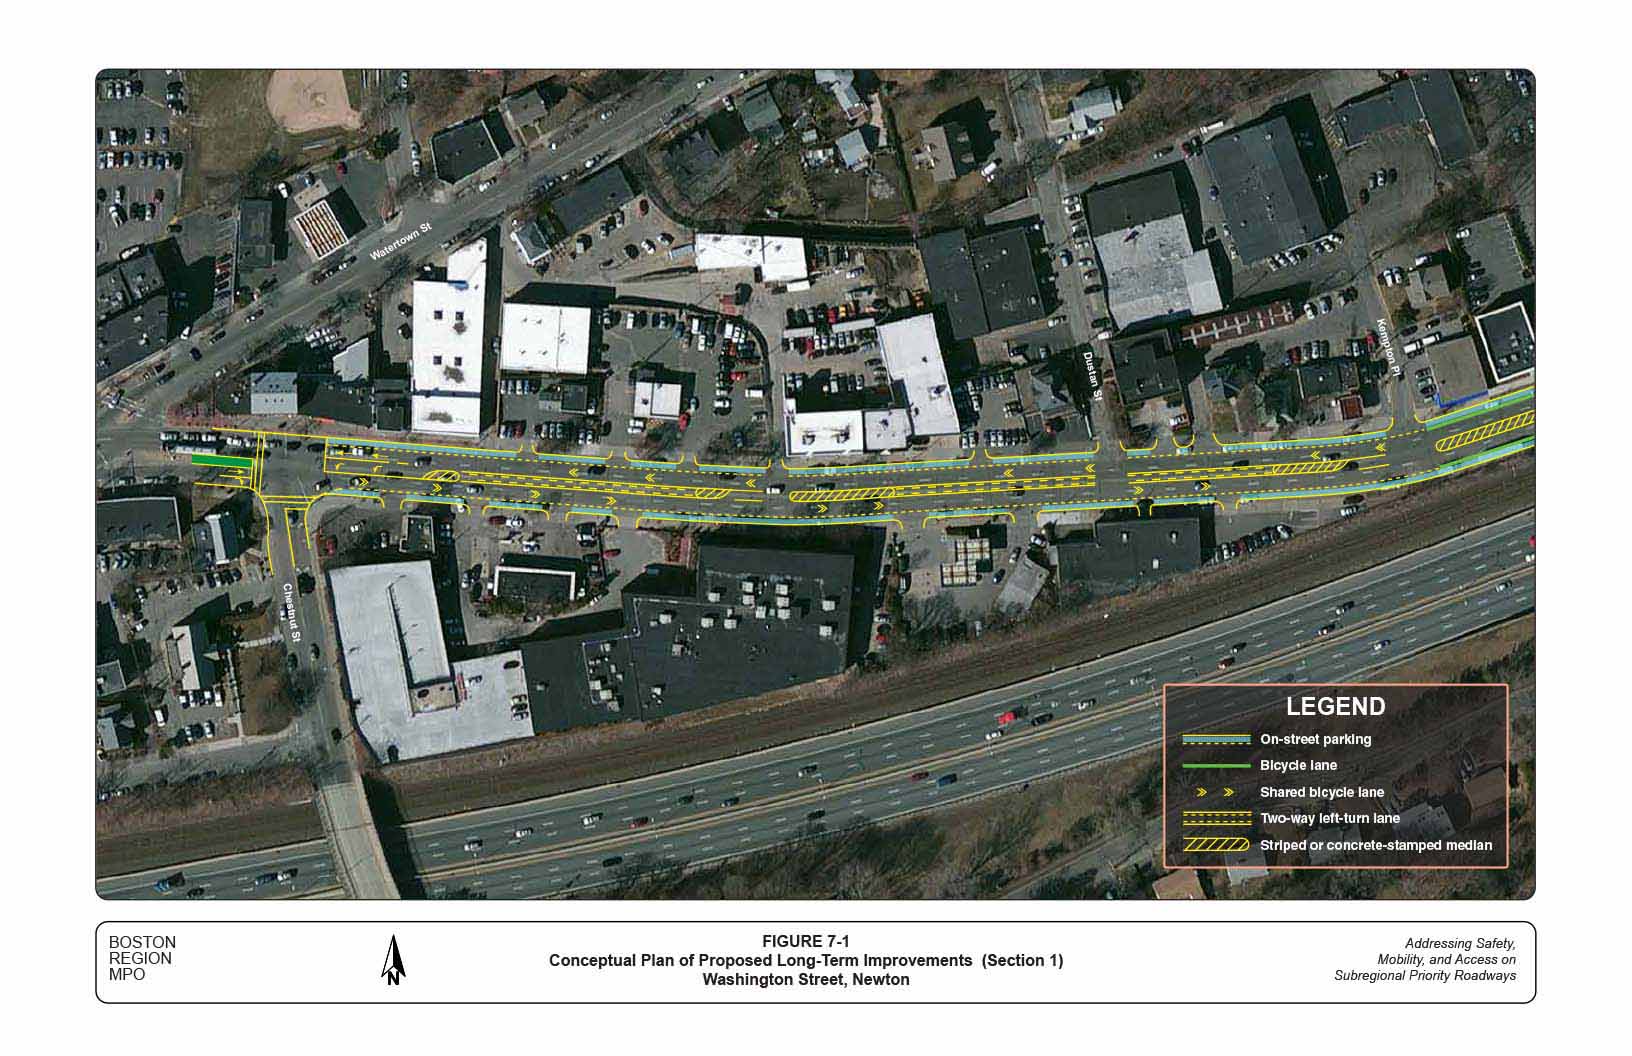
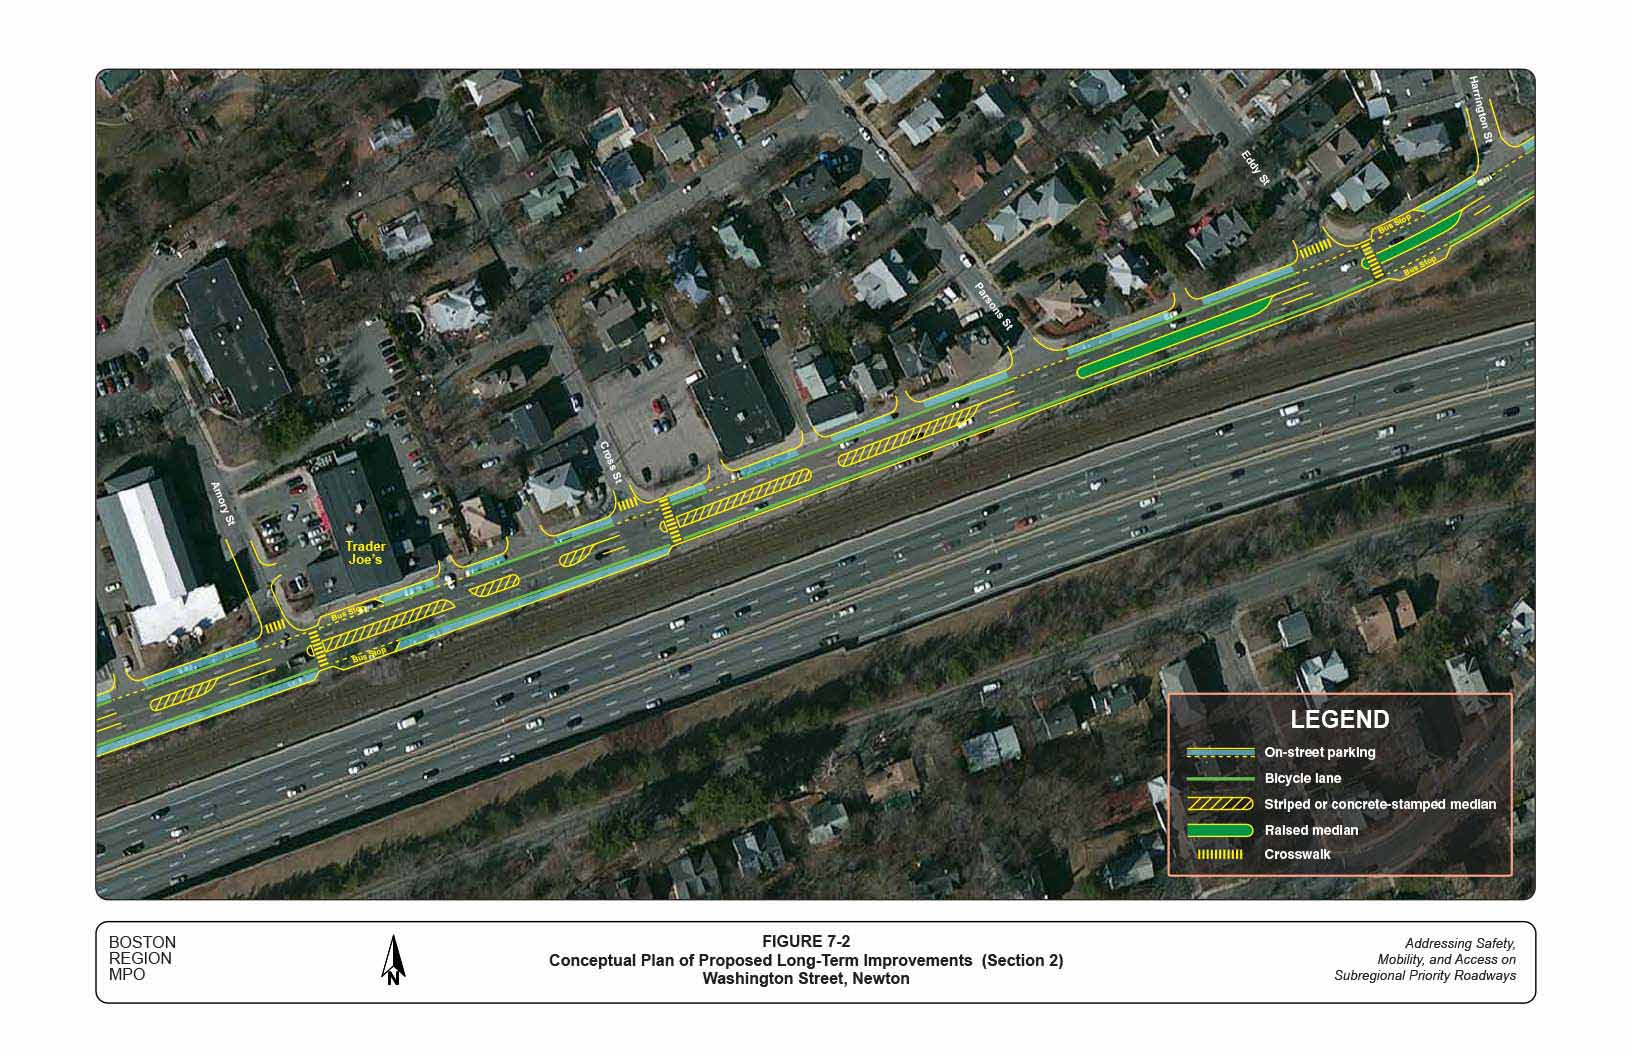
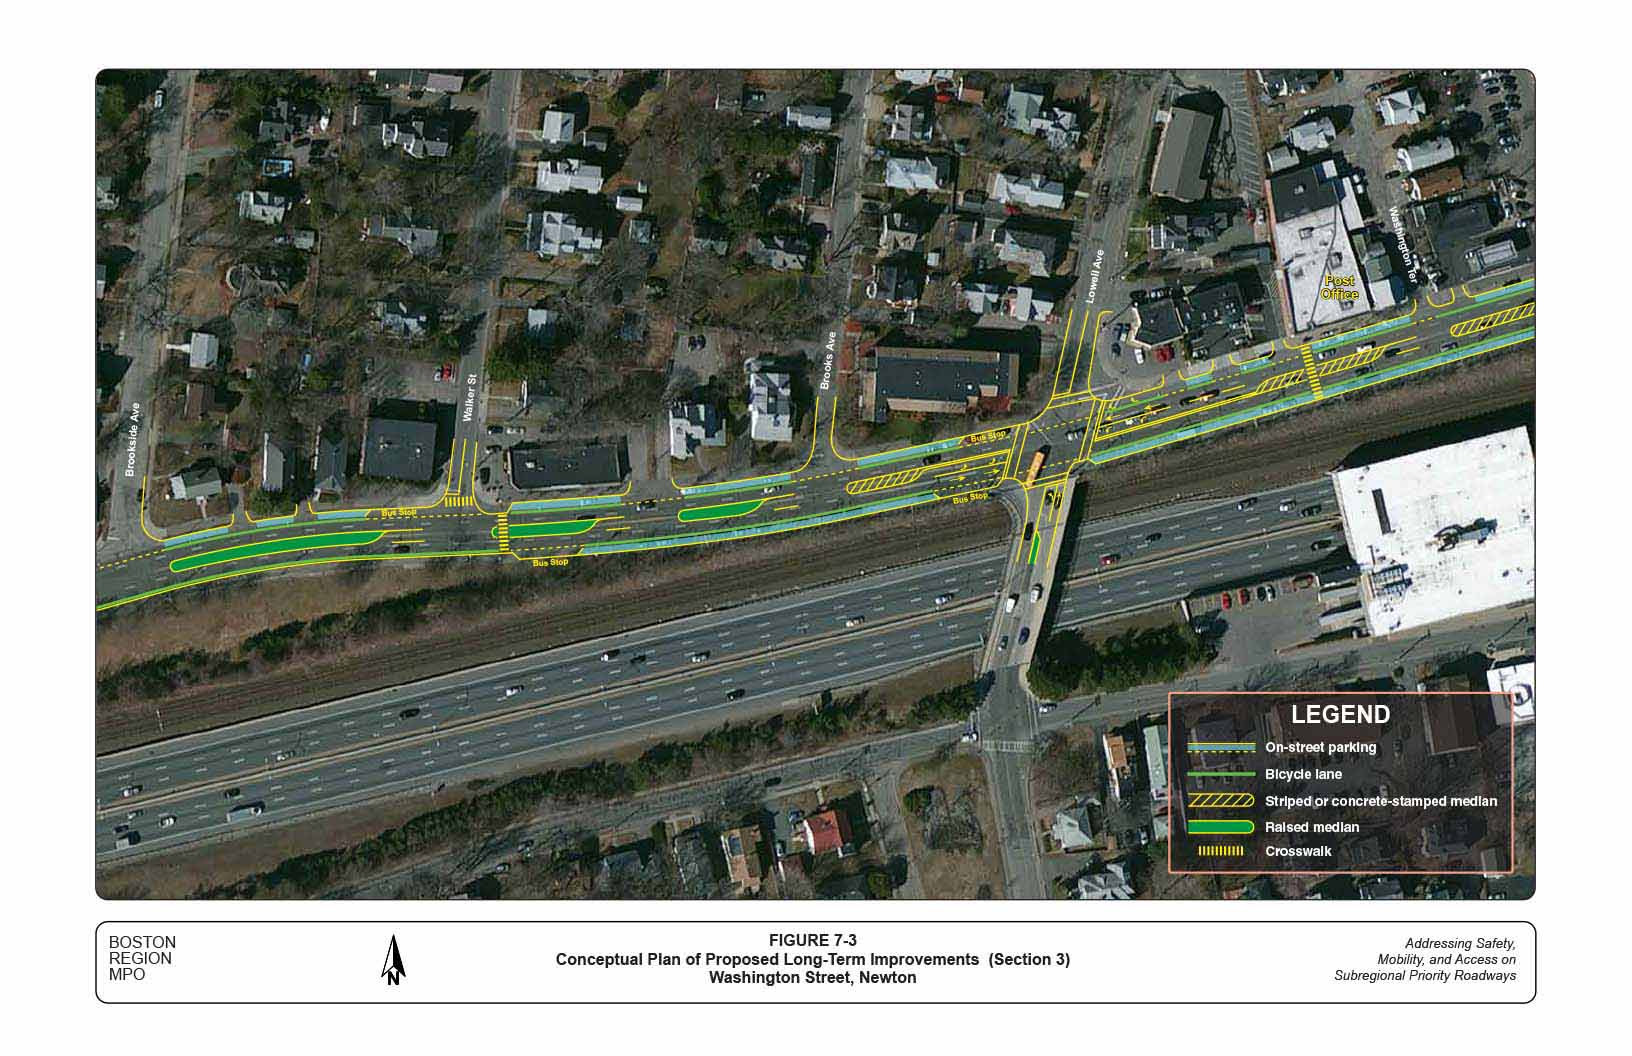
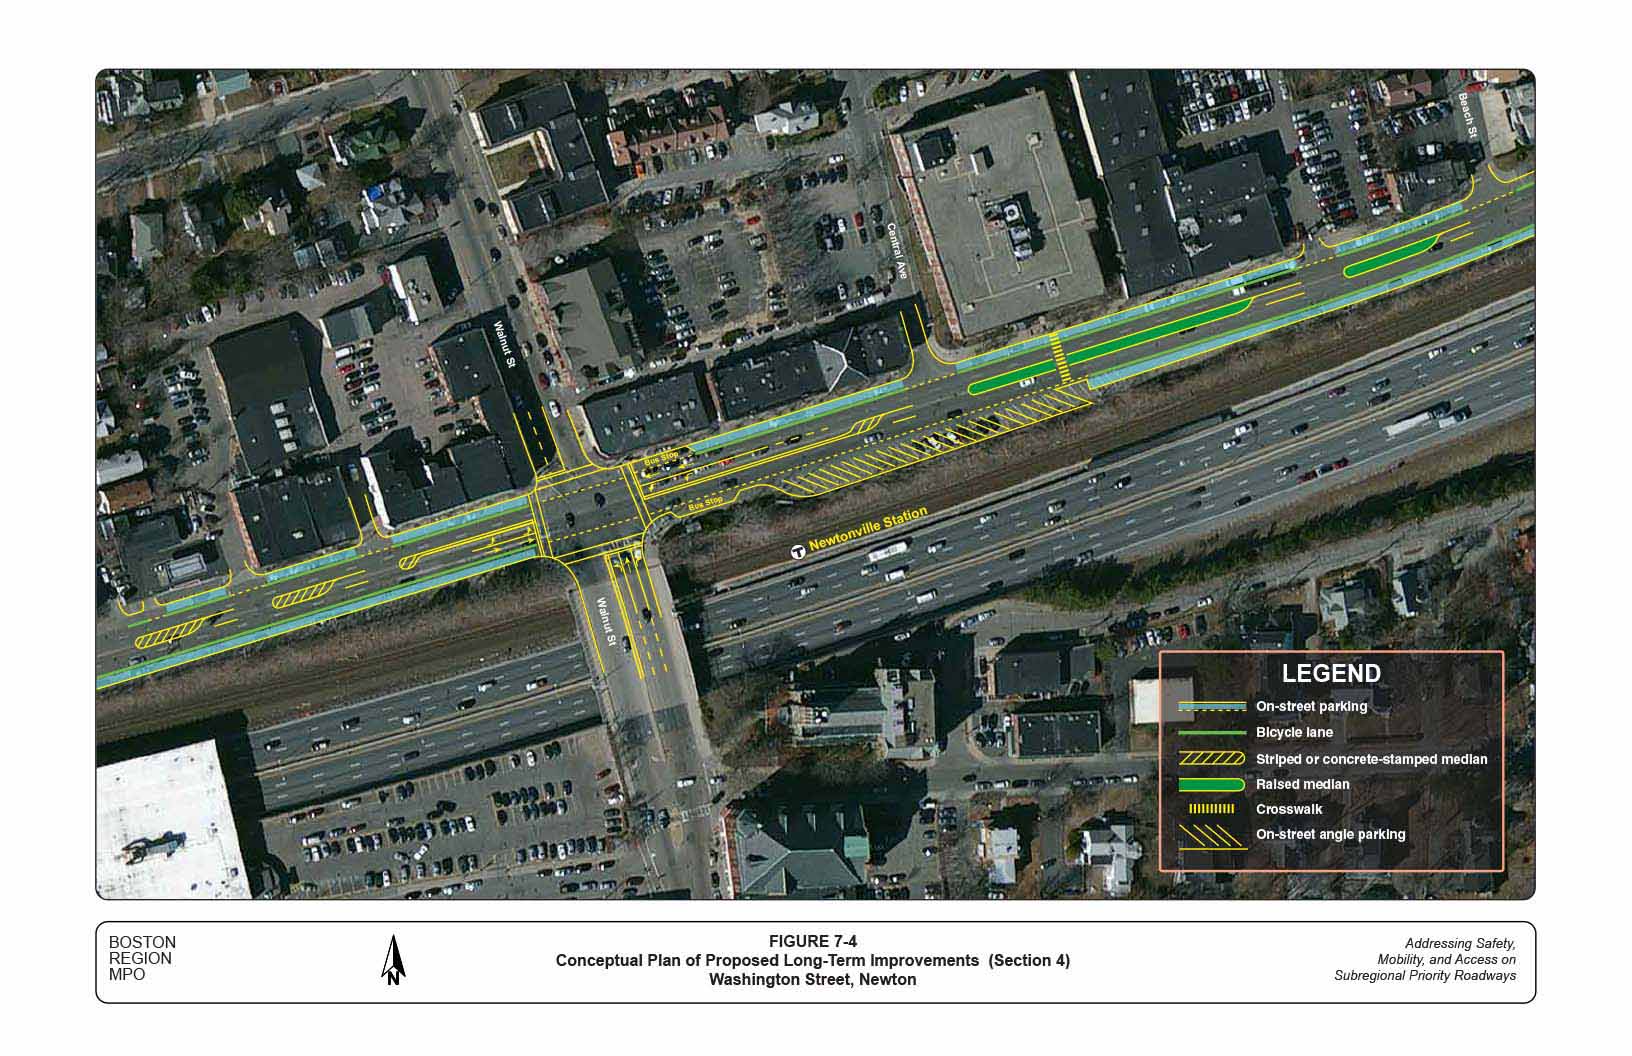
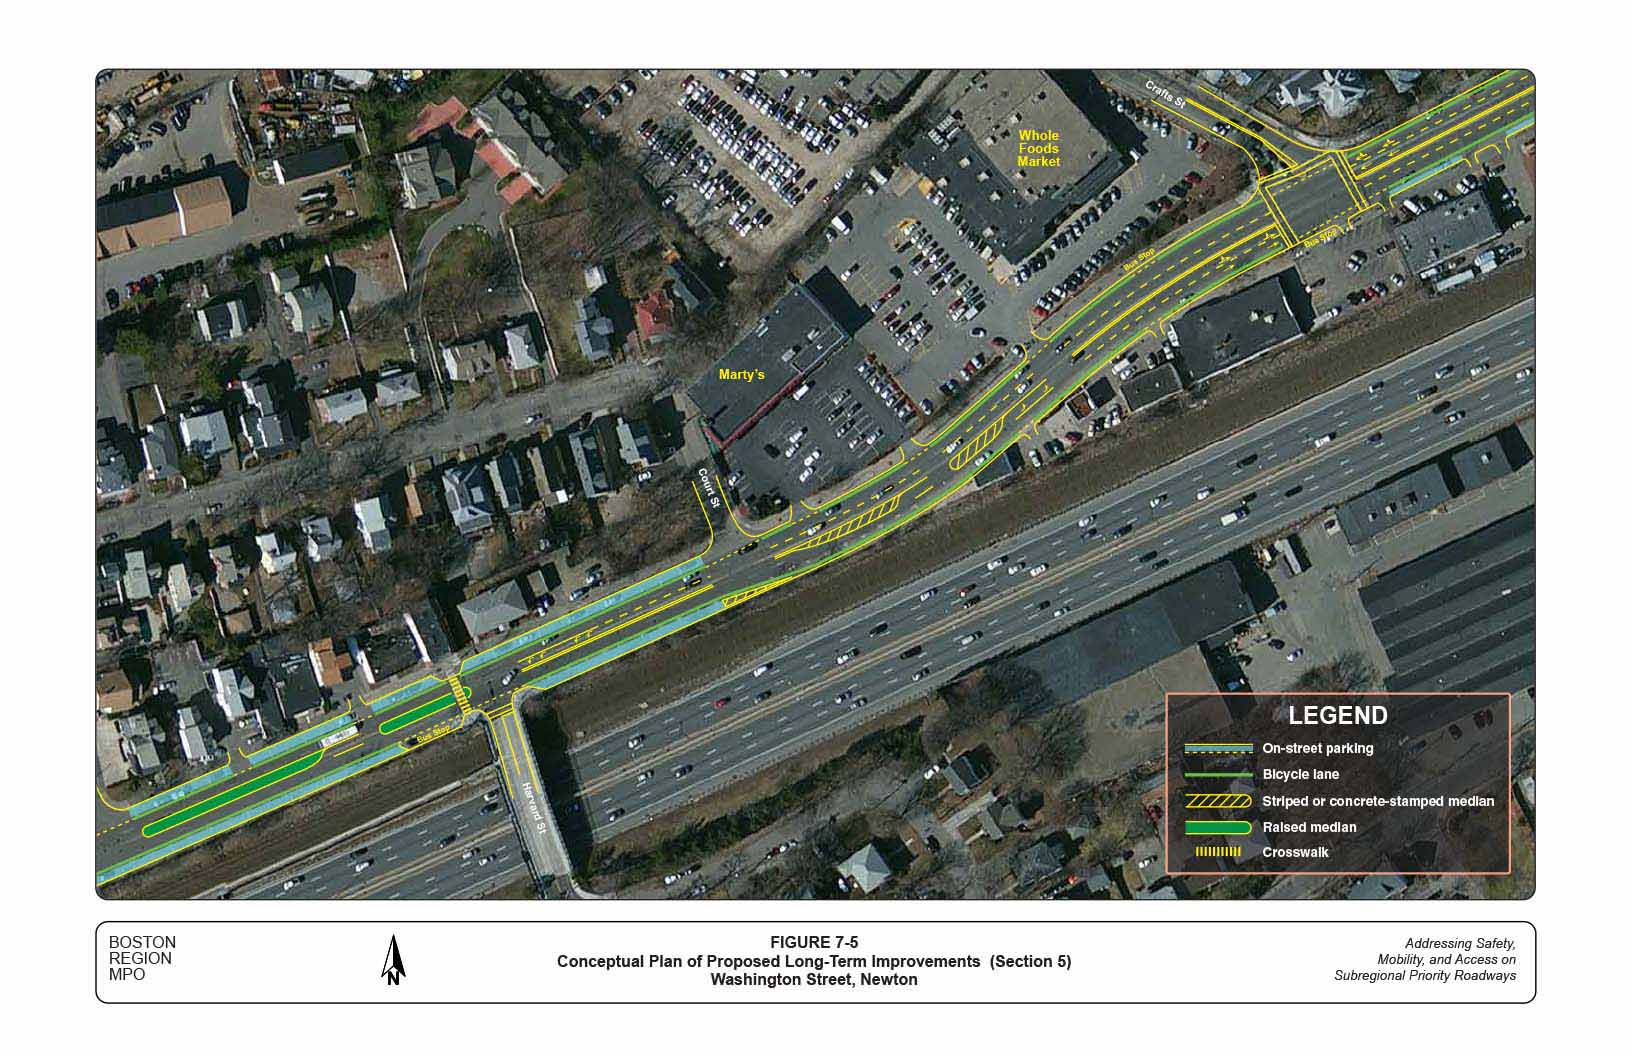
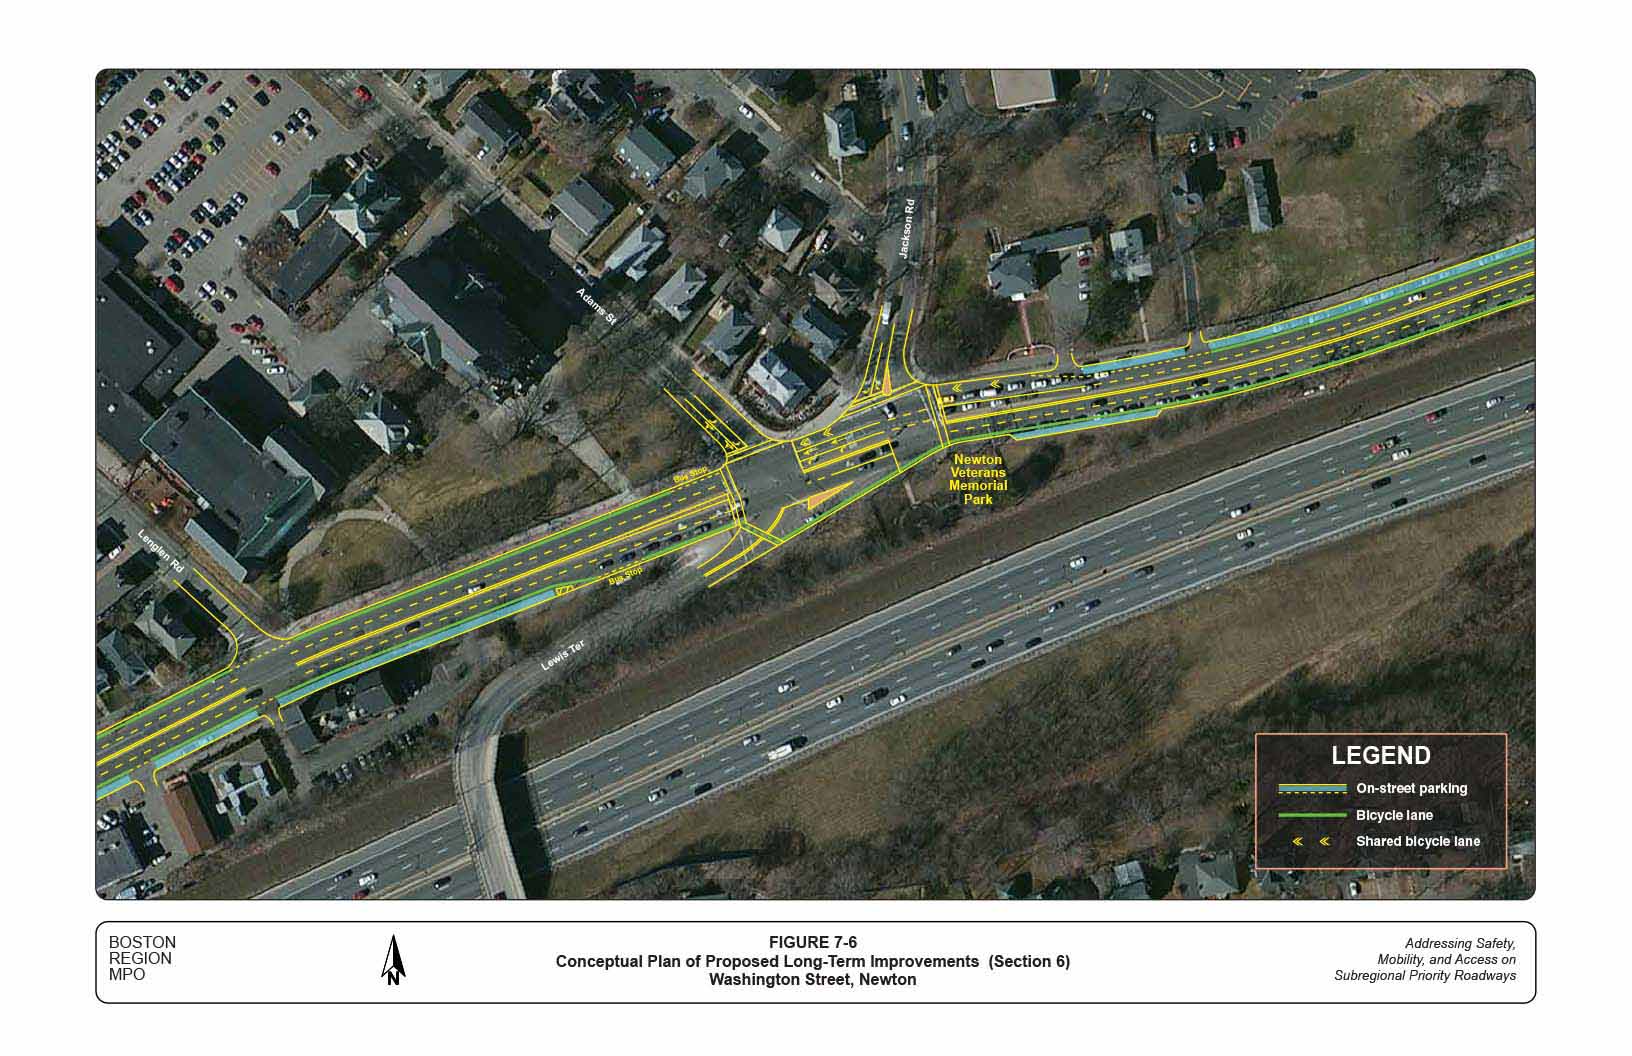
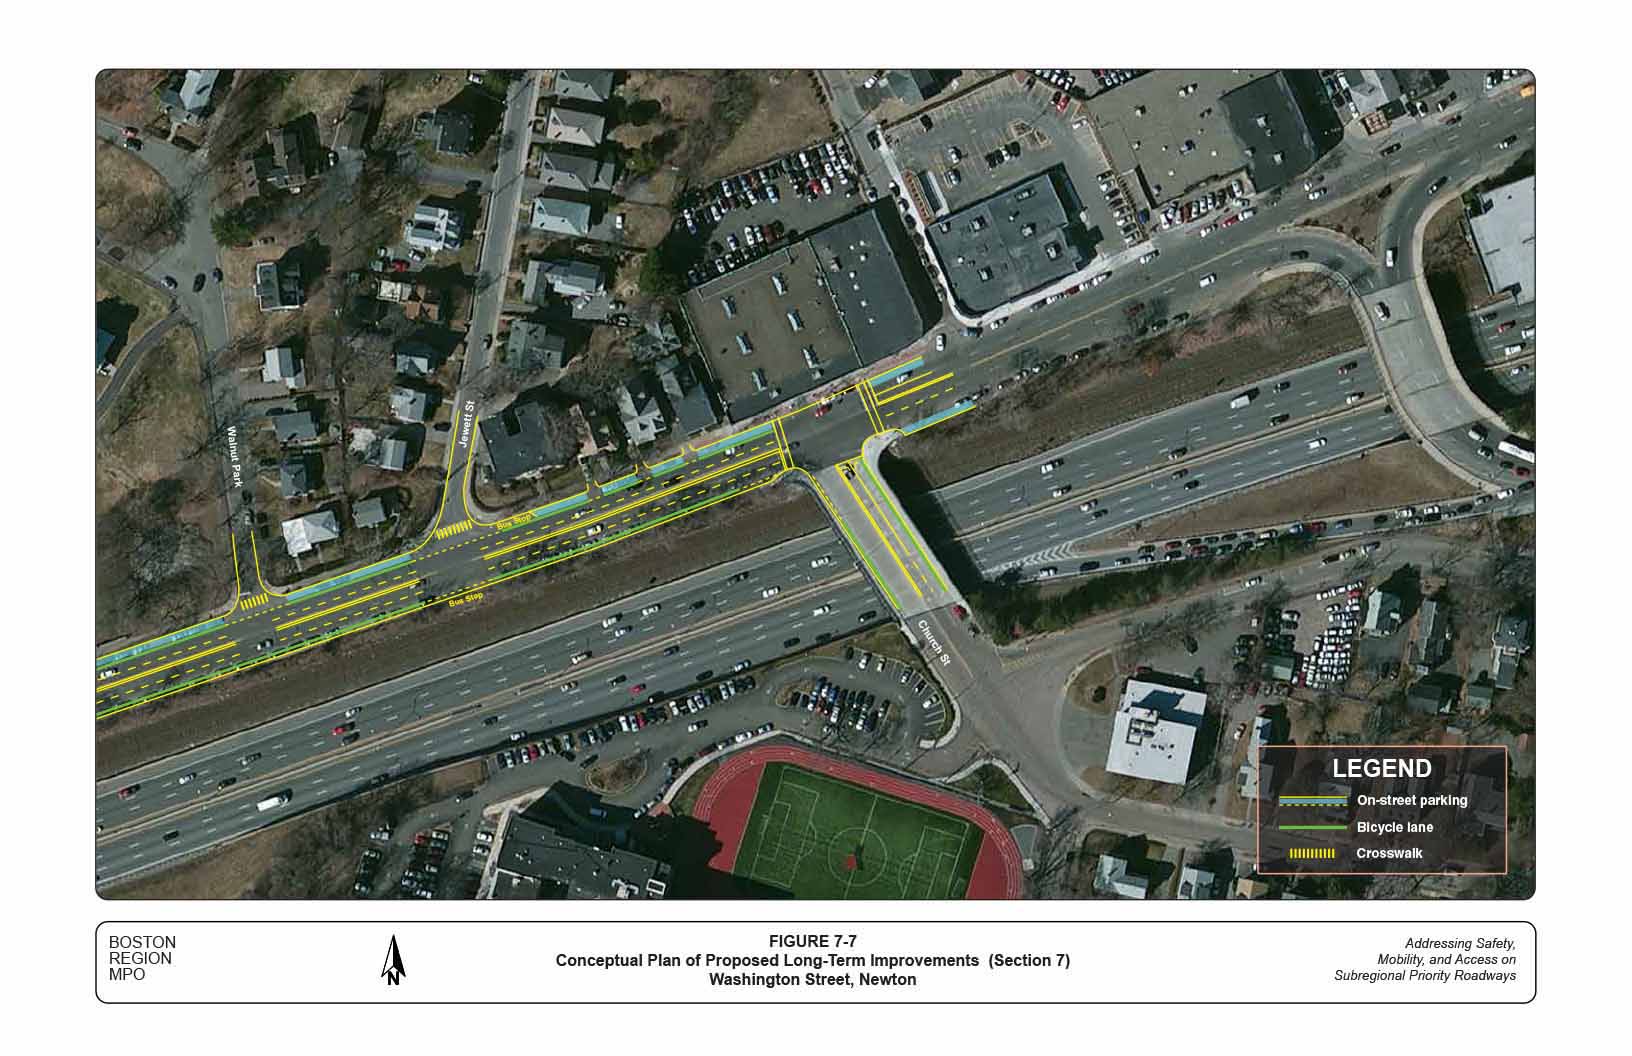
Figures 7-1 to 7-7 show the locations and layouts of the proposed long-term improvements in a series of conceptual plans from west to east within the study corridor. The conceptual plans were not created to scale, but in approximate proportion, in order to show how the proposed improvements would relate to their surroundings. For the roadway cross-sections related to these conceptual plans, please refer to Figures 6-1 and 6-2.
Major proposed improvements include:
In addition, the following items should be considered at the design stage:
For this study, MPO staff performed a series of safety and operations analyses, identified safety and operational problems, and proposed a number of short- and long-term improvements to address the identified problems in the study corridor.
The recommended short-term improvements include:
These improvements are generally low-cost and could enhance safety for pedestrians and cyclists and improve traffic operations. They should be implemented as soon as funding resources can be allocated.
The conceptual plan for long-term improvements provides a vision that would accommodate all users and would significantly enhance their safety, mobility, and access in the corridor. The expected benefits from some of the major proposed long-term improvements include:
In addition, the corridor would benefit from a comprehensive parking and access management program. Lighting and noise conditions should also be further examined during the design stage.
The entire corridor is under the City of Newton’s jurisdiction. The MPO staff recommends the following implementation stages for consideration based on input from the community:
Implementing the proposed long-term improvements would require sufficient resources. Reconstruction of the entire corridor would cost approximately $12,000,000 to $15,000,000.20 Table 9 shows the approximate costs of the three implementation stages.
This study shows that the corridor has great potential to operate safely and efficiently for all users in various transportation modes and provides a vision for the corridor’s long-term development. The City was advised to conduct community meetings, build consensus among stakeholders, and advance this planning study to the design stage. It will require significant effort and collaboration on the part of all stakeholders, including residents and owners of adjacent developments, the MBTA, and MassDOT, to achieve the vision.
TABLE 9
Corridor Construction Cost Estimation
Implementation |
Approximate |
Major Improvement Items |
Approximate Cost |
|---|---|---|---|
West Section |
0.7 miles |
Roadway reconstruction and restriping, median and turning-lane installation, |
$4,000,000 –- $5,000,000 |
Middle Section |
0.5 miles |
Roadway reconstruction and restriping, median and turning lane installation, intersection geometry modification and traffic signal upgrade (3 locations), sidewalk widening, curb extension and crosswalk installation, street lighting upgrade, parking meter upgrade, roadside landscaping |
$5,000,000 – $6,000,000 |
East Section |
0.6 miles |
Roadway reconstruction and restriping, intersection traffic signal upgrade (3 locations), sidewalk paving, street lighting upgrade, parking meter upgrade, roadside landscaping |
$3,000,000 –- $4,000,000 |
All Sections |
1.8 miles |
All the above items |
$12,000,000 – 15,000,000 |
The implementation process must ensure that all parties have consensus about how the recommendations can be realized in a resourceful manner. The City has to work with MassDOT Highway Division District 6 to initiate the project, obtain favorable review from MassDOT’s Project Review Committee, and identify potential funding resources through MassDOT and the Boston Region MPO.
Appendix I details the actions that are required in various steps of MassDOT’s project development process, including a schematic timetable of the steps. Information regarding the project development process can also be found on MassDOT’s website, at www.massdot.state.ma.us/planning/Main/ PlanningProcess/ProjectDevelopmentProcess.aspx and at www.massdot.state.ma.us/Portals/8/docs/designGuide/CH_2_a.pdf.
CW/cw
1 The location has a segment crash rate (crashes per million vehicle-miles traveled) higher than the statewide average for its functional class.
2 Off-street parking is limited in the corridor. They are mainly associated with three major commercial developments: Whole Foods Market, Marty’s, and Trader Joe’s.
3 These approximate parking occupancy data were derived from quick observations during a number of site visits between April and July, not from actual counting in a continuous period or at different periods of a day.
4 In this study, the term “pedestrian crashes” refers to the crashes that involve at least one vehicle and one pedestrian, and the term “bicycle crashes” refers to crashes involving at least one vehicle and one bicycle. No crashes involving at least one bicycle or one pedestrian were identified from the available data.
5 The intersection was reconstructed in 2012; countdown pedestrian signals were installed at that time.
6 This percentage does not include some rear-end collisions that might have been caused by a vehicle on Washington Street waiting to turn into adjacent developments.
7 Data shown in Table 4 are the average of three weekdays’ observations from April 7 to 9 in 2014. The 85th percentile speeds were derived from spot speed data collected from automatic traffic recorders. To establish or modify speed controls, MassDOT requires that data be collected using radar or laser guns at critical locations for an area not to exceed 0.25 miles, in addition to vehicle trial runs in the study area.
8 MassDOT procedures for speed zoning require that at speed observation locations, the established safe speed shall not be more than 7 mph below the 85th percentile speed, and not higher than the 95th percentile speed. See Procedures for Speed Zoning on State and Municipal Roadways, MassDOT Highway Division, May 2012.
9 The use of a three-lane cross-section such as this is not limited to roadways with a daily traffic volume of fewer than 20,000 vehicles. Its application depends on a number of factors, including traffic flow patterns, the spacing of major intersections, adjacent land uses, and consideration of modes other than motor vehicles. A recent MassDOT project for improving Needham Street in Newton, which carries about 25,000 vehicles per weekday, had proposed a similar three-lane cross-section.
10 Synchro Version 8.0 was used for the analyses. This software is developed and distributed by Trafficware Ltd. It can perform capacity analysis and traffic simulation (when combined with SimTraffic) for an individual intersection or a series of intersections in a roadway network.
11 In June 2014, MassDOT announced a comprehensive tolling plan for additional Interstate and controlled-access state highways. The plan includes applying AET (All-Electronic Tolling) at the two I-90 exits, potentially within the next two years. AET is a form of toll collection that allows drivers to pay their toll without stopping or slowing down.
12 The projection was derived from the Boston Region MPO’s most recent 2035 regional travel demand model. MPO staff reviewed the growth at all of the major intersections in the corridor and calculated the average annual growth rate for the study corridor.
13 The estimation was derived from the modeling data in the Boston Region MPO’s study, Newton Corner Rotary Study, Phase II, January 8, 2009.
14 The intersection appears to have room for some layout modifications if that is necessitated by further unexpected traffic growth from the toll reinstatement or an adjacent Austin Street project. Further engineering studies could also examine the feasibility of adding concurrent pedestrian signal phasing at the functional design stage.
15 On July 26, 2014, MPO staff drove along the corridor to survey nighttime roadway conditions and observed about four to five street lights were not working.
16 Manual on Uniform Traffic Control Devices, Section 3B.18: Crosswalk Markings, 2009 Edition with Revisions 1 and 2, Federal Highway Administration, US Department of Transportation, May 2012.
17 The parking removal would provide space for continuous dedicated bicycle lanes in the corridor. Meanwhile, most of the on-street parking in the business districts would be preserved.
18 The traffic median would be concrete-stamped or striped in the business districts and would be raised in the residential districts of the corridor.
19 The existing angle parking is substandard, with insufficient vehicle backing space. A number of crashes, including one involving a pedestrian, occurred in that parking area in the past three years. Staff performed a preliminarily examination of two options in this study. The first is to convert the angle parking to parallel parking. It would eliminate about half of the existing spaces but would provide more room for wider sidewalks on both sides of Washington Street. The second option is to convert it to “reverse angle parking, which is a type of angle parking that requires vehicles to back into parking spots instead of pulling into them. It allows drivers to make eye contact with pedestrians and cyclists when they exit their spots and is thus considered safer than the usual angle parking. The conversion would not eliminate any of the existing parking spaces. However, it would require educating the public about its operations, as it is not widely used in this country and many drivers may not be familiar with and skilled in its operations.
20 At this preliminary planning stage, the cost was approximated from the general expenses of similar projects. The estimation is only for design and construction; it does not include right-of-way, utility relocation, or other contingency costs.