Carbon Dioxide, Climate Change, and the Boston Region MPO: 2012 Update
Project Manager
Anne McGahan
Project Principal
Pam Wolfe
Graphics and Cover Design
Jane Gillis
Kim Noonan
The preparation of this document was funded in part through grants from the Federal Highway Administration and Federal Transit Administration of the U.S. Department of Transportation. The contents of this report do not necessarily reflect the official views or policies of the U.S. DOT.
Central Transportation Planning Staff
Directed by the Boston Region Metropolitan
Planning Organization. The MPO is composed of
state and regional agencies and authorities, and
local governments.
September 2012
To request additional copies of this document or
copies in an accessible format, contact:
Central Transportation Planning Staff
State Transportation Building
Ten Park Plaza, Suite 2150
Boston, Massachusetts 02116
(617) 973-7100
(617) 973-8855 (fax)
(617) 973-7089 (TTY)
ctps@ctps.org
www.bostonmpo.org
In 2007, the Boston Region Metropolitan Planning Organization (MPO) requested that its staff begin gathering information on climate change and its impacts in the Boston area. At that time it was projected that if climate trends continued, the climate and weather patterns in Boston at the end of the century would be similar to those now found in Virginia or Georgia. 1 In May 2008, MPO staff published the discussion paper Carbon Dioxide, Climate Change, and the Boston Region MPO to inform the MPO and public about climate change issues. The 2008 document can be found on the MPO’s website at http://www.ctps.org/bostonmpo/4_resources/1_reports/1_studies/4_bicycle/climate_change.pdf.
Since 2008, more information has become available regarding climate change, including observed changes in climate, new policies and legislation at the national, state, and regional levels, and new MPO activities addressing climate change. The new information will be presented in this paper, along with earlier information that is still applicable.
The MPO’s focus is certain sectors of transportation; therefore this paper will focus on GHG emissions impacts associated with those sectors for which the MPO is responsible: on-road vehicles, transit, bicycles, and pedestrians. Carbon dioxide (CO2) is featured in much of the discussion because it is the greenhouse gas with the greatest emissions.
This document has four parts:
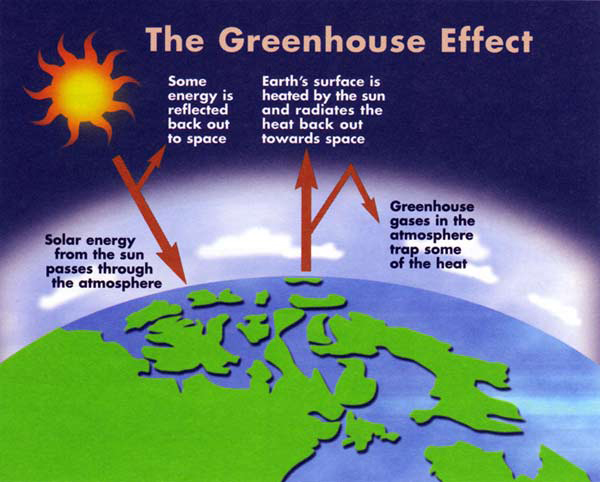
Climate change refers to any significant change in a measure of climate, such as changes in temperature, precipitation, or wind, lasting for an extended period of time. Temperature is affected by certain gases in the atmosphere. Increases in these gases cause a greenhouse effect, where heat is trapped and builds up near the earth’s surface. The term greenhouse gas (GHG) is used because the same effect occurs in greenhouses: the glass allows sunrays in, but much of the heat from those rays is trapped inside the structure. If the atmospheric concentrations of GHGs rise, the average temperature of the lower atmosphere will gradually increase. This process is shown in Figure 1.
FIGURE 1 2
The major GHGs are:
GHGs are referred to as “forcing agents,” because of their ability to change the planet’s energy balance. Certain GHGs are more effective in warming the earth than others. The two most important characteristics in terms of climate impact are how well the gas absorbs energy, thereby preventing the energy from escaping to space, and how long the gas stays in the atmosphere. Global warming potential (GWP) is a measure of the total energy that a gas absorbs over a particular period of time (usually 100 years). CO2 has a GWP of 1 and serves as a baseline for other GWP values. The larger the GWP, the more warming the gas causes. Table 1 shows the GWP and the average length of time in the atmosphere for the major GHGs.
TABLE 1
Greenhouse Gases and Their Attributes 3
Greenhouse Gas |
Global Warming |
Average Length of |
Carbon Dioxide |
1 |
Concentrations persist for thousands of years |
Methane |
21 |
10 years |
Nitrous Oxide |
300 |
100 years |
Fluorinated Gases |
140 to 23,900 |
Indefinite |
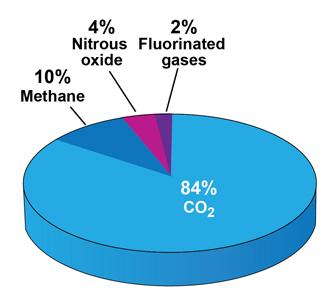
As illustrated in Table 1, methane’s 100-year GWP is 21, which means that methane will cause 21 times as much warming as an equivalent mass of carbon dioxide over a 100-year time period. Although methane has a much higher GWP, CO2 has a much larger overall warming effect because it is more abundant and stays in the atmosphere for a much longer period of time. CO2 and methane are the most predominant GHGs, followed by nitrous oxide and fluorinated gases. The national emission levels are shown in Figure 2.
FIGURE 2
Percentages of National Greenhouse Gas Emissions
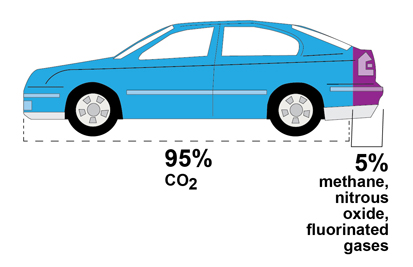
While CO2 is clearly the largest component of overall GHG emissions from all sectors, it is an even larger component of the GHG emissions from passenger vehicles. On average, methane, nitrous oxide, and fluorinated gases represent roughly 5 percent to 6 percent of passenger vehicle GHG emissions, while CO2 accounts for 94 percent to 95 percent, as shown in Figure 3 4
FIGURE 3
Greenhouse Gas Emissions from Passenger Vehicles
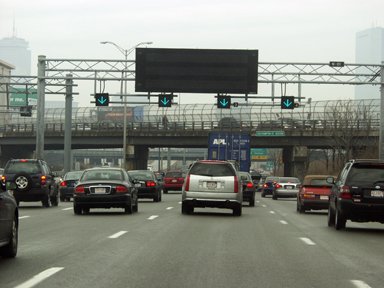
In the Boston Region MPO area, projected reductions in the GHG emissions that are produced by the transportation sector are being estimated by calculating reductions in emissions of CO2 (usually expressed in tons of CO2) associated with the Long-Range Transportation Plan (LRTP) and the Transportation Improvement Program (TIP).
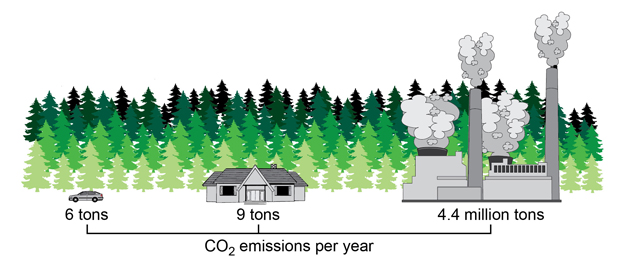
In order to give a sense of the value of a ton of CO2, the following examples are provided. 5 A reference point that may be used while reviewing this information is that one mid-sized sedan automobile weighs approximately two tons.
FIGURE 4
Value of a Ton of Carbon Dioxide
In the May 2008 discussion paper, information on national, regional, and state trends and impacts, including information on potential sea level rise, precipitation, and temperature changes was presented. This paper provides information on observed climate changes and impacts that has been published since the 2008 paper, along with some earlier information that is still applicable.
Reviews by the National Academy of Sciences and the scientific academies of more than 30 countries have concluded that human impact on global warming is occurring.7 Some of the growing evidence of climate change and its risks is summarized below. 8
Total precipitation in the United States has increased by about 5 percent over the past 50 years, but has not been geographically uniform. Conditions are generally wetter in the Northeast, drier in the Southeast, and much drier in the Southwest. Warmer air holds more water vapor, which has led to a measurable increase in the intensity of precipitation events.
Rising temperatures due to increasing GHG concentrations have produced distinct patterns of warming on the Earth’s surface, with stronger warming over most land areas and the Arctic. There has been significant observed warming during both hot and cold seasons: heat waves and record high temperatures have increased across most regions of the world, while cold snaps and record cold temperatures have decreased.
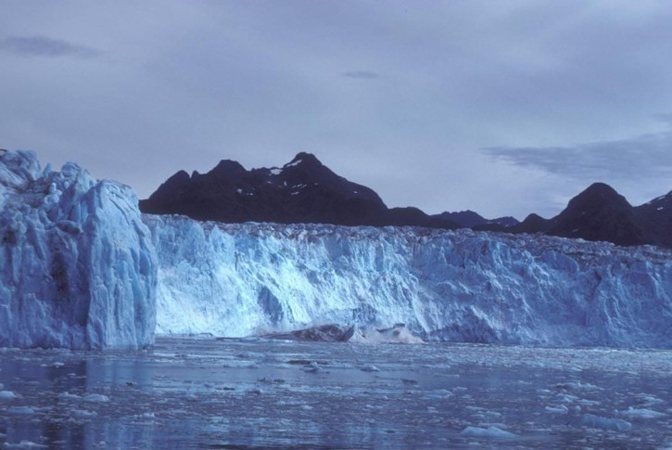 Global warming is having an impact on snow and ice, especially in response to warming across the Arctic. The world’s ice caps and many of its glaciers and ice sheets are melting, which can cause a rise in sea-level. Long-term average winter snowfall and snowpack have declined in many regions. This can affect the aquifer recharge for underground water supplies. More rain in winter could cause more storm water runoff instead of slow recharge.
Much of the excess heat resulting from human-caused GHGs has warmed the world’s oceans during the past several decades. Water expands when it warms, which is another factor leading to sea-level rise.9
As climate change intensifies, the risks and impacts will increase for the built environment, including transportation systems, facilities, and operations. Concerns include rising sea levels, storm surges, and more intense tropical storms, as well as more intense precipitation with record-level flooding.10
In the Boston region, the sea level has increased just under 0.3 meters (one foot) over the past century. Data from the Boston tide gauge station show that the sea level in Boston Harbor rose an average of 2.4 millimeters (0.09 inches) per year from 1921 to 2007, with an overall increase of 26 centimeters (10 inches) during those years.11
Climate models offer varying estimates of future sea level rise. The Intergovernmental Panel on Climate Change (IPCC) 12 predicts that there could be a global average sea level rise of 0.18 to 0.59 meters (0.6 to 1.9 feet) by 2100. 13 This estimate, however, does not factor in the possibility of increased contributions from ice sheets and glaciers. Other studies predict higher sea level rise based on accelerated rates of ice melts; for example, a study by Vemeer and Rahmstorf projects a sea level rise of 0.75 to 1.90 meters (2.5 to 6.2 feet) for the period 1990 to 2100. 14
According to the IPCC, it is very likely that heavy precipitation events will be more frequent in high latitudes, and likely that tropical cyclones (“hurricanes” in the Atlantic Ocean) will become more intense.15 In either case, coastal areas can expect more severe and frequent flooding events.
Climate change can be addressed in two major ways – through mitigation activities and adaptation activities. Climate change mitigation consists of reducing GHG emissions or enhancing the removal of these gases from the atmosphere through carbon sink (i.e., absorption of CO2 by oceans and photosynthesis by terrestrial plants). Transportation-related mitigation strategies include increased vehicle efficiency, low-carbon-fuel standards, and projects and programs to reduce automobile usage.
Adaptation to climate change is a response that seeks to reduce the vulnerability of systems (transportation systems, for the MPO) to the effects of climate change. Transportation infrastructure that is susceptible to sea-level rise and extreme events includes roadways, bridges, tunnels, subways, commuter and freight rail, ferries, bus facilities, airports, and ports. General adaptation strategies for transportation infrastructure include elevating and resizing critical infrastructure and implementing land use changes in vulnerable locations.
This section outlines legislation and policies implemented since 2008 that are relevant to climate change and GHG emissions. The information includes directives at the national, state, and regional levels.
The Moving Ahead for Progress in the 21st Century Act (MAP-21) was passed by Congress on June 29, 2012, and signed by the president on July 6. It promotes performance-based investment decisions in support of national goals and performance measures. The act states that MPOs must establish performance targets that address the performance measures that track progress towards attainment of critical outcomes for the MPO regions. These should be coordinated with relevant state agencies and public transportation providers to ensure consistency. The MPO is required to establish performance targets no later than 180 days after the date that state agencies and the public transportation providers establish their targets.
Under MAP-21, Long-Range Transportation Plans (LRTPs) and Transportation Improvement Programs (TIPs) should be developed through a performance-driven, outcome-based approach to planning for metropolitan areas. As part of the LRTP, the MPO must develop a system performance report and subsequent updates evaluating the condition and performance of the transportation system. The reporting must include the progress achieved in meeting the performance targets in comparison with a baseline. TIPs must include a description of the anticipated effect of the TIP on progress toward achieving the performance targets established in the LRTP that link investment priorities to those performance targets.
The Boston Region MPO’s current LRTP includes the visions and policies established by the MPO. There is a specific MPO vision, with a set of policies, for climate change. Staff are proposing to develop performance measures for each of the MPO vision and policy topic areas, including climate change. Also, there are measures in the LRTP’s Needs Assessment that will contribute information to help monitor GHG emissions, such as roadway and transit congestion levels and transit, bicycle, and pedestrian usage.
In April 2007, the Supreme Court ruled in “Massachusetts v. Environmental Protection Agency (EPA)” that EPA has the authority to regulate heat-trapping gases in automobile emissions. After that ruling, the administrator of EPA found that combined emissions of GHGs from new motor vehicles and new motor vehicle engines contribute to air pollution which may endanger public health or welfare.
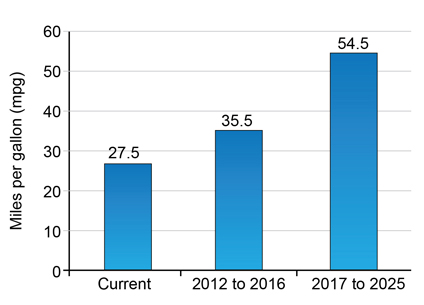
The EPA and the U.S. Department of Transportation’s National Highway Traffic Safety Administration (NHTSA) are working together to develop a national program of harmonized regulations to reduce GHG emissions and improve the fuel economy of light-duty cars and trucks and of medium-duty and heavy-duty trucks. A final rulemaking was issued establishing Corporate Average Fuel Economy Standards (CAFE standards) for 2012 to 2016 vehicles in April 2010. The previous standard was 27.5 miles per gallon (mpg) for cars and 24.1 for light trucks. The new standard to be phased in between 2012 and 2016 is 35.5 mpg fleet average. The agencies are now proposing standards for model years 2017 to 2025 to be a 54.5 mpg average. The CAFE standards are shown in Figure 5. Also, in August 2011, EPA and NHTSA announced the first program to reduce GHG emissions and improve fuel efficiency for medium- and heavy-duty trucks; it will cover model years 2014 to 2017 and vary by truck type.
It is estimated that the effect of these rules combined will be to save approximately 14 billion barrels of oil over the life of the vehicles. The net economic benefit from these regulations is projected to be approximately $500 billion to $660 billion. 16
FIGURE 5
Corporate Average Fuel Economy Standards
Governor Patrick signed the Global Warming Solutions Act (GWSA; formally called the Climate Protection and Green Economy Act) in August 2008. The Act requires reductions of GHG emissions in all sectors to levels 10 to 25 percent below 1990 levels by 2020 and to levels 80 percent below 1990 levels by 2050.
As part of the GWSA, the Executive Office of Energy and Environmental Affairs (EOEEA) developed the Massachusetts Clean Energy and Climate Plan for 2020. This plan set a reduction goal for GHG emissions of 25 percent below 1990 levels by 2020 for all sectors, the majority of which include transportation, buildings, and electricity production. Specific programs addressing transportation emissions that Massachusetts is pursuing to reduce GHG emissions include:
In the Massachusetts Clean Energy and Climate Plan for 2020, a 7.6 percent reduction is projected to be attributed to Massachusetts Department of Transportation (MassDOT) transportation projects and programs.
In addition to that plan, which addresses mitigation measures, the EOEEA developed a parallel plan, the Massachusetts Climate Change Adaptation Report, released in September 2011. General adaptation strategies for transportation infrastructure outlined in the report include:
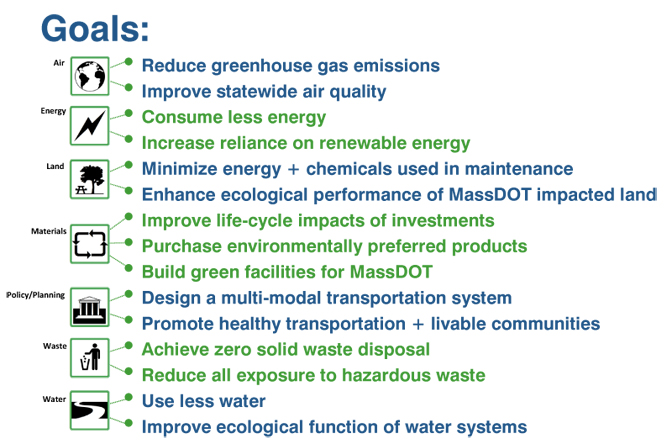
One of the programs in the Massachusetts Clean Energy and Climate Plan is the MassDOT sustainability initiative known as GreenDOT. The GreenDOT policy directive was developed in accordance with the GWSA. Its three goals are:
MassDOT released its GreenDOT Implementation Plan in May 2012. GreenDOT builds on existing policies of the Commonwealth and innovative practices of MassDOT already underway. It references best practices from other state DOTs and transit agencies as benchmarks to match or exceed. The Plan focuses on sustainability practices that are under the direct control of MassDOT. These practices are associated with 15 broad sustainability goals that fall under seven topics; they are presented in Figure 6.
Many of the actions identified in the Plan are, in effect, mitigation measures for climate change. Some include:
Adaptation actions identified in the Plan include:
In addition to the actions identified in the GreenDOT Implementation Plan, MassDOT will be setting a mode shift goal in October 2012 to increase transit, biking, walking, and carpooling.
The MPO will directly help to implement five of the GreenDOT Implementation Plan’s sustainability goals (which fall under three of the topics), through projects and programs in the LRTP and TIP, the MPO’s Livability program, its Bicycle and Pedestrian program, and planning studies:
FIGURE 6
GreenDOT Implementation Plan’s Sustainability Goals, by Topic
The Project Development and Design Guidebook provides designers and decision makers with a framework for incorporating context-sensitive design and multimodal elements into transportation improvement projects. The emphasis is on ensuring that investments in transportation infrastructure foster projects that are sensitive to the local context while meeting the important needs of the people they serve. The guidebook provides methods of supporting safe travel for pedestrians and bicyclists and for drivers and passengers of transit vehicles, trucks, automobiles, and motorcycles. In addition, Directive E-09-005 was issued to give guidance in selecting the width of roadway elements such as lanes, shoulders, and sidewalks so as to accommodate bicyclists and pedestrians.
The Boston Region MPO’s major policy document is its LRTP. The current LRTP is Paths to a Sustainable Region, adopted in September 2011. It defines transportation visions for the future of the region, establishes goals and policies that will lead to the achievement of the visions, and allocates projected revenue to transportation programs and projects that implement the goals and policies.
The MPO has established seven basic visions along with policies to implement the visions. One of the visions specifically addresses climate change. The climate change vision established by the MPO is:
The production of greenhouse gas (GHG) emissions by the transportation sector in this region will be reduced to levels that contribute appropriately to the statewide targets set by the Massachusetts Global Warming Solutions Act. The MPO region will have joined with other entities in Massachusetts and the Northeast to slow and perhaps prevent the onset of serious climate change effects. The MPO, in consultation and cooperation with state and federal agencies planning action on GHG reduction, will have adopted GHG reduction goals and taken the steps necessary to meet them. Critical elements of the region’s transportation infrastructure that may be vulnerable to the impacts of climate change will have been identified and protected.
To meet the vision for reducing GHG emissions and protecting the region’s transportation infrastructure, the MPO will put a priority on programs, services, and projects that:

A critical first step in developing a Long-Range Transportation Plan for the region is to understand the many needs that exist for all of the modes in the region. The Needs Assessment helps to guide the MPO’s decision making about how to address the region’s needs through the LRTP and guides future decision making about which projects to fund in the TIP and which studies to conduct through the Unified Planning Work Program (UPWP).
The Needs Assessment includes information about the existing condition of the various components of the transportation system, how extensively they are used, and their projected use in the future. It also includes a description of the region’s greatest needs, including information that helps the MPO address climate change and reduce greenhouse gas emissions. Examples of this include transit, bicycle, and pedestrian usage for mitigation, and flood zone and sea level rise information for adaptation.
The following section includes information on activities in the MPO process that address climate change. The information includes activities that address both mitigation and adaptation measures. After tools and decision-making processes are described, methods for documenting GHG in the region are presented.
As described above, the region’s needs are highlighted with the MPO’s visions and policies in mind. Climate change is not specifically included and monitored as one of the visions in the Needs Assessment; however, the Needs Assessment does address the needs of the transportation system that will help to address Climate Change: the vehicle-miles of travel and congestion in the region, which contribute to fuel usage and thus ultimately affect GHG emissions in the region. It also includes flood zone and sea level rise information that is helpful in addressing projects that would be subject to climate change adaptation strategies because of vulnerability to climate change impacts.
The Boston Region MPO´s Congestion Management Process (CMP) monitors the performance of transportation facilities in the MPO area, including expressways, arterial roadways, intersections, transit, park-and-ride lots, high-occupancy-vehicle (HOV) lanes, and facilities used for bicycle and pedestrian transportation. This monitoring provides the MPO with the most recent performance information and, for the areas and facilities where congestion, mobility, and safety deficiencies are found, it leads to recommendations for studies to be included in the UPWP and for projects and programs to be implemented in the TIP and LRTP.
The CMP focuses on a multimodal approach to improve the mobility of people and freight and is driven by measurable objectives and performance measures. The CMP identifies:
 Causes of recurring and nonrecurring congestion
All of these emphasis areas help in addressing climate change and reducing GHG emissions.
The MPO maintains a program for identifying transportation infrastructure that may be susceptible to extreme weather and natural disasters – including flooding, hurricane storm surges, earthquakes, and potential sea level rise – and for documenting the location of evacuation routes and emergency support locations for which good access must be maintained.
These data are used for evaluating proposed transportation projects vying for federal funding to determine whether they would enhance the security of the transportation system. The evaluation considers the impact a project would have in terms of enhancing the ability of a facility to withstand extreme weather conditions and continue to be functional, and also what functions it would serve in an emergency, such as providing a means of evacuation or facilitating the movement of emergency responders.
 The MPO uses its visions and policies as the basis for project evaluation criteria used in the project selection process for the LRTP. Climate change is one of the MPO’s vision topics. All projects and programs being considered for funding in the LRTP are evaluated on how they would advance the MPO’s climate change vision. The criteria used in that evaluation are:
As described above, the LRTP Needs Assessment includes information that can be used in this evaluation process.
The TIP is an intermodal program of transportation improvements produced annually by the MPO; it has a four-year horizon. The TIP serves as the implementation arm of the MPO´s LRTP by incrementally programming funding for improvements. Similarly to its evaluation process for the LRTP, the MPO uses its visions and policies as the basis for project evaluation criteria used in selecting projects to be funded with discretionary funds in the TIP. Thus, some of the criteria identify projects that will help slow climate change through reduction of greenhouse gases and projects that will help adapt to the effects of climate change by addressing flooding or improving evacuation routes. The criteria include whether:
The first four criteria listed are used to prioritize projects that will lead to reductions in greenhouse gases. The last criterion is used to prioritize projects that will aid adaptation to climate change impacts such as flooding, sea-level rise, and hurricanes.
The Unified Planning Work Program (UPWP), a document that is produced annually, lists all of the regional-level surface-transportation planning projects expected to be undertaken in the region in a federal fiscal year. This document spells out the MPO’s ongoing planning activities and studies, along with the technical support projects that are being conducted by the MPO staff. It also contains, in an appendix, information about regional-level surface-transportation planning projects currently being conducted by entities other than the MPO, such as state transportation agencies and municipalities.
As in the LRTP and the TIP, UPWP projects are evaluated in light of the MPO’s visions and policies. The policies considered during the project selection process for the UPWP that address climate change are:
The 2008 discussion paper outlined MPO programs in place at the time that helped to reduce CO2 emissions. It also recommended possible actions and partnership opportunities that the MPO could undertake for CO2 reduction. The possible MPO actions and partnership opportunities fell under three categories:
Table 2 shows these recommended actions and the status of the MPO’s implementation of them.
TABLE 2
Status of Recommended Future MPO Activities in 2008 Discussion Paper
CATEGORY |
POSSIBLE ACTION OR |
STATUS |
|
Creating a more efficient transportation system that has lower GHG emissions |
MPO Actions: |
|
|
Model CO2 with travel demand model |
Ongoing in LRTP & TIP |
||
Add CO2 as criteria in transportation decisions |
Ongoing in LRTP & TIP |
||
Use LRTP & TIP criteria to support GHG-reducing projects & programs |
Ongoing |
||
Fund pedestrian & bicycle facilities that are likely to reduce auto trips |
Ongoing in LRTP & TIP |
||
Create CMAQ-funded program to implement minor pedestrian, bicycle, and congestion-relieving improvements |
Ongoing: Clean Air & Mobility Program |
||
Conduct inventory of climate change–curbing activities undertaken by other agencies and develop best practices |
No action |
||
Support transit agencies in efforts to increase parking at train stations |
Ongoing |
|
|
Favor transit investments near commercial or residential development |
Ongoing |
|
|
MPO Partnership Opportunities: |
|
|
|
Maintain and upgrade public transit and improve efficiency of transit operation |
Ongoing |
|
|
Support ride-sharing/ carpool programs/ HOV lanes |
Ongoing |
|
|
Promote fuel efficiency and cleaner vehicles |
MPO Actions: |
|
|
Fund transit vehicle retrofits and purchase of cleaner vehicles |
Ongoing |
|
|
Upgrade bridges to lift weight restrictions for freight |
Ongoing |
|
|
MPO Partnership Opportunities: |
|
|
|
Support acquisition of clean and fuel-efficient vehicles for public fleets |
Ongoing |
|
|
Promote the use of cleaner diesel equipment on construction projects |
Ongoing by MassDOT |
|
|
Support initiatives to eliminate unnecessary idling |
Ongoing: funding intersection improvements |
|
|
Coordinate transportation with land use decisions |
MPO Partnership Opportunities: |
|
|
Support sustainable redevelopment of urban areas, enabling residents to live near their workplaces or near transit |
Adopted MetroFuture land use scenario |
|
|
Continue to support compact development and discourage sprawl |
Adopted Livability & Climate Change visions & policies |
|
|
The MPO and its partners are continuing the programs that work to reduce GHG emissions and help support adaptation. The programs fall into the six categories described below:
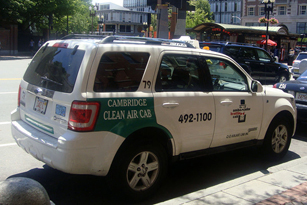 Alternative Fuel Sources: The MPO’s Congestion Mitigation and Air Quality Improvement (CMAQ) and Clean Air and Mobility programs fund projects that support the use of alternative fuel sources. An example is the Cambridge Clean Cabs project, which provided funds to cover the incremental cost of upgrading cab fleets to hybrid vehicles.
As described earlier, the Commonwealth and the MPO are calculating CO2 emissions as an indicator of GHG emissions. They are working together to track emissions at the state, regional, and project levels. MassDOT has coordinated with all of the state’s MPOs on the implementation of GHG tracking and evaluation at the state and regional levels through the development of the MPOs’ 2035 Long-Range Transportation Plans (LRTPs), which were adopted in September 2011, and at the project level through the 2013-2016 Transportation Improvement Programs (TIPs), which were adopted in June and July 2012.
To begin tracking CO2 emissions, the Boston Region MPO and MassDOT, using the MPO-region and statewide travel demand models, have estimated the CO2 emissions that will result collectively from all of the recommended projects in all of the Massachusetts MPOs’ LRTPs combined. That project mix was modeled for both 2020 and 2035 using a build vs. no-build analysis. The Boston Region MPO LRTP’s smart-growth land use assumptions were incorporated into the analysis for the Boston region component. The results are provided in Table 3.
TABLE 3
Massachusetts Statewide CO2 Emission Estimates
(in tons per summer day)
|
CO2 Build Emissions |
CO2 No-Build Emissions |
Difference |
2010 |
101,514.4 |
101,514.4 |
n/a |
2020 |
105,747.5 |
105,856.4 |
-108.9 |
2035 |
115,034.1 |
115,028.0 |
6.1 |
As shown above, collectively, all the projects in the LRTPs in the 2020 Build scenario provide a statewide reduction of nearly 109 tons of CO2 per day compared to the base case. However, the 2035 Build scenario shows an increase of about 6 tons of CO2 per day compared to the base case. It should be noted that this analysis measures only projects that are included in the travel demand model.
In addition to monitoring the GHG impacts of capacity-adding projects in the LRTPs, it is also important to monitor and evaluate the GHG impacts of all transportation projects that are programmed in the TIPs. The TIPs includes both the larger, capacity-adding projects from the LRTPs and smaller projects (such as bicycle and pedestrian facilities, shuttle services, and intersection improvements) that are not included in the LRTPs but may nevertheless have impacts on GHG emissions. Another objective of this tracking is to refine the MPOs’ understanding of the different levels of GHG impacts associated with different project types, so that they can use this understanding in prioritizing and programming projects in future TIPs.
MassDOT and the MPOs have developed approaches to identifying the anticipated GHG emission impacts of different project types. All TIP projects have been sorted into two main categories for analysis: projects with quantified impacts and projects with assumed impacts. Projects with quantified impacts consist of capacity-adding projects from the LRTP and TIP projects that can be analyzed. Projects with assumed impacts are those that would be expected to produce only a minor decrease or increase in emissions or to have no CO2 impact.
Capacity-Adding Projects Analyzed Using the Travel Demand Model – This category is capacity-adding projects that are also in the Long-Range Transportation Plan and are analyzed using the travel demand model as described above. No independent TIP calculations were done for these projects.
Other TIP Projects That Are Expected to Have Impacts That Are More than Minor – For these projects, the reduction or increase in the number of tons of CO2 associated with the project is estimated. This estimation is made using spreadsheets provided by the Office of Transportation Planning at MassDOT for the purpose of determining CMAQ eligibility. The spreadsheets include information for calculating volatile organic compounds, nitrogen oxides, carbon monoxide, and carbon dioxide. The data required for these calculations are typically derived from functional design reports submitted for projects at the 25 percent design phase.
The following types of projects are considered to fall into this category:
 Pedestrian and Bicycle Infrastructure – A shared-use path that would enable increased walking and biking and reduce automobile trips.
 Assumed Nominal Decrease or Increase in CO2 Emissions – These are projects that would be expected to produce only a minor decrease or increase in emissions that cannot be calculated with any precision. Examples of such projects include roadway repaving or reconstruction projects that add a new sidewalk or new bike lanes. Such a project would enable increased travel by walking or bicycling, but there may not be data or analysis to support any projections of GHG impacts. Other examples are projects involving intelligent transportation systems (ITS), traffic operational improvements, transit infrastructure, and freight infrastructure.
No CO2 Impact – Projects that do not change the capacity or use of a facility (e.g., a resurfacing project that restores a roadway to its previous condition, or a bridge rehabilitation/replacement that restores the bridge to its previous condition) would be assumed to have no CO2 impact.
The net CO2 impact from all of the projects analyzed in the Boston Region MPO’s 2013-2016 TIP is a reduction of 3,970 tons per year. The emissions from the TIP projects are estimated in tons per year as opposed to tons per day in the LRTP’s regional-level analysis.
The Central Transportation Planning Staff (CTPS), the staff to the Boston Region MPO, provides support to MassDOT’s Statewide Planning and Research Program and transit planning assistance to both MassDOT and the Massachusetts Bay Transportation Authority (MBTA) through the conduct of various studies. Some of this work includes travel-demand modeling and air quality analyses that determine the CO2 impacts of specific projects and programs.
 CTPS is helping MassDOT and the MBTA to quantify two sustainability performance metrics: the first is GHG savings per unlinked passenger trip and vehicle revenue mile, and the second is vehicle-miles traveled (VMT) per capita. This study’s primary focus is to estimate the reductions in system-level GHG emissions from the automobile mode that are associated with the provision of each of the individual MBTA transit modes.
The City of Boston has programs to reduce motor vehicle use within the city, but the current efforts are bound by limitations in technology and data systems. The overall efficacy of the City’s transportation programs in reducing VMT and the specific efficacy of any one policy or program is largely unknown because the City cannot determine VMT with the level of accuracy or spatial and temporal resolution needed to measure improvements. The City needs to be able to measure VMT in near real time at the block or neighborhood level; it cannot effectively implement and adjust its policies to maximize the public transportation impact without detailed knowledge of the VMT consequences. CTPS has been working with the City and its consultants to identify data that can be used and shared between Boston and the Boston Region MPO to improve modeling capabilities for estimating GHG emissions.
Many of the municipalities in the Boston Region MPO area have committed to developing climate protection plans. The first step is to develop a baseline emissions inventory for the municipality’s motor vehicle emissions. The municipalities request data on vehicle-miles of travel for their specific municipality from CTPS to help develop this inventory.
In order to expedite fulfilling these requests, CTPS staff have developed a Web-based tool, which will be on the MPO website, that municipalities can directly access to obtain existing (2010) and forecasted (2035) data. This information is being developed from the CTPS travel demand model using LRTP data. The data by municipality will include:
This tool will provide data for the automobile, commuter rail, bus, and ferry. It is expected that it will be made available on the MPO website by in October 2012.
This final section presents activities addressing climate change that the MPO plans to undertake in the future. These activities will help in reducing CO2 emissions in the MPO region and help the Commonwealth in meeting the goals set forth in the Global Warming Solutions Act and in MassDOT’s GreenDOT initiative.
Performance measures help to demonstrate how well the transportation system as a whole or segments of the system are embodying the visions and policies adopted by the MPO. Bringing this information into the MPO planning process is called performance-based planning. The MPO committed, in the work program for its Paths to a Sustainable Region LRTP and in the LRTP itself, to developing performance measures for this purpose, and it has begun to engage in performance-based planning.
Through the metropolitan transportation planning process, the MPO will create performance measures that provide information that is useful for regional and local decision makers and critical for demonstrating our region’s success in managing our transportation network and the effectiveness of our investments. The MPO will fulfill the MAP-21 requirements for performance-based planning that were discussed earlier in this paper.
The identification and adoption of the MPO’s visions and policies for the future of our region in the Paths to a Sustainable Region LRTP was the first step toward performance-based planning. Over the coming months, performance measures will be developed for each of the visions, including the one pertaining to climate change.
Since the early 1990s, the region’s transportation system has been monitored through the MPO’s CMP. In addition, the Needs Assessment for Paths to a Sustainable Region gathered, organized, and analyzed information about the state of the region’s transportation system. It detailed existing conditions, how the system is currently used, and its projected use in the future. This information will continue to be updated as new data become available. In addition to the CMP and the Needs Assessment, the MPO has other sources for collecting, analyzing, and monitoring information for performance measures, including:
MPO staff will develop draft measures and targets for each of the vision topic areas, including climate change, and present them to the MPO. As part of the process, staff will compare the MPO’s performance targets and measures with those chosen by MassDOT to ensure that we are coordinating with state agencies, as required in MAP-21.
The LRTP, through its Needs Assessment and other LRTP analyses (Environmental Justice and Air Quality Conformity, for example), and the TIP will document the performance measures and will provide a unified assessment of our transportation network’s performance and the success of our investments. The LRTP and the TIP will also use the measures in the development and application of project-evaluation criteria and as vehicles for programming and prioritizing projects and programs that should be funded in order to attain the visions and policies adopted by the MPO.
The LRTP is required to be updated at least every four years. The current LRTP, Paths to a Sustainable Region, was adopted by the MPO in September 2011; therefore the next LRTP must be adopted by September 2015.
The MPO will be developing performance measures, as described above. These measures must be incorporated into the next LRTP and its Needs Assessment. The MPO may decide that certain measures are important that do not line up with the existing visions and policies. Any revisions to the visions and policies can be done as part of the LRTP development. This in turn would change the evaluation criteria used in the selection of projects and programs. Updated information in the Needs Assessment will help in monitoring the transportation system to ensure that we are moving toward meeting the performance-measure targets and visions for the region that are decided upon, including those established for climate change.
 Part of the process of developing an LRTP is the adoption of a preferred land use scenario. The preferred land use is incorporated into the travel demand model for analyzing the existing and future needs of the transportation system in the region and testing the performance of different transportation investment strategies. The current land use scenario adopted by the Boston Region MPO was developed by the Metropolitan Area Planning Council (MAPC) using MetroFuture, its long-range plan for land use, housing, economic development, and environmental preservation in the Boston region. MAPC evaluated alternative land use scenarios for the future of the region and ultimately chose a smart-growth alternative that directed 53 to 55 percent of employment and housing growth to the Inner Core and Regional Urban Centers and 16 to 18 percent of such growth to Developing Suburbs. Concentrating growth in Community-Oriented Development Areas and near transit was also part of the chosen alternative. The scenario includes aggressive goals for water conservation and educational attainment.
An option for the MPO to consider as part of the development of the next LRTP is exploring multiple land use options in conjunction with multiple transportation investments and examining the effects of various combinations. This can be done through scenario planning. The travel-demand model would be the primary tool used for this exercise and could provide information for evaluating different scenarios that reduce emissions of GHGs in the region. In the development of the Paths to a Sustainable Region LRTP, three different transportation investment strategies were reviewed. Currently, MassDOT is looking at different scenarios as part of the weMove Massachusetts Transportation Plan, and MAPC is looking at different land use options as part of developing future socioeconomic projections for the Boston Region MPO area.
As discussed above, transportation and land use are closely linked. Currently, the MPO receives population and employment forecasts from MAPC as key inputs to its travel forecasting models. There is a need to link transportation and land use planning in the development of travel forecasts within the MPO modeling area, and a land use allocation model would help to simulate a realistic interaction between transportation and land use. MPO staff and MAPC have been working together to explore different land use models for use in developing forecasts for future LRTPs.
The TIP serves as the implementation arm of the MPO´s LRTP. As changes to visions, policies, and performance measures are made in the LRTP, the TIP development process must be updated to incorporate those changes.
The existing TIP project-selection criteria have been used over the last two development cycles to evaluate how effectively projects under consideration address MPO visions and policies. During the development cycles of the federal fiscal years (FFYs) 2012-2015 TIP and FFYs 2013-2016 TIP, concerns were raised about the geographic and modal equity of some of these project-selection criteria.
MPO staff are currently preparing a memo for the MPO to inform the discussion of updating the project-selection criteria. The memo will evaluate how the criteria have performed over the last two TIP development cycles, identify potential issues and concerns, and propose possible strategies for resolving them. As performance measures are developed, additional changes may have to be made.
The MPO estimated CO2 emissions for projects that were included for discretionary funding in the 2013-2016 TIP. This information was reported to MassDOT for inclusion in its calculations for GreenDOT implementation. With the 2014-2017 TIP the MPO will take the next step in incorporating CO2 estimates into the TIP process: estimating CO2 emissions for all of the projects included in the Universe of Projects for the TIP. This will be done for all projects for which there is enough information available to perform the calculations. What is typically required is for a functional design report to have been conducted for the project. The CO2 information for each project will then be used by staff and the MPO in evaluating projects for inclusion in future TIPs.
 In addition to climate change planning activities associated with the LRTP and the TIP, other such activities are identified in the 2013 Unified Planning Work Program (UPWP). One of the programs in the UPWP is Air Quality Support Activities, which provides support for climate change initiatives. Activities in this program include integrating climate change concerns and emission reduction opportunities into the MPO’s planning process and working with MassDOT to implement its GreenDOT policy. Activities in the Bicycle and Pedestrian Support Program and the Livability Program will also help in reducing CO2 emissions.
MPO staff have participated in three separate MPO Peer Exchanges since the MPO began engaging in climate change planning. In peer exchanges, established by USDOT, an MPO has the opportunity to examine and evaluate its programs through a collaborative team of peers, experts, and persons involved in the process whose discussions of visions, ideas, and best practices would benefit both the MPO’s programs and the programs of the peer team participants. Two of the peer exchanges that MPO staff have participated in focused on climate change mitigation and a third on climate change adaptation. As the MPO moves forward in its climate change planning activities, staff hope to continue to collaborate with other MPOs through these peer exchanges.
In the past, MPO staff have assisted in the research activities of academic institutions, providing analysis and other kinds of support. A recent activity was working with Boston University to understand the carbon footprint of transportation in the Boston region. This work included comparing the US Environmental Protection Agency national inventory for CO2 emissions at the county level with travel demand estimates from the travel demand model. Staff hope to continue to provide such support to academic institutions and other agencies as time and funding permit.
1 New England Regional Assessment Group, Preparing for a Changing Climate: The Potential Consequences of Climate Variability and Change: New England Overview, U.S. Global Change Research Program, University of New Hampshire, 2001.
3 United States Environmental Protection Agency. “Greenhouse Gases Overview.” http://www.epa.gov/climatechange/ghgemissions/gases.html. Accessed June 2012.
5 Except for the third bullet, the information is from: United States Environmental Protection Agency. “Clean Energy Calculations and References” http://www.epa.gov/cleanenergy/energy-resources/refs.html Accessed June 2012. TheEPA’s values are in metric tons; for this memo they have be en recalculated as tons for consistency with the other parts of this discussion. One metric ton = 1,000 kilograms.
6 United States Environmental Protection Agency. “Greenhouse Gas Emissions from a Typical Passenger Vehicle: Fact Sheet.” February 2005.
7 “Scientific Opinion on Climate Change,” http://en.wikipedia.org/wiki/Scientific_opinion_on_climate_change#Academies_of_Science, accessed August 2012.
8 “Climate Change Indicators in the United States,” U.S. EPA, May 2010: National Oceanic and Atmospheric Administration Climates Services webpage http://www.climate.gov/ - dataServices;
U.S. Department of Energy, “Online Compendium of Data on Climate Change,” at http://cdiac.ornl.gov/trends/trends.htm..
10 Special Report 290: The Potential Impacts of Climate Change on U.S Transportation. Transportation Research Board of the National Academies, Washington, D.C. 2008.
11 Permanent Service for Mean Sea Level, http://www.pol.ac.uk/psmsl, and National Oceanic and Atmospheric Administration, http://tidesandcurrents.noaa.gov/sltrends.
12 The IPCC was established by the United Nations Environment Programme and the World Meteorological Organization.
13 Intergovernmental Panel on Climate Change, Climate Change 2007: Synthesis Report, 2007.
14 Martin Vermeer and Stefan Rahmstorf, Global Sea Level Linked to Global Temperature, 2009.
15 Intergovernmental Panel on Climate Change, Climate Change 2007: Synthesis Report, 2007.
16 Presentation by Jeff Houk, FHWA Resource Center, “Energy Efficiency in Transportation,” at the Northern Transportation and Air Quality Summit in Philadelphia, PA., August 7, 2012.