Technical Memorandum
DATE: January 21, 2016
TO: Boston Region Metropolitan Planning Organization
FROM: William S. Kuttner
RE: Freight Planning Support, FFY 2014: Improving Truck Travel in the Everett-Chelsea Industrial Area
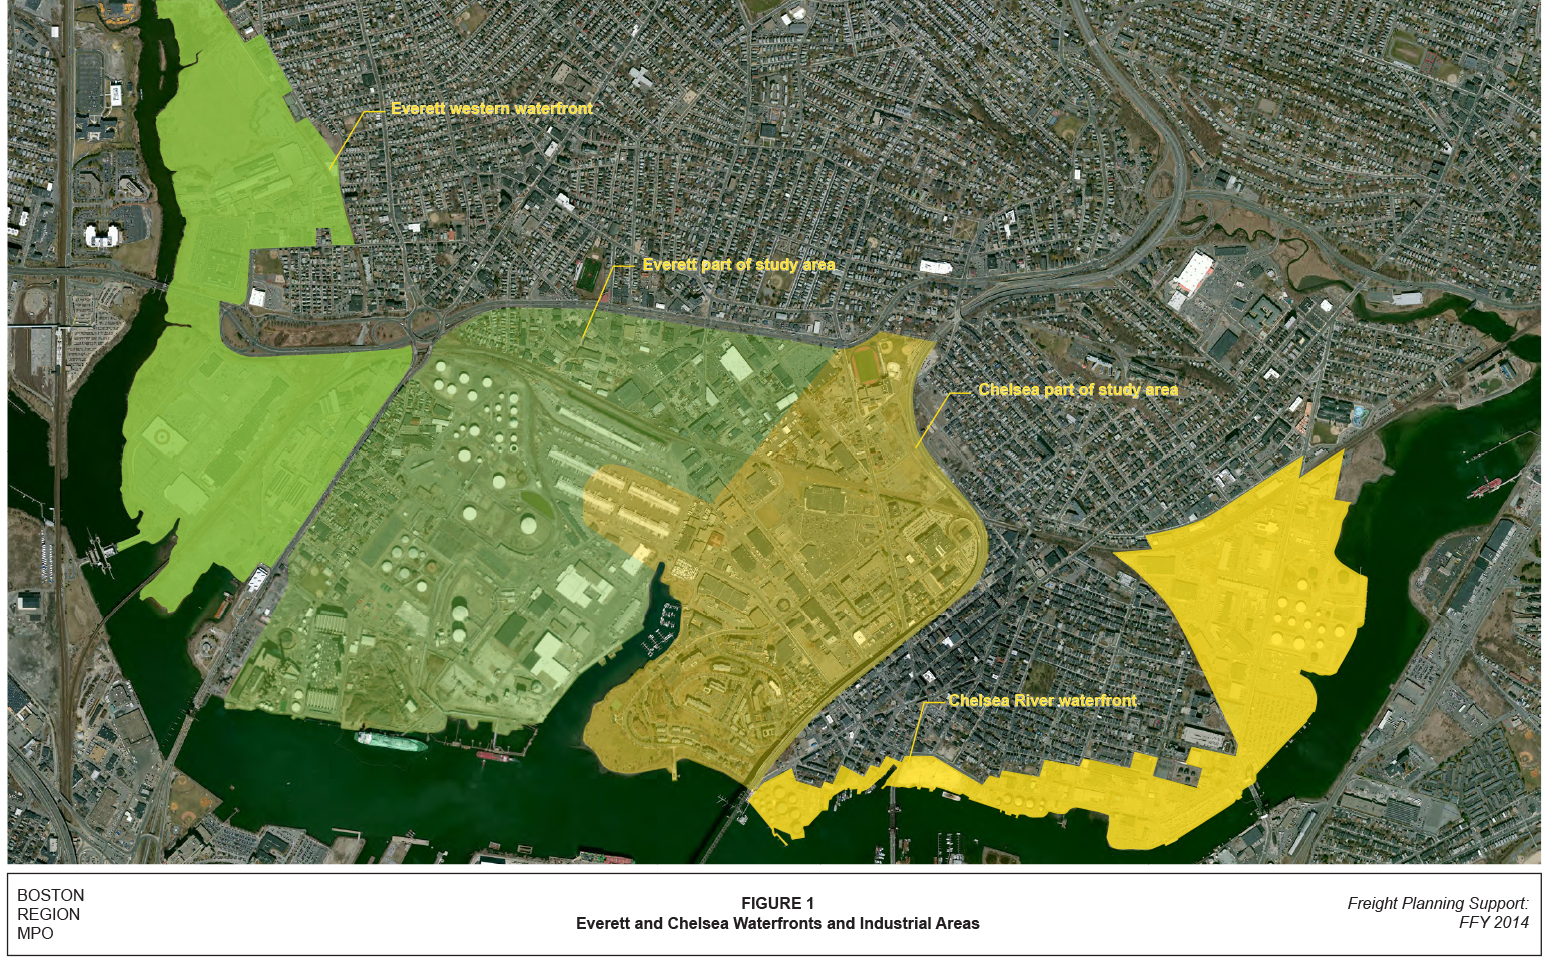
The cities of Everett and Chelsea have long-established industrial areas along the northern reaches of Boston’s inner harbor. These include important parts of the working waterfront as well as numerous nearby industrial sites extending inland from the waterfront. The uses of these sites, both on and near the waterfront, have evolved gradually over decades.
To the west of Route 99 in Everett (see Figure 1) substantial tracts of formerly industrial land on and near the Mystic and Malden rivers are now used for a variety of nonindustrial purposes. This waterfront area, which once supported industry, is now used primarily for recreation. Some industry remains, but new housing investment and the approval for construction of a major casino suggest that the transformation of this area away from industrial use will continue.
The eastern boundary of Chelsea is the Chelsea River. Water-related industrial usage now occupies only a portion of the Chelsea River waterfront. Two wharves designed for use by ocean-going vessels now function as air passenger and rental car parking lots for Logan International Airport. Some industrial buildings inland from the Chelsea River now house health clubs, in addition to a limited amount of light industry. While the remaining industrial and wharf parcels are important, there would be limited value in studying this narrow corridor.
The focus of this study is the industrial area straddling the boundary around the two cities. This area is bounded roughly by Route 99 on the west, Route 16 on the north, US Route 1 on the east, and the Mystic River on the south. The Everett section is slightly larger and is almost entirely industrial. While a greater portion of the Chelsea section is now nonindustrial, important industrial activity remains, and significant truck access routes pass through Chelsea to serve the entire area (detailed in Figure 2).
Truck traffic and related land use issues in the Everett-Chelsea industrial area were identified as potential study subjects in the 2013 Freight Planning Action Plan because heavy truck traffic and associated road conditions were seen as problems.1 The roadway system is in very poor condition, and a thorough analysis of truck traffic in the study area was seen as a resource that the municipalities could use to support any applications for road reconstruction funding.
Early in the study it became apparent that there was also a planning opportunity. It was observed that, in the study area, new nonindustrial development was taking place at the same time as nearby industrial sites were being modernized or new industrial facilities constructed. It became an explicit goal of this study to identify modifications to the roadway network that would support new investment in both industrial and nonindustrial land uses.
This study has achieved both of these goals. An improvement to the roadway network suggested by area stakeholders was analyzed for its impact on area truck traffic and is proposed, together with two other smaller improvements. Furthermore, truck traffic throughout the study area was characterized by eight distinct truck types, giving a detailed picture of how the road network is utilized, and allowing the municipalities to relate proposed roadway investments more closely to the needs of specific industries.
This study begins with a description of existing conditions in the study area, characterized by:
Next, the study presents the proposed improvements to the road network, including:
The analysis and estimates of network benefits are presented in this memorandum, and several design considerations are discussed.
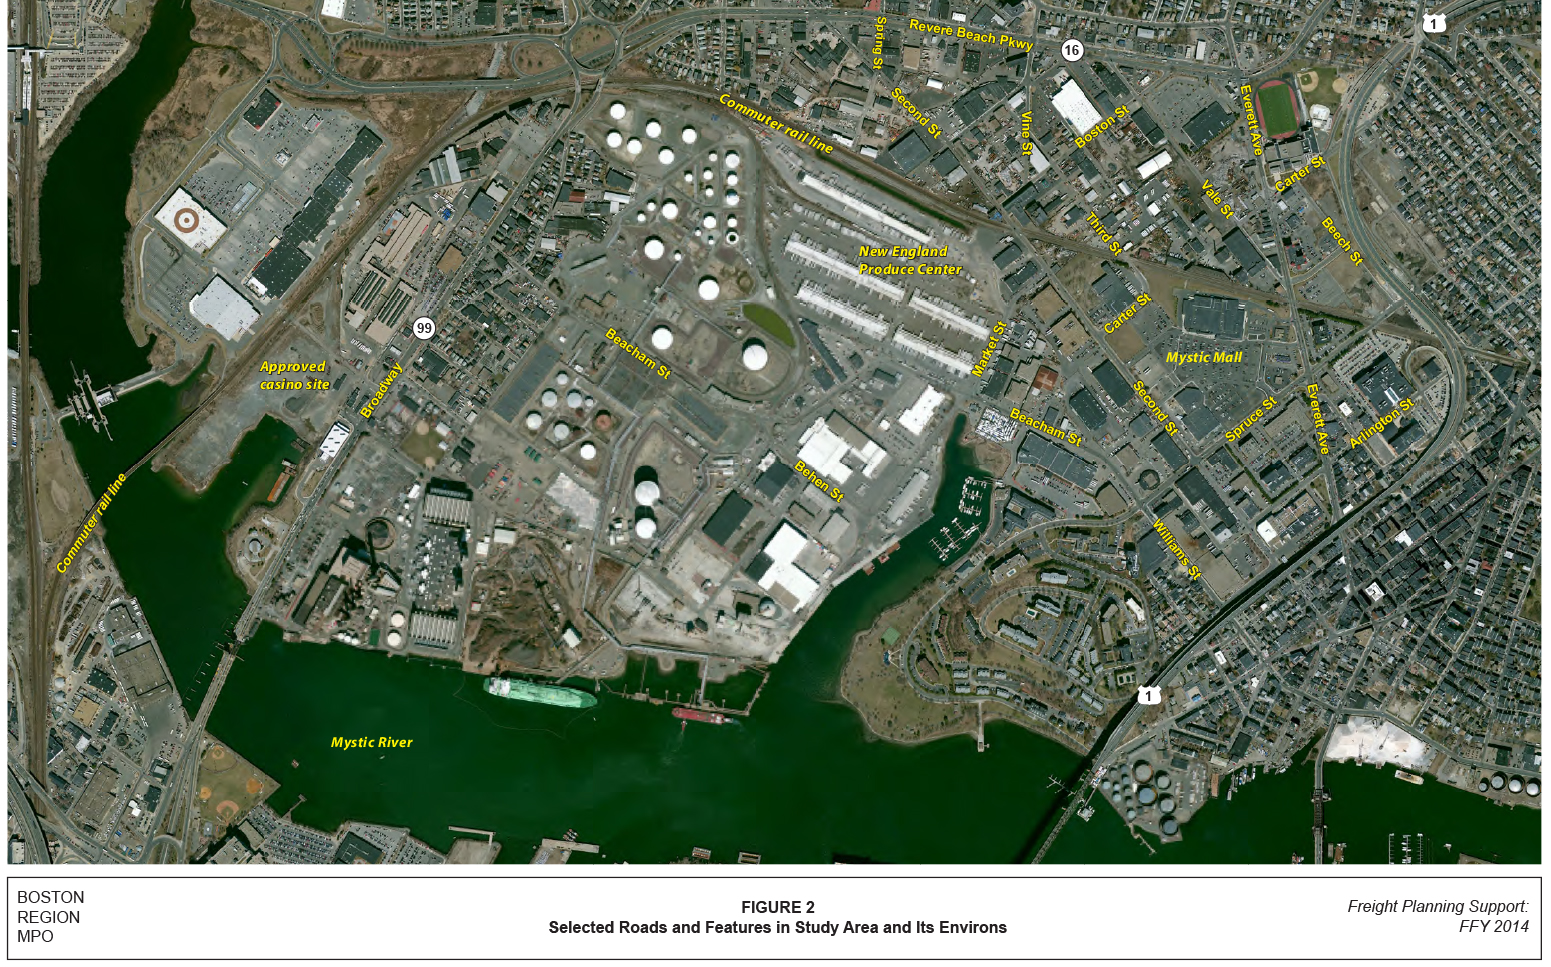
The boundaries of the study area shown in Figure 1 are Route 99 on the west, Route 16 on the north, US Route 1 on the east, and the Mystic River on the south. The boundaries and other important features are labeled in Figure 2, which shows the study area and its environs in greater detail. Traffic on these three boundary highways was not analyzed for this study; only the traffic entering or leaving the study area from these highways was analyzed. Figure 1 shows US Route 1, as limited-access highway, as part of the study area because traffic on its entrance and exit ramps was counted and analyzed.
The roadway system in the study area serves as an extended industrial driveway to a large number of contiguous industrial parcels that extend almost a mile inland from the Mystic River’s working waterfront. In addition to the roadway network being used by trucks to serve locations in the study area, a large number of trucks use these roadways to reach other industrial sites, to the east and west of the study area.
The industrial activities within the study area are discussed in the existing conditions section, which includes a description of the role of freight transportation in their operations. There follows a discussion of several types of trucks that use the study area’s road system that were counted and analyzed. All of the counts of area trucks includes both trucks serving local sites and trucks passing through. Several urban planning issues, both truck- and non-truck-related, are then presented.
Finally, there is a discussion of the study area’s roadway system, truck crash history, and challenges related to its condition and configuration. The weekday flows for eight types of trucks, as well as light (four-wheeled) vehicles, entering and exiting a cordon area were estimated, and the estimated flows by vehicle type at the boundary of the cordon area are presented. The analysis of these vehicle flows through the study area’s network served as the basis for evaluating proposed network improvements.
Trucks in which freight is shipped utilize the entire roadway network, except for roads on which they are specifically prohibited; trucks are not prohibited from using any of the roads in the study area.
Truck trips are generated by all types of land uses, with great variation in both the types of trucks and the frequency of trips. Many industrial and freight activities were found in the study area, as well as common urban land uses such as housing, retail, and office. Most of the types of truck trip generators represented in the study area are listed in Table 1, roughly in descending order of the typical shipment size.
One cause of the heavy volumes of truck traffic in the study area is the nature of most of the area’s industrial activities. Whether the goods are in bulk or are packaged, many goods merely change transportation mode, ownership, or shipment size somewhere within the Everett-Chelsea industrial area. Changing mode, shipment size, and ownership are critically important functions of freight logistics, and the physical movement and short-term storage of goods represent important added value. The rest of this section describes the logistical and other freight-related activities listed in Table 1.
The activities shown in Table 1 that use ships clearly have dockside facilities on the Mystic River or nearby Island River. However, commodities such as gasoline, liquefied natural gas, and asphalt are moved by aboveground pipes to storage and distribution facilities farther inland that offer easier access to the road network. Most of the bulk transportation facilities are in the part of the study area that is located in Everett.
Scrap recycling is a bulk transportation activity that does not utilize dockside facilities. Most of the recycling businesses in the study area are located north of the Newburyport/Rockport commuter rail line (see Figure 2), and some are located next to this line, having started operating at a time when rail service to these relatively small operations was still a viable business for the railroads.
TABLE 1
Types of Freight Activity in the Study Area
| Activities and Goods | Activities and Goods | Vehicles and Facilities |
| Bulk Transshipment, Distribution, and Consolidation | Bulk Transshipment, Distribution, and Consolidation | Bulk Transshipment, Distribution, and Consolidation |
| Bulk Transshipment, Distribution, and Consolidation | Junk cars and large scrap | Rail or truck to ship |
| Bulk Transshipment, Distribution, and Consolidation | Cement | Ship to storage to truck |
| Bulk Transshipment, Distribution, and Consolidation | Gasoline | Ship to storage to truck |
| Bulk Transshipment, Distribution, and Consolidation | Liquified natural gas | Ship to storage to truck or pipeline |
| Bulk Transshipment, Distribution, and Consolidation | Asphalt | Ship to storage to truck |
| Bulk Transshipment, Distribution, and Consolidation | Scrap recycling | Truck to consolidation to truck |
| Product Transshipment and Distribution | Product Transshipment and Distribution | Product Transshipment and Distribution |
| Product Transshipment and Distribution | Refrigerated produce | Truck or rail to storage to truck |
| Product Transshipment and Distribution | Frozen fish | Ship or rail to storage to truck |
| Product Transshipment and Distribution | Merchandise | Truck to warehouse to truck |
| Product Transshipment and Distribution | Construction materials | Truck to storage to truck |
| Manufacturing and Processing | Manufacturing and Processing | Manufacturing and Processing |
| Manufacturing and Processing | Commercial bakery | Trucks supply and distribute |
| Manufacturing and Processing | Meat packing | Trucks supply and distribute |
| Manufacturing and Processing | US Mail | Trucks supply and vans distribute |
| Vehicle Support | Vehicle Support | Vehicle Support |
| Vehicle Support | Motor pool | Truck or trailer storage |
| Vehicle Support | Service | Truck repair |
| Vehicle Support | Dealer | Truck sales and service |
| Retail | Retail | Retail |
| Retail | Shopping center | Trucks (all sizes) |
| Retail | Storefront retail | Trucks (all sizes) with hydraulic lifts |
| Office | Office | Office |
| Office | Package delivery | Single-unit trucks and vans |
| Office | Office supply delivery | Single-unit trucks |
| Residential | Residential | Residential |
| Residential | Garbage and recycling | Single-unit trucks |
| Residential | Package delivery | Single-unit trucks and vans |
| Residential | Heating oil | Single-unit tank trucks |
| Residential | Furniture delivery | Single-unit trucks |
Source: CTPS.
The New England Produce Center sits on the Everett-Chelsea line and is the largest facility of this type in the study area. There are, however, a myriad of smaller, refrigerated food distribution businesses both adjacent to and at some distance from the New England Produce Center, both in Everett and in Chelsea. There are also a number of companies in the study area that distribute other types of food and nonfood products.
The few locations in the study area that manufacture or process goods depend on truck transportation, but do not generate as many truck trips as distributors do. For example, the commercial bakery located in Chelsea only receives trucks at the rate at which it utilizes ingredients, and only dispatches trucks at the rate it produces its products. Most of the value added is in the baking process, and the number of trucks generated is significantly less than would be observed at a food product warehouse of the same size.
The commercial bakery is adjacent to a waterfront apartment complex, and a meat packing plant is also located in Chelsea, across the street from some office buildings. The US Postal Service processing center is located on the Everett-Chelsea line and represents an analogous situation. Only a limited number of truck deliveries are required to support its primary function, processing mail.
A typical retail business also serves important logistical functions: the ownership of goods changes and the shipment size dramatically shrinks between the time the goods arrive and when they leave the store with customers. The supermarket and other retailers at Mystic Mall are supplied by trucks of all sizes, but the products leave the premises in shopping carts and bags. Since the clientele require so much parking, and because almost all of the outgoing transport of goods is handled by individual customers rather than by trucking companies, truck traffic per unit of land area is less than for industrial land uses.
The Mystic Mall is the most important retail location in the study area. It occupies a large, five-sided parcel bounded by Everett Avenue, Spruce Street, Second Street, Carter Street, and the commuter rail line. A devastating fire in 1973 completely destroyed this entire site and much of the nearby area. The gradual reconstruction began with the mall, then modern distribution and warehouse businesses, and, finally, office buildings.
There is little residential or office space within the study area, though office space has been gradually increasing. While truck trip generation rates are low for these land uses, any count of study area trucks needs to include those serving these activities.
It is important to note that industrial activities take place at waterfront and industrial locations outside the study area, and many trucks serve these nearby industrial sites using study area roadways. Similarly, although few residences are within the study area, the area abuts some residential neighborhoods and many of the trucks serving these nearby residential areas were observed entering or leaving the study area’s road network.
The importance of trucks for study area business activity can best be understood by considering the numbers and types of trucks traveling on study area roadways over a 24-hour weekday period. A count program administered by the Massachusetts Department of Transportation (MassDOT) used automated techniques to obtain hourly traffic volumes at key locations over a 24-hour period, with traffic classified by vehicle size.
For this study a truck was defined as having at least six wheels, with the minimal configuration having doubled-up pairs of rear wheels. Numerous four-wheeled vans and pickup trucks are also engaged in business activity, including the transportation of small amounts of goods or other cargos. For the purposes of this study, all four-wheeled vehicles were classified as light vehicles regardless of any business or freight activity they may be involved in.
The automated MassDOT counts were supplemented by manual classification counts conducted by MPO staff that further subdivided trucks into eight distinct groups. These eight groups are not part of a standard classification system, but rather reflect the needs and circumstances of this particular study. The eight truck types that were counted are:
Each of these eight groups is easily recognizable by tabulators in the field, an important requirement considering that many counts were conducted before dawn and turning movements were also recorded. Large numbers of trucks in each group use study area roads, and the eight categories relate well to the industrial activities listed in Table 1. The rest of this section discusses briefly each of these truck types and highlights some aspects of how these vehicles are deployed in or near the study area.
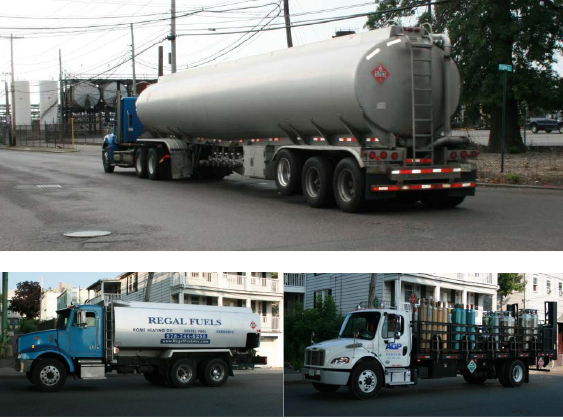
Figure 3 shows three unrefrigerated box-type trucks, representing perhaps the most widespread concepts of what trucks look like. At the top is a semi-trailer pulled by a tractor unit, and the lower part of the figure shows two pictures of single-unit box trucks. The number “53” appears prominently on the side of the semi-trailer, indicating that it is 53 feet long, which is the length of the longest trailers in common use in North America. The truck at the lower left has a hydraulic lift in back to facilitate loading at locations that lack a loading dock, such as a small storefront business or a residence.
The type of contents of box trucks is often not indicated on the outside of the trucks. While almost all refrigerated trucks are carrying food, much food also travels in unrefrigerated box trucks.
Box-type trucks can be easily equipped with a refrigeration unit to be suitable for transporting perishable food. The upper image in Figure 4 shows a 53-foot trailer with a conspicuous refrigeration unit attached to the front of the trailer.
There is no name of a supermarket chain on the trailer. Produce from other parts of the country is brought to the study area by distributors in large trucks such as these, and, to a much lesser degree, in refrigerated rail cars. If the truck arrives when the distributor is closed, it will sometimes wait on streets in the study area. Even if the truck’s engine is turned off, as required by law, the refrigerator unit must continue to run and this noise is a source of ongoing complaints by nearby residents.
FIGURE 3
Box-Type Trucks (Unrefrigerated): Semi-Trailer and Single-Unit Trucks
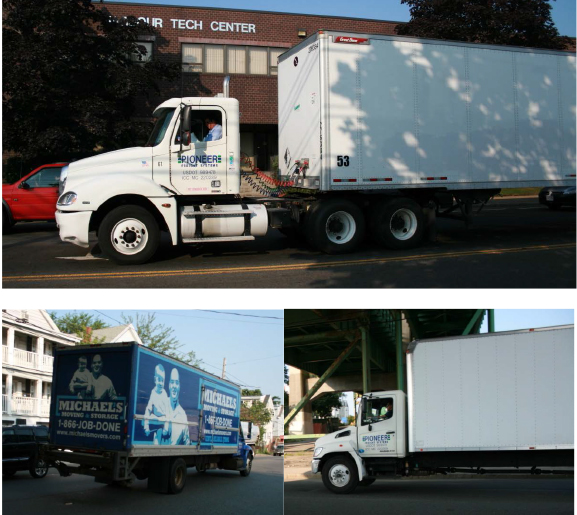
Source: Author.
The photo at the bottom of Figure 4 shows two single-unit refrigerated trucks leaving the cordon area at the on-ramp from Everett Avenue to US Route 1 southbound and the Tobin Bridge. The refrigeration unit is clearly visible on the front of the box portion of the Specialty Foods truck, and a much smaller, black unit can be seen on the front of the box portion of the Saigon Market truck, silhouetted against the Kayem meat packing plant.
Refrigerated produce leaves the distributors in trucks of all sizes and types, as well as a wide range of shipment sizes. The markings on trucks, tractors, and trailers suggest that equipment is owned by a mix of local and regional distributors, private carriers both large and small, and major supermarket chains.
FIGURE 4
Refrigerated Trucks: Semi-Trailer and Single-Unit Trucks
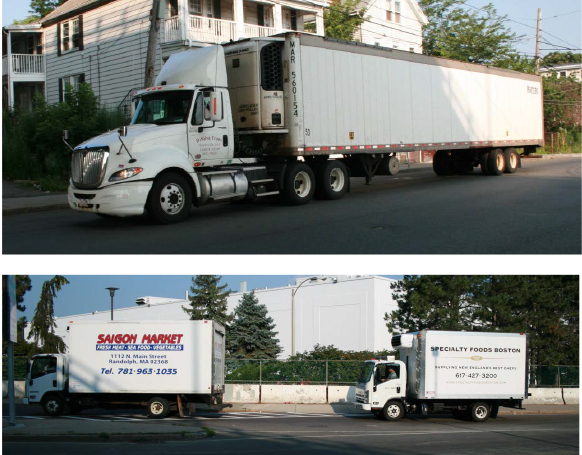
Source: Author.
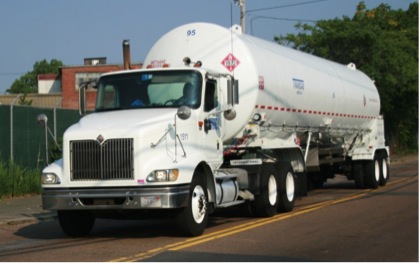
The study-area roadways serve a large number of trucks that carry hazardous cargoes. There are two reasons for this. First, as shown in Table 1, gasoline, liquefied natural gas, and asphalt are distributed using large semi-trailers from bulk distributors located in the study area. Also, because hazardous cargoes are banned from the tunnels under Boston Harbor as well as the tunnel under City Square in Charlestown on the approach to the Tobin Bridge, all trucks carrying hazardous cargoes must use routes, some of which pass through the study area, that avoid these harbor crossings.
Figure 5 shows three types of vehicles carrying hazardous cargoes. At the top is a semi-trailer carrying gasoline for delivery at a gas station in the Boston region. A red diamond appears on the back of the trailer, signifying that the contents are flammable. Unlike trucks that have a diamond symbol that can be flipped shut, tank trailers that carry gasoline have the diamond painted on the tank because even when the tank is empty, the fumes could explode. Behind the tanker is an asphalt distribution depot. Asphalt is flammable but not explosive. A tanker distributing asphalt displays a white hazard placard that indicates that the asphalt has been heated prior to delivery.
FIGURE 5
Hazardous Cargoes: Semi-Trailer and Single-Unit Trucks
Source: Author.
Two single-unit trucks with hazardous cargoes appear in the bottom of Figure 5. The tank truck is typical of the type of vehicle that delivers home heating oil during the winter. This picture was taken in July, so this truck may have been refueling construction equipment at work sites. It has a red placard that means it is prohibited from using the tunnels. It may have started its trip near the Chelsea River and is passing through the study area because it is the most convenient of the few routes available.
The photo at the lower right shows a flatbed truck delivering welding supplies. It has both green and red placards, each placard indicating the type of flammable and nonflammable gases being transported in each of the numerous cylinders. One of the study area’s welding supply distributors is located next to a produce distributor and across the street from a scrap recycler, illustrating the intermingling of industrial activities in the study area.
There are a variety of truck configurations, both semi-trailer and single unit, in addition to the six already mentioned. In addition to the ubiquitous garbage truck (for residential pickups), the other truck configurations seen in the study area might best be grouped by the industries they are serving rather than by their physical design. Many trucks fall into two broad categories of vehicles:
At the top of Figure 6 is a photo of a semi-trailer dump truck leaving southbound US Route 1 at Carter Street. While trucks such as these are used primarily in the construction industry to bring dirt to or from construction sites as needed, in the study area these trucks primarily serve the scrap recycling industry. This truck could be destined for either the waterfront, where the scrap metal it carries will be loaded onto a ship for export, or to one of the recycling operations, where its contents will be sorted by metal type and resold.
If this truck is going to the waterfront, it would be one of the smaller trucks carrying scrap for export. There are even larger dumping semi-trailers that serve the scrap export business, as well as enclosed flatbed trucks that carry crushed autos. Some scrap also arrives at dockside by rail.
At the bottom of Figure 6 are photos of a cement truck and a dump truck. The dump truck has probably dropped off scrap at a recycler and is entering US Route 1 northbound at Spruce Street. Scrap metal arrives at recyclers in a variety of vehicles, from large to small, including pickup trucks.
Cement trucks serve exclusively the construction industry. Flatbed trucks carrying building supplies, and extra-large flatbed trucks carrying construction equipment, were also observed. There are also trucks owned by utility companies that are set up to service the infrastructure of the particular utility.
Two types of large vehicles were not considered in this study: buses and tandem truck trailers. Buses have at least six wheels, but were not included in any of the “truck” categories because they represent a very small fraction of traffic; they were counted as light vehicles. In addition, tandem truck trailers were not included because they are not allowed on any of the roads in the study area.
FIGURE 6
Other Truck Configurations: Semi-Trailer and Single-Unit Trucks
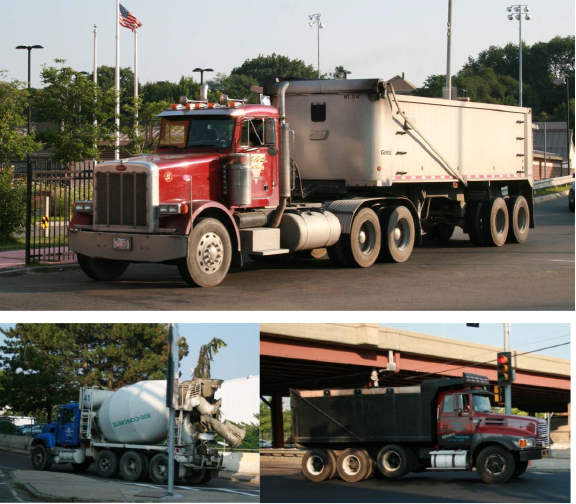
Source: Author.
A thesis of this study is that industrial and nonindustrial land uses in the study area are not incompatible, and that there are small transportation system improvements that could support the long-term coexistence of existing and future industrial activities and other urban activities, such as retail. Some recent study-area investments, in both industrial and nonindustrial uses, help to illustrate the compatibility between industrial and nonindustrial activities.
Figure 7 shows a new, high-end housing project that is nearing completion. It is located on a parcel next to US Route 1 in Chelsea that adjoins a northeast edge of the study area. While industrial land uses no longer directly abut this parcel, it is on the important Spruce Street corridor, which trucks use to get from the industrial areas to US Route 1. Even locations such as this, with heavy truck traffic, are attractive to potential developers because of rising real estate prices in Greater Boston.
FIGURE 7
New Luxury Housing on Spruce Street in Chelsea:
Flatbed Truck Turning onto a Northbound On-Ramp to US Route 1
Source: Author.
A few blocks away from the new housing shown in Figure 7 is the Mystic Mall, which is in the process of adding new retail floor space. Across the street from the Mystic Mall is the new State Garden organic produce distribution center, shown in Figure 8. This new facility, and the company’s original facility, which is located across Second Street from their new facility, are served primarily by refrigerated semi-trailers.
Other recent investments are less conspicuous. Some of the new industrial tenants leasing existing warehouse space invest in rack systems, facility modifications, and inventory. In the case of a recently arrived craft beer distributor, the inventory can be comparatively high-value. At the tail end of the supply chain, noticeable new signage and fresh razor wire fencing marks the perimeter of one of the recyclers. While metal recycling is not considered an aesthetically pleasing land use, it appears to be economically viable in the study area.
FIGURE 8
Mystic Mall and New State Garden Organic Produce Distribution Center on Carter Street, South of the Newburyport/Rockport Commuter Rail Line
Source: Author.
The FBI’s new regional office is under construction across US Route 1 from the new housing that is shown in Figure 7. While this agency does not need to “market” its location, as other developments do, the new building has specialized requirements that the study area was able to meet. Other industrial sites in the study area are currently being considered for mixed-use development, but plans and have yet to be finalized and developers have not been selected.
The busy MBTA Newburyport/Rockport commuter rail line crosses streets at grade at six locations in Chelsea and Everett. Four of these locations are in the study area: Second Street in Everett; and Third Street, Everett Avenue, and Spruce Street in Chelsea. As shown in Figure 9, on Everett Avenue during rush hour it is mostly drivers of passenger vehicles who are inconvenienced.
Urban grade crossings are undesirable because of safety, traffic flow, and urban design reasons. Unfortunately, there are no plans, nor are there attractive designs, for grade-separating any of these crossings. This study assumes that the commuter railroad line and the roadway system will continue to occupy the same plane, though the locations of grade crossings might be changed.
FIGURE 9
Everett Avenue Railroad Grade Crossing during the Morning Peak Period
Source: Author.
An industrial rail spur connects the commuter rail line to the New England Produce Center and the Mystic River waterfront. This rail spur crosses Beacham, Behen, and Commercial streets at unprotected grade crossings. Traffic is stopped for crossing trains by train crew members, who stand in the street with a flag.
Today, the Chelsea commuter rail station is located just outside the of the study area, to the east of US Route 1. Planning is underway to replace this station with a new, fully ADA-compliant station that will be located behind the supermarket at Mystic Mall. The future station site, shown in Figure 10, will be near the supermarket’s truck delivery bays.
The new commuter rail station will also include passenger amenities and loading areas for both commuter rail service and for a planned extension of Silver Line service from East Boston to Chelsea. Called the Silver Line Gateway Service, this new service will utilize existing and newly constructed, exclusive rights-of-way to allow Silver Line vehicles to travel faster after they emerge from the Ted Williams Tunnel. This new service will also connect with the Blue Line and then make several stops in Chelsea before terminating at the new commuter rail station. Any future extension of Silver Line Gateway service likely would affect industrial sites that are adjacent to the commuter rail line to the west of the Mystic Mall.
FIGURE 10
Commuter Rail Line behind Mystic Mall:
Site of Future Chelsea Commuter Rail Station
Source: Author.
The road network in the study area consists of roads that were built to a range of standards. The sections of Second and Spruce streets near Mystic Mall were rebuilt to modern standards after a devastating fire in 1973, and include usable sidewalks. A more typical roadway segment is the stretch of Second Street shown in Figure 11, which is clearly inadequate for today’s demands. The sidewalk is in poor condition, but some study-area roadways have no sidewalks at all. A bicycle cannot safely share this road with a truck, and as seen in Figure 12, large trucks barely fit in the lanes. Autos may fit in the lanes, but they risk landing in potholes. Land use evolution, increasingly larger vehicle sizes, and deteriorated road conditions are all illustrated in Figure 13.
Given the number and size of trucks, the struggle of dealing with potholes is ongoing throughout the study area on both antiquated industrial streets and on newer roads. Full-depth reconstruction of heavily used routes in the study area would be warranted on a schedule that is prioritized according to the amount of heavy truck use.
FIGURE 11
Second Street in Everett:
Very Narrow and in Poor Condition
Source: Author.
FIGURE 12
Liquefied Natural Gas (LNG) Truck, Barely within
the Second Street Travel Lane
Source: Author.
FIGURE 13
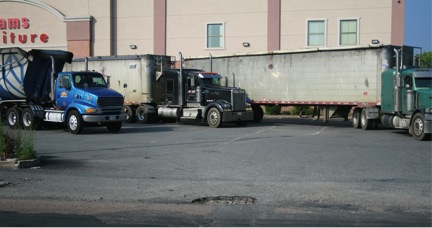
Adams Furniture Store on Second Street, Built in 2008:
Scrap Metal Trucks Wait in Parking Lot with Large Pothole
Source: Author.
At several locations in the study area, there is no curb to delineate the edge of the roadway, and trucks serving these locations simply back into a loading dock directly from the street. This is not unusual in industrial areas, and the few pedestrians simply try to avoid the trucks. Painted pedestrian paths have recently been added to roadways in Boston’s Newmarket industrial area, and this might be considered as part of any major reconstruction of study-area roads.
The Boston Region MPO maintains an extensive database of crashes. Crash reporting practices by state and local law enforcement personnel have been consistent since 2002, and an 11-year record of crashes is available up through 2012. These records allow for the calculation of more reliable statistics that focus on crashes involving trucks in a small study area. While the crash reports sometimes include considerable detail, for the purposes of this study crashes have been grouped by whether or not there is an injury.
Within the study area, for the 11 years examined, there has been an average of 29 crashes each year that involved a truck, 19 percent of which resulted in an injury. The number of crashes that resulted in injuries during the most recently reported three years (2010 through 2012) were below average, but this should not be interpreted as a trend because of the small sample size. A weak economic environment during that period may have contributed to a there being fewer trucks on the road, which would likely be associated with a lower number of crashes.
The sections of the three major roadways that bound the study area, Route 99, Route 16, and US Route 1, experienced an average of 20 crashes involving a truck each year. Of these crashes, 24 percent resulted in an injury. The higher injury rate might be attributed to higher speeds on these peripheral roads than within the study-area road network.
Between 2002 and 2012, a total of 61 crashes within the study area involved a truck and resulted in an injury, including one fatality, in 2002. These 61 crashes occurred at intersections and locations throughout the study area, and no single location appears to be overrepresented in the number of truck crashes.
The two most important entrances to the study area from the west are Beacham Street, which connects with Route 99, and Second Street, which connects with Route 16. Beacham Street and Second Street are each used by more than 1,600 trucks per weekday, and neither is in acceptable physical condition.
In addition to general deterioration, Beacham Street also suffers from a major design deficiency. It is 32 feet wide throughout Everett, with the exception of its westmost block, where it meets Route 99, at which point it narrows to 26 feet.
Large trucks turning at this intersection frequently ride up on and damage the sidewalks, a problem that the installation of steel bollards, which have been regularly damaged, has been unable to prevent.
The reconstruction of the Everett portion of Beacham Street is being proposed by the City of Everett, and a Functional Design Report (FDR)2 was prepared in Month 2015. Truck routing and traffic engineering strategies for improving the connection between Beacham Street and Route 99 would be implemented as part of this project. At some point, more aggressive treatments of the Beacham Street–Route 99 connection could be considered in conjunction with land takings and a widening of Beacham Street at Route 99.
The analysis and proposals of this study fully complement the project proposed in the FDR. The truck flow improvements recommended here would not lessen truck flows on Beacham Street, but should optimize the flow of these trucks through other parts of the study area. In addition, the development of detailed truck flows by type between Beacham Street and the rest of the study area might be helpful in justifying the Beacham Street reconstruction, and might be used to inform the final design.
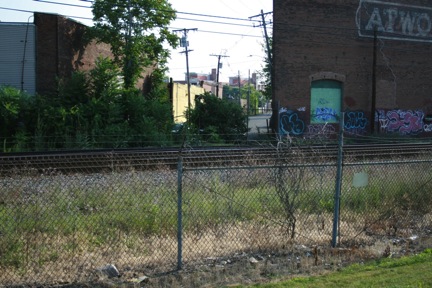
Second Street is narrow, but unlike the problematic connection between Beacham Street and Route 99, Second Street meets Route 16 at an angle that allows even the largest trucks to navigate the turns to or from Route 16 with relative ease when serving points to the west. The problem is that almost all traffic leaving the study area on Second Street makes a left turn onto Route 16 westbound. There is only one northbound lane on Second Street and the signal cycles allocate more green time to Route 16, which has higher traffic volumes. Consequently, traffic on Second Street must sometimes wait in the approach queue for two, or even three, signal cycles (see Figure 14).
FIGURE 14
Traffic Queue on Second Street, Approaching Route 16
Source: Author.
Traffic congestion and idling at this intersection negatively impact the potential for redevelopment at the site of the former Market Forge Corporation, a group of buildings roughly between this intersection and the commuter rail line to the south. Second Street represents the best route for traffic accessing the study area using Route 16 to or from the west. There appears to be no potential alternative gateway for this traffic, and current traffic levels should be assumed for any planning related to the Market Forge site. Traffic would flow better on Second Street if a second northbound lane on Second Street were added at Route 16; this recommendation and its planning implications are discussed later in this memorandum.
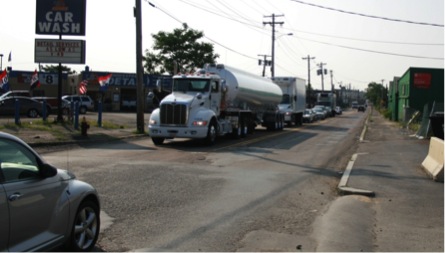
The three harbor crossings that prohibit hazardous cargoes charge a toll for vehicles entering downtown Boston, but charge no toll for vehicles exiting Boston. This toll scheme was implemented in the 1980s when the 25-cent tolls for passenger cars were replaced with a 50-cent inbound-only toll. Tolls are much higher now, and they provide a major financial incentive to drive through the study area to avoid paying the toll.
A pattern of traffic flow that could clearly be attributed to toll avoidance was observed during the data collection phase of this study. A major directional imbalance of light vehicles was observed on Beacham Street, especially for taxis and limousines, many of which have left Logan Airport and cut through the study area to avoid paying the higher, commercial-vehicle tolls charged for inbound travel through the harbor crossings.
All-electronic tolling has recently been implemented on the Tobin Bridge, and this technology will be implemented on all existing Massachusetts toll facilities. The new system of cameras and transponders is designed to allow for tolling on the Tobin Bridge in both directions, but there are no current plans to do this. If tolls were applied in both directions, the directional imbalance caused by toll avoidance would be reduced. All-electronic tolling also makes possible congestion pricing and charging higher tolls for users who do not have transponders. Study-area traffic would be impacted by any material change in the current tolling system.
All buildings on Spruce Street between Williams Street on the south side of the study area and US Route 1 at the north were built after the 1973 fire. This part of Spruce Street connects the older Chelsea residential areas north of US Route 1 that were untouched by the fire with the Admiral’s Hill neighborhood on the Mystic River, which is an adaptive reuse of the former Chelsea Naval Hospital.
Between these residential areas at the study area’s periphery, Spruce Street serves a mix of logistic and manufacturing businesses, as well a number of newer, mid-rise offices. The office developments are set back from Spruce Street and are ringed with surface parking in a pattern typical of suburban development. The Mystic Mall has the longest stretch of Spruce Street frontage, with curb cuts leading to its expansive parking lot. The Spruce Street business community is gradually evolving, but the need of Spruce Street to support diverse land uses into the foreseeable future is assumed.
Substantial truck and light-vehicle traffic is generated by businesses on or near Spruce Street. Spruce Street accommodates traffic accessing other locations in the study area as well as traffic passing through the study area as part of regional travel patterns.
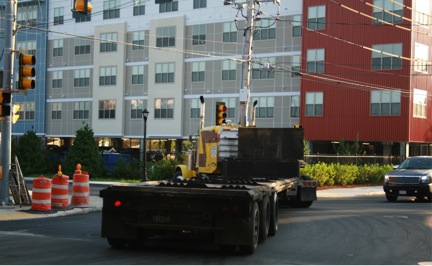
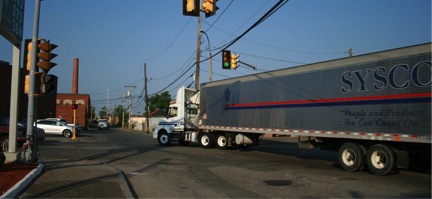
One of the major problems addressed in this study is the lack of a good roadway connection between US Route 1 and many industrial locations in the study area. As seen in Figure 15, most of the trucks leaving US Route 1 southbound at the Carter Street off-ramp turn onto Everett Avenue and then use Spruce Street to reach a study-area location south of the commuter rail line. For the return trip, trucks also use Spruce Street, but continue on it all the way to US Route 1, where there is a heavily used on-ramp for US Route 1 northbound. As shown in Figure 7 (on page 16) parts of the Spruce Street corridor are undergoing upscale development.
The findings of this study support a proposal to extend Carter Street as a way to serve truck traffic between US Route 1 and industries in the study area better. The diversion of truck traffic away from Spruce Street would better allow development in the corridor to evolve while accommodating its own truck traffic and some regional traffic.
FIGURE 15
Truck Turning Left from Carter Street onto Everett Avenue
after Exiting US Route 1 Southbound
Source: Author.
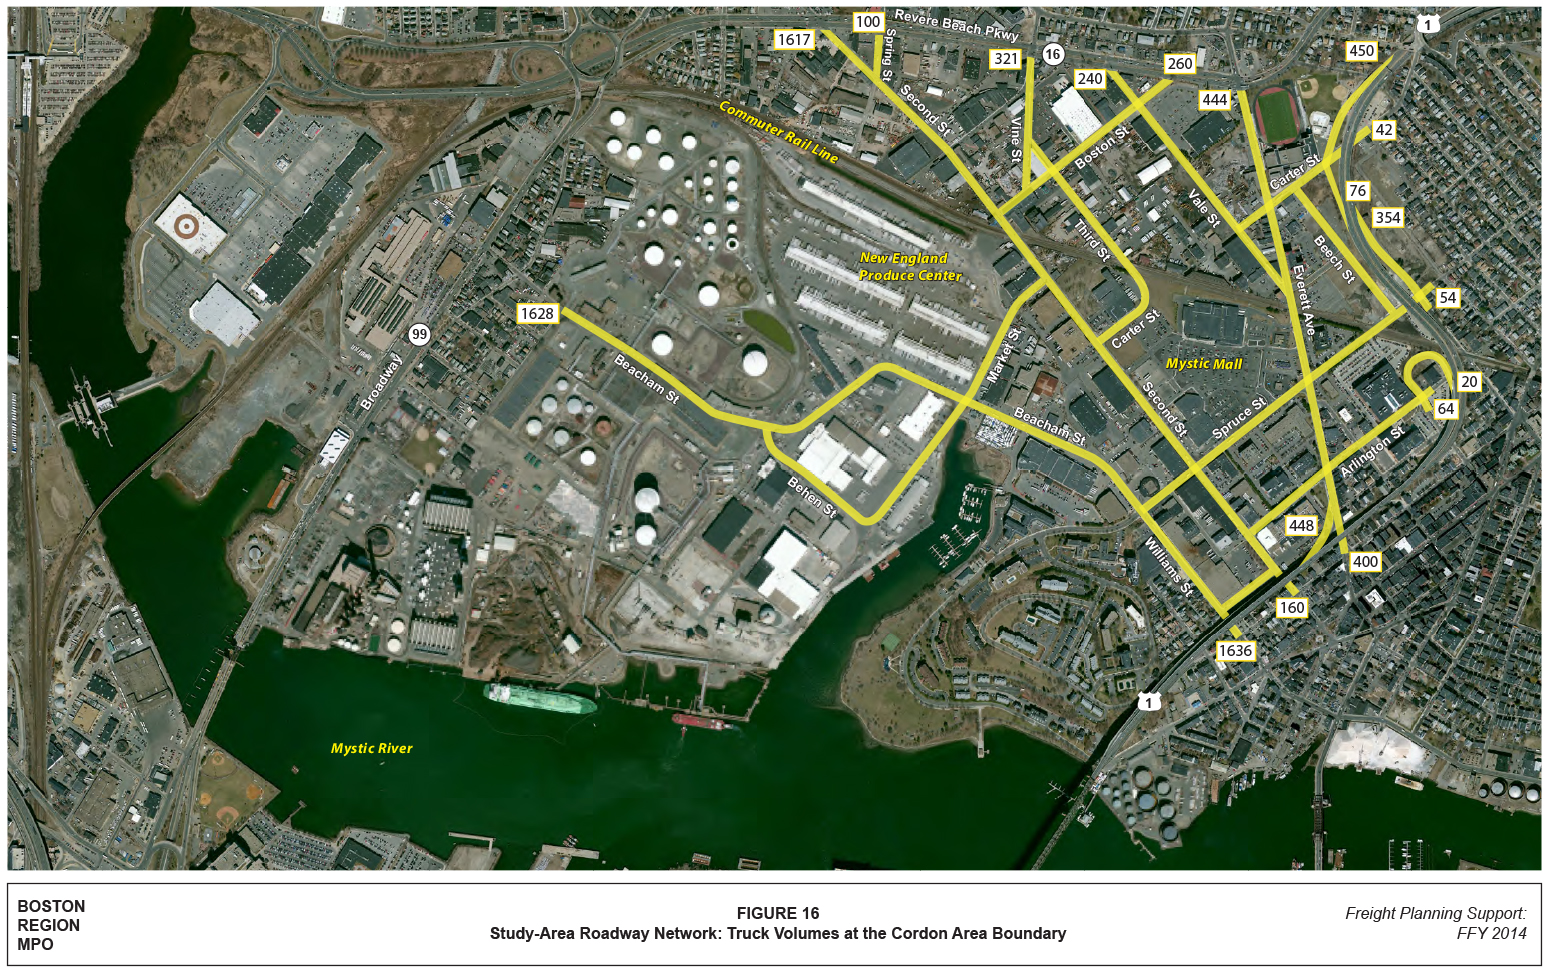
The analytical framework used in this study was the traffic cordon. A portion of the road network in the study area into which vehicles might enter at a number of well-defined points at the periphery, referred to as the cordon area, was identified. Over the course of a weekday, an equivalent number of vehicles are assumed to leave, as well as to enter, the cordon area. The numbers of vehicles entering and leaving the cordon area were estimated for light vehicles and for eight types of trucks; analyzing the flows of these vehicles through the cordon area was the basic tool of the study. Roadways within the cordon area and the weekday total number of trucks entering or leaving that area are shown in Figure 16.
Most traffic analysis concerns the morning and evening peak periods, when the challenge of optimizing traffic flow is greatest. In these types of analyses, trucks and buses are important primarily as components of the total traffic volume because their size, degree of maneuverability, and interactions with other vehicles have a greater effect than automobiles on the traffic flow characteristics of the roadways being studied.
This study focused mostly on trucks, whose peak travel times are fundamentally different from those of household travel in autos and commercial travel using light vehicles. Truck travel in the study area reaches its peak between 5:00 and 7:00 in the morning, remains steady throughout the morning and midday, and then begins to gradually decline in the early afternoon. This pattern is similar to those observed in similar studies that measured truck traffic throughout a weekday (for a 14-hour period).
The basic measurement used in this study is weekday truck traffic volumes, a number that reflects both the total burden of truck traffic on area roadways and the role of study-area trucks in the region’s economy. The percentage of traffic that trucks represent can be calculated from the data that were obtained, but all of the analysis in this study dealt with the actual numbers of trucks per weekday on study-area roadways, obtained by direct observation.
Three different techniques were used in this study to gather traffic data:
Traffic volumes by hour and by day of the week were obtained by using ATRs at key points within the cordon area. ATRs can be used to distinguish between large and small vehicles, though this is not usually possible in dense urban areas and most of the 24-hour ATR counts measured only the total number of vehicles.
FIGURE 16
Study-Area Roadway Network: Truck Volumes at the Cordon Area Boundary
ATR counts of trucks entering or leaving the cordon area were supplemented by data from camera-based classification turning counts conducted at key intersections within the study area during daylight hours. The camera-based counts classified vehicles by three types—light vehicles, trucks, and buses—as the traffic was observed turning at the counted intersections. These daylight-only data were extrapolated to approximate a daily count (for weekdays) using information from ATR and manual counts.
A third source of truck volume data was manual turning counts, for which trucks were also classified into one of the eight truck types described previously. These counts were undertaken at selected study-area intersections and provided the basis for splitting weekday truck volumes into eight distinct groups. Exploratory work at the beginning of the study suggested that counting for a few hours in the early morning and a few hours sometime at midday would provide a breakdown of truck types that could be extrapolated to an entire day.
Manual counts that were performed at several locations prior to dawn corroborated ATR classification counts showing that peak truck volumes precede the morning rush hour at some locations. Also, turning movements categorized by the eight truck types were used to develop hypothetical traffic flows that would result from extending Carter Street, allowing the diverted truck traffic to be better matched to its destination.
After the data were gathered, they were expanded to approximate weekday traffic volumes. Adjustments were made to the totals of different vehicle classes so that the number of vehicles of each type entering the cordon area each weekday would equal the number leaving each weekday for each type.
A summary of this balancing process is presented in Tables 2 and 3. The 17 points where trucks enter or leave the codon area are listed in order starting with the northmost location, Second Street at Route 16, and then proceeding clockwise to Beacham Street, the westmost location at which trucks enter or leave the cordon area. As shown in Table 2, a total of 65,600 vehicles were estimated to enter the cordon area each weekday. Of those vehicles, 4,157 were trucks, about 6 percent of the total traffic. The same totals were assumed to leave the cordon area, as shown in Table 3. While the 6 percent figure may not seem particularly high, some entry and exit points have much higher percentages. Also, the Mystic Mall and some smaller shopping areas in the cordon area generate significant amounts of auto traffic.
TABLE 2
Daily Volumes of Vehicles Entering the Cordon Area on Weekdays
| Cordon Crossing | Total | Light Vehicles | Trucks | Percent Trucks |
| Second Street (north end) | 8,600 | 7,694 | 906 | 11% |
| Spring Street | 300 | 270 | 30 | 10% |
| Vine Street | 4,000 | 3,820 | 180 | 5% |
| Vale Street | 2,900 | 2,780 | 120 | 4% |
| Boston Street | 2,900 | 2,750 | 150 | 5% |
| Everett Avenue (north end) | 6,200 | 5,945 | 255 | 4% |
| Carter Street-US 1 ramps | 6,000 | 5,550 | 450 | 8% |
| Carter Street-local | 800 | 780 | 20 | 3% |
| Spruce Street-US 1 on-ramp | * | * | * | n/a |
| Spruce Street-local | 4,100 | 4,069 | 31 | 1% |
| Arlington Street-US 1 on-ramp | * | * | * | n/a |
| Arlington Street-local | 1,500 | 1,466 | 34 | 2% |
| Everett Avenue-US 1 on-ramp | * | * | * | n/a |
| Everett Avenue (south end) | 10,700 | 10,450 | 250 | 2% |
| Second Street (south end) | 1,200 | 1,160 | 40 | 3% |
| Williams Street | 12,000 | 11,026 | 974 | 8% |
| Beacham Street | 4,400 | 3,683 | 717 | 16% |
| Total vehicles entering | 65,600 | 61,443 | 4,157 | 6% |
* Cordon crossing only for exiting vehicles
Source: CTPS.
TABLE 3
Daily Volumes of Vehicles Exiting the Cordon Area on Weekdays
Cordon Crossing |
Total |
Light Vehicles |
Trucks |
Percent Trucks |
||||
Second Street (north end) |
6,000 |
5,289 |
711 |
12% |
||||
Spring Street |
600 |
530 |
70 |
12% |
||||
Vine Street |
3,600 |
3,459 |
141 |
4% |
||||
Vale Street |
2,700 |
2,580 |
120 |
4% |
||||
Boston Street |
2,700 |
2,590 |
110 |
4% |
||||
Everett Avenue (north end) |
8,000 |
7,811 |
189 |
2% |
||||
Carter Street-US 1 ramps |
1,000 |
924 |
76 |
8% |
||||
Carter Street-local |
800 |
778 |
22 |
3% |
||||
Spruce Street-US 1 on-ramp |
7,500 |
7,146 |
354 |
5% |
||||
Spruce Street-local |
1,000 |
977 |
23 |
2% |
||||
Arlington Street-US 1 on-ramp |
1,000 |
980 |
20 |
2% |
||||
Arlington Street-local |
800 |
770 |
30 |
4% |
||||
Everett Avenue-US 1 on-ramp |
4,000 |
3,552 |
448 |
11% |
||||
Everett Avenue (south end) |
6,800 |
6,650 |
150 |
2% |
||||
Second Street (south end) |
1,900 |
1,780 |
120 |
6% |
||||
Williams Street |
6,500 |
5,838 |
662 |
10% |
||||
Beacham Street |
10,700 |
9,789 |
911 |
9% |
||||
Total vehicles exiting |
65,600 |
61,443 |
4,157 |
6% |
||||
Source: CTPS.
Balanced traffic flows such as those shown for the total number of trucks entering and leaving the cordon area were also developed for all of the intersections in the study area’s network, but traffic flows within the network will only be presented as part of the analysis of the Carter Street Extension.
The largest amount truck flows are on the Beacham Street–Williams Street corridor. The data for these flows are shown in Tables 2 and 3, and more than 1,600 trucks enter or leave the cordon area at each of these two points. An analysis of available data suggests that few of these trucks are traveling nonstop the entire length of either of those streets. Most of the trucks using Beacham Street or Williams Street are making a stop someplace within the study area, or they are crossing the study area without stopping but are entering or leaving the cordon area via a street other than Beacham or Williams, such as Second Street at Route 16, which is used by more than 1,600 trucks.
The westmost point in the cordon area is Beacham Street at its intersection with Robin Street. There are three paths connecting this point with Route 99, which is 800 feet west of the intersection: a direct route on Beacham Street; via Robin Street; and via Bow Street in the eastbound direction only. These three roads were analyzed in a 2012 Functional Design Report (cited in a previous section). This study extends the analysis to areas farther east to understand how Beacham Street traffic collected from these three roadways relates to traffic flow in the rest of the study area’s network.
The Beacham Street–Williams Street corridor is the most important bypass route for avoiding harbor-crossing tolls, and most of the light vehicle traffic on these streets travels the entire length of the corridor. This is readily seen by looking at the light-vehicle volumes in Tables 2 and 3. At the location where Williams Street enters the cordon area, more than 11,000 westbound light vehicles enter the cordon area each weekday, compared with fewer than the 6,000 that exit at the same location. The simplest assumption is that 6,000 light vehicles enter the cordon area and 6,000 leave it at that location to reach destinations that would not involve a harbor crossing, while an additional 5,000 leaving the cordon area are destined for Route 99 or Route 16 using a path to their final destination that does not require a toll payment.
Toll avoidance is also evident at the Beacham Street end of the corridor, Only 3,683 eastbound light vehicles use Beacham Street to enter the cordon area, and 9,789 westbound vehicles leave from there. Eastbound traffic at this location includes 717 trucks that make up 16 percent of traffic, the highest percentage of trucks observed at one location within the study-area network.
A clear pattern of toll avoidance was not observed for trucks. At Beacham Street, the 911 westbound trucks leaving the cordon area exceeded the 717 eastbound trucks entering the area there. This count is counterbalanced, however, by the 906 eastbound trucks entering the cordon area at Second Street, exceeding the 711 westbound trucks leaving the cordon area at that location. Small directional imbalances such as these are seen at most locations at the cordon boundary for both light vehicles and trucks. The imbalances can be attributed to the fact that some routes’ connecting points at the cordon boundary with locations within the study area are more convenient in one direction than in the other, often for reasons such as avoiding left turns.
Tables 2 and 3 show another type of traffic imbalance at locations at the cordon boundary. At Carter, Spruce, and Arlington streets, and at the south end of Everett Avenue, traffic crossing the cordon boundary was further subdivided based on whether traffic was using a US Route 1 on- or off-ramp or was using a local street to enter or leave the cordon area. This system of defining study-area entrances and exits added important detail to the estimated traffic flows, but resulted in some apparent flow imbalances.
An important example of an imbalance of entering and exiting vehicles at a given location is the busy Spruce Street entrance to the US Route 1 northbound on-ramp. At that location on the cordon boundary, an estimated 7,146 light vehicles leave the cordon area via the on-ramp per weekday, but only 977 vehicles enter the nearby residential neighborhood that is just outside of the study area. In contrast, there are an estimated 4,069 light vehicles that enter the study area per weekday at this point, and most of them turn immediately to the on-ramp for US Route 1. The rest of the on-ramp traffic consists of light vehicles and a significant number of trucks. The estimated weekday volume of truck traffic into and out of the residential neighborhood at this location is minimal, with an estimated 31 trucks per weekday entering the study area (from the adjacent residential neighborhood) and 20 leaving the study area.
In Tables 4 and 5, the total truck volumes presented in Tables 2 and 3 are broken down into the eight truck types used in this study. The types of trucks seen in the greatest numbers are single-unit trucks of “other” configurations, such as those shown at the bottom of Figure 6 (on page 15). Each weekday, an estimated 1,218 trucks of this type enter and leave the cordon area, representing 29 percent of the trucks crossing the cordon boundary. The previous discussion touched on the variety of vehicle types and industry niches using fleets of trucks that would fall into this miscellaneous category, and the large percentage of this category of truck traffic reflects the diverse industries with specialized truck requirements. The much smaller percentage of semi-trailers with “other” configurations represents trucks that serve primarily the scrap recycling and construction industries.
TABLE 4
Daily Volumes of Trucks Entering the Cordon Area, by Truck Type, on Weekdays
| Cordon Crossing | Total | Box-type trucks Semis | box-type trucks Singles | Refrigerated Semis | Refrigerated Singles | Hazardous Semis | Hazardous Singles | Other type Semis | Other type Singles |
| Second Street (north end) | 906 | 79 | 169 | 155 | 122 | 106 | 40 | 30 | 205 |
| Spring Street | 30 | 7 | 23 | ||||||
| Vine Street | 180 | 11 | 27 | 5 | 27 | 11 | 5 | 94 | |
| Vale Street | 120 | 13 | 17 | 10 | 10 | 3 | 10 | 57 | |
| Boston Street | 150 | 3 | 25 | 6 | 26 | 3 | 13 | 74 | |
| Everett Avenue (north end) | 255 | 16 | 16 | 47 | 36 | 47 | 93 | ||
| Carter Street-US 1 ramps | 450 | 36 | 41 | 51 | 85 | 28 | 9 | 87 | 113 |
| Carter Street-local | 20 | 6 | 14 | ||||||
| Spruce Street-US 1 on-ramp | * | ||||||||
| Spruce Street-local | 31 | 14 | 17 | ||||||
| Arlington Street-US 1 on-ramp | * | ||||||||
| Arlington Street-local | 34 | 5 | 29 | ||||||
| Everett Avenue-US 1 on-ramp | * | ||||||||
| Everett Avenue (south end) | 250 | 90 | 7 | 29 | 4 | 7 | 4 | 109 | |
| Second Street (south end) | 40 | 11 | 6 | 11 | 12 | ||||
| Williams Street | 974 | 78 | 210 | 73 | 131 | 116 | 57 | 37 | 272 |
| Beacham Street | 717 | 25 | 73 | 57 | 192 | 151 | 14 | 99 | 106 |
| Total Trucks Entering | 4,157 | 261 | 706 | 417 | 669 | 408 | 141 | 337 | 1,218 |
Source: CTPS.
TABLE 5
Daily Volumes of Trucks Leaving the Cordon Area, by Truck Type, on Weekdays
| Cordon Crossing | Total | Box-type trucks Semis | box-type trucks Singles | Refrigerated Semis | Refrigerated Singles | Hazardous Semis | Hazardous Singles | Other type Semis | Other type Singles |
| Second Street (north end) | 711 | 49 | 127 | 84 | 71 | 156 | 51 | 23 | 150 |
| Spring Street | 70 | 9 | 13 | 48 | |||||
| Vine Street | 141 | 23 | 39 | 5 | 17 | 4 | 5 | 48 | |
| Vale Street | 120 | 29 | 14 | 14 | 6 | 57 | |||
| Boston Street | 110 | 3 | 17 | 8 | 9 | 73 | |||
| Everett Avenue (north end) | 189 | 63 | 32 | 32 | 62 | ||||
| Carter Street-US 1 ramps | 76 | 3 | 13 | 4 | 26 | 6 | 24 | ||
| Carter Street-local | 22 | 8 | 14 | ||||||
| Spruce Street-US 1 on-ramp | 354 | 30 | 17 | 30 | 37 | 40 | 3 | 110 | 87 |
| Spruce Street-local | 23 | 8 | 3 | 12 | |||||
| Arlington Street-US 1 on-ramp | 20 | 1 | 19 | ||||||
| Arlington Street-local | 30 | 1 | 2 | 2 | 25 | ||||
| Everett Avenue-US 1 on-ramp | 448 | 25 | 93 | 61 | 146 | 29 | 94 | ||
| Everett Avenue (south end) | 150 | 8 | 50 | 20 | 20 | 14 | 8 | 30 | |
| Second Street (south end) | 120 | 6 | 6 | 46 | 6 | 56 | |||
| Williams Street | 662 | 42 | 84 | 54 | 71 | 114 | 55 | 26 | 216 |
| Beacham Street | 911 | 34 | 152 | 127 | 178 | 96 | 6 | 115 | 203 |
| Total Trucks Exiting | 4,157 | 261 | 706 | 417 | 669 | 408 | 141 | 337 | 1,218 |
Source: CTPS.
A total of 1,086 refrigerated trucks enter the cordon area each weekday; 38 percent of them are semi-trailers. Refrigerated trucks make up 26 percent of all of the trucks that enter the cordon area, and numerous unrefrigerated box-type trucks seen entering the cordon area were clearly marked as transporting food. From assessing counts of all of the trucks that transport food, it is clear that food distribution is the most important generator of truck traffic in the cordon area.
Almost as many box-type trucks as refrigerated trucks enter the study area. While the box configuration has only minor variations, it is impossible to generalize about the industries served by this type of truck. These vehicles are used extensively by for-hire carriers that transport goods other than food, such as the trucks shown in Figure 3 (on page 11), which are carrying household goods and distributing airfreight. Some other types of nonrefrigerated box-type trucks are used for food distribution, and some are used by specialized contractors; the latter were sometimes observed traveling in a small, caravan of various types of trucks, often including a flatbed (“other”) truck carrying materials to a work site. For this study it was only possible to identify trucks by vehicle type and not by the industry served; therefore, this discussion provides only a few examples of the types of industries that use box-type trucks.
The truck type with the smallest number of trucks in the study area is hazardous cargo trucks, only 26 percent of which were single-unit trucks, which can deliver home heating oil. Even if trucks had been counted during the winter, it is unlikely that the total number of hazardous cargo trucks would have risen above fourth place.
Even though there is a significant number of hazardous cargo trip generators in the study area, many hazardous cargoes pass through the study area without stopping because of the harbor crossing prohibition. The importance of this hazardous cargo route is suggested by the fact that of the 549 hazardous cargo trucks entering the cordon area, 31 percent entered at Williams Street, the cordon boundary location closest to the working waterfront in Chelsea and East Boston, compared with only 22 percent of the nonhazardous cargo trucks entering at Williams Street.
Not all of the eight truck types were observed at every location at the cordon boundary. Only the most heavily used entrance points—the northern end of Second Street, Williams and Beacham streets, and the US Route 1 off-ramp to Carter Street—were used by all eight truck types. However, trucks of all eight types were observed leaving the cordon areas at each of those locations, with the substitution of the Spruce Street US Route 1 on-ramp, used by exiting vehicles, for the Carter Street off-ramp from US Route 1, which is used by entering vehicles. The heavily used Everett Avenue on-ramp to US Route 1 was used by seven of the eight types of trucks, since hazardous cargoes are prohibited at this entrance. The lesser-used cordon line locations are often used by trucks that serve particular locations that are very close to the boundary of the study area (both inside the area and just outside of the area).
This study resulted in three proposed changes to the roadway system in the study area, the most consequential of which is the extension of Carter Street. The proposed road network, which incorporates these and related modifications, is shown in Figure 17.
As discussed previously, an important route for trucks is the connection of US Route 1 with the industrial sites that are located close to the working waterfront. Extending Carter Street over the commuter rail line would allow a direct connection between US Route 1 and the industrial sites on Second Street, and a connection from Second Street to the Beacham Street corridor via Market Street.
The potential for use of the Carter Street Extension by the eight types of trucks was estimated, and the results are presented in Table 6. Currently, all trucks that would be expected to use the Carter Street Extension would be assumed to use either Boston Street to the west of Carter Street or Spruce Street to the east. The volumes of trucks observed for this study on these two streets are shown in the No-Build section of Table 6 scenario, and the corresponding Boston Street and Spruce Street locations (for which truck volumes were "reestimated” for this scenario) are shown in Figure 17.
An analysis of the turning movements by truck type within the study area, which incorporated the locations of different types of truck trip generators, provided information with which to calculate the numbers and types of trucks that could be diverted to the new Carter Street Extension were it to be built. These truck flows were reassigned for each of the eight truck types; the results are shown in the Build scenario in Table 6.
The estimated changes in the volumes of truck traffic on Boston and Spruce streets were calculated (see Table 6). Carter Street Extension is projected to carry 543 trucks per weekday, 29 percent of which currently are estimated to be using Boston Street and 71 percent to be using Spruce Street.
Of the estimated 543 trucks that would use a Carter Street Extension, 251, or 46 percent, would be semi-trailers of some type, and all but 10 of the semi-trailers would be diverted from Spruce Street. While the travel distance between US Route 1 and the Beacham Street corridor is roughly the same using either Boston Street or Spruce Street, using Spruce Street is much easier for semi-trailers because of the easier-to-negotiate turns at the intersections of Everett Avenue with Carter Street and with Spruce Street. In contrast, similar numbers of single-unit trucks would be diverted, 150 and 142 from Boston and Spruce streets, respectively.
Even with the implementation of the Carter Street Extension, Spruce Street would remain an important route for trucks. There are numerous truck trip generators within the study area for which Spruce Street would still be part of a logical connection.to the regional road network. In addition, trucks serving the Chelsea and East Boston working waterfront area would also use Spruce Street to connect with US Route 1. The expectation for the Carter Street Extension is that it would remove that truck traffic from Spruce Street for which Spruce Street is a clearly inferior route.
Auto and other light-vehicle traffic would also benefit from the Carter Street Extension. A new access point would be available for the Mystic Mall, the study area’s most important auto traffic generator. This would spread mall auto traffic over more entrances and reduce dependence on the existing driveways on Everett Avenue and on Spruce and Second streets. However, the impacts on auto volumes of the Carter Street Extension were not estimated because these would require a detailed study of travel patterns to and from the Mystic Mall.
FIGURE 17
Proposed Changes to Roadway System
TABLE 6
Daily Volumes of Trucks Using a Proposed Carter Street Extension
and Parallel Routes, per Weekday
Scenario |
Truck Type |
Boston Street |
Carter Street Extension |
Spruce Street |
|||||
No-Build |
Box-type trucks–semis |
10 |
0 |
116 |
|||||
No-Build |
Refrigerated trucks–semis |
16 |
0 |
253 |
|||||
No-Build |
Hazardous cargoes–semis |
3 |
0 |
66 |
|||||
No-Build |
Other configurations–semis |
31 |
0 |
168 |
|||||
No-Build |
Box-type trucks–single |
82 |
0 |
242 |
|||||
No-Build |
Refrigerated trucks–single |
91 |
0 |
304 |
|||||
No-Build |
Hazardous cargoes–single |
3 |
0 |
33 |
|||||
No-Build |
Other configurations–single |
222 |
0 |
424 |
|||||
No-Build |
Total Trucks |
458 |
0 |
1,606 |
|||||
Build |
Box-type trucks–semis |
10 |
50 |
66 |
|||||
Build |
Refrigerated trucks–semis |
16 |
40 |
213 |
|||||
Build |
Hazardous cargoes–semis |
3 |
36 |
30 |
|||||
Build |
Other configurations–semis |
21 |
125 |
53 |
|||||
Build |
Box-type trucks–single |
52 |
44 |
228 |
|||||
Build |
Refrigerated trucks–single |
51 |
80 |
264 |
|||||
Build |
Hazardous cargoes–single |
3 |
8 |
25 |
|||||
Build |
Other configurations–single |
142 |
160 |
344 |
|||||
Build |
Total Trucks |
298 |
543 |
1,223 |
|||||
Change |
Box-type trucks–semis |
0 |
+50 |
-50 |
|||||
Change |
Refrigerated trucks–semis |
0 |
+40 |
-40 |
|||||
Change |
Hazardous cargoes–semis |
0 |
+36 |
-36 |
|||||
Change |
Other configurations–semis |
-10 |
+125 |
-115 |
|||||
Change |
Box-type trucks–single |
-30 |
+44 |
-14 |
|||||
Change |
Refrigerated trucks–single |
-40 |
+80 |
-40 |
|||||
Change |
Hazardous cargoes–single |
0 |
+8 |
-8 |
|||||
Change |
Other configurations–single |
-80 |
+160 |
-80 |
|||||
Change |
Total Trucks |
-160 |
+543 |
-383 |
|||||
Source: CTPS.
The proposed Carter Street extension project would have three basic elements:
The proposed Beech Street connection to the US Route 1 on-ramp would be important for accommodating trucks that are expected to use the Carter Street Extension to return to US Route 1. This improvement would be about a quarter mile from Carter Street and is discussed in the following section.
A key finding of the analysis summarized in Table 6 is that a large portion of the trucks diverted to the Carter Street Extension would be heavy bulk carriers like the ones described previously and shown in Figure 6 (on page 15). The large truck at the top of Figure 6 is leaving US Route 1 and entering Carter Street, but can only travel 500 feet before being forced to turn onto Everett Avenue, a problem that was illustrated in Figure 15 (on page 25). The trucks in both of these figures were probably destined for a study-area location that would be served more directly by the Carter Street Extension.
Traveling straight through the intersection in Figure 15 leads to the dead end of Carter Street’s north section, shown in Figure 18, a few feet from the commuter rail tracks. Extending Carter Street over the railroad tracks would provide a convenient connection for trucks serving locations in the Second Street and Beacham Street corridors, and a good connection for light vehicles, many of which would be destined for the nearby Mystic Mall.
Figure 19 is another photo of the north section of Carter Street, taken from Mystic Mall property immediately south of the railroad line. As the photos of this part of Carter Street make clear, this is not a wide corridor. If the north part of Carter Street were to be reconstructed to the same width as the south part shown in Figure 8 (on page 17), some property takings would be required.
FIGURE 18
North Section of Carter Street, Which Ends at Commuter Rail Tracks
Source: Author.
FIGURE 19
Another View of the North Section of Carter Street
Source: Author.
The current plan for the relocated commuter rail station and new Silver Line Gateway terminus discussed previously arranges these facilities next to the rail line from Everett Avenue (see Figure 10 on page 19) to a point west of Carter Street, effectively blocking an extension of Carter Street. In order to extend Carter Street, it would be necessary to reposition the commuter rail platform and Silver Line turnaround loop to keep these facilities east of Carter Street. Close consultation between Chelsea, the MBTA, and owners of the Mystic Mall would be required to implement all three projects.
In order to build this new facility, the issue of adding railroad grade crossings—which are considered detrimental to urban environments in terms of both safety and urban design—would need to be addressed. Constructing a new grade crossing would require broad consensus by local stakeholders as well as approval by the Massachusetts Department of Public Utilities (DPU). The powers of the DPU in this area are enumerated in Massachusetts General Laws, Chapter 160, which grant it wide latitude in regulating grade crossings.
The analysis of truck traffic diversions assumed that the Third Street grade crossing would be closed as a DPU-mandated requirement for opening a new grade crossing at Carter Street. However, neither a required closure of the Third Street grade crossing nor the approval of a new grade crossing for Carter Street can be assumed.
Currently, the south part of Carter Street curves around the new State Garden warehouse and becomes Third Street, as shown in Figure 20. The grade crossing shown in Figure 20 possibly could be eliminated, and Third Street locations northwest of the railroad line could be served by Boston Street.
FIGURE 20
Street Name Changes from Carter Street to Third Street at Curve in Road
Source: Author.
Traffic leaving the study area to go north on US Route 1 uses the busy Spruce Street on-ramp to US Route 1 at the eastern edge of the study area, as shown in Figure 7 (on page 16). As the road network is currently configured, trucks leaving the Second Street and Beacham Street corridors must travel most of the length of Spruce Street to reach the US Route 1 entrance.
With the Carter Street Extension, trucks destined for US Route 1 northbound would be able to leave the industrial areas via Carter Street. Currently, to access US Route 1, trucks must turn right on Beech Street to reach the closest entrance to US Route 1 northbound, which is located a quarter mile away, at Spruce Street. To alleviate this problem, an improvement proposed in this study would provide an alternative to the current truck route that requires trucks to make a left turn onto Spruce Street followed by an immediate left turn to enter US Route 1 northbound. The space available under the US Route 1 viaduct, which is currently used by MassDOT for bulk storage, could be to used build a direct connection between Beech Street and the northbound on-ramp. The location of this proposed direct connection is shown in Figure 21.
FIGURE 21
Beech Street at Spruce Street near US Route 1 Viaduct
Source: Author.
The difficulties for northbound traffic at the intersection of Second Street and Route 16 was discussed earlier. To address that problem, it is proposed that a second left-turn lane on Second Street at Route 16 be added. As could be seen in Figure 14 (on page 23), this would require widening Second Street, which would probably involve taking part of the parcel that includes the car wash business.
The car wash occupies a small triangular parcel wedged between Route 16 and Second Street. Across Route 16 is the Everett Veterans Memorial Stadium, an important Everett scholastic athletic facility. The potential Market Forge redevelopment site is located on the other side of Second Street. The car wash parcel might have potential to be a small park connecting these two important urban locations.
The Everett-Chelsea industrial area hosts a variety of industrial and nonindustrial activities that have coexisted and evolved in the decades since the disastrous 1973 Chelsea fire. While there is some manufacturing, the logistics functions of transshipment, storage, and distribution occupy the majority of industrial land and generate the most truck trips.
Based on the numbers of trucks observed, food is the most important business in the study area. Fresh produce makes up the largest percentage of the food transported in the cordon area. Its distribution from warehouses by refrigerated trucks starts before sunrise and only tapers off in the midafternoon. Unrefrigerated food and beverages are also distributed, and frozen fish is transshipped. The majority of manufacturing activity in the area is also related to food: meat packing and a commercial bakery. Most of the trucks that do not carry some type of food are carrying building supplies, scrap metal, or energy products such as gasoline and liquefied natural gas.
Nonindustrial land uses also generate truck traffic, albeit at lower levels. If an industrial site becomes a nonindustrial site, a net decrease in truck trips is certain. In the case of a potential casino that has been approved to be built on a site immediately to the west of the study area, any truck traffic serving the casino would be an increase since no alternative use has been envisioned for the heavily polluted site. It should be noted that the major traffic impacts of the proposed casino are expected to be passenger vehicles during evenings and weekends, times that experience lower volumes of truck traffic.3
Some parts of the road network in the study area are designed to standards that are appropriate for today’s large trucks and buses. However, many roads are narrow and are inadequate for today’s trucks and for the growth in pedestrian and bicycle travel. But most of the roads in the study area are subject to levels of truck traffic that challenge the municipal maintenance and reconstruction programs even for roads that meet current design standards. Data developed in this study are already being used in local investment grant applications.
This study proposes a small number of changes to the roadway system. These network modifications are intended to better serve existing traffic, both light vehicles and trucks, and to complement other proposed transportation improvements and major developments that are under consideration.
The most important proposal is the extension of Carter Street across the commuter rail line to better serve the flow of trucks between US Route 1 and the Second Street and Beacham Street industrial corridors. The closing of the Third Street grade crossing and an improved entrance the US Route 1 from Beech Street are recommended network changes related to the Carter Street Extension, which is projected to be used by more than 500 trucks weekday that would otherwise use the parallel Spruce and Boston streets. Access to the Mystic Mall for customers and suppliers would also be improved.
Improving the intersection of Second Street and Route 16 is also proposed. Second Street provides the best connection between much of the study area and Route 16. While there is potential for mixed-use redevelopment of nearby parcels, it can be assumed that the volumes of traffic on Second Street would continue to be high. Adding a second northbound lane at the intersection of Second Street with Route 16 would allow traffic, most of which is turning left, to clear the intersection within each signal cycle and would greatly reduce the long queues seen on Second Street. Some land taking would be required to implement this recommendation, which might be considered as part of other planning efforts already under way for this corner of the study area.
The Everett-Chelsea industrial area is often viewed as having large numbers of trucks, and roads that are in poor condition. However, in the course of this study, the vitality of commercial activity and effectiveness of the transportation system serving the area became
apparent. Detailed observation of transportation services supporting commerce in the study area led to the proposal of network improvements that would help industrial and nonindustrial businesses, as well as nearby residential areas, continue to develop successfully for decades to come.
WSK/wsk
1 Proposed Freight Planning Action Plan for the Boston Region MPO: Meeting the Goals and Addressing the Issues, Boston Region MPO, Month 2013.
2 Functional Design Report: Rehabilitation of Beacham Street, Everett, MA, City of Everett, April 2012.
3 Wynn Everett Draft Environmental Impact Report, EOEEA# 15060, December 16, 2013.