Technical Memorandum
DATE: February 1, 2018
TO: Boston Region Metropolitan Planning Organization
FROM: Bill Kuttner and Casey Claude, Boston Region MPO Staff
RE: The Safe Routes to School Program: Progress and Opportunities
Public health advocates have long sought to encourage more students to walk and bicycle to school. The immediate health benefit to students of daily exercise is clear. In addition, the regular use of these non-motorized modes for practical transportation can nurture capabilities, confidence, and habits during these formative years that can support a healthy lifestyle over an entire lifetime.
These public health benefits were recognized by Congress as the multi-year federal transportation authorization was being prepared in 2005. Federal funding was made available to support specific classes of Safe Routes to School (SRTS) efforts, and Massachusetts moved quickly to take advantage of these funding opportunities.
This memorandum will
The SRTS Program was created by the 2005 federal transportation authorization, Safe, Accountable, Flexible, Efficient Transportation Equity Act: a Legacy for Users (SAFETEA-LU).1 Each state was allocated an amount of formula funding dedicated to making walking and bicycling safer and more attractive alternatives for students in kindergarten through the eighth grade.
Between 70 and 90 percent of the funds were to be spent on infrastructure improvements related to school access, and the remaining 10 to 30 percent would be spent on supporting non-infrastructure activities such as
SAFETEA-LU required that each state use part of its allocation to fund a full-time state SRTS coordinator. It also directed the US Secretary of Transportation to provide grants to a non-profit organization that would support the SRTS Program through activities such as
To fulfill this requirement, the National Center for Safe Routes to School (National Center) was established in 2007 as part of the Highway Safety Research Center at the University of North Carolina.
SAFETEA-LU was in force until 2012. Under SAFETEA-LU, over 40 Massachusetts schools joined the SRTS Program and 25 of these implemented SRTS-funded infrastructure improvements in school vicinities.
The next federal authorization was Moving Ahead for Progress in the 21st Century (MAP-21), which took effect in July 2012.2 The various SRTS Program activities eligible for federal funding under SAFETEA-LU were still eligible under MAP-21, but the funds were no longer provided through a dedicated program. Instead, SRTS was one of a number of options in the new Transportation Alternatives Program (TAP), which included the former Transportation Enhancements and Recreational Trails programs of the earlier authorization. Critically, TAP was no longer 100 percent federally funded but required a 20 percent state or local match.
MAP-21 was in effect for a relatively short period of time, until a new, five-year authorization was enacted in 2015. The Fixing America’s Surface Transportation Act (FAST Act) formally renamed TAP the Surface Transportation Program (STP), but kept the same overall program structure, including the 80 percent limit on the federal funding share3 . Under MAP-21 and the FAST Act, SRTS infrastructure investments in Massachusetts have slowed considerably.
The federal guidelines for using TAP funding allow states significant flexibility in how they administer SRTS programs. A dedicated state SRTS coordinator is no longer required, and there is no requirement to spend a portion of SRTS funds on programmatic activities. Also, states do not need to document that SRTS funds are used to improve student safety near schools. However, any project designed to modern standards should improve safety, and SRTS funds support a wide range of school and municipal pedestrian and bicycle improvements.
Massachusetts is unique in several respects. Massachusetts is the only state which has contracted an outside partner, MassRIDES, to manage program efforts at SRTS schools. The Massachusetts Department of Transportation (MassDOT) manages the funding of SRTS infrastructure projects, but requires schools to participate in SRTS programs for a year prior to applying for project funding. This requirement is unique to Massachusetts, and MassDOT and MassRIDES cooperate to promote healthy travel programs in participating schools and to ensure that infrastructure projects support school travel and safety needs.
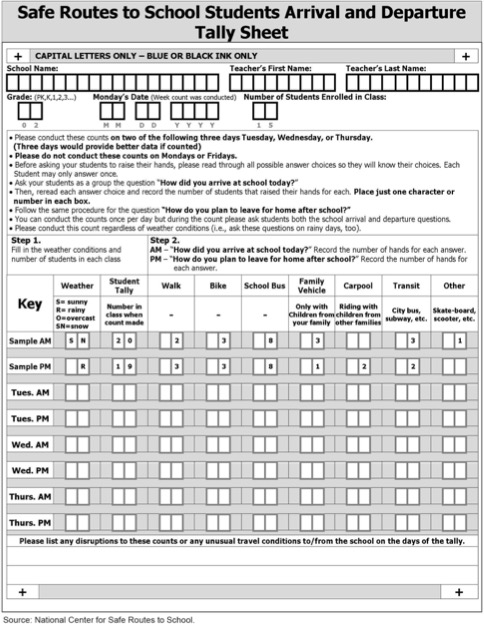
Collecting information on student travel has been important to the SRTS Program from the outset. Shortly after the National Center was established it developed a set of paper and online survey tools to learn about student travel and parental attitudes. The information most valuable to this study was obtained from the Tally Sheet, an image of which is shown in Figure 1. The student tallies are supposed to be taken once a day over the course of three days – on a Tuesday, Wednesday, and Thursday. Students are asked how they arrived at school that day and how they plan on leaving at the end of the school day.
Completed surveys are mailed to the National Center where they are entered into the National Center’s Data System. Standardized reports can be generated from these data and are available to government agencies and others with authorized access. Tallies and other survey results may be added to or removed from the Data System at the participating school’s discretion.
FIGURE 1
Safe Routes to School Student Arrival and Departure Tally Sheet
FIGURE 2
Boston Region Municipalities with Schools in the Study
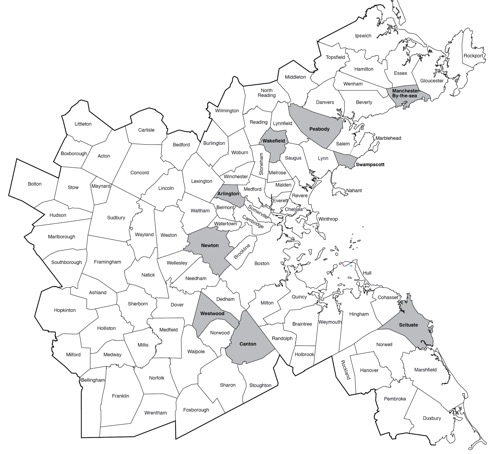
During the 2008-10 time period, 44 Massachusetts schools applied for SRTS infrastructure grants, and 28 of these schools were located in the Boston region. Fourteen of the schools in the Boston region completed an infrastructure project with SRTS funding, which makes them of interest to this study. Student tally records for nine elementary schools and one middle school in the Boston region are available in the National Center’s Data System.
Tally records from these nine elementary schools formed the sample used to develop statistics for this study. The few number of middle school tallies is unfortunate because students in the middle school age range are more able to walk or ride a bicycle safely between home and school. The municipalities in which the nine sample schools are located are shown in Figure 2.
Each of the nine elementary schools in the study sample completed one or more student travel tallies between 2008 and 2010, preceding the implementation of any SRTS-funded infrastructure improvements. If a school had performed more than one tally, the tallies were averaged and the average was used in this study to represent student travel at that school.
Student tally results for the nine Boston region SRTS schools and schools nationwide, which were in the National Center Data System during a similar time period, are presented in Table 1. The student totals shown in the table reflect the number of students in the year the school applied for SRTS infrastructure funding. These student totals represent the numbers of students in each group, even if there were absences on the day of the tally or if a classroom was unable to complete its tally.
Students’ travel choices, reported as percentages, are reflected in the table. The following travel modes are represented:
The percentages represent the shares of student trips. Many students use a different mode to travel home than they use to go to school. The number of students who bicycled was typically much smaller than the number who walked, and a reliable estimate of bicycle riders could not be calculated from the Boston region sample.
Table 1 shows the mode shares for the combined student population of the nine sample schools. Of the 3,368 students enrolled at the time of the tallies, about 23 percent walked or bicycled, 53 percent came by car, and almost all of the remaining 24 percent came by school bus. However, the national SRTS Program focuses its efforts on students who travel less than a mile to school. Table 1 shows that 2,260 students, 67 percent of the total enrollment of the nine schools, traveled less than a mile to school. The non-motorized modes were used by 33.9 percent of these students as compared with barely one percent of students who traveled more than a mile.
TABLE 1
Summary of Mode Share for Sample Schools
Student Tallies from 2008-10
| Type of Student Sample | Specific Sample | Total Students | Pedestrian or Bicycle | Family Car or Carpool | School Bus or Transit |
| Boston Region SRTS schools | Nine schools with student tallies | 3,441 | 22.9% | 52.9% | 24.2% |
| Boston Region SRTS schools | Students traveling more than a mile | 1,206 | 1.2% | 53.3% | 45.5% |
| Boston Region SRTS schools | Students traveling less than a mile | 2,235 | 33.7% | 54.1% | 12.2% |
| SRTS school | Bowen School in Newton | 372 | 50.3% | 44.9% | 4.8% |
| SRTS school | Dallin School in Arlington | 416 | 44.7% | 55.3% | 0.0% |
| SRTS school | Memorial School in Manchester | 221 | 40.7% | 46.2% | 13.1% |
| SRTS school | Hatherly School in Scituate | 153 | 38.6% | 40.5% | 20.9% |
| SRTS school | Dolbeare School in Wakefield | 194 | 35.6% | 51.5% | 12.9% |
| SRTS school | Downey School in Westwood | 194 | 25.3% | 43.8% | 30.9% |
| SRTS school | Stanley School in Swampscott | 311 | 22.5% | 77.5% | 0.0% |
| SRTS school | West Memorial School in Peabody | 243 | 16.9% | 60.1% | 23.0% |
| SRTS school | Hansen School in Canton | 156 | 9.6% | 54.5% | 35.9% |
| National SRTS Center database | Entire 2007-2009 database | 1,225,000 | 16.2% | 49.0% | 34.8% |
| National SRTS Center database | Students traveling more than a mile | 660,000 | 4.0% | 47.9% | 48.1% |
| National SRTS Center database | Students traveling less than a mile | 565,000 | 30.4% | 50.3% | 19.3% |
Source: National Center for Safe Routes to School.
Table 1 also shows travel choices for the 1,225,000 students whose schools conducted tallies; these data were included in the National Center Data System. 4 Only 46 percent of these students lived within a mile of their schools, and 30.4 percent of them reported walking or bicycling to school. A more significant difference between the Boston region and national samples is the greater use of school buses or transit for trips less than one mile in other parts of the country.
Many schools that provided tally data to the National Center Data System were actively seeking SRTS grants or were otherwise invested in SRTS or similar programs. While it is reasonable to infer an above average interest in SRTS by schools in this sample, it is not safe to conclude that a random national sample would necessarily show greater or less use of the non-motorized modes.
Mode shares for the nine sample schools are listed in Table 1 in descending order according to the non-motorized mode share for trips of less than a mile. Mode share varied significantly between the nine sample schools. As schools initiated or expanded SRTS and related programs, these walk and bicycle mode shares represented a starting point for each school. A number of factors can explain the differences in the mode shares for walking and bicycling between schools:
The use of school buses for trips of less than one mile also varies significantly. School district policies, including optional fees for shorter bus trips, determine to a large degree the use of school buses for these shorter trips.
All the tallies from the nine sample schools counted trips to school and to home separately. Mode choices for these two directions were very similar, and Table 1 combines the tally data for both directions. Some schools performed tallies in both the fall and spring, and the non-motorized modes had about a three percent higher share in the fall as in the spring. Finally, some tally summaries included weather conditions. Predictably, students walked and bicycled less during rainy weather, and the mode share was reduced by 7.5 percent.
The Massachusetts Travel Survey (2011-MTS), which was completed in 2011, has been the central resource for several studies and for developing the MPO’s travel demand model. The survey obtained responses about travel activities from all members of 15,040 households in Massachusetts. A summary of survey results is available at www.mass.gov/massdot/travelsurvey.
One of these studies, Exploring the 2011 Massachusetts Travel Survey: Barriers and Opportunities Influencing Mode Shift, analyzed a number of work and school travel markets and discussed various factors that influence mode choice.5 Primary school travel statistics developed from the 2011-MTS are summarized in Table 2.
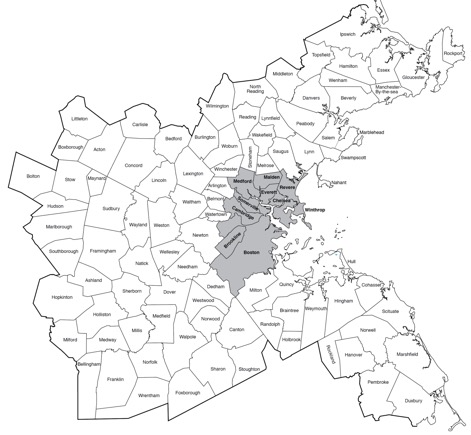
The study divided the respondents who lived in the Boston Region MPO’s planning area into two groups. One group resided in a core area that encompasses ten municipalities, which are highlighted in grey shading in Figure 3. The core area has the highest density of population, employment, and transit services in the Boston region. The other group comprised the other 91 municipalities in the Boston region. The nine sample schools that are the focus of this memorandum are located in this 91‑municipality area, providing a clear opportunity to compare samples.
TABLE 2
2011 Primary School Mode-Share Estimates in the Boston Region
| Type of Student Sample | Specific Sample | Total Students | Pedestrian or Bicycle | Family Car or Carpool | School Bus or Transit |
| Ten Core Municipalities | All student responses | 110,900 | 29.7% | 30.1% | 40.2% |
| Ten Core Municipalities | Students traveling more than a mile | 47,200 | 5.7% | 33.2% | 61.1% |
| Ten Core Municipalities | Students traveling less than a mile | 63,700 | 47.5% | 27.8% | 24.7% |
| Rest of Boston Region MPO | All student responses | 257,700 | 18.6% | 35.6% | 45.8% |
| Rest of Boston Region MPO | Students traveling more than a mile | 124,700 | 2.6% | 33.3% | 64.1% |
| Rest of Boston Region MPO | Students traveling less than a mile | 133,000 | 33.6% | 37.8% | 28.6% |
Source: Central Transportation Planning Staff, 2011 Massachusetts Travel Survey.
FIGURE 3
Core Area Municipalities in the Boston Region
The tallies of students at the nine sample schools who traveled less than one mile show that 33.9 percent of them walked or rode a bicycle to school. The 2011-MTS sample for the 91 municipalities outside of the core area showed that 33.6 percent of students who lived within a mile of school walked or rode a bicycle to school.
The two samples do show a large difference in the use of school buses. Only 12.2 percent of students at the nine sample schools who had short trips used the bus, compared with 28.6 percent of students in the 91 Boston region municipalities who had short trips. The large variation in school bus shares between individual schools listed in Table 1 suggests that any number of plausible reasons may account for the difference in bus share between the two samples.
Another interesting comparison is between the data from the National Center Data System for trips less than one mile, shown in Table 1. The non-motorized mode share of 30.4 percent is only slightly less than the 33.9 and 33.6 percent shares for the two Massachusetts suburban samples. These figures show a willingness of about one third of primary school students to walk or bicycle to school, and represent a starting point from which individual schools can measure progress toward increasing the number of students who walk or bicycle to school with the support the SRTS and related programs.
As the SRTS Program has taken shape, the National Center and supporting organizations such as the Safe Routes to School National Partnership (http://www.saferoutespartnership.org/) have devised a mnemonic concept that expresses key aspects of SRTS programs. These are known as the “Safe Routes Six Es” and now include:
Education and encouragement can take place in the schools. The student tallies provide one source for data for evaluation. Enforcement requires a commitment by the municipality and its police department to post crossing guards or traffic officers at key locations to keep motorists alert at the start and end of the school day.
Engineering refers to physical improvements in the vicinity of an SRTS school that make walking and bicycling more attractive options for students and parents. For engineering efforts, a team of engineers, planners, and pedestrian and bicycle experts assess the school environment and make recommendations for operational and physical improvements to the roads and walkways surrounding a school.
All nine schools in the study sample have undergone an engineering assessment, which included the student tallies cited above, and subsequently implemented SRTS-funded physical improvements specified in the engineering assessment. This study will review the SRTS and related physical and operational improvements that were implemented at these schools, and will quantify to the extent possible recent mode share trends at the sample schools.
The National Center’s report, Trends in Walking and Bicycling, describes how the National Center was able to estimate trends in mode choice using the evolving data available in its Data System. Responses from parent surveys were used to estimate mode-choice models for two time periods, the years 2007-09 (the initial years of the SRTS data collection) and 2014. The two sets of estimated coefficients were then applied to a comprehensive set of historical and current student data available from the US Department of Education’s National Center for Education Statistics (NCES).
The mode shares estimated in this process are summarized in Table 3. The total number of students represented in the National Center’s Data System had increased substantially during this period. Generally only a portion of parents respond to the online parent surveys, but the parent sample was larger in 2014 than in 2007-09.
The mode-share estimates developed from the 2007-09 parent surveys are the same as appear in Table 1, and are presented in Table 3 for ease of comparison. The 2014 mode-share estimates show an increase in the use of the non-motorized modes for the entire sample and both subsamples (students who travel more than one mile and those who travel less than one mile). Notably, this increase corresponds to a decrease in the share of students who take the school bus or transit.
For the sample as a whole, the share of students who traveled in a family car or a carpool increased from 49 percent in 2007-09 to 54 percent in 2014. For schools trips less than one mile, the decline in the share of students who took the school bus or transit corresponded to an increase in the share of students who walked or rode a bicycle.
TABLE 3
Estimated National Mode Share Trends
| Type of Student Sample | Specific Sample | Total Students | Pedestrian or Bicycle | Family Car or Carpool | School Bus or Transit |
| 2007-2009 National Center Data System | Total students in sample | 1,225,000 | 16.2% | 49.0% | 34.8% |
| 2007-2009 National Center Data System | Students traveling more than a mile | 660,000 | 4.0% | 47.9% | 48.1% |
| 2007-2009 National Center Data System | Students traveling less than a mile | 565,000 | 30.4% | 50.3% | 19.3% |
| 2014 National Center Data System | Total students in sample | 6,876,000 | 20.6% | 54.0% | 25.4% |
| 2014 National Center Data System | Students traveling more than a mile | 3,400,000 | 4.9% | 58.1% | 37.0% |
| 2014 National Center Data System | Students traveling less than a mile | 3,476,000 | 36.0% | 49.9% | 14.1% |
Source: National Center for Safe Routes to School.
As the fall term of the 2017-18 school year approached, SRTS schools in the Boston region were invited to conduct student travel tallies using the same tally sheets and procedures that were used in 2008-10 to prepare their SRTS grant submissions. Five elementary schools responded, and their results for students living within one mile of school are summarized in Table 4. For the five schools as a group, the non-motorized mode share dropped slightly from 26.3 percent in 2008-10 to 25.2 percent in 2017. School bus use also declined, and travel by auto increased.
The mode shares at some individual schools changed much more; the walk/bicycle share at Manchester Memorial rose substantially, and the shares at West Memorial in Peabody and Hansen in Canton declined significantly. Over the same period, the student population of Manchester Memorial declined, while the numbers of students at West Memorial and Hansen increased. The combined result of these changes in mode shares and enrollment resulted in the slight decline in the combined walk/bicycle share. Telephone inquiries to each of these five schools indicated that the geographical distribution of students’ homes and extent of the school districts had not changed, even while the numbers of students were changing.
TABLE 4
Recent Travel Trends at Sample Schools:
Students Living within One Mile of School
| Type of Student Sample | Specific Sample | Total Students | Pedestrian or Bicycle | Family Car or Carpool | School Bus or Transit |
| 2008-2010 student tallies | Memorial School in Manchester | 221 | 40.7% | 46.2% | 13.1% |
| 2008-2010 student tallies | Hatherly School in Scituate | 153 | 38.6% | 40.5% | 20.9% |
| 2008-2010 student tallies | Downey School in Westwood | 194 | 25.3% | 43.8% | 30.9% |
| 2008-2010 student tallies | West Memorial School in Peabody | 243 | 16.9% | 60.1% | 23.0% |
| 2008-2010 student tallies | Hansen School in Canton | 156 | 9.6% | 54.5% | 35.9% |
| 2008-2010 student tallies | Combined 2008-2010 Tallies | 967 | 26.3% | 49.6% | 24.1% |
| Fall 2017 student tallies | Memorial School in Manchester | 167 | 60.5% | 30.8% | 8.7% |
| Fall 2017 student tallies | Hatherly School in Scituate | 117 | 38.5% | 40.6% | 20.9% |
| Fall 2017 student tallies | Downey School in Westwood | 200 | 25.5% | 33.5% | 41.0% |
| Fall 2017 student tallies | West Memorial School in Peabody | 253 | 8.3% | 81.0% | 10.7% |
| Fall 2017 student tallies | Hansen School in Canton | 172 | 6.4% | 56.4% | 37.2% |
| Fall 2017 student tallies | Combined 2017 Tallies | 909 | 25.2% | 51.5% | 23.3% |
Source: Central Transportation Planning Staff.
In the case of Manchester Memorial, the number of students who walked increased from 90 to 101 while the total number of students at the school declined from 448 to 338. The 101 students who walked or rode a bicycle represent 60.5 percent of students living within a mile of school, but in 2017 they also represented 30 percent of the entire student body. A large portion of a school’s students using non-motorized modes might be an important condition for changing a school’s travel culture.
Safety is a paramount concern of the SRTS Program. Not only is there no acceptable level of student injuries during travel to and from school, but the perception of safety in daily school trips is often a determining factor in family school travel choices.
The Massachusetts Registry of Motor Vehicles (RMV) operates and maintains a database of traffic crashes in Massachusetts, the Crash Data System (CDS). State and local police and individual vehicle operators are required to submit reports on crashes that can be incorporated in the CDS. Calculating useful comparisons using crash statistics is difficult because reporting practices change over time and vary between different jurisdictions and agencies.
SRTS-funded improvements are all implemented within one mile of SRTS schools, and trends in crash experience within the school vicinity might indicate the effectiveness of SRTS investments. Table 5 shows the numbers of crashes that occurred within one mile of each of the nine Boston region SRTS schools. The total crashes have been divided between those that involve only cars (and perhaps a stationary object) and crashes that involve a bicycle or a pedestrian. Table 6 shows the crash experience of the nine municipalities in their entirety. The numbers presented in these tables are all for three-year periods: 2004-06 and 2012-14.
The number of pedestrian and bicycle crashes reported in the CDS for these nine school areas as a group were greater during the 2012-14 time period (117 crashes) than during the 2004-06 period (79 crashes). For the nine municipalities as a whole, the total pedestrian and bicycle crashes increased from 345 to 595. Notably, not one of the municipalities reported a decline in total pedestrian and bicycle crashes. About one-third of these crashes involved a bicycle.
Determining the cause of this increase is outside the scope of this study, but several explanations have been suggested. More diligent submission of crash reports to the CDS is one possibility. Also, even within a mile of a school, most of the non-motorized travel over the course of the day will be increasing numbers of adult pedestrians, joggers, and bicyclists as these modes have become more popular and as population and commercial activity gradually increases. Even without any change in travel practices, some increase in crashes would be expected.
TABLE 5
Crashes within One Mile of Sample Schools by Crash Type
Three-Year Periods: 2004-06 and 2012-14
| School Travel Area | Total Crashes: 2004-2006 | Total Crashes: 2012-2014 | Vehicle Only: 2004-2006 | Vehicle Only: 2012-2014 | Pedestrian: 2004-2006 | Pedestrian: 2012-2014 | Bicycle: 2004-2006 | Bicycle: 2012-2014 |
| Hatherly School in Scituate | 23 | 71 | 23 | 71 | 0 | 0 | 0 | 0 |
| Dallin School in Arlington | 247 | 430 | 235 | 408 | 8 | 13 | 4 | 9 |
| Memorial School in Manchester | 75 | 86 | 74 | 84 | 1 | 1 | 0 | 1 |
| Bowen School in Newton | 889 | 774 | 854 | 708 | 27 | 43 | 8 | 23 |
| Dolbeare School in Wakefield | 291 | 322 | 283 | 314 | 6 | 5 | 2 | 3 |
| Downey School in Westwood | 426 | 661 | 423 | 656 | 3 | 3 | 0 | 2 |
| West Memorial School in Peabody | 94 | 115 | 91 | 113 | 3 | 2 | 0 | 0 |
| Stanley School in Swampscott | 336 | 260 | 320 | 249 | 10 | 8 | 6 | 3 |
| Hansen School in Canton | 274 | 281 | 273 | 280 | 0 | 1 | 1 | 0 |
TABLE 6
Crashes in the Municipalities of Sample Schools by Crash Type
Three-Year Periods: 2004-06 and 2012-14
School Municipality |
Total Crashes: 2004-2006 |
Total Crashes: 2012-2014 |
Vehicle Only: 2004-2006 |
Vehicle Only: 2012-2014 |
Pedestrian: 2004-2006 |
Pedestrian: 2012-2014 |
Bicycle: 2004-2006 |
Bicycle: 2012-2014 |
Scituate |
228 |
474 |
223 |
464 |
3 |
6 |
2 |
4 |
Arlington |
858 |
1622 |
828 |
1506 |
16 |
57 |
14 |
59 |
Manchester |
7 |
118 |
6 |
116 |
1 |
1 |
0 |
1 |
Newton |
5289 |
4329 |
5127 |
4051 |
104 |
171 |
58 |
107 |
Wakefield |
1230 |
1241 |
1188 |
1183 |
24 |
37 |
18 |
21 |
Westwood |
369 |
1407 |
360 |
1394 |
6 |
7 |
3 |
6 |
Peabody |
2428 |
3373 |
2372 |
3294 |
36 |
62 |
20 |
17 |
Swampscott |
573 |
425 |
548 |
403 |
14 |
16 |
11 |
6 |
Canton |
1418 |
540 |
1403 |
523 |
10 |
13 |
5 |
4 |
Finally, there is increasing concern about so-called “distracted walking.” The functionality of hand-held devices continues to enable pedestrians to do more tasks on their daily journeys, and the associated negative safety consequences are beginning to appear in statistics.
The only statistics that can be derived from Tables 5 and 6 which provide any comfort are those that show a decline in the percentage of crashes within one mile of the SRTS schools that involved a pedestrian or bicyclist. Between 2004 and 2006, almost 23 percent of the 345 crashes that involved a pedestrian or bicyclist took place within a mile of an SRTS school. Between 2012 and 2014, 20 percent of the 595 crashes occurred within a mile of an SRTS school. These statistics should not be viewed as a trend, rather they indicate that bicycle and pedestrian safety relate to the town as a whole and not only to the vicinity of the school. A review of the crash locations and the times during which the crashes occurred suggest that few of these crashes involved school trips, but the overall numbers of crashes affect the perception of safety and influence family school travel choices.
The SRTS-funded infrastructure improvements have generally corrected clearly deficient bicycle and pedestrian conditions that had existed at locations near schools or on corridors leading to schools. It is difficult, however, to ascertain any statistical change in the bicycle and pedestrian mode shares that might be attributed to these improvements.
In this section, each of the five sample schools that provided a recent student travel tally is analyzed in greater detail individually. MPO staff visited each of the schools and talked with school staff, parents, and crossing guards. The specific improvements that were implemented by SRTS or related programs are discussed in the context of the local travel networks, land uses, and geography which might influence the attractiveness of the different modes for school travel. The schools are discussed in the order in which they appear in Table 4, from those with the highest mode share of walking and bicycling to the lowest.
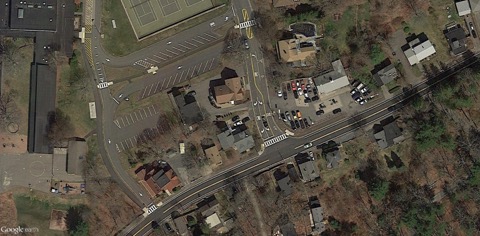
Manchester Memorial Elementary School serves 338 students in kindergarten through Grade 5, and also has a preschool program with 13 children. The school was built in the 1950s, and plans are being developed to replace the school. The location of the replacement school has not yet been determined.
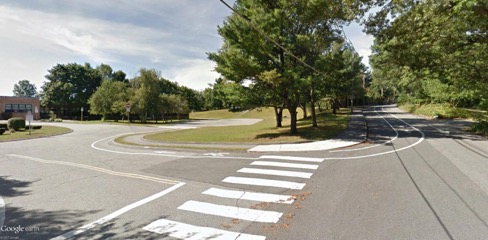
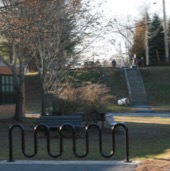
Figure 4 shows the Manchester Memorial campus and its immediate environs. Immediately to its west and adjacent to the school playground is a town park with a large athletic field and tennis courts. A path through this park connects the school with the nearby residential areas. Almost all students arriving on foot or by bicycle use this path. Figure 5 shows the bicycle racks at the edge of the school property. A total of 38 bicycles were parked at the Manchester Memorial bicycle racks during a recent visit.
FIGURE 4
Manchester Memorial Elementary School Neighborhood
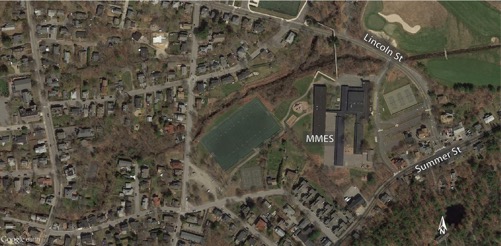
MMES = Manchester Memorial Elementary School
Source: GoogleEarth.
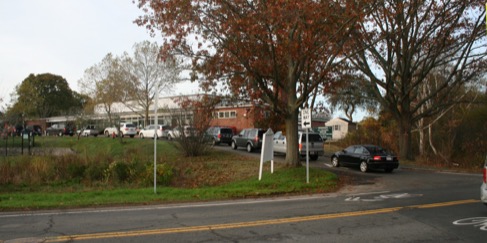
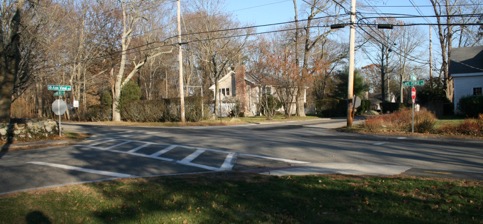
The SRTS Program funded sidewalk, intersection, and related improvements to the roadways between the main entrance to the school on the east side of the building complex and the intersection of Summer and Lincoln Streets, approximately 500 feet from the school entrance. Fresh concrete ramps, asphalt paths, and painted crosswalks are clearly visible in Figure 6. A pedestrian-activated flashing signal was installed at the top-most crosswalk in Figure 6. Where space was available, grass buffers were placed between sidewalks and roadways.
FIGURE 5
Pedestrian Path from City Park and School Bicycle Racks
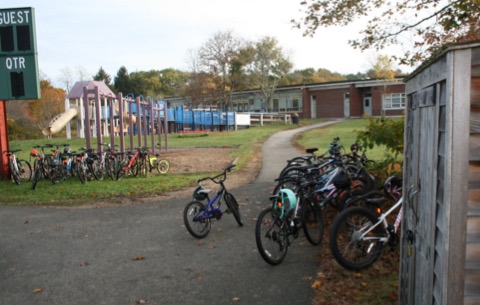
Source: Authors.
FIGURE 6
SRTS-Funded Improvements Near Front Entrance of Manchester Memorial Elementary School
Source: GoogleEarth.
The sidewalk on the north side of Summer Street was reconstructed from the driveway at the lower left in Figure 6 to the eastern end of the gas station at the corner of Summer and Lincoln Streets. Figure 7 is a westerly view of Summer Street viewed across Lincoln Street from the gas station. A bicycle rider is using the freshly striped bicycle lane and a Manchester Memorial student is being walked to school on the new sidewalk.
East of this intersection there is less housing than in the neighborhoods to the west. The easterly neighborhoods are interspersed with conservation land, resulting in longer walking distances. However, the SRTS improvements clearly made these sections of Summer and Lincoln Streets safer for all users, which was also a major objective of the SRTS Program.
FIGURE 7
SRTS-Improved Section of Summer Street
Source: GoogleEarth.
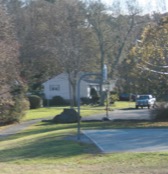
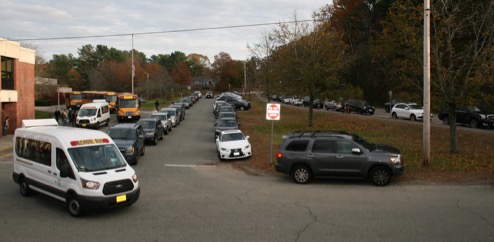
About half of the Manchester Memorial students live within one mile of the school, and an impressive 60 percent of these students walk or ride a bicycle to get to school. Three-fourths of the other students get a ride from a family member or neighbor, and the balance take a school bus or van. A police officer is posted at the school driveway during both arrival and dismissal periods. (See Figure 8.)
During a site visit, school staff described in detail the arrival and dismissal procedures, critical to both student safety and the attractiveness of the non-motorized modes. Arriving in the morning, students gather in the playgrounds (there are two distinct areas for different age groups), and the teachers meet them outside and bring them into class as a group. As shown in Figure 5, the playgrounds are convenient to the popular walking path. In the afternoon, students can be released out the back door, shortening their walk or bicycle ride home.
Manchester Memorial staff does not have regular programs such as “walk to school day,” but the school’s proximity to residential neighborhoods and the availability of a pleasant pedestrian path make walking and bicycling attractive to students. The arrival and dismissal procedures facilitate use of the travel-friendly geography for those families wishing to use the non-motorized modes.
FIGURE 8
School Driveway Used for Student Drop-off and Pick-up
Source: Authors.
Hatherly Elementary School serves 271 students in kindergarten through Grade 5. Grade 6 students also studied at Hatherly in 2009, but all of Scituate’s Grade 6 students now attend a newly completed middle school.
Over half of the Hatherly students live more than a mile from school, and school buses are used by 162 students. Any student can take the school bus for a $240 annual fee. An estimated 117 Hatherly students live within a mile of the school, and 25 of them take the bus. School trips by the other 82 students living within a mile of the school divide almost evenly between travel by auto and non-motorized modes. Mode shares for school travel have not changed significantly since the 2009.
Figure 9 shows Hatherly School and some surrounding areas that include large areas of undeveloped land, both forested and tidal estuary. Housing in the area is exclusively detached single-family homes, often on large or odd-shaped lots. Residences tend to be organized in small groups, and Hatherly School is adjacent to only one small group of houses. Travel between groups of houses is often obstructed by water, forest, or the Greenbush commuter rail line. The road connections between housing areas and between housing areas and the school are sometimes circuitous. Given this challenging geography, the large share of students who walk represents a strong base upon which to build up the number of students who walk or bicycle to school.
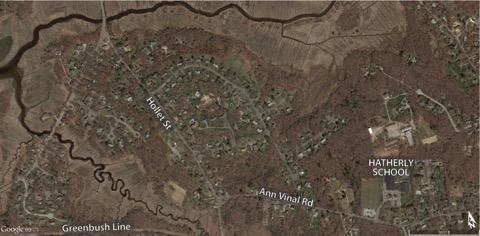
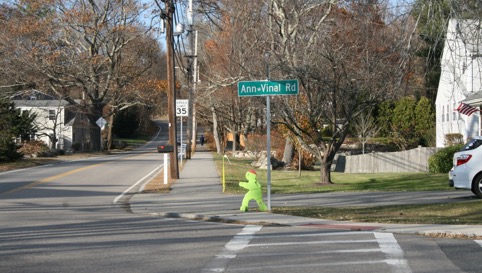
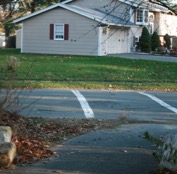
Most Hatherly School walkers come from a residential area east of the school. One-third mile from the school driveway entrance is the intersection of Ann Vinal, Mann, Captain Pierce, and Tilden Roads. (See Figure 10.) Extending the sidewalk system in this neighborhood was initially considered as a possible SRTS improvement, but the funds were redirected to sidewalk improvements west of the school. There had been a crossing guard assigned to this intersection, but this position is no longer staffed.
The more distant areas west of Hatherly School were seen as offering the greatest potential for expanding non-motorized student travel. There is a sidewalk on Ann Vinal Road, from Hatherly School to Hollett Street, which is almost one-half mile long. Hollett Street provides access to a large residential area, but there were no sidewalks there until the SRTS Program funded construction of a sidewalk from Ann Vinal Road to its northern terminus, over a half mile to the northwest. (See Figure 11.) An unofficial trail had offered a shortcut between this area and Hatherly School, but the school staff discouraged use of this path because of ticks and the trail is now overgrown.
FIGURE 9
Hatherly School Neighborhood
Source: GoogleEarth.
FIGURE 10
Area East of Hatherly School Where Most Walkers Reside
Source: Authors.
FIGURE 11
SRTS-Funded Sidewalk and Crosswalk at Hollett Street
Source: Authors.
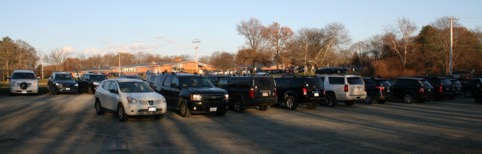
Hatherly shares use of an athletic field with the Scituate Recreation Department, and the parking lot at the athletic field is used as a waiting area for vehicles picking up students at dismissal time. (See Figure 12.) The crossing guard stationed at this lot explained the need to manage cars entering and leaving the lot, students walking to the lot, and cars and buses exiting to Ann Vinal Road.
FIGURE 12
Autos Waiting in Athletic Field Parking Lot at Dismissal Time
Source: Authors.
The low residential density in this part of Scituate limits the practicality of walking for a large number of students. Fewer than half of the Hatherly School students live within a mile of the school, and many of them must use circuitous paths on their trips to school. Active travel is encouraged, however, in that students using buses must walk to assigned pickup points. Only the 70 students who travel by auto get a door-to-door ride.
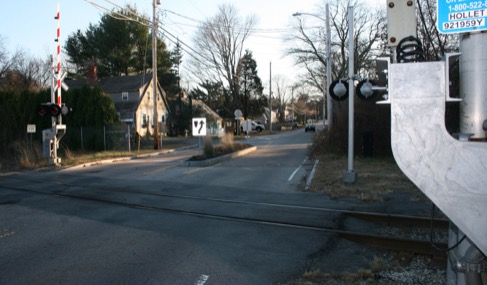
The SRTS Program did fill an important gap in the sidewalk system, but significant gaps remain. There is no sidewalk on Hollett Street south of Ann Vinal Road, which connects with a nearby residential area south of the Greenbush commuter rail tracks. (See Figure 13.) School staff explained that on periodic “walk to school days” Hatherly students from this neighborhood require a police escort. Some adult pedestrians also were observed in this area. The railroad grade crossing and nearby wetlands would complicate the construction of a sidewalk in this area; however, the current activity at this location indicates that this could become an important pedestrian corridor for all users if an investment in pedestrian infrastructure were made.
FIGURE 13
Residential Area South of Greenbush Commuter Rail Tracks
Source: Authors.
Downey Elementary School serves 253 students in kindergarten through Grade 5, and 200 of these students live within one mile of school. About one-fourth of the students living within a mile walk or ride a bicycle to school, the same share as in 2009 when the first SRTS tally was taken. Today, more students take a bus than are driven, a reversal from the 2009 tallies. The cost of using the school bus is $180 per year and the cost has not changed since at least 2011.
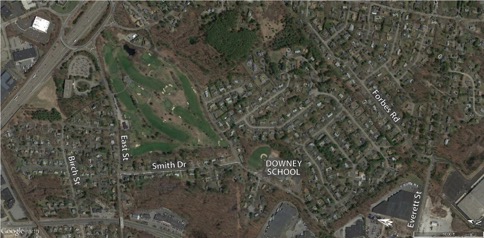
Downey school is favorably situated for non-motorized travel. (See Figure 14.) There are extensive residential areas adjacent the school campus, and busier streets such as East Street, Forbes Road, and Everett Street are some distance from the school. Two public paths provide useful shortcuts, and some neighbors who live next to the school permit students to cut through their yards to get to Downey School.
The school cannot fully take advantage of its favorable location because the sidewalk system is incomplete. The SRTS projects were part of a broader effort to improve the sidewalk system in this part of Westwood. While several projects were funded separately, they will be discussed together because they work as a single system.
Figure 14
Downey Elementary School Neighborhood
Source: GoogleEarth.
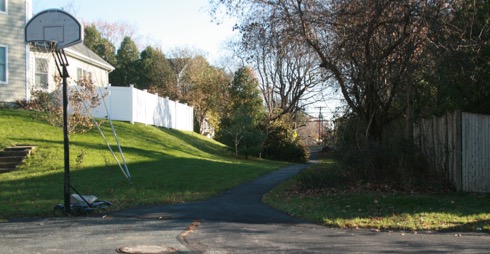
The SRTS improvement furthest from Downey School involved repaving a path that connects an isolated residential area with the heavily traveled East Street. (See Figure 15.) The crossing guard reported that school buses do not circulate in the quiet Birch Street area despite its general lack of sidewalks. Instead, students use this path and are picked up by the bus on East Street. Consequently, some students who report taking the bus to school may need to walk for several blocks of their trip.
Figure 15
Repaved Path between Birch and East Streets
Source: Authors.
The SRTS effort also funded reconstruction of a crosswalk where the path meets East Street. A bright yellow pedestrian sign is visible in Figure 15 at the end of the path. A flashing pedestrian signal was also installed.
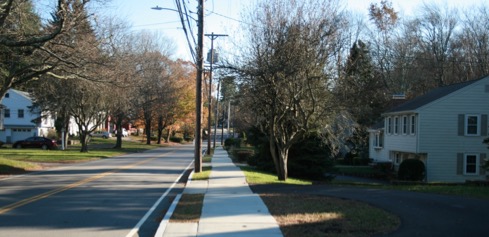
A new sidewalk was recently built on Smith Drive extending one-third mile from the new East Street crosswalk to Downey Street near the school. (See Figure 16.) This concrete sidewalk represents a major improvement over the prior asphalt sidewalk. School staff confirmed that this improvement was not funded by SRTS.
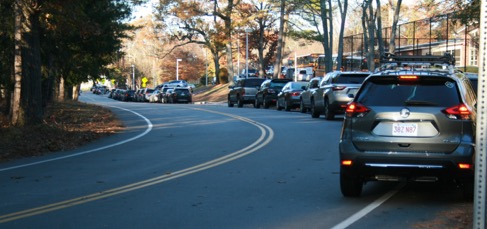
Figure 17 shows vehicles waiting on Downey Street as dismissal time approaches. Figure 18 shows Putting Drive, located directly across Downey Street from the school, which also fills with waiting cars at dismissal time. Ironically, the crosswalks shown in Figure 18 were funded by the SRTS Program and are used by students to safely reach waiting cars. The crossing guard assigned to this location explained the need to supervise buses leaving the school driveway, students walking home or to a waiting car, and unrelated traffic on Downey Street.
Figure 16
New Sidewalk on Smith Drive between East and Downey Streets
Source: Authors.
Figure 17
Vehicle Queue on Downey Street at Dismissal Time
Source: Authors.
Figure 18
Putting Drive, a Side Street Used by Waiting Vehicles
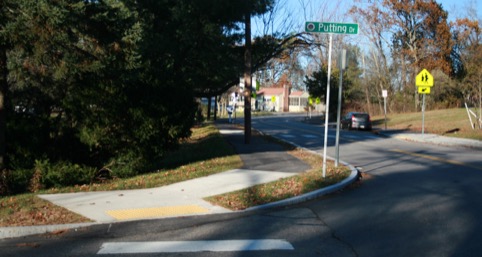
Source: Authors.
Many favorable conditions for increasing the number of students who walk or bicycle to Downey School appear to be in place. The location and neighborhood ambience favor walking and bicycling, and progress has been made to improve and expand supporting infrastructure. New bicycle racks were also built with SRTS funds, though no bicycles were observed during a recent site visit.
Student tallies only count the number of students who walk all the way to or from school. It is important to consider, however, that students also walk to their bus stops. Students using buses in Westwood are required to walk to a prescribed pickup point unless there are no sidewalks and the walking conditions are considered dangerous. School bus use has increased since 2010 and, because the sidewalk system has been expanded, more students are directed to a gathering point rather than being picked up directly in front of their homes. Consequently, the total amount of walking done by students may have increased more than the student tallies suggest.
West Memorial Elementary School serves 254 students in kindergarten through Grade 5, virtually all of whom live within a mile of the school. Only about 21 students walk to school, about half as many as in 2008 when the first SRTS tally was taken. About 27 students take a school bus, for which there is a $300 annual fee. School bus fees were only $100 in 2008, and ridership is now about half of what it was in 2008.
The other 206 students travel to or from school by private auto; 60 more students travel by auto today than in 2008. West Memorial’s heavy dependence on private autos for student travel burdens the local streets near the school, and presents a challenge for managing an orderly dismissal process. The SRTS-funded improvements significantly improved safety for students when accessing waiting autos and when walking to some of the nearby neighborhoods. Unfortunately, the use of non-motorized modes for student travel has not expanded since these improvements.
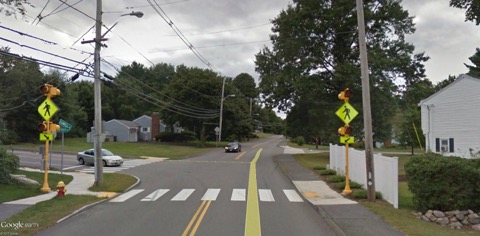
West Memorial’s location within a residential area can be seen in Figure 19. The school driveway connects with Bow Street, which is parallel to and one block south of Lowell Street, a minor arterial. Lowell Street is heavily traveled and crossing guards are posted at two crosswalks, one of which has been upgraded with SRTS funding and now includes a flashing signal. (See Figure 20.) However, only about one-fourth of the West Memorial district is north of Lowell Street.
The SRTS Program also funded important improvements to Bow Street and the school entrance. Figure 21 shows the newly striped parking lane and bicycle lane adjacent to a pre-existing sidewalk. This lane system extends to the school entrance at which point the new bicycle lane extends into the school driveway next to an SRTS-funded sidewalk extension. (See Figure 22.)
During a site visit, the school principal indicated to MPO staff that the improvements on Bow Street and the school entrance are important for safety during dismissal procedures. Admittedly, the improvements primarily benefit the safe movement of students from the school to awaiting cars.
The environs of West Memorial on the other side from the Bow Street entrance appear markedly different. Pedestrian paths lead from the school grounds to the west, south, and east into adjacent neighborhoods where asphalt sidewalks are the norm at all but a few locations. (See Figure 23.) However, at dismissal time numerous private vehicles were seen waiting in the streets that meet these paths, reducing somewhat their pedestrian-friendly ambience.
Figure 19
West Memorial Elementary School Neighborhood
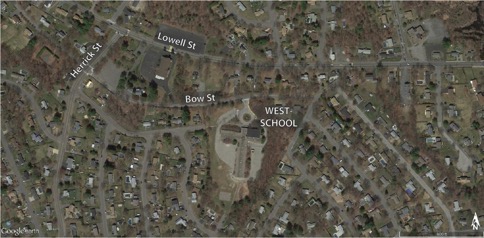
Source: GoogleEarth.
Figure 20
Improved Crosswalk at Lowell Street and Herrick Road
Source: GoogleEarth.
Figure 21
Autos Waiting in Bow Street Parking Lane at Dismissal Time
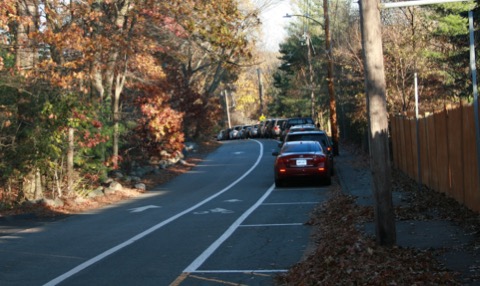
Source: Authors.
Figure 22
SRTS Improvements at West Memorial Elementary School Entrance on Bow Street
Source: GoogleEarth.
Figure 23
Paths Connecting West Memorial Elementary School Grounds with Adjacent Neighborhoods
Source: Authors.
Conditions at West Memorial appear favorable for non-motorized school travel in several respects. Students live near the school and the school’s position relative to the roadway system allows most students to reach the school without having to cross a major street. The neighborhood ambience is pleasant and the walking paths shorten the travel distances of students who choose to walk.
A possible consideration for walking suitability is that the street systems in nearby residential areas include numerous loops and cul-de-sacs to discourage through traffic. These designs can reduce or slow traffic, but also can make a student’s walk to and from home circuitous. Shortcuts through conservation land or, by arrangement, people’s yards are common in these types of suburban communities.
A site visit and analysis by MPO staff suggests that a higher use of non-motorized travel modes would be expected for an elementary school in similar circumstances. Parents expressed concern in the 2009 SRTS assessment that cars waiting at the entrances to the walking paths made these routes from school less safe. This problem would be self-correcting if these paths were simply used for their original purpose.
Hansen Elementary School serves 473 students in kindergarten through Grade 5. Only about 172 students live within a mile of school. Only 11 of these students reported walking and none reported bicycling to school. School buses carry 283 Hansen students, including 64 who live within one mile of the school. The remaining 179 students are driven in private autos, including 97 who live within one mile of school.
Any elementary school student in Canton who lives within two miles of school can take a school bus for a payment of $250 for the school year, a decrease from the $400 which was charged in 2009. Despite this significant price reduction, the number of students who travel to school in private autos increased by 41 since 2009, while the number of students who take the bus increased by only 19. This was a period during which school enrollment grew, but the number of students walking decreased.
The challenge of using the non-motorized modes at Hansen School is apparent from studying its geographical situation. Figure 24 shows the Hansen School campus and its immediate environs. Directly to the north is a small neighborhood easily accessible to the school via a short wooded path, but few students live in this area. A larger neighborhood is located to the northwest on the far side of the adjacent Galvin Middle School. To the southwest is another large neighborhood, but students from this area attend the nearby Kennedy Elementary School.
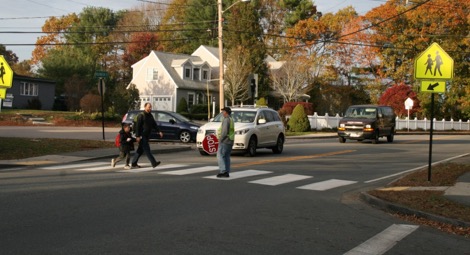
An extensive residential area within walking distance of Hansen School is located to the southeast of Washington Street, a very busy arterial roadway only 500 feet from the school entrance. Figure 25 shows a Hansen student, escorted by a parent, crossing Washington Street with the assistance of a crossing guard. The start and dismissal times of the Galvin Middle School precede those of the Hansen School, and the crossing guard is on duty for both groups of students.
SRTS funds were used to reconstruct this crosswalk and install a flashing “school zone” speed limit sign 440 feet north of the crosswalk. The new speed limit sign is shown in Figure 26, which also illustrates the traffic and visibility problems that contribute to a perception expressed by parents that Washington Street is an insurmountable barrier for elementary school students who might walk to Hansen School. On the day that the photos were taken, the crossing guard reported that five Hansen students crossed Washington Street here. The author observed that two of those students were accompanied by adults.
FIGURE 24
Hansen Elementary School Neighborhood
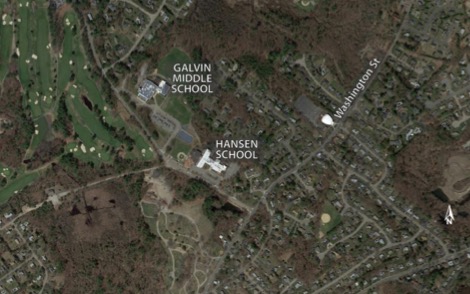
Source: GoogleEarth.
FIGURE 25
Patrolled Washington Street Crosswalk
Source: Authors.
FIGURE 26
Flashing “School Zone” Speed Limit Sign on Washington Street
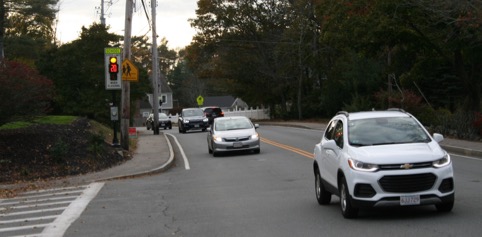
Source: Authors.
The SRTS Program also funded a new sidewalk on Pecunit Street between Hansen School and Washington Street, and this improvement is shown in Figure 27. The bicycle lanes there were not specified as part of the SRTS improvements, but they were painted around the same time as the sidewalk reconstruction. These improvements clearly make non-motorized travel along Pecunit Street more appealing, but the problems at the intersection with Washington Street limit the usefulness of this improved corridor.
The dependence on motorized modes to transport students of Hansen School is illustrated in Figure 28, which shows the school’s roadway circulation system and Pecunit Street’s curb space completely occupied by vehicles. Adults wait for students near this location to walk them to the nearby family car.
Casual conversations with parents and supervising staff confirmed the reluctance of parents to consider allowing students to cross Washington Street. One parent described the “walking school bus” program, which an older sibling had participated in and which brought students from the far side of Washington Street to school. Unfortunately, the program is no longer active.
FIGURE 27
SRTS-Funded Sidewalk and Bicycle Lane on Pecunit Street
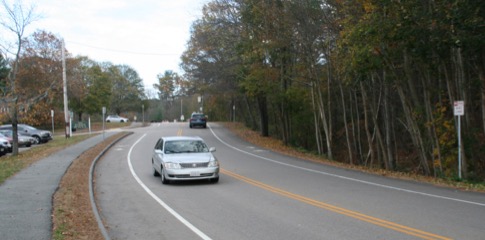
Source: Authors.
FIGURE 28
Vehicle Queues at Dismissal Time at the Hansen School
Source: Authors.
Encouraging active travel modes could be a valuable service of a school, but it is not the school’s primary mission, nor even an overarching concern. From the school’s perspective the overriding student travel concern is safety. Any other consideration ranks a distant second at best. Ultimately, parents of elementary school students make the travel decisions, and any encouragement by the school is at most advisory. Also, popular programs such as the “walking school bus” depend upon parent involvement and can be difficult to sustain from school year to school year because participation of both students and parents may vary as families move, or students change schools or move on to other grades.
Expanding and improving safe and practical pedestrian infrastructure on important routes that connect schools with residential areas probably increases the percentage of families that consider walking a viable choice. Indeed, all SRTS improvements made around the five schools clearly enhanced the walking environment. Even with the improved pedestrian infrastructure, some families still avoid walking. Other families embrace walking and bicycling, often tolerating the higher level of risk associated with substandard roads or sidewalks. Revising public taste for walking is not really a simple prerogative of either school officials or transportation planners.
Three generations of walkers
Souce: Authors.
The engineering assessments conducted at local SRTS schools in 2008-10 provided a detailed analysis of the condition and configuration of sidewalks and related infrastructure on travel routes serving each school. Implicit in this analysis was that these routes are part of a wider transportation system utilized by multiple modes for all purposes during all time frames. The findings and recommendations of these assessments can and should serve as important building blocks of the ongoing planning process in each town.
Every assessment identified a number of potential improvements that would enhance non-motorized travel in the community in addition to the specific project recommended for SRTS funding. The importance of these related improvements for both school and non-school travel were described, and the potential to implement improvements with funding from sources other than the SRTS Program was sometimes indicated.
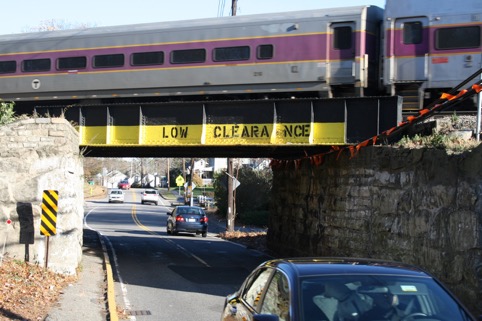
Figure 29 shows an example of a location where pedestrian infrastructure would improve access from schools to nearby attractions. The Franklin commuter rail line crosses East Street in Westwood at the edge of the Downey Elementary School district. There is barely a sidewalk on one side of East Street where it crosses under the rail line. Even though students would not walk under this bridge on the way to school, there are a number of locations just west of the bridge, outside the school district, that would attract them: community athletic fields, a community center, and retail establishments, including an ice cream shop.
A study undertaken by the Boston Region MPO identified this low-clearance overpass as the bridge in the Boston region that is the most often struck by trucks; 33 crashes occurred at this location between 2002 and 2014. 6 Because of the complexity of reconstructing railroad overpasses, even this level of crash experience may not necessarily put a project on the top of a construction priority list. Adding a formal SRTS assessment finding to the reasons to reconstruct a piece of clearly deficient infrastructure can help shorten the waiting time to obtain funding.
The value of considering non-motorized travel in a wider context was also suggested in the crash analyses summarized in Tables 5 and 6. The crash incidence trends in the vicinity of schools and the municipalities as a whole are similar, and safety improvements across the municipality should facilitate walking and bicycling both for school and non-school travel.
FIGURE 29
Low-Clearance Bridge near Downey Elementary School
Source: Authors.
Developing reliable student travel data is difficult and the difficulties increase if one intends to make comparisons between schools or identify trends. A major challenge when conducting the student tallies in 2017 was arranging for a group of schools to use a portion of their limited instruction time to survey students during the same time in the fall semester. The data available for this study, both historical and recent, was checked for unusual conditions, and was then aggregated to present results that are not misleading. The statistics that are presented in this study should be used primarily to help understand student travel behavior rather than form strong statistical conclusions.
In many instances, images of the actual classroom tally sheets were provided by the schools. Some unexpected variability was observed when summing the tally figures. For instance, second graders as a whole might walk as much as fifth graders, but there might be a second grade classroom with many walkers and another classroom with only a few. Unfortunately, for the purposes of this study these intriguing survey results needed to be combined to produce a school average.
A promising approach to developing data might be for one or more schools to volunteer to collaborate as statistical “test beds.” Data gathering techniques might be streamlined and applied on a routine basis with the intent of becoming as unobtrusive to the learning process as possible. Techniques for ensuring accuracy could be refined and larger, statistically significant samples could be developed for these schools. Over time it might be possible to observe how travel by a class of students changes over time, for example, how one year’s third graders travel when they become fourth graders.
The primary mission of schools is education. However, some schools adopt school themes such as sports, diversity, or ecology. Active travel and accurate, systematic data collection could become a theme a school might be proud to embrace.
This study documents a number of well-considered and carefully implemented SRTS infrastructure programs. We recommend that municipal planners fully integrate the consideration of infrastructure for school-related travel into their planning and identify opportunities to have infrastructure improvement projects working together to support the aims of improving the pedestrian and bicycle network for all pedestrians and bicyclists in the municipality.
Reliable school travel data is difficult to obtain, and this study acknowledges that this will remain a problem given the overarching priority that schools place upon the education mission. More intensive data collection on students’ modes of travel might be implemented in selected locations, but it is unlikely that extensive, broad-based school travel data will become available.
Analysis of the data that were available does suggest, however, that SRTS programs, however well-considered, cannot be counted on to have a long-term effect on the mode choice of students. Community-wide walking practices and the annual change of student population are given conditions that would challenge even the most ambitious SRTS programs.
Even as the SRTS infrastructure improvements were observed in the field and their intended benefits described, the available data did not make it possible to measure the benefit produced by the infrastructure improvements or distinguish between the benefits of different projects. This should not be attributed to the lack of data. Rather, the changes which result from these programs are simply too subtle to be reflected in the data.
The purpose of this study was to measure the impacts of SRTS infrastructure improvements. In the course of our research, however, the importance of the local “car culture” became apparent even though the examination of this factor was not an explicit goal of this study. Some schools are favorably situated for walking and bicycling, and the SRTS infrastructure programs have made these good situations even better, but trends regarding the use of these modes appear to be determined under the broad rubric of “culture,” the analysis of which was beyond the scope of this study. The policies and programs that might change this culture might be a topic for a future investigation.
WSK/CMC/wsk
1 Safe, Accountable, Flexible, Efficient Transportation Equity Act: a Legacy for Users, United States Public Law 109-59.
2 Moving Ahead for Progress in the 21st Century, United States Public Law 112-141.
3 Fixing America’s Surface Transportation Act, United States Public Law 114-94.
4 Trends in Walking and Bicycling to School from 2007 to 2014. National Center for Safe Routes to School, Chapel Hill, North Carolina, 2016
5 Boston Region MPO, Exploring the 2011 Massachusetts Travel Survey: Barriers and Opportunities Influencing Mode Shift, December 2016.
6 Boston Region MPO, Weight and Height Restrictions that Impact Truck Travel, December 2017.