Technical Memorandum
DATE: December 6, 2018
TO: Boston Region Metropolitan Planning Organization
FROM: Bill Kuttner
RE: Comparing Large-Scale Transportation Mitigation Programs
Developers and project proponents in Massachusetts are required to minimize the negative impacts of proposed development projects. In most instances, impacts such as increased regional travel demand and increased use of water and sewer resources are unavoidable. Where these impacts cannot be eliminated, they must be mitigated: the developer must provide programs or payments that either further limit impacts to a manageable level or compensate communities for unavoidable outcomes.
Almost every aspect of a mitigation program can be the subject of debate, whether over the adequacy, efficiency, or even the advisability of a particular mitigation measure. The wide range of opinion on mitigation can be largely attributed to the fact that every project is different as are the location and context in which they proposed.
To better inform a discussion of mitigation practices, this study begins by presenting a method to compare the size, configuration, and situation of proposed developments. Project description data were obtained for 16 distinct developments and these data were supplemented with demographic data of the project environs. Several project size metrics have been calculated from these data and each of these metrics is presented individually and is used to highlight and compare key characteristics of the 16 sample developments.
The study then reviews the mitigation programs of each of the 16 developments. Key transportation mitigation requirements and expectations, both on-site and off-site, are summarized. Finally, the 16 developments and their mitigation programs are analyzed and conclusions are suggested. Insights of mitigation process participants have helped to inform these conclusions.
The primary sources of information about proposed developments and associated mitigation programs are the certificates issued by the Secretary of Energy and Environmental Affairs (EEA), which comment on the scope and completeness of documents submitted by project proponents. Project proponents submit environmental notification forms (ENF), environmental impact reports (EIR), and notices of project change (NPC) as required as projects progress from concepts to one or more phases of active construction. The submission, certification, and publication of project information are governed by the Massachusetts Environmental Protection Act (MEPA).
In response to proponent MEPA submissions, the EEA Secretary issues certificates that organize and present the key understandings of what are proposed to be built, what the impacts are anticipated to be, and what mitigation measures have been agreed upon. The actual permitting of projects is the responsibility of other state agencies and local governments, and the negotiation of mitigation agreements can also involve private parties. The importance of the MEPA certificate is that it clearly states the status of each project, associated impacts, and mitigation understandings throughout the multi-year development process.
The analysis of transportation-related impacts for the MEPA process is based on the Transportation Impact Assessment (TIA) Guidelines, which are prepared by the Massachusetts Department of Transportation (MassDOT) and are publicly available.1 A project’s adherence to TIA guidelines will determine whether MassDOT grants the necessary roadway access permits. The TIA guidelines in turn become part of the MEPA process, but can be expanded upon in response to concerns by localities and other impacted stakeholders.
The configuration of large developments almost always changes during the planning process. The EEA Secretary must determine whether the current certification documents are sufficient or if an additional submission is required. If the project has already completed the MEPA process, an NPC may be required.
Certificates issued in response to project changes generally build upon the original certificates, reviewing the history of the project and describing the entire revised project with its impacts and mitigation. In evaluating developments and associated mitigation, it is critical that the most recent certificates be reviewed, and links to individual project review documents in the MEPA Project Database are included in this study. Seven of the certification documents reviewed were NPCs.
MEPA certificates also offer a practical benefit for preparing studies such as this. Each certificate distills from the various proponent submissions a common set of projected daily trips, and these data are presented in the certificates in the context of how planning for the development is progressing. Together, the common data and the project context make possible the type of quantitative analysis presented in the following section. Proposed traffic improvements are based on projected peak period traffic volumes, but these must be obtained from the proponent submissions, which can be viewed at the MEPA office.
Following publication of the Secretary’s certificate, specific details of mitigation measures typically need to be worked out, usually at the municipal level. Permits from the city or town may be necessary to start work. Configuring a mitigation measure to the satisfaction of local officials may move the process along, ultimately resulting in a package of mitigation measures more extensive than specified in the Secretary’s certificate. However, broad outlines of the most significant measures will be found in the certificates.
MEPA guidelines require proponents to show meaningful progress on permitted developments. If there is no progress after three years, filing an NPC can be required. After five years without activity, a new ENF might be required, essentially restarting the permitting process. However, a wide range of development activity such as site preparation or efforts to secure financing can be considered progress.
The 16 sample developments reviewed in this study, listed in Table 1, were identified through a regional project database maintained by the Metropolitan Area Planning Council (MAPC). These projects were selected individually, some on the recommendation of MAPC, to represent a variety of regional locations and development situations. Selected projects were required to be sufficiently large so that their transportation impacts would be significant.
The development names shown in Table 1 are the names used in the MEPA certification documents. The project names on the MEPA files tend to stay the same even if the development is rebranded multiple times. Simplified names are shown in parentheses. The developments in Table 1 are grouped by location, which are discussed in the following section. Web addresses to access these developments in the MEPA Project Database are also shown.
Table 1
Sample Developments and MEPA Files
Source: Massachusetts Executive Office of Energy and Environmental Affairs
The links in Table 1 connect with a list of all MEPA submissions associated with a specific file number. File numbers are issued sequentially and can be active for decades. For instance, the Kendall Square Urban Renewal Project has MEPA file number 1591. The proponent, the Cambridge Redevelopment Authority, submitted the initial ENF in 1975, and the twelfth submission, an NPC, was submitted in July 2016. The Secretary issued a certificate on August 5, 2016, and this most recent certificate can be downloaded from the EEA office’s online Environmental Monitor at http://web1.env.state.ma.us/EEA/emepa/emonitor.aspx.
The location of a proposed development determines to a significant degree the nature, magnitude, and disruptive potential of its transportation impacts. This section defines a local area around each of the sample developments and characterizes each area by the number and density of residents and workers. For the purposes of this study, the local areas of the 16 sample developments are defined as land within seven-tenths of a mile of the development. The radius used to define local areas was chosen for convenience, but using a uniformly defined local area allows for comparison of the local demographic impacts of large-scale developments.
Local area demographic information has been developed on the basis of Transportation Analysis Zones (TAZ). TAZs are the geographical basis of the Boston Region Metropolitan Planning Organization’s (MPO) travel demand model set, and a variety of transportation and demographic information is available on the basis of TAZs. The largest single TAZ with a sample development is the 1.53 square mile TAZ 2417 in Foxborough, about the size of a circle with a seven-tenths mile radius. The size of this single, large TAZ serves as the standard size of local areas in this study. TAZs are combined in the other local areas to total approximately 1.53 square miles.
Table 2 presents the sample developments in the same order as in Table 1. The six developments in the first group are located in Boston, Cambridge, or Somerville. These are referred to in this study as the Core Area developments. The next seven developments are all located along the circumferential section of Interstate 95, still commonly referred to as Route 128. The Route 128 developments are arranged from north to south starting with Woburn Landing in Woburn at the north and ending at Westwood Station in Westwood at the south. The last three projects are located outside the Route 128 circumferential corridor.
Table 2
Sample Development Locations and Environs
| Development Name | City | Traffic Analysis Zone (TAZ) | TAZs in Local Area | Local Area Square Miles | Local Area Residents | Local Area Workers | Combined Density (Residents+Workers per Square Mile) |
| Winthrop Square | Boston | 59 | 73 | 1.34 | 21,051 | 183,165 | 152,900 |
| South Station air rights | Boston | 19 | 70 | 1.44 | 17,687 | 179,873 | 137,200 |
| Kendall Square Renewal | Cambridge | 638 | 25 | 1.26 | 17,404 | 40,135 | 45,800 |
| Boston Landing | Boston | 223 | 15 | 1.37 | 16,409 | 16,937 | 24,400 |
| Residences at Assembly | Somerville | 592 | 12 | 0.98 | 12,382 | 5,735 | 18,500 |
| Assembly Row | Somerville | 594 | 12 | 0.98 | 10,139 | 5,952 | 16,500 |
| Woburn Landing | Woburn | 864 | 6 | 1.12 | 1,050 | 11,941 | 11,600 |
| Polaroid site | Waltham | 977 | 4 | 1.41 | 4,174 | 4,880 | 6,400 |
| The Station at Riverside | Newton | 1028 | 3 | 1.34 | 4,711 | 6,549 | 8,400 |
| Needham Street | Newton | 1046 | 3 | 1.45 | 1,343 | 9,435 | 7,400 |
| Center 128 | Needham | 1504 | 2 | 1.55 | 1,677 | 7,364 | 5,800 |
| Legacy Place | Dedham | 1061 | 5 | 1.00 | 2,136 | 5,987 | 8,100 |
| Westwood Station | Westwood | 1614 | 2 | 1.71 | 2,169 | 2,389 | 2,700 |
| Apex Center | Marlborough | 2264 | 4 | 1.47 | 1,418 | 4,034 | 3,700 |
| Patriot Place | Foxborough | 2417 | 1 | 1.53 | 514 | 1,913 | 1,600 |
| Patriot Place West | Foxborough | 2417 | 1 | 1.53 | 514 | 1,913 | 1,600 |
| Core Area | 128 | 5.27 | 69,105 | 248,362 | 60,300 | ||
| Route 128 | 24 | 8.38 | 17,050 | 42,350 | 7,100 | ||
| Outer Areas | 5 | 3.00 | 1,932 | 5,947 | 2,600 | ||
| Sample Locations Combined | 157 | 16.64 | 88,087 | 296,659 | 23,100 | ||
Source: Central Transportation Planning Staff
The TAZ number where each development is located is shown. The lower TAZ numbers tend to be closer to downtown Boston. The number of TAZs that have been grouped to represent the local area of each development is also presented. The TAZs in downtown Boston are so small that 73 TAZs were grouped together to represent the local area of the Winthrop Square project. At the opposite extreme is TAZ 2417 in Foxborough, which is large enough that it constitutes, for the purposes of this study, the entire local area for the Patriot Place developments adjacent to Gillette Stadium.
Because the local areas have been defined as groups of TAZs, the sizes vary and never exactly equal the 1.53 square mile benchmark. Several of the local areas are small because they are near water and much of the area within seven-tenths mile may be not part of a TAZ. In the other instances, TAZs have been included to approximate the seven-tenths mile rule and 1.53 square mile area as closely as possible.
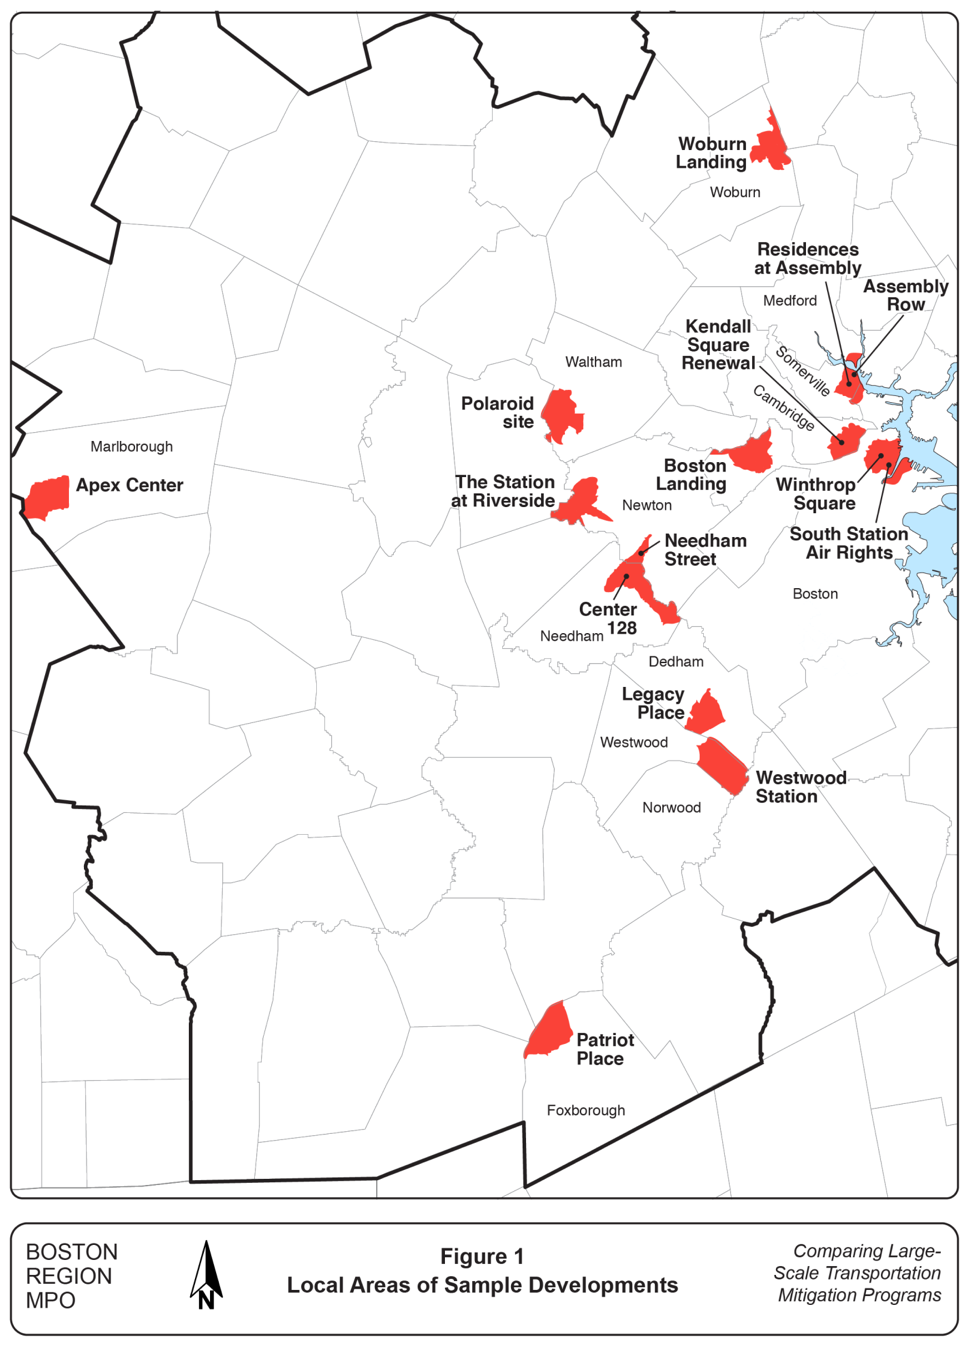
The local areas of the sample developments are shown in Figure 1. Only 12 discrete areas appear in Figure 1 because eight of the local areas overlap with a nearby local area. The overlapping local areas include Winthrop Square and South Station air rights in Boston, Residences at Assembly and Assembly Row in Somerville, Needham Street in Newton and Center 128 in Needham, and the two Patriot Place developments in Foxborough that share the same TAZ as a local area. The summary statistics for the three development groups eliminate any double counting from overlapping local areas.
Table 2 also shows the number of residents and workers within the local area of each sample development. With the exception of the two developments proposed for Somerville, every local area defined for study had more workers than residents in 2010. Taken together, the sample development local areas have approximately 297,000 workers compared with only 88,000 residents. The entire Boston MPO region has almost twice as many residents as workers, suggesting that large-scale development opportunities tend to be in those parts of the region with a high level of economic activity.
Table 2 also includes density calculation. The total residents and workers of each local area have been added together and the sum divided by the size of the local area in square miles. This is the combined density and reflects the level of urbanization and the associated stresses on the local area’s transportation system. When considering how a development might change the character of an area, changes to population and employment are considered separately.
The sample developments in the core area are listed in descending order of the combined density and range from 152,900 in the Winthrop Square local area to 16,500 in the Assembly Row local area. Assembly Row, and the nearby Residences at Assembly, had the only local areas in the sample with fewer workers than residents in 2010. Even then, their densities substantially exceeded the combined density of any local area outside the core, with the next highest being 11,600 at Woburn Landing in the Route 128 corridor.
The density conditions of the three groups of sample developments are also summarized in Table 2. The seven developments in the Route 128 corridor are either physically adjacent or an intersection away from the crowded circumferential highway, yet the combined density of the group (7,100) is barely one-tenth the density of the core area developments (60,300). The dramatic range of local area densities helps explain the challenges and opportunities of mitigation programs implemented across the region.
Figure 1
Local Areas of Sample Developments
As mentioned above, MEPA certification documents distill from project proponents a common set of data, and these data serve as the basis of analyzing developments and their associated mitigation. This study has further simplified available data in order to facilitate comparisons between sample developments. These simplified data are presented in Table 3 along with indices calculated to illustrate development scale and impacts.
MEPA documents provide estimates of the numbers of residential units and hotel rooms anticipated to be constructed as part of major developments. These numbers often fluctuate in the course of the planning process in response to market conditions and business opportunities. Table 3 shows the total of residential units and hotel rooms for each sample development. While this is clearly an oversimplification for a business analysis, it does show a quantity of planned construction that is fundamentally dissimilar to office, retail, or laboratory structures in both design and use.
The size of proposed developments can be expressed in square feet of new or refurbished building floor space. Two measurements of floor space are shown in Table 3. The number in Table 3 for thousands of square feet of commercial floor space includes structures used for most business activities with the exception of hotels and parking. Business activities frequently mentioned in certification documents include office, laboratory, retail, and restaurant. Similar to the planning of hotel and residential units, the planning of commercial floor space changes during the planning and permitting process.
Table 3
Sample Development Characteristics and Transportation Impacts
| Development Name | City | Residential Units and Hotel Rooms | Commercial Square Feet | Total Square Feet | Projected Increase in Residents | Projected Increase in Workers | Percent Increase in Local Area Residents | Percent Increase in Local Area Workers | Increase in Weekday Person-Trips | Increase in Weekday Vehicle-Trips |
| Winthrop Square | Boston | 500 | 769,000 | 1,592,000 | 1,000 | 2,563 | 5% | 1% | 11,120 | 3,360 |
| South Station air rights | Boston | 795 | 1,230,000 | 1,981,000 | 1,590 | 4,100 | 9% | 2% | 12,240 | 3,072 |
| Kendall Square Renewal | Cambridge | 560 | 742,000 | 1,125,000 | 1,120 | 2,475 | 6% | 6% | 10,750 | 3,720 |
| Boston Landing | Boston | 295 | 1,450,000 | 1,761,000 | 590 | 4,833 | 4% | 29% | 12,346 | 11,412 |
| Residences at Assembly | Somerville | 407 | 1,357,000 | 1,747,000 | 814 | 3,873 | 7% | 68% | 18,535 | tbd |
| Assembly Row | Somerville | 1,843 | 3,849,500 | 5,693,000 | 3,686 | 12,832 | 36% | 216% | 45,055 | 24,594 |
| Woburn Landing | Woburn | 250 | 19,000 | 177,000 | 500 | 124 | 48% | 1% | 6,034 | 4,124 |
| Polaroid site | Waltham | 650 | 1,480,000 | 2,130,000 | 1,300 | 4,933 | 31% | 101% | 29,940 | 18,954 |
| The Station at Riverside | Newton | 290 | 251,000 | 541,000 | 580 | 837 | 12% | 13% | 5,552 | 5,052 |
| Needham Street | Newton | 865 | 372,000 | 1,237,000 | 1,730 | 1,240 | 129% | 13% | 4,521 | tbd |
| Center 128 | Needham | 646 | 1,179,000 | 1,835,000 | 1,292 | 3,931 | 77% | 53% | 9,774 | 7,445 |
| Legacy Place | Dedham | 0 | 734,000 | 734,000 | 0 | 2,447 | 0% | 41% | na | 13,471 |
| Westwood Station | Westwood | 910 | 1,075,000 | 2,100,000 | 1,820 | 3,583 | 84% | 150% | 43,515 | 33,700 |
| Apex Center | Marlborough | 245 | 309,000 | 446,000 | 490 | 1,029 | 35% | 26% | na | 9,430 |
| Patriot Place | Foxborough | 200 | 1,016,000 | 1,216,000 | 400 | 3,387 | 78% | 177% | na | 41,690 |
| Patriot Place West | Foxborough | 0 | 1,620,000 | 1,620,000 | 0 | 5,400 | 0% | 282% | na | 15,432 |
| Core Area | 4,400 | 9,398,000 | 13,899,000 | 8,800 | 30,676 | 13% | 12% | |||
| Route 128 | 3,611 | 5,110,000 | 8,754,000 | 7,222 | 17,095 | 42% | 40% | |||
| Outer Areas | 445 | 2,945,000 | 3,282,000 | 890 | 9,816 | 46% | 165% | |||
| Sample Locations Combined | 8,456 | 17,453,000 | 25,934,000 | 16,912 | 57,587 | 19% | 19% |
tbd = to be determined (still early in permitting process)
na = not available (only vehicle estimates were published)
Sources: Central Transportation Planning Staff, Massachusetts Executive Office of Energy and Environmental Affairs
The total floor space of the sample development is the total of commercial floor space and floor space associated with housing and hotels. The total floor space shown in Table 3 represents the total economic size of a development. The size and cost of any mitigation program depends upon the ability of a development to generate revenue and profit. Assuming that general levels of profitability are similar, larger developments would be expected to have the capability of funding more extensive mitigation programs.
Table 3 shows estimates of demographic and transportation changes that might result from each sample development, beginning with estimates of the increases in residents attributable to the sample developments. In 2010, the average household size was approximately 2.6 residents in the Boston MPO region. Some MPO studies use an average household size of 2.3 residents for multiple-unit housing, which almost all units planned for the sample developments will be. Hotels also generate short-term, residential-type activity, though the average occupancy of a hotel room will be fewer than two residents. As a project progresses, the mix of residential and hotel units may change, and this study has arbitrarily chosen an average occupancy of two residents to characterize the total anticipated population of residential units and hotel rooms combined.
The increases in the numbers of workers shown in Table 3 have been approximated by assuming 300 square feet per worker in new commercial space. Floor space estimates by type of land use were developed for the Central Artery project2 and the analysis was later expanded to include some inner suburbs as part of the Urban Ring transit study. Employment by industry was based on municipal-level data submitted to the Bureau of Labor Statistics as part of the state’s ES-202 reporting requirements. With these data, it was possible to calculate the number of square feet per worker by type of land use, and these estimates clustered around 300 square feet per worker. Using 300 square feet per worker is a compromise and is the only factor used here because the configurations of developments evolve during the planning process and the final tenants may not yet be known.
Dividing the projected increases in residents and workers shown in Table 3 by the residents and workers in entire local areas shown in Table 2 gives the percent increases in residents and workers shown in Table 3. Taken altogether, the sample developments increase the number of residents and workers in their combined local areas by 19 percent. But the percentage increases vary widely for each sample development, ranging between no increase (Legacy Place) and a 129 percent increase (Needham Street) in residents, and a 1 percent increase (Winthrop Square and Woburn Landing) and a 282 percent increase (Patriot Place West) in workers. Variations in the percent increases of this magnitude are largely a result of the population and employment levels that exist in the local areas prior to the development.
Increases in residents and commercial activity will result in more travel to, from, and within a new development. The number of new trips that a proposed project is expected to generate must be estimated by project proponents using standard transportation engineering methodologies.3 Trip generation estimates must be submitted at some point in the MEPA process. Any available trip estimates from recent sample development certification documents are shown in Table 3.
Table 3 shows estimates of both person-trips and vehicle-trips that the sample developments are expected to generate on a typical weekday. The number of person trips approximates the amount of trip making (people arriving plus people leaving) that would be expected from the mix of residential space and business activity envisioned at each development. The estimated person-trips to the businesses are assumed to be necessary if the businesses are commercially viable.
For most of the sample developments, the number of person-trips has been adjusted downward to provide an estimate of the number of vehicle-trips that the development is expected to generate. These adjustments can be justified for several reasons including:
The reduction in auto trips attributed to these four factors can be substantial, with the South Station and Winthrop Square developments anticipating the use of only one vehicle for every four person-trips. These types of adjustments are harder to justify in the less-dense suburban locations, and some project proponents simply base their planning on an assumption that all travel to or from the development is by auto. The calculations supporting these adjustments are included in the proponent submissions at the MEPA office.
Even within the norms of current professional practice, some judgment and interpretation must be used in the process of developing estimates of trips and making associated adjustments. The MEPA process makes project documents available for public review and invites written comments on key project submissions. For the purposes of this study the trip generation estimates in Table 3, which were obtained from the certification documents, are considered to be the transportation impacts, which the mitigation programs are intended to address.
Accommodating and mitigating increased activity and vehicle traffic at or near new developments has long been an important objective in transportation planning. Even if there is extra capacity available on the local road network, a large project might be expected to add sufficient traffic to lower roadway level-of-service (LOS) measurements, possibly even to unacceptable levels. Improving the local road system to accommodate a new development is often referred to as traffic systems management (TSM). Possible TSM actions include the following:
In addition, developers are often required to monitor traffic levels after project completion. Required TSM efforts might be expanded or modified as the actual traffic impacts become apparent.
TSM measures have proved successful in reducing traffic impacts and making numerous large projects palatable to host communities. Today, however, the underlying traffic and transportation challenges have increased to the point that TSM as practiced in the past is no longer considered sufficient for large projects. The limitations of traditional TSM mitigation can be considered in three broad areas:
In view of these limitations, transportation mitigation practices and expectations for large developments have evolved. As mentioned above, the scale of potential TSM improvements has expanded. In addition, developers are now required to implement TDM programs, which are intended to reduce the amount of vehicle traffic at a development in ways compatible with its commercial viability. Finally, developer-funded improvements to local public transit infrastructure are becoming more common.
The rest of this section reviews the transportation mitigation efforts of the 16 sample developments. The Core Area developments are presented in ascending order of local area density, and the other two groups are presented in the order in which they appear in the tables. These efforts are considered in the context of the size metrics presented in the previous section. These are all multi-year development efforts and the status of each project and associated mitigation is briefly summarized.
The EEA Secretary issued a certificate on the Final Environmental Impact Report (FEIR) for this project dated April 30, 2010. This certificate described the agreed upon mitigation, which has served as the basis for this analysis. In 2014, the project proponent, Federal Realty Investment Trust, filed an NPC when the Partners Healthcare office building replaced an IKEA furniture store as the development’s largest single element. The EEA Secretary determined that the mitigation specified in the FEIR was still appropriate and that no further environmental review was required. The Secretary’s NPC decision was released on June 27, 2014, and this document is the basis of the project description and estimated impacts referenced in Table 3.
This development is considered a showcase for transit-oriented development and the inclusion of major transit investments as part of mitigation. The addition of 3,686 residents and 12,832 workers in this predominantly residential area (see Table 3) will significantly increase the population by 36 percent and dramatically increase the workforce by 216 percent. This increase in residents and workers is projected to increase person-trips by 45,055 and vehicle trips by 24,594 on a typical weekday.
The proponent agreed to contribute $15,000,000 towards the construction of the new Assembly Station on the Orange Line. The new transit station and the internal capture of a significant number of work and retail trips contribute to the reduction of vehicle trips required to support the development. The developer is permitted, however, to add 9,815 new parking spaces.
Assembly Station opened in 2014 and has approximately 3,100 boardings on a typical weekday. Assembly Row is not yet fully built-out and other nearby developments are expected to add significant additional ridership. As a comparison, the Green Street Orange Line station, located in a primarily residential section of Jamaica Plain, has approximately 3,600 weekday boardings.
As part of its open space and tidelands mitigation review, the proponent agreed to invest $2,525,000 to improve the Department of Conservation and Recreation (DCR) Riverfront Park along the Mystic River adjacent the development site. While not primarily transportation improvements, the riverfront work did include a critical long-sought bicycle-pedestrian link under Fellsway Route 28 that complements new bicycle lanes incorporated into all the roadways constructed within the project. The riverfront improvements are complete and the proponent has also agreed to fund long-term parkland maintenance.
Assembly Row also incorporates traditional TSM mitigation approaches, notably redesigned intersections to move traffic more efficiently off of and on to Fellsway Route 28. But the new Assembly Station is the signature mitigation feature. These mitigation measures are significant, but they each illustrate major challenges of mitigation. The new Orange Line users can easily enter the system at the new station, but they add to transit congestion in the system’s core. The added traffic can efficiently use Fellsway Route 28, but adds to traffic congestion throughout the region. The TDM programs that the proponent has agreed to facilitate may reduce the regional traffic congestion, but in the process will add to the transit congestion.
The EEA Secretary issued a certificate dated November 30, 2016, for an Expanded ENF that describes a proposed development. The certificate requires the completion of an EIR and sets out a detailed scope of work that the EIR will need to address. Issues appropriate for mitigation are mentioned, but proposed mitigation measures will be specified in the EIR.
This development is projected to add 814 residents and 3,873 workers to the area, which represent increases of 7 percent and 68 percent, respectively, for the development’s local area (see Table 3). These percent increases are based on the numbers of local area residents and workers shown in Table 2, which include no growth from the nearby Assembly Row development even though it is now partially complete.
The Residences at Assembly development with its substantial new employment, is projected to add 18,535 daily person-trips. An adjusted estimate of vehicle trips has not yet been published, but it is expected to show a significant trip reduction because of the nearby Assembly Orange Line station, walk trips to the new Assembly Row and older Assembly Square destinations, and some trip capture within its own development complex. The proponent is proposing to build 995 new parking spaces that would supplement the existing 675 spaces.
This development will require a Vehicle Access Permit to be issued by MassDOT because of its size. Requests for these permits are reviewed by MassDOT’s Office of Transportation Planning (OTP) and written comments on the ENF submitted by OTP provide some indication of the types of infrastructure improvements that may be required.
Featuring prominently in the OTP analysis is a road safety audit (RSA) undertaken in 2016 that looked at the ramp and intersection complex at the confluence of McGrath Highway and Fellsway (Route 28), Mystic Avenue (Route 38), and Interstate 93. Several state-identified high-crash clusters are within or near this complex, and MassDOT and DCR have proposed a number of improvements based on the RSA and other studies that will improve safety and traffic operations at this difficult location. OTP recommends that some of these elements be incorporated into proposed mitigation. OTP also mentions an unrelated study by the Lower Mystic Regional Working Group and suggests that some recommendations developed by that study be considered as possible mitigation measures.
OTP also recommends that the pedestrian facilities be completely rebuilt and enhanced, and that the bicycle circulation system be expanded, especially in support of anticipated trip flows. Increased ridership on the Massachusetts Bay Transit Authority (MBTA) Orange Line and buses should be estimated, and mitigation arrangements might be negotiated with the MBTA.
The EEA Secretary issued a certificate for an EIR for this project on January 25, 2013. This was followed by a certificate dated November 7, 2014, for an NPC. The January 25, 2013, certificate substantially describes the proposed development and most of the associated mitigation. The November 7, 2014, certificate incorporates into the development the construction of a new commuter rail station to be built on behalf of the MBTA.
The Boston Landing development is in a transforming industrial area. Much of the industry has left, and approximately half the area’s workers are now in the service sector. As shown in Table 2, the number of workers (16,937) is roughly equal to the number of residents (16,407). The athletic gear maker, New Balance, is developing a large site that will include its now-complete world headquarters, recently completed professional athletic practice facilities, and planned hotel, retail, and commercial office space. Altogether, this development will increase local area employment by 29 percent.
The development is expected to be dependent primarily on automobiles. The number of weekday vehicle trips shown in Table 3 (11,412) is only eight percent lower than the number of person-trips (12,346). Consequently, most of the mitigation commitments involve TSM improvements. The January 2013 certificate specified 27 small-scale actions at eight locations near the development that were required as immediate improvements. TSM improvements at an additional 19 locations will be undertaken as the development progresses. The developer is permitted to add 1,905 new parking spaces.
New Balance also agreed to fund entirely the design and construction of a new station on the Framingham/Worcester commuter rail line. New Balance will also pay for all station maintenance for 10 years. The station was opened in 2017 and is now served by 34 of the 55 trains serving this line on weekdays.
MPO staff counted passengers boarding and leaving each train during a weekday in January 2018. Approximately 450 total boardings were observed. However, these total boardings represent four distinct same-day travel patterns. These four patterns are approximated here using rounded averages of the observed boardings:
The significance of these patterns is that approximately three-fourths of the riders, 340, start their journey at Boston Landing and return later. Most of these riders, 300, travel to downtown Boston. The remaining 110 riders start their journey either in downtown Boston or one of the western commuter rail stations, travel to Boston Landing, and return later in the day.
The Boston Landing development is expected to add almost 5,000 workers and few, if any, permanent residents. Today, commuter rail riders making a day trip to Boston Landing represent only one-quarter of the ridership. The bulk of today’s riders are residents of the station area whose travel is in no way a result of the emerging development.
The number of riders commuting to Boston Landing should gradually increase as major components of the development are completed. However, the ridership patterns of the new station illustrate how transit mitigation can improve service in travel markets unrelated to the sponsoring development. Similarly, the TSM improvements can improve traffic conditions for all users at the location of the improvement. However, any new travel demand inevitably contributes to regional congestion, regardless of how skillfully mitigated near its source.
The EEA Secretary issued a certificate for an EIR for this project on November 25, 2015. This was followed by a certificate dated August 5, 2016, for an NPC. Taken together these two certificates describe proposed new development and associated mitigation programs for the Kendall Square Urban Renewal Project.
As mentioned above, the MEPA review of developments in this area was initiated by the proponent, the Cambridge Redevelopment Authority, in 1975. Since then the proponent has submitted NPCs as planning and development opportunities emerged. Development practices and mitigation expectations have evolved over the years, and aspects of this new thinking are reflected in the EEA Secretary’s certificate for the most recent NPC.
The proponent has selected a developer, Boston Properties, who proposes to build several buildings that will add 1,120 new residents and 2,475 new workers. These increases add only six percent more residents and workers to this already well-developed area. A projected increase of 10,750 person-trips has been adjusted down to 3,720 vehicle trips reflecting both Red Line service and the convenience of walking for a large variety of trips in the area. The large number of people walking and bicycling is typical in urban areas with a concentration of academic and research activities.
In 1998, Cambridge enacted the Parking and Transportation Demand Management Ordinance (PTDM). This ordinance applies citywide and implementation of some level of PTDM programs is legally required of any nonresidential owner of five or more parking spaces to seek a city permit to add any additional spaces. PTDM requirements apply automatically and are not technically mitigation. This phase of redevelopment is expected to add 809 net new parking spaces.
A memorandum of understanding between the proponent, MassDOT, the MBTA, Cambridge, and other stakeholders establishes a mechanism to fund the Kendall Square Transit Enhancement Program (KSTEP). The developer is a concurring party to the agreement and will be a major source of KSTEP funding. Details of the KSTEP agreement were featured prominently in the certificate dated August 5, 2016.
The developer will contribute $6,000,000 to the KSTEP fund prior to the issuance of any building permits for new commercial development. Boston Properties, and in the future other developers, may be required to make additional contributions based upon commercial square footage of proposed developments. Residential space is exempt from the need to make KSTEP contributions in order to encourage the construction of housing.
KSTEP funds will be administered by a KSTEP Working Group and expenditures may include funding additional bus routes or frequencies serving the Kendall Square area by the MBTA or other providers, or capital improvements in or near the Kendall Square Red Line station. The Working Group will also identify potential longer term strategic transportation investments.
KSTEP as a mitigation effort innovates in that it focuses on transit and can be deployed flexibly throughout the development’s local area. The envisioned programs will primarily make transit more appealing and help raise transit’s mode share. In some instances, KSTEP’s actions may expand capacity at critical points in the local area. Insofar as KSTEP is successful, however, it will bring new riders into the MBTA system and exacerbate crowding at other locations in the network.
The EEA Secretary issued a certificate dated October 7, 2016, for an NPC for this project that substantially describes the proposed development and the associated mitigation. This is a separate project from the proposed South Station Expansion: https://eeaonline.eea.state.ma.us/EEA/emepa/meparcproj.aspx?eoea_num=15028
This project is expected to add 4,100 workers and 1,590 residents, which represent increases in the local area of 2 percent and 9 percent, respectively. As shown in Table 2, the local area has more than 10 times the number of workers (179,873) than residents (17,687). The residential component of this project is split between condominiums and hotel rooms, and is part of the trend of increased residential options in downtown Boston.
Table 3 shows that this project has the greatest downward adjustment of any of the sample developments, from 12,240 person trips to only 3,072 vehicle trips. South Station is as close to an optimal location for transit access as exists in the region, with one-seat service to Braintree, Ashmont, and Alewife on the Red Line, Logan Airport and the South Boston Waterfront on the Silver Line, the entire south side commuter rail system, all regional bus carriers, and Amtrak and the several long-distance bus carriers.
The downward adjustment is also a consequence of the convenience of the walk mode with an estimated other 17,687 residents and 179,873 jobs in the local area. There will also be a substantial number of internally captured trips in a project of this magnitude. The project will, however, be permitted to add 895 parking spaces.
A 50 percent expansion of the bus station has been an integral part of this project since its initial conception more than 20 years ago. This project includes a high-rise structure set behind the historic South Station building over parts of the train tracks that are currently uncovered. The bus terminal area will be extended through one of the lower floors of the high-rise structure, increasing the bus terminal capacity and allowing for a convenient direct entrance to the bus terminal from the historic South Station waiting area.
The bus station expansion represents a significant transit investment, but it is not technically mitigation. Rather, it was always assumed that the enlarged bus terminal would need to be compatible with whatever large development was proposed for this location, and it was expected that the developer would pay for the expanded terminal.
The developer is expected to fund several distinct mitigation efforts, however. The pedestrian experience will be improved through reconstruction and reconfiguration of adjacent and nearby sidewalks. The goal is to stimulate a vibrant street life for workers, visitors, and the growing numbers of residents. New pedestrian connections within the development will be considered, and secure bicycle storage facilities will be constructed.
The Boston Transportation Department intends to undertake a pedestrian access study for the area around South Station and the nearby Leather District. The proponent will fund pedestrian counts at key locations throughout the study area. The scope of work will be developed in conjunction with a traffic monitoring program.
The EEA Secretary issued a certificate dated February 16, 2018, for a Draft EIR for this project that substantially describes the proposed development and the associated mitigation.
This project is expected to add 2,563 workers and 1,000 residents, which represent increases in the local area of 1 percent and 5 percent, respectively. As shown in Table 2, the local area has almost nine times the number of workers (183,165) than residents (21,051). The residential component of this project is entirely private residences, and is part of the trend of increased residential options in downtown Boston.
Table 3 shows that the development is expected to generate from 11,120 person trips, which adjusts to only 3,360 vehicle trips. This downward adjustment is a consequence of the nearby transit services at South Station, Downtown Crossing, and State Street stations. Walking is also an attractive mode to reach an estimated 21,051 other residents and 183,165 jobs in the local area. The project intends to add 550 parking spaces, 300 of which will be reserved for residents and 250 spaces will support commercial uses. Some of the residential spaces will be available for office parking during the day.
Significant improvements are planned for the pedestrian environment at and near this development. Sidewalks will be reconstructed in wider formats, and new pedestrian connections through the development site will be created, allowing movements that were not possible when the site was previously occupied by a parking garage. A centerpiece of the project is the “Great Hall,” which will be integrated into the building but function as an extension of the public realm. The proponent has committed to encouraging the evolution of Winthrop Square as a destination public plaza, and has committed to maintenance of the Winthrop Square and other project-area streetscapes.
The pedestrian system improvements will facilitate the use of both the walking and transit modes. Transit users have to walk a couple blocks to reach one of the several transit stations. Because transit users will distribute over a number of downtown stations and bus stops, the increased transit ridership is considered manageable by the MBTA.
There will also be bicycle-related improvements. Bicycling is not anticipated to be a major mode, and the amount of bicycle parking to be provided has not yet been determined.
The EEA Secretary issued a certificate dated May 9, 2015, for the FEIR for this project that substantially describes the proposed development and the associated mitigation.
This project consists of a limited-service hotel and several food service operations. The local area (see Table 2) is calculated to be 1.12 square miles and has 11,941 workers but only 1,050 residents. The development is estimated to add only 124 workers, representing an increase of one percent (see Table 3). The hotel will have 250 rooms, allowing a theoretical increase of 500 temporary residents in this generally nonresidential area.
Most of the traffic will be generated by the restaurants, and 540 surface parking spaces will be constructed. The development will generate an estimated 6,034 person-trips, which has been adjusted to 4,124 vehicle trips based largely on the internal capture of trips by hotel guests to the food service offerings. In addition, much of the traffic generated by hotels and food service is outside the peak periods.
The project proponent has agreed to finance reconstruction and improvements at a number of Washington Street intersections abutting the development, notably at the intersection with the I-95 northbound off- and on-ramps. An adaptive, coordinated traffic signal system will also be implemented, which will include intersections on the opposite side of I-95 that are not otherwise modified, including the southbound I-95 ramps.
In addition to the intersection improvements, the proponent will reconstruct nearby sections of Washington Street to provide a minimum five-foot shoulder that can serve as a bicycle lane. New sidewalks will be built at locations where they currently do not exist, and existing sidewalks will be rebuilt to modern standards. Secure bicycle parking will be provided at points within the development.
The proponent has agreed to implement a number of TDM measures, including joining the 128 Business Council Transportation Management Association (TMA). The TDM efforts focus primarily on the needs of the workforce, creating conditions that make commuting without one’s private auto more practical.
For this development, however, the workforce will not generate the bulk of the trips. The hotel operator will be encouraged to operate a shuttle bus to the nearby transit hubs, notably the Anderson Regional Transportation Center (RTC). The Anderson RTC is served by commuter rail, the Amtrak Downeaster serving upper New England, and Logan Express.
This project is proceeding in two phases. The EEA Secretary issued an Amended Record of Decision (ROD) dated January 7, 2015, that allowed construction of Phase I and associated mitigation, now substantially complete. The EIR for the entire project is not yet complete and the proposed project configuration and impacts are based upon proponent submissions. Any required mitigation for Phase II has yet to be finalized.
Taken together, the two project phases are expected to add 1,300 residents and 4,933 workers, representing 31 percent and 101 percent increases, respectively. The first phase included only 305,000 of the eventual 2,130,000 square feet, but it included a new, full-sized Market Basket supermarket.
Suburban supermarkets by their nature generate large numbers of vehicle trips. The amended ROD listed a large number of roadway improvements adjacent the site and on important approach routes. These phase 1 improvements were assumed to fully mitigate the new Market Basket and additional Phase I office space, but additional mitigation will be required with the completion of the MEPA review process.
When complete, the development is projected to generate 29,940 person-trips. A 37 percent adjustment has been applied to provide an estimate of 18,954 weekday vehicle trips. There is limited transit service at this location, but the large supermarket may account for much of this adjustment. The new store will become the preferred shopping location for a substantial number of the development’s new workers, resulting in significant internal capture. The store will also attract some pass-by customers patronizing the store without making a special trip. Finally, there may be a meaningful vehicle occupancy adjustment for shopping trips.
TDM programs were also included in the Phase I mitigation requirements, including membership in the 128 Business Council TMA. Another transit-related requirement was to incorporate an on-site location for service by the MBTA’s bus routes 70 and 170. Route 70 provides frequent daily service to Central Square in Cambridge. Route 170 offers limited service to Dudley Square scheduled specifically for job access.
The EEA Secretary issued a certificate dated July 31, 2015, for the FEIR for this project that substantially describes the proposed development and the required mitigation. The proponent has not yet committed to fund key elements of the required mitigation. If the proponent commits the funding or identifies another source committed to funding these elements, the proponent must publish a revised Letter of Commitment in the Environmental Monitor prior to the issuance of a Vehicle Access Permit by MassDOT.
This development is proposed for MBTA-owned property at the Riverside Green Line station. The MBTA uses the property for Green Line vehicle maintenance and operations, and has a surface commuter parking lot with 960 spaces. The proponent would build a five-level parking structure with 1,005 spaces that would also support bus services, passenger pick-up and drop-off, and limited retail and MBTA support operations. This planned facility is referred to as the Intermodal Commuter Facility (ICF). The MBTA would be responsible for operations of the ICF. Required TDM measures will include working with stakeholders to expand transit opportunities at the ICF.
The proponent would enter into an 87-year lease with the MBTA for the land freed up by consolidating parking into the ICF. The current development proposal is for three buildings totaling 541,000 square feet, which would add 580 residents and 837 workers at the site, representing increases of 12 percent and 13 percent, respectively, in the local area.
The proposed development is expected to generate 5,052 vehicle trips each workday. Despite being convenient to frequent Green Line service, this location is assumed to be mostly auto-dependent because of suburban travel patterns. An estimated 5,552 person trips are adjusted downwards by only 10 percent because of transit use and other trip-reduction factors. The development would add 1,009 new parking spaces unrelated to the ICF.
The Green Line parking lot is currently accessed from Grove Street. Grove Street connects with I-95/Route 128 at interchange 22, but is barely adequate for serving today’s park-and-ride lot and would be entirely inadequate as currently sized to serve the proposed development. MassDOT and local stakeholders have agreed that a second entrance should be constructed allowing traffic to enter and leave the development site from a collector-distributor ramp (C-D) that currently exists on the east side of I-95 north of interchange 22. This would require major reconstruction of the C-D and, together with related improvements to the Grove Street corridor, would cost an estimated $9,500,000. Funding for these required improvements has not yet been identified.
The proponent has agreed to provide $2,000,000 to Newton’s neighborhood improvement fund for traffic and neighborhood improvements in the vicinity of the project location, which are under the city’s jurisdiction. Bicycle and pedestrian facilities will be constructed within the proposed development and are included in the required Grove Street corridor improvements. The DCR is adding and improving recreational trails near the proposed development, and the path system within the development will connect with the DCR trails.
The project proponent, Northland Development LLC, submitted an Environmental Notification Form (ENF), which was published in the Environmental Monitor on September 6, 2017, and includes a project description and proposed mitigation. As of this writing, the EEA office has not published a response to this ENF.
The proposed mixed-use development is projected to add 1,240 workers and 1,730 residents, which represent increases in the local area of 13 percent and 129 percent, respectively. As shown in Table 2, the local area has approximately seven times the number of workers (9,435) as residents (1,343). The residential component of this project would include 865 private residences, 20 percent of which would be affordable.
The development site currently contains a number of former manufacturing buildings, some of which have been converted for office use. There are currently 1,126 parking spaces serving the location. The modernization of current buildings and construction of new buildings are projected to generate 4,521 additional person-trips each weekday. To support this expansion, 1,124 additional parking spaces are proposed.
The proposed development is located between the historic Newton Upper Falls neighborhood and the transforming Needham Street commercial and industrial corridor. As currently proposed, this project will continue the evolution of this area to a livable mixed-use district with safe and convenient bicycle and pedestrian travel options. The proponent anticipates being granted zoning changes that will allow the desired mix of uses in the new development.
This area is very auto-dependent, and MBTA bus route 59 operates only 10 weekday buses on Needham Street in each direction. No buses run on weekends and the nearest Green Line stop is almost a mile away. An adjusted estimate of auto trips has not yet been published, and there is a possibility that the 4,521 weekday person-trips may be reduced somewhat because of internal trip capture or use of nonmotorized modes to connect with nearby locations.
No agreed upon mitigation measures have yet been published, but the proponent has indicated some of the options that are being discussed. Increasing service frequency for bus 59 and possibly routing it through the interior of the development are being considered. MassDOT is developing a new design for Needham Street, and the proponent is coordinating with MassDOT and may undertake portions of the Needham Street reconstruction. The proponent also mentions the Upper Falls Greenway, a partially improved multi-use path adjacent the development site. Improvement or extension of this facility will be considered as possible mitigation, as well as adding secure on-site bicycle accommodations.
The proponent has also proposed a TDM plan, several elements of which concern price and payment arrangements for parking. The proponent also intends to join the 128 Business Council TMA.
The EEA Secretary issued a certificate dated February 26, 2016, for a Final Supplemental EIR for this project that substantially describes the proposed development and the associated mitigation.
This project is expected to add 3,931 workers and 1,292 residents, which represent increases in the local area of 53 percent and 77 percent, respectively. As shown in Table 2, the local area has more than four times the number of workers (7,364) as residents (1,677). The residential component of this project includes 128 hotel rooms and 390 units of affordable housing enabled by Massachusetts General Laws Chapter 40B.
Public transportation at this location is minimal, and access will be predominantly by auto. However, the vehicle trips shown in Table 3 (7,445) are 24 percent less than the person-trips (9,774), reflecting perhaps a higher vehicle occupancy associated with the affordable housing. The developer is permitted to add 4,824 new parking spaces.
Plans for the development include the reconstruction of sidewalks and creation of a network of paths connecting all elements of the development. However, most of the infrastructure mitigation involves TSM improvements. In addition to improving the intersections that connect directly with the development, the proponent agreed to contribute $4,255,000 to the town and the New England Business Center Owner’s Association for off-site road improvements.
As part of its TDM program, the proponent is required to join the 128 Business Council TMA. Planning and operating successful transit services in suburban locations such as the Route 128 corridor is challenging because of the low density of development and the dispersed suburban travel patterns.
TMAs are one type of response to the problem of suburban transit service. TMA members, mostly employers and developers, support TMAs financially. Many TMAs operate services that closely match the needs of their members, procuring vehicles and designing schedules accordingly. Given the region-wide distribution of workers, TMA services are usually designed to connect with rail transit services for regional connectivity.
Finally, the proponent is required to undertake a transportation monitoring program (TMP). The TMP will use counts and surveys performed on a regular basis, and the TMP findings will be used to inform any modifications to the TDM program. If the TMP measures traffic levels significantly greater than predicted in the EIR, additional payments to Needham for road maintenance is required. The TMP program must continue for three years after completion of the last proposed building.
The EEA Secretary issued a certificate dated August 16, 2006, for the FEIR for this project that substantially describes the proposed development and the associated mitigation.
This development included 734,000 square feet of mixed-use commercial space, three-fourths of which was for retail and restaurant uses, and the remaining floor space was divided roughly evenly between offices and a cinema complex. The development added an estimated 2,447 workers for an increase of 41 percent in the local area.
Suburban retail locations are mostly auto-dependent, and this development is expected to generate 13,471 additional vehicle trips that will be accommodated with the addition of 3,000 new parking spaces. No downward adjustment for mode-split or internal capture was published in the Secretary’s certificate.
The required transportation mitigation for this project focused exclusively on improving the nearby road system. The proponent funded the realignment of an I-95 northbound off-ramp and new lane striping for one-half mile of the Providence Highway, US Route 1. Four signalized intersections were interconnected to create a closed-loop traffic signal system for more than one mile of US 1. In addition, an intersection on Route 1A, two-tenths mile west of US 1, was modified and the traffic control equipment replaced.
The EEA Secretary issued a certificate dated August 16, 2013, for an NPC that substantially describes the proposed development and the associated mitigation.
The Westwood Station development is in a transforming industrial area. Large industrial operations remain in the area, a few of which use an active freight rail spur. This development is projected to add 1,820 residents and 3,583 workers in the area, which represent increases of 84 percent and 150 percent, respectively. The local area has approximately the same number of residents as workers (see Table 2).
The project includes approximately 2.1 million square feet divided approximately evenly between residential and commercial space. The proposed 910 residential units include approximately 160 hotel rooms. Almost 70 percent of the commercial space will be used for retail, food service, or entertainment activities, with the remaining space used for office or research activities. A total of 5,596 parking spaces will be provided to support these activities.
The development is expected to generate a total of 43,515 weekday person-trips, many of which will serve the extensive retail and related activities. Retail activity at suburban locations tends to be very auto-dependent. A downward adjustment to 33,700 auto trips has been estimated, however, reflecting some internal trip capture and transportation benefits of the nearby Route 128 commuter rail station. This station will serve new area residents commuting into Boston, as well as a smaller number of workers commuting to new local area jobs. In addition, current commuter rail customers using the station’s parking garage may attach a shopping trip at the new development to one end or the other of their daily commute.
As part of this project, the entire street system, which had been built more than 50 years ago to serve industry, will be rebuilt to modern Complete Streets standards. Safe and efficient pedestrian and bicycle facilities will be built throughout the project area. Traffic generated by the new development will require a number of signalized intersections, which will be implemented as a coordinated system with adaptive signal control technology.
The proponent will undertake similar reconstruction and improvements at locations at the edge of the development. MassDOT is developing plans for the reconstruction of the I-93/I-95 interchange, which will include a redesigned I-95 Exit 13 at University Avenue. The timing of the I-93/I-95 interchange reconstruction is uncertain, but the proponent will coordinate with MassDOT and implement connecting roadway elements as practicable as the interchange designs advance.
The commuter rail station is near the I-93/I-95 interchange, and a new pedestrian connection to the commuter rail station from the east side of the rail line will be constructed. In addition, the proponent will contribute $325,000 to DCR to make a number of improvements in the nearby Neponset River Reservation, including construction of a path that will connect with the commuter rail station.
Farther from the development site, the proponent has agreed to finance improvements at 10 specified intersections and to finance studies of four additional intersections, including plans, specifications, and estimates for signal installation if warranted. The proponent has also agreed to provide $250,000 for a study of the Canton Street/University Avenue intersection at the border with Norwood, and to provide $2,100,000 to the town of Westwood to implement and monitor traffic calming measures in nearby residential areas.
The EEA Secretary issued a certificate dated July 8, 2016, for an NPC that substantially describes the proposed development and the associated mitigation.
This project will have 445,000 square feet of new construction, which will include 245 hotel rooms, 31,000 square feet of food service businesses, 151,000 square feet of other retail, and 115,000 square feet of office and other commercial activities. The development is estimated to add 1,029 workers for an increase of 26 percent in the local area.
Suburban retail locations are very auto-dependent, and this development is expected to generate 9,430 additional vehicle trips, which will be accommodated with the addition of 1,232 new parking spaces. No downward adjustment for mode-split or internal capture was published in the Secretary’s certificate.
The mitigation commitments primarily concern traffic flow and intersection safety issues. Numerous improvements to US Route 20 are required, including the construction of new sidewalks that previously did not exist. The main entrance to the center is a signalized intersection that also serves a shopping center on the other side of Route 20. A crosswalk has been added to this intersection allowing shoppers to patronize stores on both sides of Route 20 without having to move their car.
There is a system of trails, which the proponent has agreed to improve, that can be used to walk between the development site and nearby neighborhoods. Secure bicycle racks in prominent locations will be constructed. In addition, the Metro West Regional Transit Authority operates eight buses on Route 20 each direction on weekdays and five on Saturdays. The proponent agreed to add two sheltered bus stops within the development complex to support this service.
The proponent also agreed to initiate a number of TDM measures. A TDM coordinator will be appointed and the proponent will join the MetroWest/495 TMA. The proponent’s TDM efforts will be mostly to encourage the development’s commercial tenants to implement TDM measures for their employees and customers.
The EEA Secretary issued a certificate dated June 30, 2006, for an NPC that substantially describes the proposed development and the associated mitigation.
This project will have more than 1.2 million square feet of new construction that will include more than 800,000 square feet of retail and food service space, 180,000 square feet of office space, a 16-screen multiplex theater, and a 200-room hotel. This development is expected to add 3,387 workers, increasing jobs in the local area by 177 percent. On an average weekday, a total of 41,690 auto trips will be generated. No downward adjustment for mode-split or internal capture was published in the Secretary’s certificate.
An earlier proposal for Patriot Place, submitted in 2000, was about half as large as the proposal discussed here. The transportation infrastructure built to accommodate a sold-out event at Gillette Stadium was deemed adequate for the needs of the earlier Patriot Place plan.
The game day infrastructure is still adequate in most respects for the larger Patriot Place proposal. However, the expanded development and its added weekday traffic required some reconfiguration of parking and increased use of parts of the traffic access system. Consequently, MassDOT recommended and the proponent agreed to make modifications to nearby roadways and the TDM program. A pair of pedestrian underpasses under US Route 1 were mentioned in the 2006 certificate but have not been built.
The EEA Secretary issued a certificate dated April 17, 2009, for an NPC that substantially describes the proposed development and the associated mitigation. This project will be on the west side of US Route 1 opposite the Patriot Place project described above. These two projects share the same MEPA file number. This project is still active in the MEPA process, but there has been no meaningful construction at the Patriot Place West site as of this writing.
This development will have more than 1,620,000 square feet of new construction that will include 790,000 square feet of general office space, 680,000 square feet of high-tech office space, and 150,000 square feet of retail space. This development is expected to add 5,400 workers, increasing jobs in the local area by 282 percent. On an average weekday a total of 15,432 auto trips would be generated. No downward adjustment for mode-split or internal capture was published in the Secretary’s certificate.
The infrastructure improvements and associated mitigation for the stadium and Patriot Place are generally sufficient to accommodate Patriot Place West. However, in cooperation with MassDOT the proponent has identified and committed to undertake a number of off-site improvements. These include reconstruction of two Route 1 intersections that will require land takings, and implementation of optimal signal timing plans for four additional Route 1 intersections. The proponent will also build a pedestrian bridge over Route 1.
The proponent also agreed to a number of TDM measures, several of which involve encouraging commercial tenants to adopt TDM practices for employees and customers. Several TDM proposals involve encouraging use of MBTA commuter rail services, including shuttle buses connecting with nearby commuter rail stations. The potential for commuter rail connectivity has generated some momentum of its own, and the existing game-day rail service at this location will be expanded to a full weekday commuter service on a pilot basis for one year starting in 2019. This is not, however, part of the MEPA mitigation requirements.
The sample developments were similar only in that they were all private, for-profit initiatives and they had generated some level of policy and planning interest among MPO members and staff. In other important respects, the projects varied in ways that directly relate to how mitigation might best be implemented and the positive results that might anticipated. Key points of differentiation included the following:
Based on the types of differences described above, the sample developments represent a mix of project types and mitigation situations. In reviewing the relevant Secretary’s certificates, however, it was possible to discern patterns and consistent areas of emphasis. Patterns in TDM requirements were clearly apparent, but these were discussed only as they bore special relevance to a particular development.
Infrastructure mitigation was of greater interest to this study. With the large differences in developments and development situations, applying a uniform infrastructure mitigation checklist to all projects is clearly not appropriate as it might possibly be with TDM requirements. Even then, review of the relevant certificates did suggest common areas of emphasis in how infrastructure mitigation is considered and mandated.
Geographically, transportation mitigation measures can be thought of as being within the interior of a development, at the edge of a development, or some distance from a development. Some observations based on the sample developments include the following:
Larger developments with commensurate larger transportation impacts will be expected to and often have a capability of undertaking more extensive mitigation efforts than smaller developments. At a large enough scale, mitigation initiatives become feasible, which would not be considered with smaller proposed developments.
The mitigation flexibility inherent in larger developments is illustrated by looking at the six largest sample developments as measured by total square feet:
The other 10 sample developments are smaller than these six and their mitigation programs tend to focus on TSM and TDM in the immediate vicinity of the development. Even without committing to major infrastructure outlays, the mitigation programs at a smaller development can be substantial. The KSTEP mitigation program in Cambridge is noteworthy not only for the developer’s initial $6,000,000 commitment, but also for the flexibility to use the available funds throughout the local area and to be able to introduce new or expand existing transit services.
Some developments appear to be fundamentally limited by their size. For instance, major improvements to interchange 22 on I-95 near the proposed Station at Riverside development are considered necessary to accommodate the proposed development. However, the estimated costs may make the development unviable financially.
The primary focus of transportation mitigation has been traditionally to manage and reduce the impacts of increased vehicle traffic. Taking full advantage of existing opportunities or creating new opportunities for users of a proposed development to use public transportation is a standard transportation mitigation strategy. The costs and potential benefits of mitigation efforts to increase transit use vary depending on travel demand patterns and the configuration of existing transit services and infrastructure.
Review of the sample developments clearly shows that regional mitigation practices recognize these constraints, and that transit infrastructure has been mandated in situations where viable opportunities to expand transit use are present. Requirements to fully or partially fund construction of new transit stations could be mitigation commitments of the Boston Landing and Assembly Row developments because the development sites were immediately adjacent active transit lines.
The new Assembly Orange Line stop offers Assembly Row travelers frequent service in the core area rapid transit service. In contrast, commuter rail service at Boston Landing is much less frequent and serves primarily the suburban location between Boston and Worcester. The commercial tenants at Boston Landing will attract workers from throughout the region, and it is unlikely that more than a small fraction of these workers will live someplace convenient to the Worcester Line and choose to use commuter rail.
However, as shown above, most rail passengers at Boston Landing live near the station and are traveling to a downtown location. Some of these users might have used their autos without the new rail station. They now use commuter rail even though they have no relationship with the developer or its tenants. This might be considered indirect mitigation, where a transit infrastructure improvement reduces some driving, though the reduction is in travel markets not directly related to the development itself.
Improvements to existing transit stations are routine mitigation requirements. Examples from the sample developments include the bus station expansion as part of the South Station air rights development and a new pedestrian connection to the Route 128 commuter rail station from the east side of the rail line being undertaken as part of the Westwood Station development.
Transportation mitigation programs have helped facilitate demographic and economic growth in an increasingly developed metropolitan region. This has gradually become more difficult as the demands placed on the regional transportation systems have grown faster than their capacity.
For large developments, required mitigation programs can make major demands upon project proponents to invest in improvements that expand and optimize transportation capacity in the vicinity of a proposed development. These always include roadway and streetscape improvements and, where appropriate, improved transit infrastructure. These investments lessen, but do not eliminate the transportation impacts of large developments. Furthermore, as traffic impacts are reduced by facilitating the use of public transportation, the increased demands on the public transportation system become an impact for which mitigation might be recommended, a topic discussed in the Core Capacity Constraints study.
The transportation impacts of large developments can be estimated with some reliability for the nearby road network and nearby parts of the transit system. Beyond this area of local impact, the flow of vehicles and transit riders diffuse into their respective transportation networks until reaching their various destinations. Even the largest development may not cause unacceptable congestion say, 10 miles away. But in combination with the diffused travel demand of other large projects, intersections and transit links far from these projects can be pushed to an unacceptable level of congestion.
Government responses to the gradual increase in regional traffic and the emergence of severe transit system bottlenecks has been funded primarily through user charges such as federal and state gasoline taxes, roadway tolls, and transit fares, supplemented by broad-based taxes, notably a dedicated portion of the state sales tax. Investment programs funded through these sources have not kept pace with the gradual growth in regional travel demand. The question naturally arises as to whether mitigation programs that are effective in addressing the local area impacts of developments might be augmented and redirected to help address stresses on transportation systems on a regional basis.
First, it is important to realize that investors and users of new developments will be paying into the currently existing user fee and tax structures. Mitigation as currently practiced requires up-front efforts outside of these user fee and tax structures to address specific issues in the vicinity of the proposed development. Significantly expanding mitigation expectations to address regional transportation issues would require legislation, as well as a fundamental reconsideration of how transportation is paid for.
Review of the sample developments in this study offers a useful context to help consider infrastructure funding issues. Several of the most far-reaching mitigation efforts were highlighted in the previous section. In one example, the Center 128 development commits to a number of specific designs and improvements at its project location, and then makes $4,255,000 available to the town of Needham to use for addressing any problem locations that appear as the project progresses. Similarly, the Kendall Square developer is supporting a number of TDM programs, but is also committing $6,000,000 to the innovative KSTEP program that envisions enhancing local area transit services.
Admittedly, the sample developments are not a complete list of large projects. But only a limited number of projects enter the regulatory pipeline each year. However, several infrastructure projects under active consideration in Massachusetts, both for expansion and reconstruction, have tentative price tags, which exceed these notable mitigation commitments by orders of magnitude. The reconstruction of the two I-93/I-95 interchanges in Woburn and Canton come to mind, as well as implementing any phase of South Coast Rail service. The availability and adequacy of user fees and broad-based taxes will in all likelihood determine the pace at which regional infrastructure can be rebuilt or expanded.
1 Transportation Impact Assessment Guidelines, MassDOT.
https://www.mass.gov/files/documents/2017/09/21/TIA_Guidelines_3_13_2014.pdf?_ga=2.225435866.1326611399.1540844243-1715000999.1448891393
2 Land Use Projections for the Expanded Boston Metropolitan Core 1990–2010, Massachusetts Highway Department, December 1992.
3 Institute of Transportation Engineers, Trip Generation, 9th edition, 2012.
4 Core Capacity Constraints: Accommodating Growth on Greater Boston’s Congested Roads and Crowded Transit System, Boston Region MPO, August 2016.