Route 9 Corridor Study in Brookline
Project Manager
Chen-Yuan Wang
Project Principal
Mark Abbott
Data Analysts
Chen-Yuan Wang
Benjamin Erban
Graphics
Kenneth Dumas
Kate Parker-O'Toole
Kim DeLauri
Cover Design
Jane Gillis
The preparation of this document was supported
by the Federal Highway Administration through
MPO Planning Contract #105757 and MPO §5303 Contract #102694 and #106374.
Central Transportation Planning Staff
Directed by the Boston Region Metropolitan
Planning Organization. The MPO is composed of
state and regional agencies and authorities, and
local governments.
January 2020
To request additional copies of this document or copies in an accessible format, contact
Central Transportation Planning Staff
State Transportation Building
Ten Park Plaza, Suite 2150
Boston, Massachusetts 02116
(857) 702-3700
(617) 570-9192 (fax)
(617) 570-9193 (TTY)
ctps@ctps.org
ctps.org
Abstract
The Route 9 Corridor Study in Brookline is one in a series of studies supported by the Boston Region Metropolitan Planning Organization that address safety, mobility, and access on the Boston region’s roadways. This report identifies specific transportation issues and concerns in the Route 9 corridor in Brookline, Massachusetts; presents an in-depth analysis of multiple transportation-related factors, such as bicycle accommodation and safety at pedestrian crossings; proposes short- and long-term improvements to address the problems; and provides a vision for the corridor’s long-term development.
1.4...... Study Area and Data Collection........................................................ 13
1.5...... Study Advisory Committee Meetings.................................................. 13
Chapter 2—Existing Conditions and Issues................................................... 15
2.4.1 Pedestrian Accommodation and Safety................................... 17
2.4.2 Bicycle Accommodation and Safety........................................ 18
2.4.3 Transit Access and Safety.................................................... 18
2.4.4 Traffic Congestion and Safety............................................... 19
2.4.5 On-Street Parking Issues...................................................... 19
2.4.6 Emergency Response and Operations.................................... 20
2.4.7 Potential Future Developments.............................................. 20
Chapter 3—Roadway Operations Analysis..................................................... 21
3.2...... Intersection Traffic, Pedestrian, and Bicycle Volumes............................ 21
3.2.1 Intersection Traffic and Pedestrian Volumes............................. 22
3.2.2 Pedestrian Crossings on Route 9........................................... 23
3.2.3 On-Road Bicycle Volumes.................................................... 23
3.2.4 Heavy Vehicle Volumes....................................................... 23
3.3...... Intersection Capacity Analyses......................................................... 24
3.4...... Roadway Travel Speeds.................................................................. 25
3.5...... On-Street Parking Inventory and Analysis........................................... 26
Chapter 4— Crash Data Analysis.................................................................. 29
4.1...... Crash Locations and Crash Clusters.................................................. 29
4.2...... Corridor and Intersection Crash Rates................................................ 30
4.4...... Pedestrian and Bicycle Crashes........................................................ 31
4.5...... Highway Safety Manual Methodology: Expected Crashes...................... 33
Chapter 5—Proposed Improvements............................................................. 37
5.1...... Corridor Accommodation Analysis and Proposed Improvement Alternatives 37
5.1.1 Corridor Accommodation Objectives and Design Strategies......... 37
5.1.2 Separated Bike Lane Design Options...................................... 38
5.1.3 Corridor Improvement Alternatives......................................... 40
5.2...... Route 9 from Washington Street To Sumner Road................................ 42
5.2.1 Issues and Concerns........................................................... 43
5.2.2 Proposed Short-Term Improvements...................................... 44
5.2.3 Proposed Long-Term Improvements....................................... 45
5.3...... Route 9 from Sumner Road to Chestnut Hill Avenue............................. 46
5.3.1 Issues and Concerns........................................................... 47
5.3.2 Proposed Short-Term Improvements...................................... 48
5.3.3 Proposed Long-Term Improvements....................................... 48
5.4...... Route 9 from Chestnut Hill Avenue to Reservoir Road........................... 49
5.4.1 Issues and Concerns........................................................... 50
5.4.2 Proposed Short-Term Improvements...................................... 51
5.4.3 Proposed Long-Term Improvements....................................... 51
5.5...... Route 9 from Reservoir Road to Hammond Street................................ 52
5.5.1 Issues and Concerns........................................................... 52
5.5.2 Proposed Short-Term Improvements...................................... 53
5.5.3 Proposed Long-Term Improvements....................................... 54
5.6...... Route 9 from Hammond Street to Newton City Line............................... 55
5.6.1 Issues and Concerns........................................................... 55
5.6.2 Proposed Short-Term Improvements...................................... 57
5.6.3 Proposed Long-Term Improvements....................................... 57
5.7...... Overview of Proposed Long-Term Improvements Under Projected 2030 Traffic Conditions 59
Chapter 6— Summary and Recommendations............................................... 61
TABLES
Table 1 Potential for Safety Improvement
Table 2 Comprehensive Costs of Crashes
Table 3 Feasibility Analysis of Separated Bike Lane Design Options
Table 4 Proposed Components in Corridor Improvement Alternatives
FIGURES
Figure 2 Transit Services and Pedestrian and Bicycle Facilities
Figure 3 Daily Traffic Volumes
Figure 4 Weekday AM Peak Hour Traffic and Pedestrian Volumes at Major Intersections
Figure 5 Weekday PM Peak Hour Traffic and Pedestrian Volumes at Major Intersections
Figure 6 Saturday Peak Hour Traffic and Pedestrian Volumes at Major Intersections
Figure 7 Pedestrian Crossings during Peak Traffic Periods
Figure 8 On-Road Bicycle Volumes during Peak Traffic Periods
Figure 9 Heavy Vehicle Percentage during Peak Traffic Periods
Figure 10 Weekday AM Peak Hour Intersection Capacity Analyses
Figure 11 Weekday PM Peak Hour Intersection Capacity Analyses
Figure 12 Saturday Peak Hour Intersection Capacity Analyses
Figure 13 Speed Regulations and Estimated 85th Percentile Speeds
Figure 14 Crash Locations and Crash Clusters (MassDOT Crash Data 2013-15)
Figure 15 Separated Bike Lane Design Options
Figure 23 Proposed Long-Term Improvements Conceptual Plan: Route 9 from Cypress Street to Clark Road
Figure 25 Proposed Long-Term Improvements Conceptual Plan: Route 9 in the Vicinity of Reservoir Road
Each year, the Boston Region Metropolitan Planning Organization (MPO) conducts outreach to local agencies, municipalities, the public, and other stakeholders during the development of the Unified Planning Work Program, a program of studies and research projects that provide transportation planning and technical assistance to municipalities and agencies in the Boston region. The purpose of this outreach is to gather information about specific transportation problems in the region so that the issues may be studied and projects developed to address those issues and improve the operation of the transportation system as a whole.
The MPO’s series of Subregional Priority Roadways studies grew out of this information-gathering process. These studies identify safety, mobility, access, and other transportation-related concerns on specific roadways identified by subregional planning groups as requiring improvements. The studies evaluate potential multimodal solutions to the problems and then make recommendations for agencies and municipalities to implement. Each year, the Boston Region MPO chooses an arterial or collector roadway for the MPO staff to analyze, which results in recommendations for short- and long-term improvements for that roadway area.
Selecting a study area in the Boston region is a thorough and exacting process, based upon many factors (described in the report). In any large metropolitan region, there are many roadways that need improvement, so it can be a challenge to single out just one. However, because the MPO’s Subregional Priority Roadways program is ongoing, the MPO staff can address each problem area methodically according to priority and regional needs.
This report focuses on Route 9 in Brookline, Massachusetts. It contains review of existing conditions, various safety and operations analyses, safety and operational problems, and proposed short- and long-term improvements to address the problems in the study corridor.
Key issues and concerns identified for the corridor include the following:
The proposed short-term improvements, such as signage and pavement marking improvements at specific locations in the corridor, generally can be implemented within two years with a high benefit-to-cost ratio. The MPO staff recommends considering and implementing the improvements as soon as resources are available from highway maintenance or Chapter 90 funding.
Significantly improving the safety, mobility, and access for all users of the roadway would require a series of long-term improvements. Major long-term improvements proposed for the corridor and their expected benefits are summarized as follows:
This report provides a detailed review and recommendations for improvements that address the transportation issues in the Route 9 corridor in Brookline. By addressing these problems systematically through the Subregional Priority Roadways program, the resulting improvements will help to enhance quality of life, support economic development, and improve air quality throughout the region.
During development of the Unified Planning Work Program (UPWP) and the Long-Range Transportation Plan (LRTP), the Boston Region Metropolitan Planning Organization (MPO) gathers feedback from the public, municipalities, the Metropolitan Area Planning Council’s (MAPC) subregional groups, and the Massachusetts Department of Transportation (MassDOT) to identify transportation problems in the region. These problems generally involve bicycle and pedestrian accommodation, freight movement, traffic bottlenecks, safety of roadway users, and safe or convenient access for abutters along roadway corridors—problems that can adversely affect the region’s quality of life, economic development, and air quality.
Each year, the MPO conducts a study—Addressing Safety, Mobility, and Access on Subregional Priority Roadways—to identify roadway segments in the Boston region that are of concern to stakeholders, but which have not been cited in the regional needs assessment conducted for the LRTP.1 The Subregional Priority Roadways studies focus on arterial or collector roadways and result in recommendations for short- and long-term improvements. Funding for the Route 9 Corridor Study in Brookline was documented in the federal fiscal year (FFY) 2019 UPWP; and a work program outlining the study was approved by the MPO board on September 20, 2018.2
The Route 9 Corridor Study in Brookline focused on safety, mobility, and access, as well as specific concerns related to bicycle and pedestrian transportation, multi-use trail feasibility, and other subjects raised by stakeholders. The objectives of the study were as follows:
The MPO selected Route 9 in Brookline by assessing 24 roadway corridors in the Boston region that were identified as strong potential candidates for study by various sources, including 1) suggestions heard during outreach for the FFY 2019 UPWP; 2) concerns documented in meeting records from the UPWP outreach process for the past five years; and 3) data from the MPO’s Congestion Management Process (CMP). MPO staff assembled detailed data about these roadways and evaluated them according to the following selection criteria:
Route 9 in Brookline has a much higher pedestrian and bicycle crash rate than most other locations considered as study candidates. Route 9 carries regional and local traffic, pedestrians, bicycles, and Massachusetts Bay Transportation Authority (MBTA) bus Routes 51 and 60. In addition to residential areas, the corridor contains major commercial districts, such as Route 9 East and The Street at Chestnut Hill, and a popular town park, Brookline Reservoir Park.
The Town of Brookline is currently planning to enhance the vibrancy, design, and livability of the Route 9 corridor through land-use changes and capital improvements. This study supports the Town’s goals by analyzing existing transportation conditions and identifying potential improvements to make the corridor safer and enhance mobility. The study was strongly endorsed by all stakeholders, including the Town of Brookline and MassDOT.
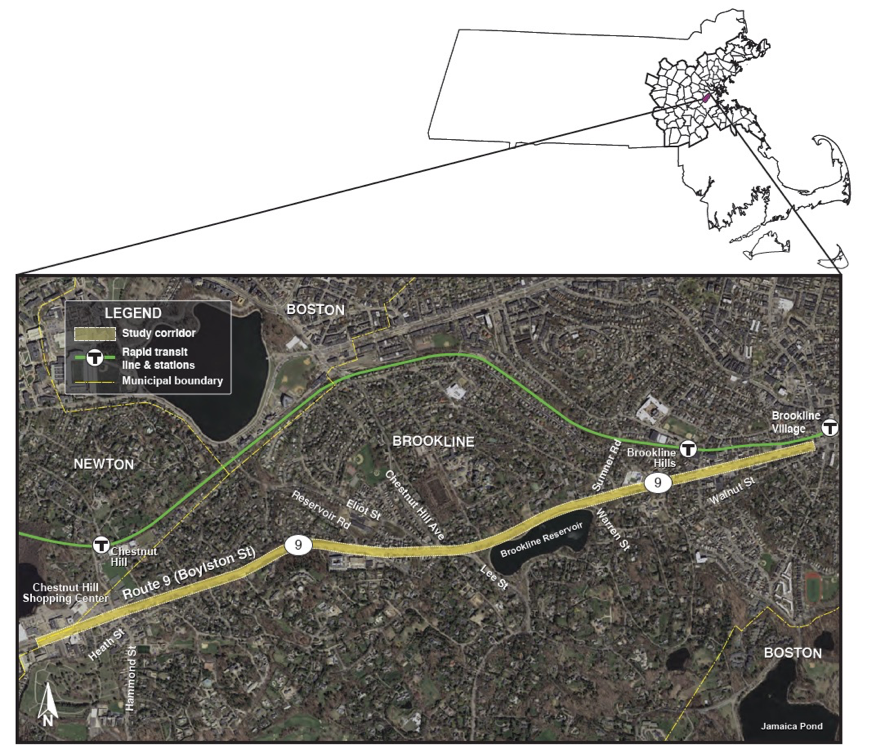
The study corridor is approximately 2.8 miles long, beginning west of Washington Street in Brookline and extending to the Newton city line. The study area covers Route 9 (Boylston Street) and its adjacent areas and connected roadways. Major cross streets in the corridor include Cypress Street, Sumner Road, Warren Street, Lee Street, Chestnut Hill Avenue, Reservoir Road, and Hammond Street. Figure 1 shows the study corridor and major roadways and transit lines in the study area.
At the request of MPO staff, MassDOT collected traffic volume data and intersection turning-movement counts (including pedestrian and bicycle movements and the percentage of heavy vehicles) for this study. The data was collected in the fall of 2018, between November 28 and December 5, on both weekend and weekdays. MPO staff also collected information from the Town of Brookline and MassDOT, including recent transportation, city planning, land use, and economic studies, and the most recent police crash reports (for a five-year period).
During the course of the study, MPO staff worked closely with an advisory committee comprised of members who included representatives of the Town of Brookline and MassDOT. (See Appendix A for a complete list of advisory committee members.)
Three advisory committee meetings were held to guide and support the study. In the first meeting (November 6, 2018), MPO staff introduced the study, received input about the corridor’s issues and concerns, and coordinated data collection. In the second meeting (February 14, 2019), staff presented the existing condition analyses and discussed ideas for potential improvements with the advisory committee members. In the final meeting (June 6, 2019), MPO staff reviewed the proposed short- and long-term improvements with advisory committee members. After the meetings, staff received comments and revised the proposed improvements accordingly.
Chapter 2—Existing Conditions and Issues
Route 9 is one of the major east–west routes in Massachusetts, along with US Route 20, Route 2, and Interstate 90 (I-90). Route 9 starts at Copley Square in Boston, runs through Brookline and Newton, passes Route 128/Interstate 95 into the MetroWest suburbs, continues past Worcester to the Berkshire region, and ends near the city center of Pittsfield, a few miles from the New York state line.
In the Boston region, Route 9 is an alternate route to I-90, a toll road that is usually congested during peak commuting hours. Route 9 operates as a limited access highway in the MetroWest suburbs and provides entry to commercial developments adjacent to the roadway, whereas it serves mainly as a regional arterial in Newton, Brookline, and Boston where it connects to other major roadways through mostly at-grade intersections.
The section of Route 9 that is the focus of this study, from Washington Street to the Newton city line, is classified as an urban principal arterial. The entire section is under the jurisdiction of MassDOT Highway Division District 6. The corridor includes seven major signalized intersections, four signalized pedestrian crossings (three equipped with regular traffic signals and one with rectangular rapid-flashing beacons), and a number of unsignalized intersections and driveways.
Throughout the length of the corridor, there are two 12-foot travel lanes in the eastbound and westbound direction and traffic flow is separated by a median of variable width. The average daily traffic volumes range from nearly 30,000 vehicles per day (near Washington Street) to more than 42,000 vehicles per day (near the Newton city line), and most sections carry approximately 40,000 vehicles per day.
Adjacent to the corridor are residential homes, some commercial developments (Route 9 East and The Street at Chestnut Hill), local businesses and medical offices (near Reservoir Road), schools (the Lincoln School [public, kindergarten–8th grade] and Maimonides School [private, early childhood–12th grade]), a church (Saint Lawrence Church), and parks (Brookline Reservoir Park and Boylston Street Park).
Figure 2 shows transit services in the study area. The MBTA’s rapid transit Green Line D Branch runs parallel on the north side of Route 9. The D Branch runs between Government Center Station in Boston and Riverside Station in Newton. There are five well-utilized stations in the study area: Brookline Village, Brookline Hills, Beaconsfield, Reservoir, and Chestnut Hill.
MBTA bus Route 60 (Kenmore Square—Mall at Chestnut Hill) runs on Route 9 from Cypress Street to the Newton city line and makes a number stops in the study corridor. MBTA bus Route 51 (Reservoir Station—Forest Hills Station) runs on a short section of the study corridor between Lee Street and Chestnut Hill Avenue and makes stops near Route 9. Both bus routes have headways of about 30 minutes during the morning and evening commuting periods.
In addition, Partners HealthCare’s medical service shuttle, Route 3 (Brigham and Women’s Hospital in Boston—Mall at Chestnut Hill in Newton), runs through the study corridor and has a major stop at Brigham and Women’s Health Care Center (850 Boylston Street). It also has a stop at Clark Road (outbound) and Kennard Road (inbound) for patrons going to medical offices near the Brookline Hills stop on the Green Line.
Figure 2 also shows the location of pedestrian and bicycle facilities on Route 9 and in the surrounding study area. Sidewalks exist on both sides of Route 9, except on the south side from Lee Street to Warren Street adjacent to Brookline Reservoir Park. There is a multi-use trail surrounding the reservoir and its northern section runs parallel to Route 9. It is used as an alternative path to the missing sidewalk on the south side of Route 9.
There are no dedicated bike lanes in the entire corridor. Wide shoulders (approximately six feet or more in width) exist on both sides of the corridor between Sumner Road and Lee Street and between Reservoir Road and Dunster Road. These shoulders are next to travel lanes with high speed traffic and are not continuous along the corridor. Therefore, they are not suitable to be designated as bike lanes.
Brookline is a vibrant bicycling community. The Town has developed a bicycle network plan and designated a number of roadways adjacent to Route 9 as bike routes, including Cypress Street, Sumner Road/Warren Street, Heath Street, Lee Street/Chestnut Hill Avenue, and Hammond Street.4 (See Figure 2.) Route 9 itself is not a designated bicycle route because it lacks suitable accommodation measures and there are safety concerns because of heavy volume and high-speed traffic conditions.
In the sections that follow, we categorize and summarize the numerous issues and concerns in the study area, which are based on discussions with the advisory committee members.
Advisory committee members from the Town of Brookline raised a number of pedestrian accommodation issues and safety concerns:
The following are bicycle accommodation issues and safety concerns raised by the advisory committee members representing the Town of Brookline.
Advisory committee members raised the following concerns about transit access and safety:
Advisory committee members raised the following concerns about safety and traffic congestion, which affects motorists as well as other users of the corridor:
Advisory committee members raised the following concerns about parking:
Advisory committee members raised the following concerns about emergency response and operations:
The following are potential developments along the study corridor:
The above are issues and concerns raised by the advisory committee members about the corridor in general. Issues and concerns about specific locations in the corridor, where analyses identified safety and operational problems, and the proposed improvements are summarized by location in Chapter 5.
Chapter 3—Roadway Operations Analysis
Daily traffic volumes are the fundamental data for analyzing traffic intensity and patterns in a roadway corridor. MassDOT conducted automatic traffic recorder (ATR) counts at a number of locations in the Route 9 corridor and on adjacent streets during the period from November 28 (Wednesday) to December 5 (Wednesday), 2018.
Figure 3 shows daily traffic volumes at these locations. The numbers in the graphic represent average daily directional volumes collected during the period. The two tables in the graphic further summarize the data by count locations, directional split, combined volume of both directions, and adjusted annual average daily traffic (AADT).
In general, the corridor carries an average daily traffic volume of about 40,000 vehicles per day, ranging from nearly 30,000 (near Washington Street) to more than 42,000 (near the Newton city line). These counts show that traffic volumes gradually decrease along Route 9 in the eastbound direction toward Boston and gradually increase in the westbound direction away from Boston because of traffic diverging and converging around major cross streets such as Hammond Street, Chestnut Hill Avenue, Lee Street, Sumner Road, Warren Street, and Cypress Street.
Traffic volumes in late November and early December were slightly higher than the annual average. Adjusted for the seasonal factors, the corridor still carries about 40,000 vehicles per day at most locations.
In addition to daily traffic counts, MassDOT collected turning-movement counts at major intersections in the study corridor, including vehicle movements (by vehicle types), bicycle movements, and pedestrian crossings. These counts were collected during the morning peak period (7:00 AM–10:00 AM) and the extended evening peak period (2:00 PM–7:00 PM) on Thursday, November 29, 2018, and during the midday peak period (10:00 AM–2:00 PM) on Saturday, December 1, 2018.
Based on these data, MPO staff identified the peak hour in each of the peak periods for various traffic operational analyses and analyzed the pedestrian, bicycle, and heavy vehicle activities in the corridor.
Figure 4 shows the weekday AM peak hour (7:15 AM–8:15 AM) traffic and pedestrian volumes at major intersections in the corridor.7 In general, major intersections on Route 9 carried about 3,000 to 4,300 vehicles during the AM peak hour. The intersections of Route 9 at Hammond Street, at Chestnut Hill Avenue, and at Lee Street were identified as the locations with the most traffic. All three intersections had high volumes of vehicles making left turns to and from Route 9. The intersection of Route 9 at Cypress Street carried nearly 3,000 vehicles per AM peak hour and a high volume of left-turning vehicles traveling from Route 9 eastbound to Cypress Street northbound.
Also shown in the figure are pedestrian crossing counts at the major intersections. Almost 200 pedestrians crossed the intersection of Route 9 and Cypress Street during the AM peak hour. And approximately 80 pedestrians crossed the intersection of Route 9 and Hammond Street during the AM peak hour.
Figure 5 shows the weekday PM peak hour (5:00 PM–6:00 PM) traffic and pedestrian volumes at major intersections in the corridor. In general, major intersections on Route 9 carried about 3,000 to 4,000 vehicles during the PM peak hour. The intersections of Route 9 at Hammond Street, at Chestnut Hill Avenue, and at Lee Street each carried nearly 4,000 vehicles per hour. The intersections of Route 9 at Cypress Street and at Reservoir Road each carried 3,000 vehicles per hour. Similar to the AM peak hour, the intersections of Route 9 at Hammond Street, at Chestnut Hill Avenue, at Lee Street, and at Cypress Street all had high volumes of vehicles making left turns to and from Route 9.
At the intersection of Route 9 and Cypress Street, there were almost 150 pedestrian crossings during the PM peak hour. The intersection of Route 9 and Hammond Street had approximately 80 pedestrians crossing in the PM peak hour.
Figure 6 shows the Saturday peak hour (12:15 PM–1:15 PM) traffic and pedestrian volumes at the major intersections. In general, traffic patterns during the Saturday peak hour were similar to those of the weekday PM peak hour, yet traffic volumes at major intersections were approximately 10 to 15 percent lower than during the PM peak hour. The busiest location was the intersection of Route 9 at Hammond Street, adjacent to The Street at Chestnut Hill shopping area.
The MPO staff used available turning-movement counts to estimate pedestrian crossings in the corridor. Figure 7 shows the numbers of pedestrian crossings at major intersections and crossing locations on Route 9 during the weekday AM, PM, and Saturday midday peak periods. Staff further generalized the peak period counts into hourly pedestrian crossings in four ranges: 0–5, 6–10, 11–50, and more than 50 crossings per hour.
In the highest range, the intersection of Route 9 at Cypress Street had approximately 100 or more pedestrian crossings per hour. In addition, there were a significant number of pedestrian crossings at the intersections of Route 9 at Hammond Street, at Sumner Road and Warren Street, and at Reservoir Road. At the crossing location of Route 9 at Clark Road and Kennard Road, where no crosswalks exist, there were about 6 to 10 pedestrians crossing Route 9 per peak hour. Note that these counts were taken in the late fall and pedestrian crossings in this area generally are higher in warmer months.
The turning-movement counts also provided a snapshot of bicycle activities in the corridor. Figure 8 summarizes the observed on-road bicycle volumes during the weekday AM, weekday PM, and Saturday peak periods. On the count days (November 29 and December 1, 2018), Route 9 generally carried insignificant numbers of bicycles between the Newton city line and Chestnut Hill Avenue, while there were noticeable numbers of bicycles traveling on Route 9 between Chestnut Hill Avenue and Washington Street. The estimate shows that besides Route 9, the primary routes of bicycle travel in the area are Cypress Street, Lee Street, Chestnut Hill Avenue, and Hammond Street. Cypress Street carried the highest number of bicycles during all three-peak periods.
It is essential to examine the amount of truck and bus traffic in a study corridor, as an unusually high percentage of these heavy vehicles may seriously affect roadway operations.8 Figure 9 shows the percentages of heavy vehicle traffic at various locations in the corridor during the weekday AM, weekday PM, and Saturday peak periods.
The percentage of heavy vehicles among the traffic in the AM peak period was higher than other peak periods and at most locations the percentage of heavy vehicles traveling in the off-peak direction was greater than those traveling in the peak direction. On average, heavy vehicles in the corridor accounted for approximately four to six percent of the traffic during the AM peak period, and approximately two to three percent in the PM and Saturday peak periods. These numbers are regarded as normal for an urban principal arterial.
The percentage of heavy vehicle traffic by direction of approach to the major intersections was calculated in the intersection capacity analyses and the traffic simulation models used for this study. The capacity analyses detailed in the following sections indicate that the existing volumes of heavy vehicles do not seriously affect traffic operations at the intersections studied.
Based on the turning-movement counts, MPO staff constructed peak hour traffic models for the entire corridor and conducted capacity analyses for major intersections using Synchro, a traffic analysis and simulation program.9 The model set consisted of weekday AM, weekday PM, and Saturday midday peak hour models, and scenarios that assumed existing conditions and proposed improvement alternatives were tested.
Figure 10 shows the results of weekday AM peak hour capacity analyses for the existing conditions (as of 2019) at major intersections in the corridor and the level of service (LOS) each intersection provides. The LOS was determined based on criteria from the Highway Capacity Manual (HCM).10 The HCM defines LOS—using a qualitative scale from A to F—for signalized and unsignalized intersections as a function of the average vehicle control delay.11 For the intersections in a metropolitan urban area, LOS A, B, and C are considered desirable; LOS D and E are considered acceptable; and LOS F is considered undesirable.
Heavy traffic conditions in the AM peak hour caused the signalized intersections of Route 9 at Cypress Street, at Sumner Road/Warren Street, and at Hammond Street to operate at LOS F with an estimated average delay of one and a half minutes to more than two minutes. The signalized intersections of Route 9 at Lee Street and Chestnut Hill Avenue operated at LOS E with an estimated average delay of about one minute.
Figure 11 shows the results of weekday PM peak hour capacity analyses and estimated LOS for the existing conditions at major intersections in the corridor. Because traffic volumes were slightly less as compared to the AM peak hour and there were fewer vehicles making left turns from Route 9, major intersections in the corridor generally operated at the same or better LOS in the PM peak hour. The signalized intersections of Route 9 at Sumner Road/Warren Street and at Hammond Street operated at LOS F with an estimated average delay of one and half to almost two minutes. The signalized intersections of Route 9 at Cypress Street and at Chestnut Hill Avenue operated at LOS E with an estimated average delay of about one minute.
Figure 12 shows Saturday peak hour capacity analyses and estimated LOS for the existing conditions at major intersections in the corridor. All the major intersections operated at an acceptable LOS or better, except the intersection of Route 9 at Hammond Street, which operated at LOS F with an estimated average delay of one and half minutes.
Details of Synchro capacity analysis reports for the major intersections in the AM, PM, and Saturday peak hour are included in Appendices B, C, and D.
One of the concerns raised by the Town of Brookline is the generally high travel speeds in the corridor. In order to examine the prevailing travel speeds versus regulated speeds, MPO staff asked MassDOT to help collect spot-speed data during the period when automatic traffic counts were being conducted, from November 28 to December 5, 2018.
Figure 13 shows the existing speed regulations and estimated 85th percentile speed at selected locations in the corridor, based on spot-speed counts collected from automatic traffic recorders. The 85th percentile speed is the speed at or below which 85 percent of vehicles passing a given point are traveling, and it is the principal value used to establish speed controls by MassDOT.
Three speed regulations are in effect in the study corridor:
These regulations apply to both directions of Route 9, except in the section adjacent to the Brookline Reservoir. In the section of Route 9 between Sumner Road/Warren Street and Lee Street, the speed limit for the westbound vehicles is 35 mph while the speed limit for the eastbound vehicles is 45 mph.
The spot-speed studies show that estimated 85th percentile speeds in the section adjacent to the Brookline Reservoir are approximately 40 mph in the westbound direction and nearly 50 mph in the eastbound direction. The other sections in the corridor generally have an estimated 85th percentile speed of less than five mph higher than the regulated speed limit, except the section between Reservoir Road and Norfolk Road, where the estimated 85th percentile speed is 10 mph or more higher than the regulated speed limit in both directions.
While the prevailing speeds in the corridor may appear high, the estimated speeds at the locations of the spot-speed study indicate that the speeds are all within the acceptable range, except on the wide section between Reservoir Road and Norfolk Road.12 The proposed long-term improvements described in this report and the addition of separated bike lanes would significantly reduce travel speeds on this section of Route 9. The project design could plan for a 35 mph speed limit. In the near term, if any speed regulation is to be changed in the corridor, an engineering study, based on speed data collected from radar or laser guns, would have to be undertaken.13
Per request of the advisory committee, staff conducted an on-street parking inventory for the corridor based on site reconnaissance and a review of Google street views. The inventory data include all the curbside regulatory signage related to on-street parking and estimated parking spaces in the various sections of the corridor. Appendix E contains two figures that summarize the observed parking signage and estimated parking spaces in the corridor.
An estimated 186 parking spaces exist in the corridor. These include 125 spaces designated for daytime only parking with a two-hour limit, 59 spaces in unregulated areas where parking was observed, and two spaces for short-term parking with a 15-minute limit (valet parking for Homewood Suites).14 The two-hour parking spaces are located in the commercial districts between Washington Street and Cypress Street, on the north side between Chestnut Hill Avenue and Reservoir Road, and on the south side between Hammond Street and the Newton city line. The parking spaces in unregulated areas are on the north side between Cypress Street and Sumner Road and on the south side between Hammond Street and Dunster Road.
These inventory data and on-site observations indicate that the parking signage in the corridor is inconsistent and sometimes confusing. For example, there are three types of parking prohibition signage: State Highway Parking Prohibited, No Parking Anytime, and No Parking 1 AM–6 AM/Tow Zone.15 Meanwhile, as shown in Figures E-1 and E-2 in Appendix E, the placement of these no-parking signs is uneven and random. Further review of parking necessities and provision for consistent signage for the corridor should be a major component in the corridor’s long-term improvement plan.
Chapter 4— Crash Data Analysis
Crash data are an essential resource for identifying safety and operational problems in a study area. Analyzing data on the number of crashes and types of collisions that occur at particular locations, and the circumstances under which crashes occur, such as the time of day and roadway surface conditions, also helps to develop improvement strategies. For this study, MPO staff accessed two datasets:
MassDOT data were used to examine crash locations and identify high-crash locations. Police crash reports were used to construct collision diagrams and estimate crash rates for identifying safety and operational problems at the major intersections and in different sections of the corridor.
Figure 14 shows the crash locations and crash clusters in the corridor, based on the MassDOT data.16 In general, crashes occurred at various locations in the corridor during the three-year period. The most significant cluster in the corridor was at the intersection Route 9 and Tully Street, where 18 crashes occurred in the three-year period. The value of the crash severity for this location, as estimated using the Equivalent Property Damage Only (EPDO) scale, is 46.17
A project addressing the intersection Route 9 and Tully Street would be eligible to receive funding through MassDOT’s Highway Safety Improvement Program (HSIP) because the location is ranked in the top five percent of crash locations in the Boston Region MPO’s planning area, based on 2012–14 MassDOT crash cluster data. However, further review of the individual crash information indicated that a number of crashes in the cluster actually occurred on the carriage road on the north side of Route 9 in The Street at Chestnut Hill shopping area.
The three-year MassDOT data show that four other crash clusters in the corridor had noticeable EPDO values greater than 20:
Figure 14 also shows that six pedestrian crashes and two bicycle crashes occurred in the study corridor from 2013 to 2015.18
MPO staff estimated that the entire 2.8-mile corridor has a crash rate of 1.31 crashes per million vehicle-miles traveled (MVMT), based on Brookline Police crash reports from 2013–18 and an average of the recently collected traffic counts. This crash rate is lower than the statewide average for principal urban arterials, which is 3.49 crashes per MVMT (updated January 2018, based on 2016 crash data).
Staff also calculated the crash rates at major intersections in the corridor, based on the Brookline Police crash data and the intersection traffic counts. The crash rates for the signalized intersections are as follows:
The average crash rate for signalized intersections in MassDOT District 6 is 0.71 crashes per MEV (updated 2018, based on 2016 crash data). All the signalized intersections listed above have a crash rate lower than the district average.
Among the unsignalized intersections, Route 9 at Dunster Road is estimated to have the highest crash rate of 0.38 crashes per MEV. This rate is lower than the average crash rate for unsignalized intersections in MassDOT District 6, which is 0.52 crashes per MEV.
Appendix F contains worksheets showing the crash rate calculations for the major intersections in the corridor.
To investigate safety and operational problems further, MPO staff constructed collision diagrams for the entire corridor—for major intersections and roadway segments between those intersections—based on Brookline Police crash reports for the five-year period. The crash reports, containing descriptions of how and where those crashes occurred, are useful when constructing collision diagrams.
Appendix G presents the collision diagrams for nine continuous sections in the corridor. It also contains nine tables that list all the crashes in each of the collision diagrams. The information about each crash includes crash date and time, number of involved vehicles, number of injured persons, severity (property damage only, non-fatal injury, fatality, incapacitating injury, or possible injury), manner of collision type (rear-end, angle, sideswipe, head-on, single vehicle, rear-to-rear, or unknown), road surface conditions, weather conditions, most harmful event, and driver contributing code.
The collision diagrams are useful for identifying safety and operational problems at major intersections or roadway segments in the corridor. The identified problems at intersections or specific roadway sections are discussed in the context of proposed improvements in Chapter 5.
Based on the police data from 2013-18 and the collision diagrams, six pedestrian crashes were identified in the corridor. The locations, dates, times, and conditions of these crashes are summarized below:
During the same five-year period, there were six bicycle crashes in the corridor. The locations, dates, times, and conditions of these crashes are summarized below:
MPO staff used methods described in the 2010 edition of the Highway Safety Manual (HSM) to analyze safety in the corridor. These techniques combine information about roadway geometry, traffic volumes, crash history, and regional factors into a unified metric—expected crashes—that estimates the intrinsic safety conditions at a site by compensating for the random fluctuations typically associated with samples of collision data.
Expected crashes may be estimated in several ways, including by manner of collision and degree of injury, and those values may be converted into dollar values based on agreed-upon societal cost figures for different types of crashes. This information may be used to identify high-risk sites with potential for improvement and to compare the relative merits of different intervention strategies.19
The HSM methodology had previously been the subject of a research study by MassDOT in cooperation with faculty from the University of Massachusetts Lowell. That study refined the formulas and coefficients of the HSM methodology for intersections to match Massachusetts’ traffic data better. MPO staff used these regionalized versions of the HSM methods for its analysis of intersections.20
Figure H-1 in Appendix H summarizes the results of the safety analysis of the existing conditions. The HSM procedure analyzes segments and intersections within the corridor and distinct methods are applied for segments and intersections. Staff thus divided the corridor into eight intersections and seven segments. As shown in Figure H-1, for each intersection and each segment, the number of expected crashes during a five-year period is shown along with number of crashes that MassDOT recorded between 2011 and 2015. This comparison provides insight into the responsiveness of a particular location to safety interventions. If the predicted number of crashes (crashes per year under idealized circumstances) is significantly less than the expected number of crashes, it suggests that correctable factors are elevating the crash rate. The difference between predicted and actual crash numbers is referred to as the Potential for Safety Improvement (PSI).
Figure H-1 shows the PSI level for each location, while Table 1 shows the numerical values of the PSI for the different intersections and segments within the corridor. Table 1 also indicates whether the site is designated as high risk, based on a statistical comparison with other Massachusetts intersections developed as part of the research conducted by MassDOT and the University of Massachusetts. Five of 15 sites showed potential for improvement (having a PSI greater than zero), although none of the intersections qualified as high-risk.
Table 1
Potential for Safety Improvement
| Predicted Crashes |
Expected Crashes |
Potential for Safety Improvement |
High-Risk Site |
|
|---|---|---|---|---|
West of High Street to Sumner Road |
1.96 |
3.90 |
1.94 |
blank |
Intersection at Cypress Street |
8.73 |
5.19 |
-3.54 |
N |
Cypress Street to Sumner Road |
1.86 |
2.21 |
0.35 |
blank |
Intersection at Sumner Road and Warren Street |
10.23 |
4.37 |
-5.86 |
N |
Sumner Road to Lee Street |
2.71 |
1.40 |
-1.31 |
blank |
Intersection at Lee Street |
5.38 |
3.55 |
-1.83 |
N |
Intersection at Chestnut Hill Avenue |
12.97 |
6.22 |
-6.74 |
N |
Chestnut Hill Avenue to Reservoir Road |
0.83 |
1.05 |
0.21 |
blank |
Intersection at Reservoir Road |
4.79 |
3.10 |
-1.69 |
N |
Reservoir Road to Chestnut Hill Benevolent Association Driveway |
1.83 |
0.81 |
-1.02 |
blank |
Intersection at Chestnut Hill Benevolent Association Driveway |
1.06 |
0.67 |
-0.40 |
N |
Chestnut Hill Benevolent Association Driveway to Hammond Street |
2.62 |
5.49 |
2.87 |
blank |
Intersection at Hammond Street |
9.14 |
4.75 |
-4.39 |
N |
Hammond Street to Tully Street |
1.67 |
3.19 |
1.52 |
blank |
Intersection at Tully Street |
4.82 |
2.77 |
-2.05 |
N |
Entire Route 9 Corridor |
70.58 |
48.66 |
5 of 15 |
0 of 8 |
Note: Green shading denotes intersections and white shading denotes segments within the corridor.
Source: Central Transportation Planning Staff.
Staff also used the HSM analysis results to assign a monetary value to the societal burden of traffic collisions. The Federal Highway Administration (FHWA) provides comprehensive cost values that take into account both economic costs (lost wages and property damage) and health and emotional costs (pain and suffering of those injured in crashes) that are monetized as quality-adjusted life years. These equivalencies are broken down by type and severity of accident. For the purposes of this study, MPO staff used two values: $15,600 per property damage only crash and $260,800 per crash involving a non-incapacitating injury. Both values were adjusted to reflect the 2016 Massachusetts cost of living.21
Table 2 shows the total estimated comprehensive societal cost per year that resulted from collisions within the corridor. Estimated costs based on expected crashes and observed crashes are well above $4 million per year, which demonstrates that investing in safety improvements inside the corridor can yield large returns when taking the comprehensive societal cost into consideration.
Table 2
Comprehensive Costs of Crashes
| Crash Severity |
Crashes Per Year (Observed) |
Estimated Cost (Observed) |
Crashes Per Year (Expected) |
Estimated Cost (Expected) |
|---|---|---|---|---|
Property Damage Only |
28.9 |
$500,000 |
33.1 |
$500,000 |
Fatal and Injury |
18.5 |
$4,800,000 |
15.5 |
$4,100,000 |
Total |
47.4 |
$5,300,000 |
48.6 |
$4,600,000 |
Source: Central Transportation Planning Staff.
Table H-1 in Appendix H presents further detail about the input data, computational steps, and HSM formula outputs.
Chapter 5—Proposed Improvements
Based on the analyses in the previous chapters, MPO staff developed a series of short- and long-term improvements to address safety and operational problems in the corridor. The proposed short-term improvements generally can be implemented within two years at a relatively low cost. The long-term improvements are more complicated and cover larger areas, thus require intensive planning and design, and significant funding.
This chapter contains six sections. The first section analyzes roadway redesign options for accommodating bicyclists and improving or maintaining the accommodations of other users of the roadway. Based on the analysis, three alternatives for improving the corridor are explored and a preferred alternative is presented.
Each of the next five sections discuss the roadway characteristics and land uses around segments of the Route 9 corridor, review issues and concerns, and propose short- and long-term improvements at critical locations in the study area. The final section provides an overview of the proposed long-term improvements under the projected 2030 traffic conditions.
One of the key issues identified for the corridor is the lack of bicycle accommodations. Considering the generally high-speed and high-volume traffic conditions in the corridor, the advisory committee members concurred that bicycle accommodations separated from vehicular traffic should be considered for this location. Other key issues, such as pedestrian crossings, transit access, safety, and convenience should be considered in the future corridor improvements.
Based on discussions with the advisory committee members, staff identified five main objectives for improving bicycle accommodations and safety:
To achieve the objectives, staff applied the following design strategies to the improvement alternatives:
MassDOT’s Separated Bike Lane Planning and Design Guide provides options for separated bike lane designs. Staff used the guide to analyze the feasibility of implementing separated bike lanes in the Route 9 corridor considering the width of the right-of-way in the corridor. The four options considered are as follows:
Figure 15 illustrates typical layouts of the four types of separated bike lane design.
Option 1, the sidewalk level separated bike lane, is considered the most desirable among the four options because it offers bicyclists a high degree of separation from vehicular traffic. The design of sidewalk level bike lanes should provide a sidewalk buffer that discourages pedestrian encroachment into the bike lane and bicyclist encroachment onto the sidewalk.
Option 2, the intermediate level separated bike lane, generally requires a dimension similar to Option 1 but offers greater design flexibility for constrained areas. The key design element of the bike lane is a curb reveal of two to three inches below sidewalk level that provides vertical separation from the adjacent sidewalk or sidewalk buffer.
Option 3, the street level separated bike lane, requires less space than Options 1 and 2 as sidewalk curbs provide separation between pedestrians and bicycles. The sidewalk buffer zone can be reduced or waived in constrained areas. However, the street buffer zone (generally four to six feet wide, and two feet wide at a minimum) is essential to separate vehicular traffic from the bike lane. Street level separated bike lanes are usually compatible with accessible on-street loading zones.
Option 4, the raised bike lane, is for areas with constrained right-of-way. Like intermediate level bike lanes, raised bike lanes may be built at any level between the sidewalk and the street. They are only appropriate in constrained locations where the combined bike lane and street buffer width is less than seven feet and sidewalks are narrow or the sidewalk buffer is eliminated. Because of their narrow street buffer, raised bike lanes are not recommended for two-way operation or adjacent to on-street parking.
The width of the right-of-way on Route 9 varies. For the purpose of analysis, the corridor was divided into five sections, each with similar right-of-way width and roadway characteristics. Table 3 summarizes the applicability of each of the four bike lane design options in the sections of the corridor.
Table 3
Feasibility Analysis of Separated Bike Lane Design Options
Route 9 Section |
Option 1: |
Option 2: |
Option 3: |
Option 4: |
1) Washington Street—Sumner Road |
Not applicable. Insufficient space. |
Not applicable. Insufficient space. |
Applicable, with removal of on-street parking. |
Applicable, with removal of on-street parking. |
2) Sumner Road—Chestnut Hill Avenue |
Applicable. |
Applicable. |
Applicable. |
Applicable. Not desirable. |
3) Chestnut Hill Avenue—Reservoir Road |
Applicable, with removal of on-street parking. |
Applicable, with removal of on-street parking. |
Applicable, with removal of on-street parking. |
Applicable. Not desirable. |
4) Reservoir Road—Hammond Street |
Applicable. |
Applicable. |
Applicable. |
Applicable. Not desirable. |
5) Hammond Street—Newton City Line |
Applicable, with removal of on-street parking. |
Applicable, with removal of on-street parking. |
Applicable, with removal of on-street parking. |
Applicable, with removal of on-street parking. |
Source: Central Transportation Planning Staff.
Overall, all the separated bike lane options are applicable in most sections of the corridor, however, some would require the removal of the existing on-street parking. However, Options 1 and 2 are probably not applicable in the Washington Street to Sumner Road section because of insufficient right-of-way width and the fully built surroundings.
At this preliminary planning stage, staff explored three basic roadway reconfiguration alternatives based on the level of bicycle and traffic separation.
Alternative 1, focusing on the sidewalk level bike lane design, would provide a high level of separation between bicyclists and vehicular traffic and would require the removal of all on-street parking in the corridor. Alternative 2, focusing on the street level bike lane design, would provide a lower but acceptable level of separation from vehicular traffic and would require the removal of all on-street parking. Alternative 3, intended for comparison purposes, would provide the same level of separation as Alternative 2 in most sections and allow limited on-street parking in essential sections. Table 4 summarizes the proposed components in the three corridor improvement alternatives.
Table 4
Proposed Components in Corridor Improvement Alternatives
Improvement Alternatives |
Pedestrian Accommodation |
Bicycle Accommodation |
Traffic Accommodation |
Alternative 1 |
6 foot or wider sidewalks |
Sidewalk level separated bike lanes (approximately 75% of the corridor) |
6 foot or wider traffic medians |
blank |
Sidewalk buffer zone amenities |
Raised bike lanes (approximately 25% of the corridor) |
Four 11-foot travel lanes |
blank |
Crosswalks at essential locations |
blank |
No on-street parking in the corridor |
blank |
Traffic medians in the corridor |
blank |
blank |
Alternative 2 |
6 foot or wider sidewalks |
Street level separated bike lanes (in the entire corridor) |
6 foot or wider traffic medians |
blank |
Crosswalks at essential locations |
blank |
Four 11-foot travel lanes |
blank |
Traffic medians in the corridor |
blank |
No on-street parking in the corridor |
Alternative 3 |
6 foot or wider sidewalks |
Street level separated bike lanes (approximately 95% of the corridor) |
6 foot or wider traffic medians |
blank |
Crosswalks at essential locations |
Street level separated bike lanes adjacent to on-street parking (approximately 5% of the corridor) |
Four 11-foot travel lanes |
blank |
Traffic medians in the corridor |
blank |
On-street parking in limited sections |
Source: Central Transportation Planning Staff.
Figures 16 to 22 show the existing roadway cross section and prospective reconfigured layouts of the three improvement alternatives in the different sections of the corridor.
In principal, parking on state highways is prohibited. The advisory committee members concurred that the existing on-street parking could be removed or relocated to provide safe and comfortable separated bike accommodation and the committee selected Alternative 1 as the preferred long-term improvement alternative for the corridor.
Essential on-street parking spaces, such as school, commercial, and school bus loading zones, and accessible parking spaces, cannot be fully addressed in this preliminary planning study because further engineering survey and collaboration with the neighborhoods and property owners is required. Most parking spaces would be limited to short-term parking and might be integrated with sidewalk or street level separated bike lanes. Additional shared parking lots may need to be constructed intermittently along the corridor to accommodate parking needs. These essential parking spaces should be further examined at the design stage.
In the Route 9 corridor, vehicles generally travel at a high speed and traffic volumes are usually heavy. This study does not recommend short-term bicycle accommodation improvements, such as restriping travel lanes, painting bike lanes (on shoulders), or adding buffer zones on the existing road surface, because these measures would not significantly slow down traffic or safely separate bicyclists from traffic. If these measures were considered, the designs would have to go through an engineering design and review process to demonstrate compliance with MassDOT’s safety standards.
The proposed long-term improvements described in Alternative 1 would improve accommodation of bicyclists and pedestrians as well as enhance safety for all users of the corridor. The separated accommodations would reduce conflicts between travel modes. In addition, the reconfigured corridor would lower traffic speeds and could be designed as a consistent 35 mph regulated roadway. Crashes caused by vehicles and the severity of crashes would be considerably reduced.
This section discusses the Route 9 corridor between Washington Street and Sumner Road. The large intersection of Route 9 at Washington Street, High Street, and Walnut Street at the eastern end of this section is not addressed in this study because the intersection and adjacent roadways in the Gateway East (Village Square) area have been completely redesigned and the improvements are scheduled for construction by MassDOT.22
The roadway between Washington Street and Sumner Road contains two travel lanes in each direction. The land uses adjacent to the roadway are mainly commercial from Washington Street to Brighton Road and multi-family residential from Brighton Road to Sumner Road and Warren Street. In the commercial section, there are two major developments (the Homewood Suites hotel and an Audi car dealership), a neighborhood park (Boylston Street Playground), and a currently vacant primary school (the former Lincoln School location), and many local businesses and offices exist along Route 9. In the residential section, a private school (Maimonides School) occupies the north side of Route 9 from Clark Road to Buckminster Road.
Three locations along this section of Route 9 are a major concern to the Town of Brookline. One is the intersection of Route 9 at Cypress Street, which is currently signalized. Cypress Street is a major route that connects the Green Line’s Brookline Hills Station (located approximately 600 feet north of the intersection) and Washington Street, Brookline Village, and the areas further north and east. The intersection is very busy during the morning and afternoon peak hours with heavy vehicular traffic and continuous pedestrian crossings. In addition, Cypress Street is a town-designated bicycle route. A noticeable number of bicycles were observed crossing the intersection during the peak hours.
Another location of concern is the intersection of Route 9 at Clark Road and Kennard Road. The intersection is adjacent to Maimonides School. Stops for MBTA buses and Partners HealthCare shuttles are west of the intersection. A noticeable number of pedestrians were observed crossing Route 9 at this intersection. The residents from the south side of Route 9 usually cross via Clark Road to access the Brookline Hills rapid transit station. Passengers of the medical shuttles also use this intersection and Clark Road to reach the Brigham and Women’s medical office near the station. The intersection is unsignalized and has no crosswalks across Route 9. Pedestrians and transit passengers usually have to cross Route 9 under the heavy and high-speed traffic conditions.
The Town also raised concerns about pedestrian crossings in the area between Homewood Suites and the former Lincoln School. There is a signalized crosswalk on Route 9 at the former Lincoln School. The school building is currently closed and under renovation. Though the signal is now seldom used for school purposes, it is occasionally used by residents to access Boylston Street Park.
East of the signalized crosswalk, there are no crosswalks until Washington Street. The Town considers that there are needs for people to access businesses and other destinations on both sides of Route 9, especially to reach destinations such as the Brookline Village and Brookline Hills transit stations and the Washington Street business area from Walnut Path (on the south side of Route 9) and the pathway next to Homewood Suites (on the north side crossing the MBTA rail track).
In summary, these are the major issues and concerns regarding this section of roadway:
Proposed short-term improvements for this section of Route 9 between Washington Street and Sumner Road include the following:
In the long term, this study proposes the following improvements for the section of Route 9 between Washington Street and Sumner Road in general and at specific locations. Figure 23 shows the conceptual plan of the proposed improvements in the central part of this section.
Proposed long-term improvements for the section include the following:
This intersection is signalized and saturated with heavy traffic, pedestrian, and bicycle activity during peak hours. Proposed long-term improvements include the following:
This intersection is unsignalized and a noticeable number of pedestrians were observed crossing there. Proposed long-term improvements for pedestrians and transit riders include the following:
The issue of pedestrian crossings in this area was raised during a later stage of this study, so pedestrian crossing data were not collected. As there are a number of undetermined factors about the future use of the former Lincoln School and potential developments in the adjacent commercial district, this study proposes the following improvement strategies:
This section discusses the Route 9 corridor between Sumner Road and Chestnut Hill Avenue, including the intersections of Route 9 at Sumner Road and Warren Street and at Chestnut Hill Avenue.
This section of Route 9 has two travel lanes in both the eastbound and westbound direction and its right-of-way is much wider than the section between Washington Street and Sumner Road, especially on the north side where wide sidewalks with grass and trees exist. Both sides of the roadway have sufficient roadway shoulders.
The north side of Route 9, known as Fisher Hill, is sparsely settled with large single- and multi-family houses and has an abundance of greenery; the south side is entirely occupied by Brookline Reservoir Park from Lee Street to Warren Street. There are no sidewalks on the south side. People usually use the multi-use trail surrounding the reservoir, which has a path parallel to Route 9. There are no well-defined connections from Route 9 sidewalks to the multi-use trail around the reservoir, except for an opening on Lee Street just south of the intersection of Route 9 and Lee Street.
This section of roadway is scenic and enjoyable to drive. However, motorists tend to drive fast in the spacious environment. The posted speed limits are different in the westbound (35 mph) and the eastbound (45 mph) directions. The spot-speed studies conducted in November and December 2018 showed that most motorists drove approximately 40 mph in the westbound direction and approximately 50 mph in the eastbound direction.
The signalized intersection of Route 9 at Sumner Road and Warren Street is congested during the peak hours, especially in the morning. Sumner Road is a popular route connecting to Brookline High School, the town center, and the areas in the north. Residents frequently use the intersection to access the park by Brookline Reservoir. The intersection has a fairly large layout and the distance for pedestrians to cross Route 9 is long. In addition, the arrangement of approaching lanes does not accommodate the prevailing traffic volumes, especially on the eastbound approach. The intersection should be reconfigured to accommodate traffic, pedestrians, and bicycles.
The three intersections of Route 9 at Lee Street, at Chestnut Hill Avenue, and at Lee Street at Lee Street Extension (connecting to Heath Street) together form a large complicated intersection. The intersections are all signalized and coordinated with the Chestnut Hill Avenue intersection as the master intersection. Pedestrian signal phases are concurrent with through and right-turning traffic and with no infringement by left-turning vehicles. Field observations and Synchro traffic simulations revealed that the three signals are well coordinated during heavy traffic conditions on all approaches. During peak hours, Lee Street (in the morning) and Chestnut Hill Avenue (in the evening) appear to be quite congested. However, the coordination setting has little room to adjust given the prevailing traffic patterns and the proximity of the three intersections.
In summary, major issues and concerns in this roadway section include the following:
Proposed short-term improvements in this section include the following:
In the long term, this study proposes the following improvements for the section in general and at specific locations. Figure 24 shows the conceptual plan of the proposed improvements.
Proposed long-term improvements for the section include the following:
The intersection is signalized and saturated with heavy traffic volumes during peak hours. The wide intersection layout can be modified to reduce pedestrian crossing distances and improve traffic and transit operations. Proposed long-term improvements include the following:
The three signalized intersections of Route 9 at Lee Street and at Chestnut Hill Avenue, and Lee Street at Heath Street are well coordinated under the prevailing traffic patterns. Proposed improvements to enhance traffic operations and pedestrian movements include the following:
This section discusses the Route 9 corridor between Chestnut Hill Avenue and Reservoir Road, including the intersection of Route 9 at Reservoir Road. The right-of-way on this section of Route 9, which is between 90 and 95 feet wide, is narrower than the section between Sumner Road and Chestnut Hill Avenue. There are five- to six-foot sidewalks with grass and trees on both sides. On-street parking is generally allowed on the north side of the roadway. The south side has a shoulder approximately six to seven feet wide and parking is generally prohibited.
The developments on the north side are mainly multi-family residences and some retail and commercial establishments. On the south side are single- and multi-family residences and a large church, Saint Lawrence Church. Commercial and office developments are located near the intersection of Route 9 and Reservoir Road. Brookline Fire Station No. 4 also is located at the intersection and fire trucks exit the station directly to Route 9 when responding to emergencies. Brigham and Women’s Health Care Center is located at the southwest quadrant of the intersection.
The intersection of Route 9 at Reservoir Road is signalized and the signal is equipped with an emergency preemption function for the fire station. Reservoir Road intersects Route 9 in a sharp angle such that the northbound and southbound entry points to Route 9 are slightly offset. In addition to the Route 9 and Reservoir Road approaches, the intersection includes the driveway of Brigham and Women’s Health Care Center. These factors and the necessity of keeping the frontage of the fire station clear create a fairly large and unusual layout. As a result, pedestrian crossing distances are long and the intersection can be confusing for drivers. To reduce traffic conflicts, the northbound approach to Reservoir Road is restricted to right turns only and left turns are prohibited from Route 9 westbound to the medical center and to Reservoir Road. The signal cycle includes an on-call exclusive pedestrian phase of nearly half a minute.
Another traffic signal in this section is located on Route 9 at Saint Lawrence Church. It is a pedestrian crossing signal for church activities and for residents to access MBTA bus stops on both sides of Route 9. The bus stop length is substandard on both sides of the roadway. On the north side (Route 9 westbound), buses pulling into the stop block access to Timon Avenue.
In summary, major issues and concerns in this roadway section include the following:
Proposed short-term improvements in this section include the following:
In the long term, this study proposes the improvements listed below for the section of Route 9 between Chestnut Hill Avenue and Reservoir Road in general and at specific locations. Figure 25 shows the conceptual plan for the proposed improvements.
Proposed long-term improvements for the section include the following:
The wide intersection layout can be modified to reduce pedestrian crossing distances and improve traffic and transit operations. Proposed long-term improvements include the following:
This section discusses the Route 9 corridor between Reservoir Road and Hammond Street, not including the intersection of Route 9 at Hammond Street (which is discussed in the next section). In general, this section of Route 9 has a right-of-way of 100 to 110 feet, and the medians are sufficiently wide.26 The posted speed is 40 mph for the entire section. Sidewalks with grass and trees exist on both sides. Some sidewalks on the north side, west of Reservoir Road, are narrow.
The development on this section of Route 9 is predominantly single-family homes, except on the south side of Route 9 between the signalized intersection at the driveway to the Chestnut Hill Benevolent Association (CHBA) and Reservoir Road. Most of the land on the south side is owned by CHBA and is currently undeveloped (and zoned for single-family residential housing). The other land on that side, between the CHBA and Reservoir Road, is occupied by Brigham and Women’s Health Care Center.
The signal at the intersection of Route 9 at the CHBA driveway is a pedestrian crossing signal for residents to access MBTA bus stops and the neighborhoods on either side of Route 9. The CHBA driveway carries a very low volume of traffic and the signal is not activated by vehicles. Partners HealthCare shuttles use the westbound left-turn lane at this intersection to make U-turns to the medical center, as left turns to the center are prohibited at the Reservoir Road intersection. During the morning peak hour, the continuous eastbound traffic can cause delays for the shuttles attempting to make U-turns. Approximately four shuttles access the medical center during the peak hour.
The roadway in this area is wide and motorists tend to drive much faster than the posted speed (40 mph). The spot-speed counts show that the prevailing (85th percentile) travel speed is 50 mph in the westbound (uphill) direction and 52 mph in the eastbound (downhill) direction.
Further west, there are two unsignalized crosswalks on Route 9 at Norfolk Road and at Dunster Road. According to the turning-movement counts taken in the fall of 2018, the crosswalk at Norfolk Road, which is mainly for access to MBTA bus stops, was used by five pedestrians or fewer per peak hour. The crosswalk at Dunster Road, which is used mainly by residents to access Baldwin School (on the south side) and also to access other destinations on both sides of the roadway, was used by 10 to 15 pedestrians per peak hour.
During the evening peak hours, the traffic queues on Route 9 westbound frequently extend to Dunster Road and obstruct the views of pedestrians and motorists at the crosswalk. Based on the 2013–18 Brookline police reports, there were 14 crashes at the crosswalk, including two pedestrian-involved crashes that resulted in injuries and four crashes caused by vehicles that stopped suddenly for crossing pedestrians. There were seven crashes at the crosswalk at Norfolk Road; three were potentially caused by vehicles that stopped suddenly for pedestrians, though no pedestrians were injured.
In summary, major issues and concerns in this roadway section include the following:
Proposed short-term improvements in this section include the following:
The crosswalk at Dunster Road on Route 9 is currently unsignalized. There are a high number of pedestrian crossings during peak hours at this location and a relatively high number of crashes. The study advisory members concurred that rectangular rapid-flashing beacons should be considered for this location. The following improvements are proposed:
The crosswalk at Norfolk Road on Route 9 is currently unsignalized. Only a few pedestrians use the crosswalk per peak hour and there have been a relatively low number of crashes (none involving pedestrians). However, there are MBTA bus stops on both sides of Route 9 adjacent to the crosswalk. The Town of Brookline could work with MassDOT to further investigate and design for the installation of rectangular rapid-flashing beacons.
In the long term, this study proposes the following improvements for the section of Route 9 between Reservoir Road and Hammond Street in general and at specific locations.
Proposed long-term improvements for the section include the following:
Proposed long-term improvements include the following:
This section discusses the Route 9 corridor between Hammond Street and the Newton city line, including the intersections of Route 9 at Hammond Street and at Tully Street. It also includes the intersection of Hammond Street and Heath Street, as these three intersections are signalized and coordinated and should be analyzed together.
The development along this section of Route 9 is predominantly commercial. A few businesses are located east of the intersection of Route 9 and Hammond Street. West of the intersection on the north side of Route 9, there is The Street at Chestnut Hill (a village-type shopping mall), Star Market, CVS, and Cumberland Farms (a gas station and convenience store at the corner of Hammond Street). A carriage road serving these developments runs one-way parallel to Route 9 westbound. Surrounding the shopping mall and Star Market are several large lots for customer parking.
Along the south side of Route 9, there are retail stores, banking and financial services, and other offices. Two-hour on-street parking is allowed on this side of Route 9. In addition, most of the stores and offices have parking lots on their properties accessible from Sheafe Street and Holly Lane.
This section of Route 9 has two travel lanes on both the eastbound and westbound sides separated by a continuous traffic median. At the Hammond Street intersection, it expands to three lanes (adding an exclusive left-turn lane) in the eastbound direction and four lanes (adding left- and right-turn exclusive lanes) in the westbound direction. This section generally has a wide right-of-way of about 160 to 180 feet. The extra right-of-way available beyond the existing roadway is mainly on the north side along the carriage road. Sidewalks with trees exist on the south side and on the carriage road’s storefront side.
The intersection of Route 9 at Hammond Street is the most congested location in this corridor. During the morning and evening peak periods, Hammond Street carries extensive commuter traffic to and from Route 9 and the MBTA Green Line’s Chestnut Hill Station. The signal regulates for leading, protected left turns from Hammond Street to Route 9, followed by through and right-turn movements on Route 9, and split phases (allowing traffic to advance from one approach at a time) for the Hammond Street approaches. Pedestrian phases are concurrent with Route 9 through and right-turning traffic and with the split phases on Hammond Street.
Both the intersection of Route 9 at Tully Street and the intersection of Hammond Street at Heath Street are not as congested as the intersection of Route 9 and Hammond Street. Capacity analyses show that they both operate at an acceptable level of service. Synchro traffic simulations show that the three intersections are well coordinated. Route 9 traffic moves smoothly and there are no queues spilling back from Heath Street to Route 9. However, the severe congested conditions on the Hammond Street northbound approach in the morning peak hour and on the southbound approach in the evening peak hour are difficult to mitigate under the existing signal and geometric conditions at the intersection of Route 9 and Hammond Street.
For an urbanized location, the intersection of Route 9 and Hammond Street has a crash rate that is not considered alarmingly high. There were two pedestrian-involved crashes in the five-year period from 2013 to 2018. One involved a southbound vehicle turning right that failed to stop for a crossing pedestrian. Another was initiated by a pedestrian who was crossing the road improperly.
The crash rate at the intersection of Route 9 and Tully Street is not high. The majority of the crashes were rear-end collisions that occurred on both approaches of Route 9. There were no pedestrian crashes in the same five-year period.
Pedestrian safety is a major concern in this section of Route 9. Currently a crosswalk equipped with a rectangular rapid-flashing beacon is located approximately 300 feet east of Tully Street. This crosswalk provides a path for customers and employees to reach the stores, services, and restaurants on both sides of Route 9. It is frequently used during business hours, especially midday during lunchtime. Seven crashes occurred at this location in the same five-year period. All were rear-end crashes caused by vehicles that stopped suddenly for crossing pedestrians. All seven crashes occurred in 2013 and 2014 prior to the installation of the rectangular rapid-flashing beacon. The beacon appears to be effective in warning and stopping the Route 9 traffic. However, it is not equipped with audible pedestrian signals or indicators that alert pedestrians when the beacon is flashing.
In summary, major issues and concerns in this roadway section include the following:
Proposed short-term improvements in the section of Route 9 between Hammond Street and the Newton city line include the following:
In the long term, this study proposes the following improvements for the Route 9 corridor between Hammond Street and the Newton city line in general and at specific locations. Figure 26 shows the conceptual plan of the proposed improvements.
Proposed long-term improvements for this section of Route 9 include the following:
The intersection is very congested with heavy traffic, pedestrian, and bicycle volumes during peak hours. Proposed long-term improvements at this intersection include the following:
Traffic signals at the intersection of Route 9 and Tully Street and the intersection of Hammond Street and Heath Street are well coordinated with the signals at the intersection of Route 9 and Hammond Street under the prevailing traffic patterns. Capacity analyses show that both intersections operate at an acceptable level of service. The results of crash data analyses show that the crash rates at these locations are not high. No long-term improvements are proposed for the two intersections at this time.
To further examine the effect of the proposed long-term improvements at the various locations described above, staff constructed traffic models for projecting traffic conditions in the Route 9 corridor to the horizon year 2030. Staff projected the 2030 traffic volumes for the alternatives by using growth factors estimated from the Boston Region MPO’s regional transportation planning model.31
Figures 27 and 28 summarize the weekday AM and PM peak hour intersection capacity analyses for major intersections in the corridor under the projected 2030 traffic conditions. With the proposed long-term improvements, all the intersections would operate at an acceptable level of service—LOS E or better—during the weekday AM and PM peak hours, except the intersection of Route 9 at Cypress Street in the AM peak hour. However, the Cypress Street intersection would maintain a similar level of service as in the existing conditions with no significant increase of delays.
Synchro capacity analysis reports of the study intersections are included in Appendices J and K. These reports present the results of the analysis of the future-year weekday AM and PM peak hour traffic conditions under the assumption that the proposed improvements are implemented.
Chapter 6— Summary and Recommendations
This report provides a vision for the long-term development of the Route 9 corridor in Brookline and presents a series of improvements that would allow the corridor to operate safely and efficiently for bicyclists, pedestrians, transit users, and motorists. The recommendations included are based on a series of safety and operations analyses that were performed to understand the safety and operational problems in the corridor and to identity solutions.
The recommended short-term improvements could enhance safety for all users, including pedestrians and bicyclists, and improve traffic operations in the study area. With a high benefit-to-cost ratio, these short-term improvements should be considered and implemented as soon as resources are available from highway maintenance or Chapter 90 funding.
Significantly improving the safety, mobility, and access for all users in the corridor would require a series of long-term improvements. The benefits expected to result from implementing the proposed long-term improvements from this study include the following:
Implementing this vision for Route 9 via the recommended improvements would require significant effort and collaboration on the part of all stakeholders, including the Town of Brookline, residents, business owners, and MassDOT. All parties must concur about how the recommendations should be realized in a resourceful and fiscally responsible manner.
The next steps toward implementation are for the Town to identify priority sections of Route 9 and work with MassDOT District 6 to initiate a project. For municipalities to initiate roadway projects, MassDOT recently developed an online tool for submission. The Massachusetts Project Intake Tool (MaPIT) is a web-based application designed to help proponents map, create, and initiate projects with available in-house geographic information system (GIS) resources. The tool can be accessed from the GeoPass webpage of Massachusetts GIS for Transportation (GeoDOT) website, https://massdothpi.esriemcs.com/mapit.
To move a project from the initiation to the development stage, the Town must obtain favorable assessment from MassDOT’s Project Review Committee, start the project design process, and identify potential funding sources by coordinating with MassDOT and the Boston Region MPO.
MPO staff will continue support this work by providing assistance with further project planning and the funding process. In addition, staff will continue to monitor the progress toward implementing this study’s recommendations via the MPO’s UPWP Study Recommendations Tracking Database.
Appendix L contains details about the various steps in MassDOT’s project development process, including a schematic timetable. Information about the project development process also may be found on MassDOT’s website, at https://www.mass.gov/service-details/project-development-process.
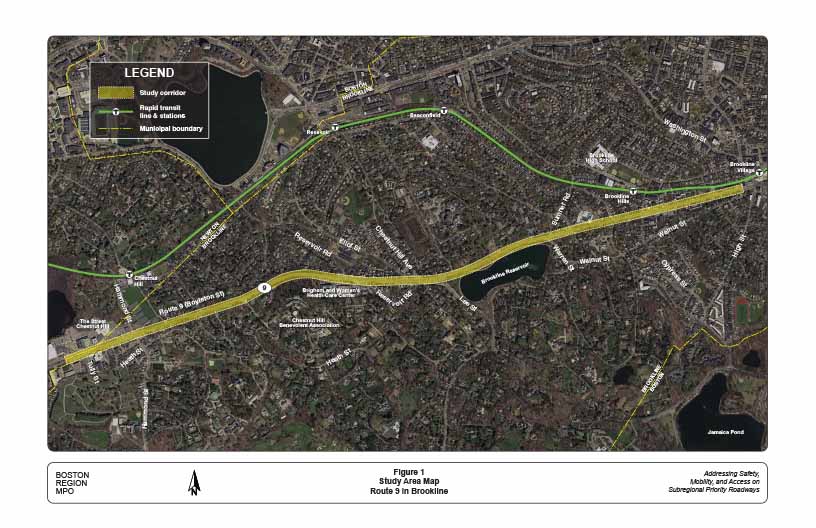
Figure 2
Transit Services and Pedestrian and Bicycle Facilities
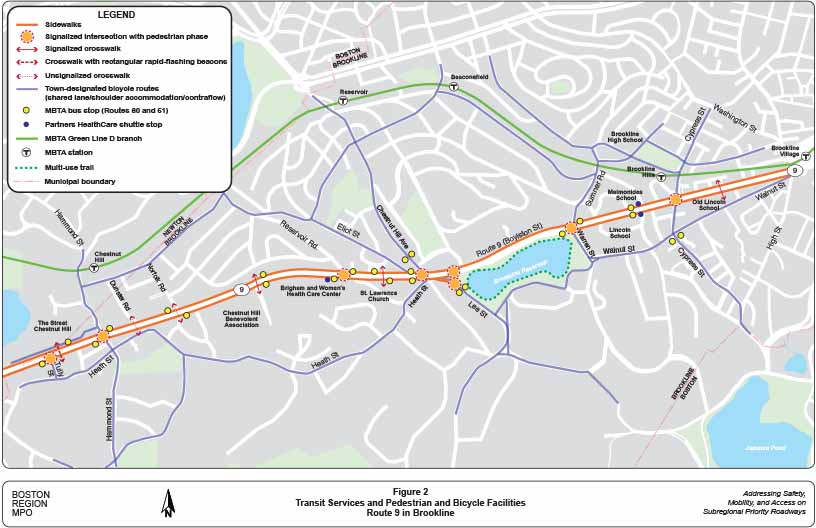
Figure 3
Daily Traffic Volumes
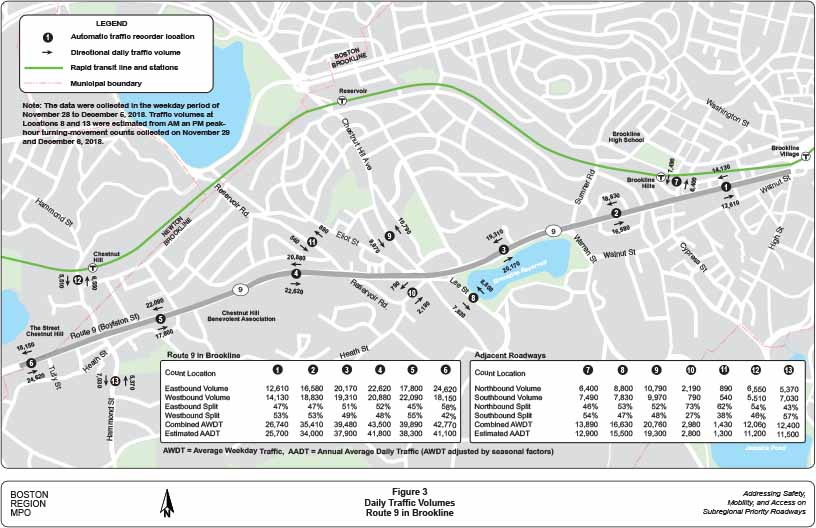
Figure 4
Weekday AM Peak Hour Traffic and Pedestrian Volumes at Major Intersections
Figure 5
Weekday PM Peak Hour Traffic and Pedestrian Volumes at Major Intersections

Figure 6
Saturday Peak Hour Traffic and Pedestrian Volumes at Major Intersections
Figure 7
Pedestrian Crossings during Peak Traffic Periods
Figure 8
On-Road Bicycle Volumes during Peak Traffic Periods
Figure 9
Heavy Vehicle Percentage during Peak Traffic Periods
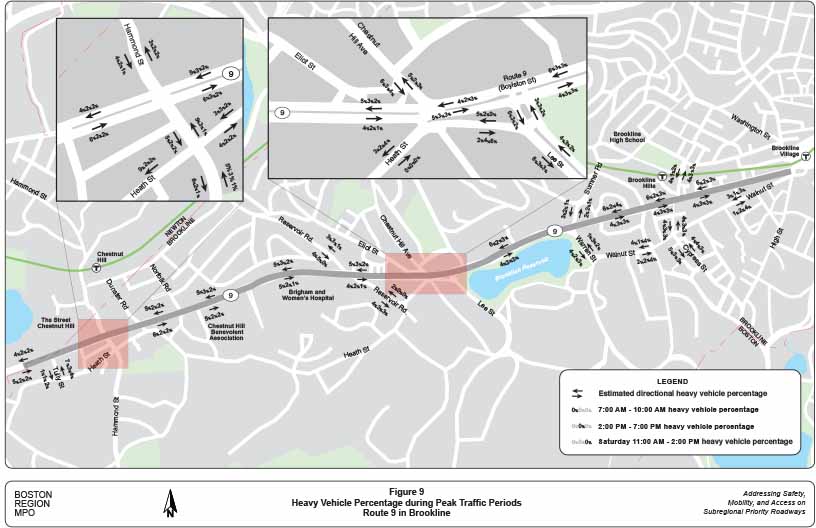
Figure 10
Weekday AM Peak Hour Intersection Capacity Analyses
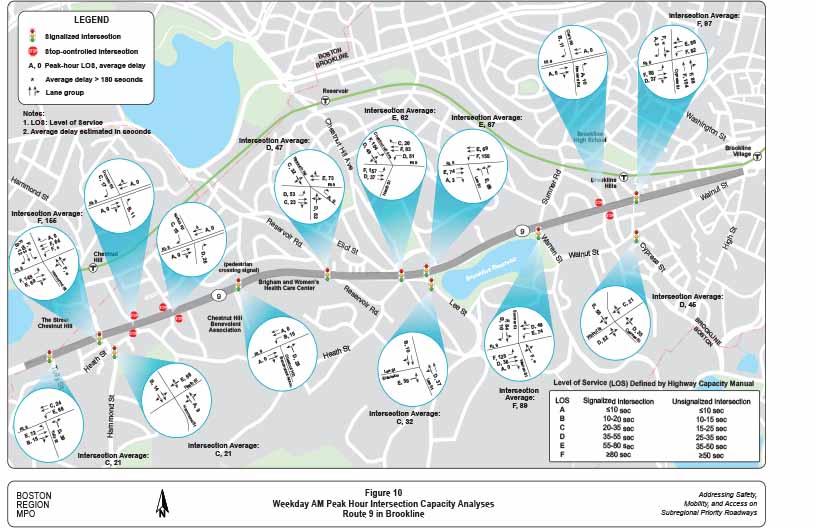
Figure 11
Weekday PM Peak Hour Intersection Capacity Analyses
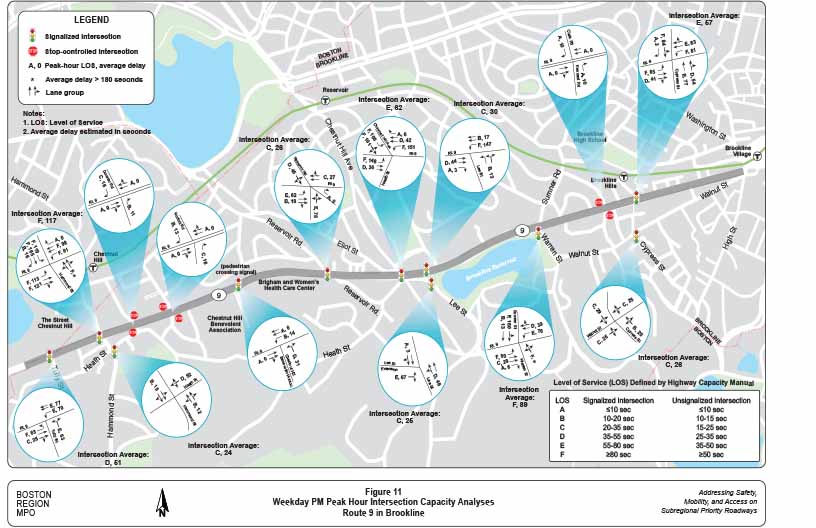
Figure 12
Saturday Peak Hour Intersection Capacity Analyses

Figure 13
Speed Regulations and Estimated 85th Percentile Speeds
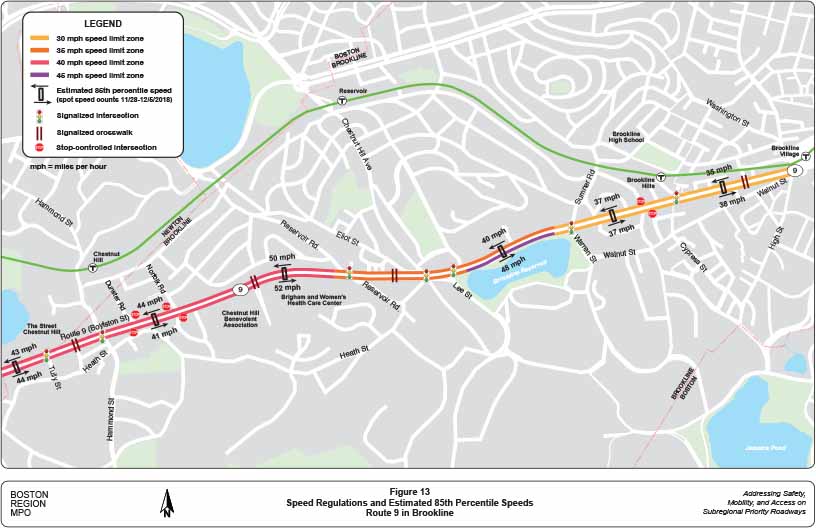
Figure 14
Crash Locations and Crash Clusters (MassDOT Crash Data 2013-15)
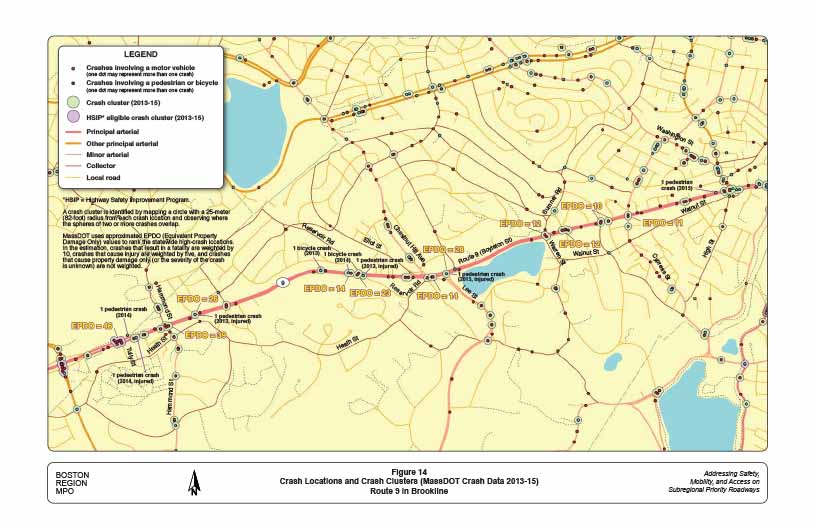
Figure 15
Separated Bike Lane Design Options
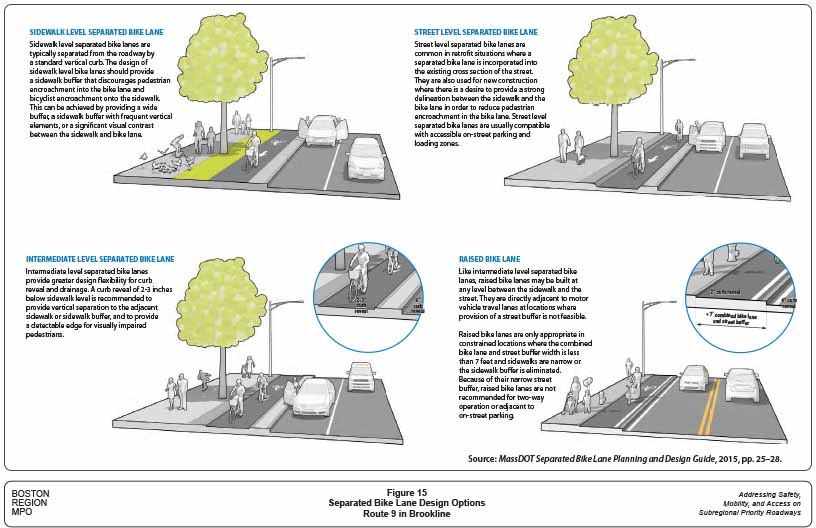
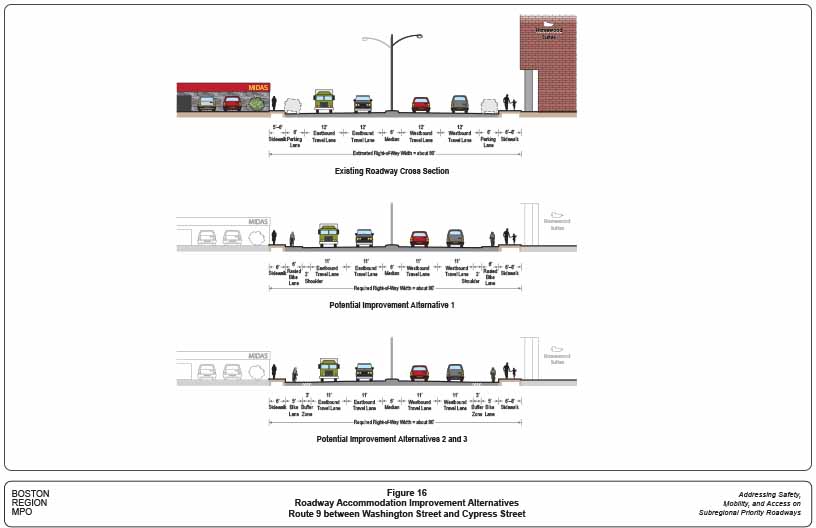
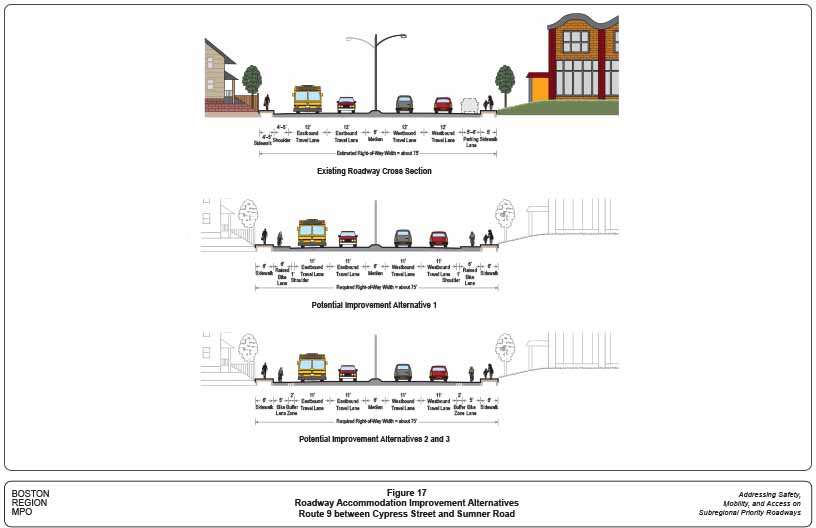
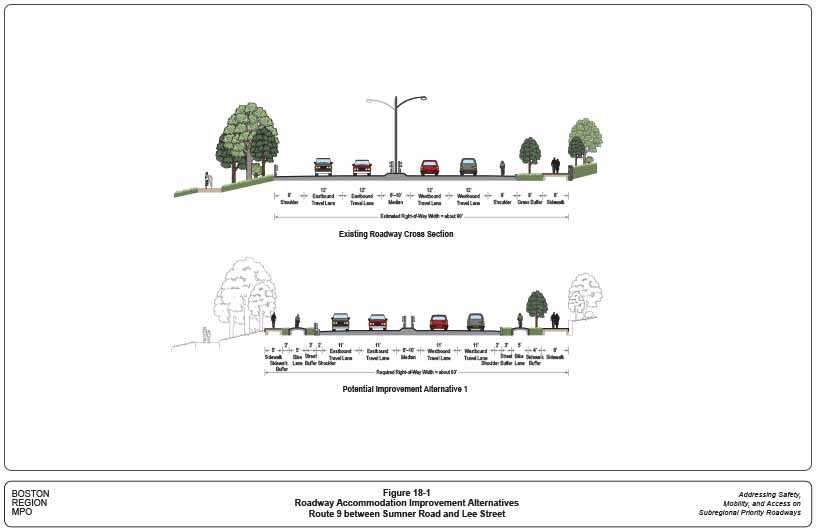
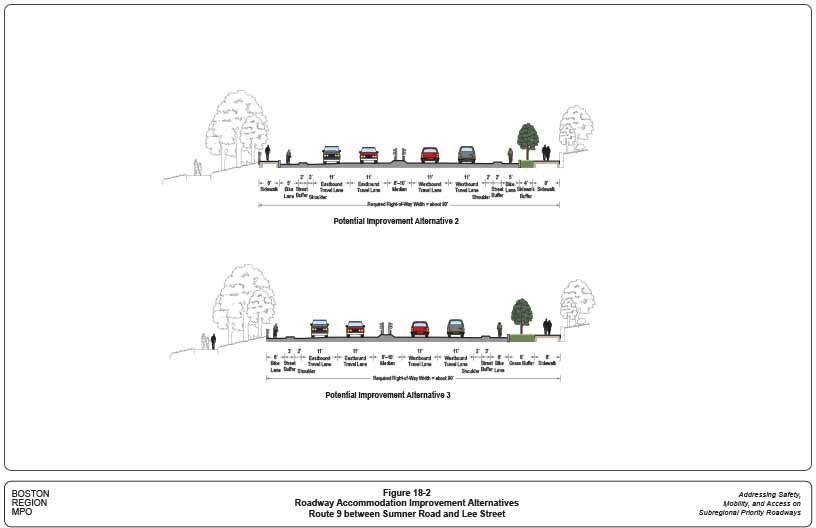
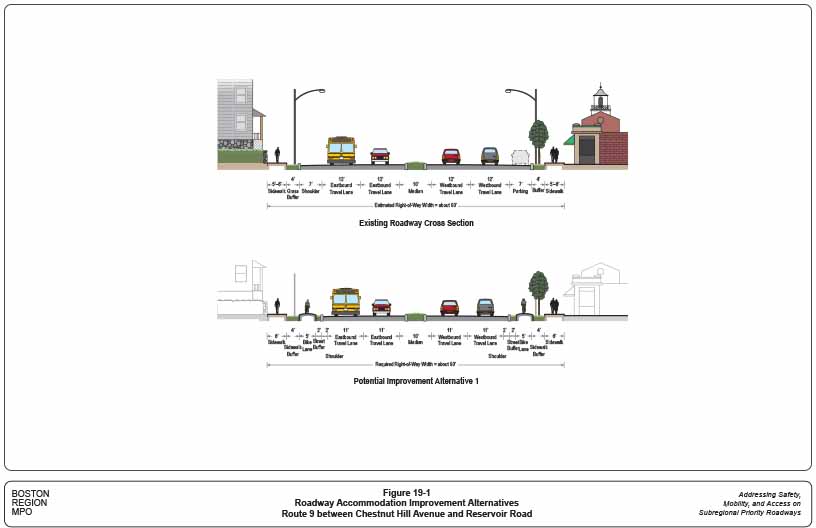
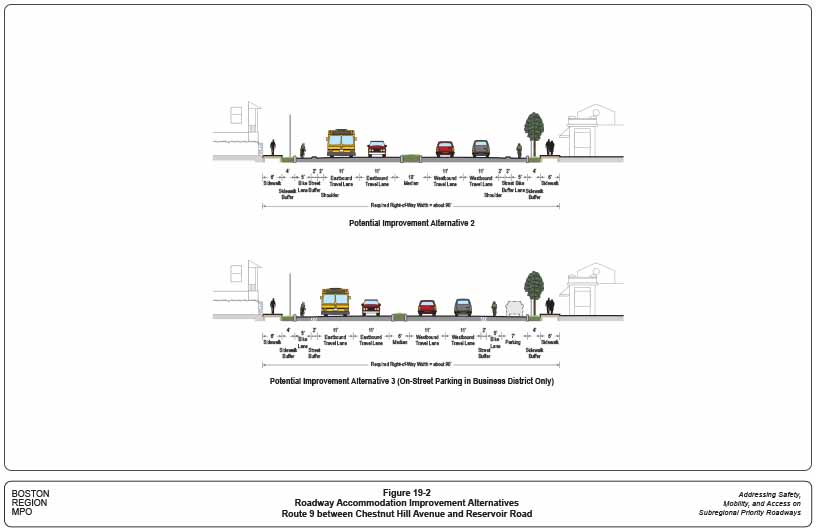
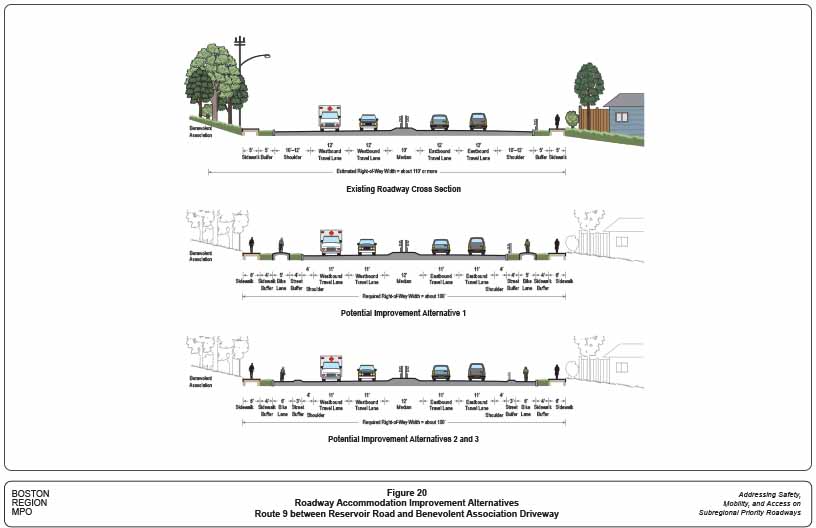
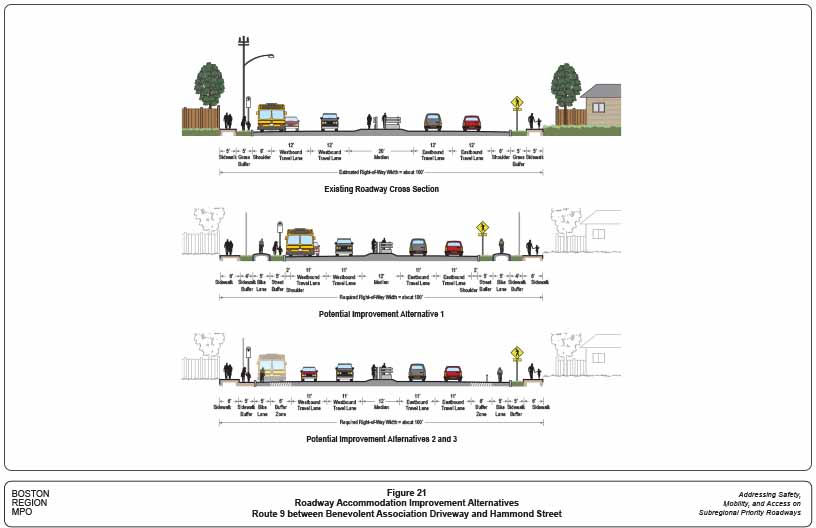
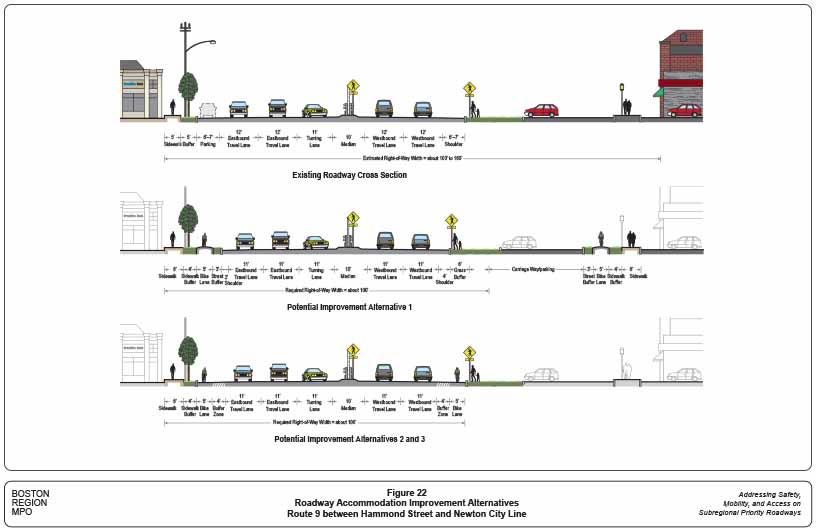
Figure 23
Proposed Long-Term Improvements Conceptual Plan: Route 9 from Cypress Street to Clark Road
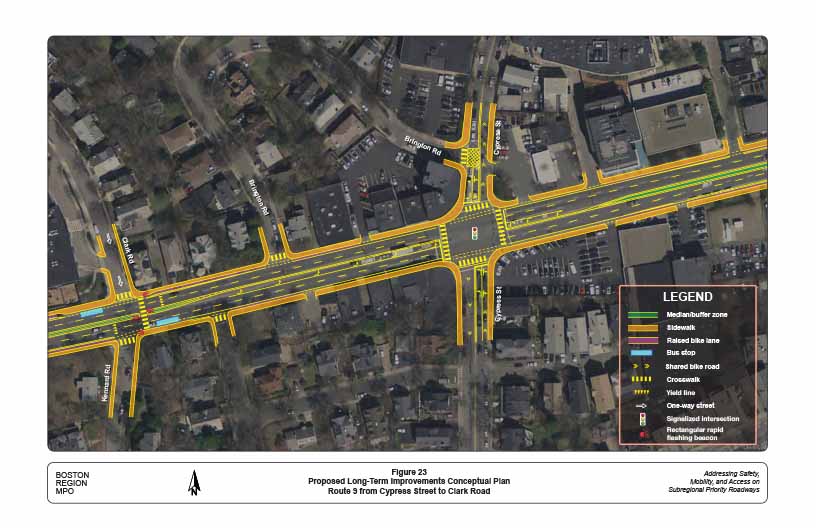
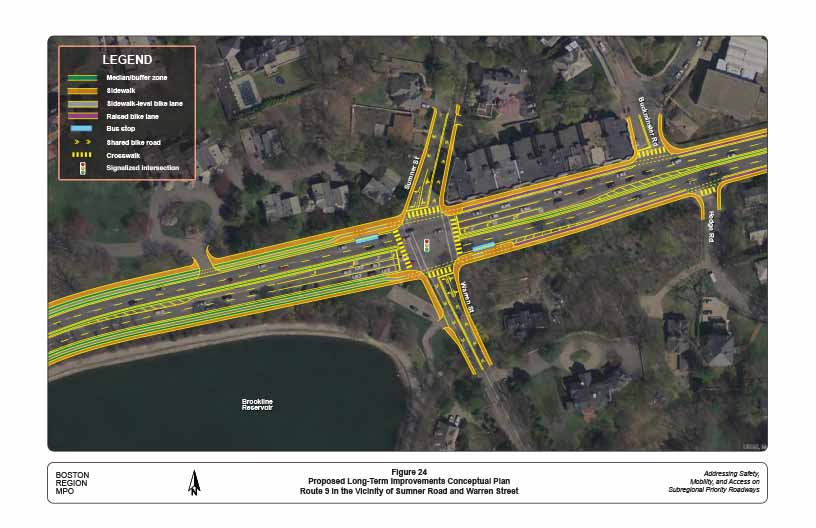
Figure 25
Proposed Long-Term Improvements Conceptual Plan: Route 9 in the Vicinity of Reservoir Road
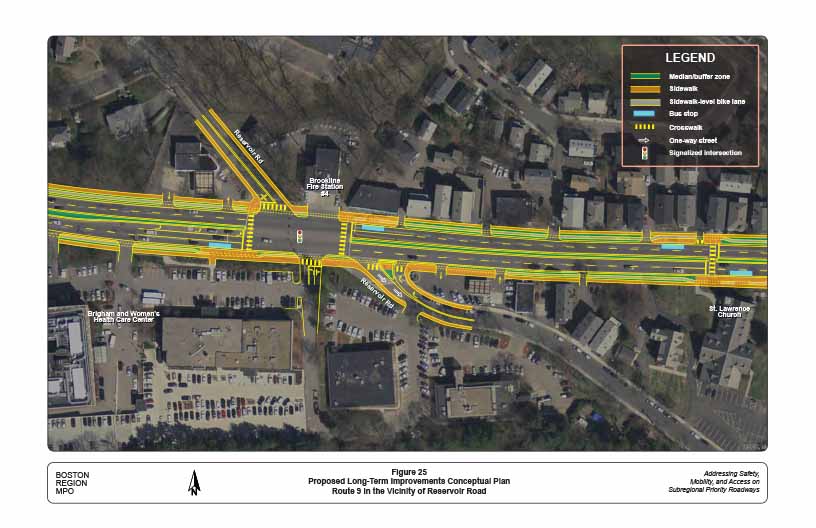
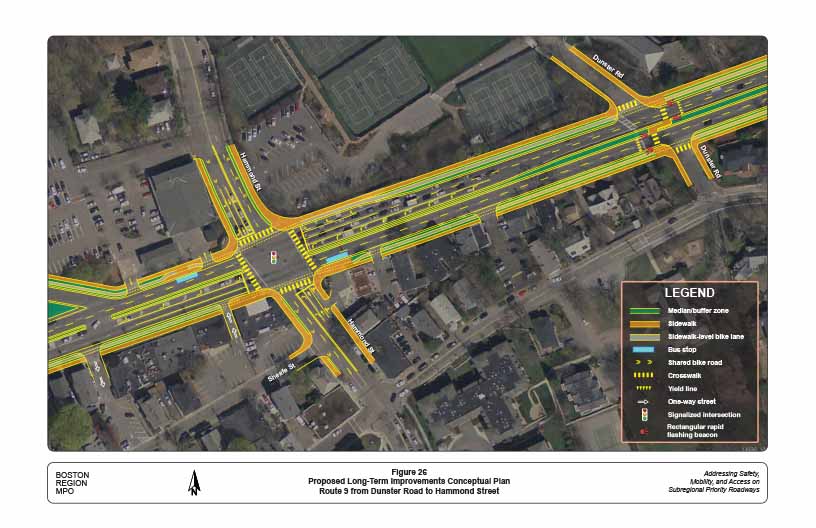
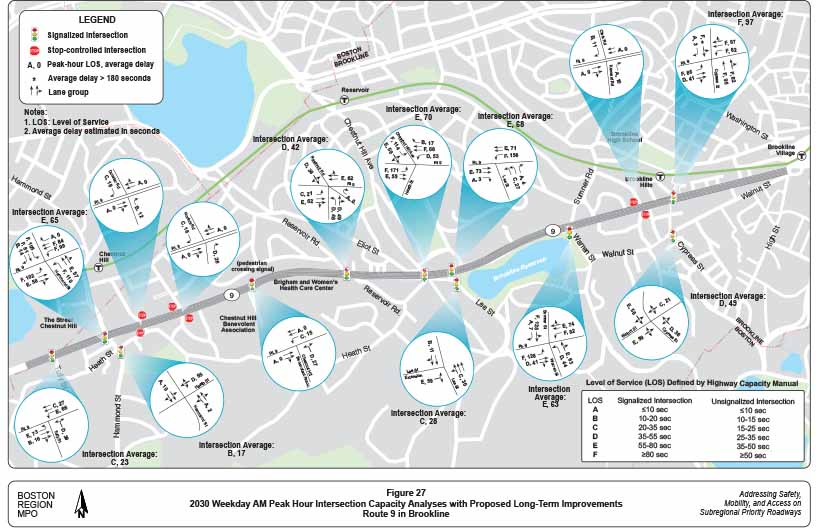
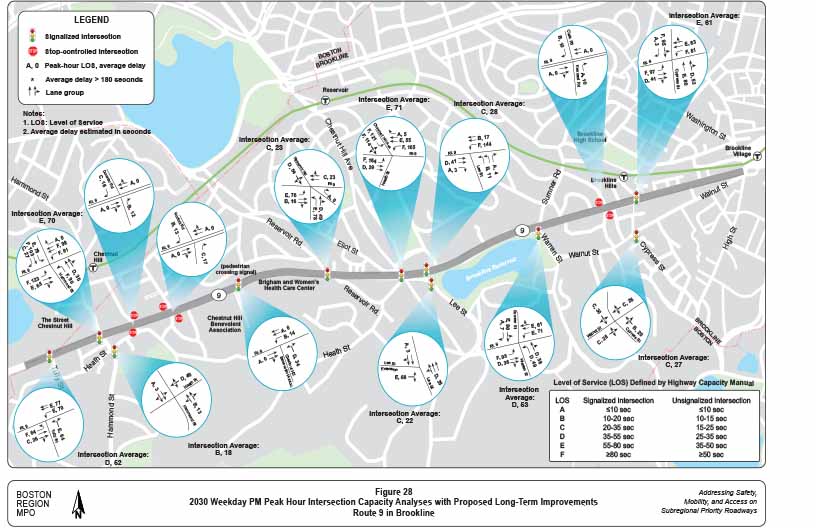
1 Roadways prioritized for improvement through this needs assessment are addressed through another annual work program, Priority Corridors for LRTP Needs Assessment.
2 The FFY 2019 Unified Planning Work Program was endorsed by the Boston Region Metropolitan Planning Organization on June 21, 2018.
3 Details of the criteria and rating system may be found in the Central Transportation Planning Staff’s technical memorandum “Selection of FFY 2019 Subregional Priority Roadway Study Location,” dated October 18, 2018.
4Green Routes Network Plan, A Bicycle Network Master Plan, Brookline Bicycle Advisory Committee, November 10, 2008.
5Advisory committee members representing MassDOT suggested that the presence of schools along the corridor may make potential projects eligible for Safe Routes to School funding. To qualify, nearby schools must be publicly funded kindergarten–8th grade schools that have a partnership with the MassDOT Safe Routes to School program. The Town should encourage any schools not currently partnered with the Safe Routes to School program to join the program if use of this funding source is desired.
6As this study was coming to a close in September 2019, staff of the Town of Brookline informed the MPO staff that the former Lincoln School now houses the 9th graders of Brookline High School. The signal is frequently used by students arriving or leaving school and traveling between this location and the main campus at 115 Greenough Street.
7 Staff selected 7:15 AM–8:15 AM, 5:00 PM–6:00 PM, 5:00 PM–6:00 PM as the weekday AM, weekday PM, and Saturday peak hours, respectively, because these were the periods when total volume observed through the corridor was highest.
8 Heavy vehicles include single-unit trucks (Federal Highway Administration [FHWA] Vehicle Classes 5 to 7), articulated trucks (single- and multi-trailer trucks, FHWA Vehicle Classes 8 to 13), and buses (FHWA Vehicle Class 4). Vehicles on a single frame with two axles and six tires (dual rear wheels) (FHWA Vehicle Class 5) include trucks and recreational vehicles. Passenger cars of any type and all other two-axle four-tire vehicles (FHWA Vehicle Class 3), such as pickups, vans, mini-buses, ambulances, motor homes, and campers (even a passenger car pulling a trailer), are not considered heavy vehicles.
9 Synchro Version 10.3 was used for the analyses. This software is developed and distributed by Trafficware Ltd. It can perform capacity analyses and traffic simulation (when combined with SimTraffic) for an individual intersection or a series of intersections in a roadway network.
10 Highway Capacity Manual 2010, Transportation Research Board of the National Academies, Washington DC.
11 Control delay quantifies the increase in travel time that a vehicle experiences due to a traffic signal or other type of control. It also provides a surrogate measure for driver discomfort and fuel consumption.
12 Based on “Procedures for Speed Zoning on State and Municipal Roadways” (MassDOT Highway Division, May 2012), establishing speed regulations require that at speed observation locations, the established safe speed shall not be more than seven mph below the 85th percentile speed and not higher than the 95th percentile speed.
13 To establish or modify speed controls, MassDOT requires the collection of speed data by radar gun or laser gun at critical locations at intervals not to exceed 0.25 miles, in addition to vehicle trial runs in the study area.
14 The number of spaces was estimated because these spaces are not metered and have no space delineation. One space is estimated to be 22 feet long.
15 Because there are no other parking regulatory signs, the No Parking 1 AM–6 AM/Tow Zone signs appear to indicate that people can park during times other than 1:00 AM–6:00 AM.
16 A crash cluster is identified by mapping a circle with a 25-meter (82-foot) radius from each crash location and observing where the spheres of two or more crashes overlap.
17 MassDOT uses approximated EPDO values to rank high-crash locations. In the estimation, crashes that result in a fatality are weighted by 10, crashes that cause injury are weighted by five, and crashes that cause property damage only (or the severity of the crash is unknown) are not weighted.
18 In this study, the term “pedestrian crashes” refers to crashes that involve at least one vehicle and one pedestrian; “bicycle crashes” refers to crashes that involve at least one vehicle and one bicycle. No crashes between at least one bicycle and one pedestrian were identified in the available data.
19 Highway Safety Manual 2010, American Association of State Highway and Transportation Officials, Washington, DC, December 2010.
20 Yuanchang Xie and Chen (Julian) Chen, Calibration of Safety Performance Functions for Massachusetts Urban and Suburban Intersections, report prepared for Massachusetts Department of Transportation Office of Transportation Planning, March 2016.
21 Massachusetts Department of Transportation, Technical Memorandum, MassDOT Average Comprehensive Crash Costs, January 1, 2018.
22 MassDOT project #605110 will make intersection and signal improvements on Route 9 in the Gateway East (Village Square) area of Brookline. The functional design for the project was completed in 2018 and the project is scheduled for construction in 2019. The project aims to improve the livability for residents and businesses in the area, improve regional connections for bicyclists and pedestrians, and improve the overall streetscape. Major elements of the project include 1) realignment of Walnut Street to Pearl Street to form a new four-way signalized intersection, 2) upgrades to the signals at Washington Street and at Brookline Avenue, 3) interconnection of the new signals at the three intersections, 4) demolition of the pedestrian bridge that is currently closed for safety concerns, and 5) provision of separated bicycle lanes.
23 The storage length of a turning lane refers to the space where vehicles queue to turn.
24 Currently the Lee Street approach contains two travel lanes, with the outside (right) lane shared by left- and right-turning vehicles. The crosswalk across Route 9 is located on the right-turn path and the pedestrian signal is operated concurrent to the Lee Street traffic signal phase. To expedite traffic movement, the additional lane on Lee Street should start approximately 350 feet south of the intersection of Route 9 and Lee Street. A conceptual sketch of the proposed improvements at this intersection from the 2030 Synchro traffic model is attached in Appendix I.
25 This improvement is currently being implemented by MassDOT.
26 The roadway contains a median approximately eight-to-ten-feet wide between Reservoir Road and the driveway of Chestnut Hill Benevolent Association and a median approximately 18-to-20-feet wide between the driveway to Hammond Street.
27 Federal Highway Administration’s Manual on Uniform Traffic Control Devices (MUTCD) specifies that yield lines should be placed 20 to 50 feet in advance of the nearest crosswalk line (2009 MUTCD with Revision Numbers 1 and 2 incorporated, Chapter 3B).
28 The regulatory sign is intended for vehicles traveling westbound on Route 9 that are making right turns. It is currently located on the departure side curb (after the intersection) and should be moved to the approaching side curb (before the intersection) next to the westbound right-turn lane.
29 The regulatory sign is intended for right-turning vehicles from all approaches. They are located at the far-side corners (after the intersection) and should be relocated to the near-side curb (before the intersection).
30 A Leading Pedestrian Interval (LPI) typically gives pedestrians a three to seven second head start when entering an intersection before vehicles traveling in the same direction get a green signal to proceed. Although the proposed improvements would significantly reduce delays and improve traffic and pedestrian operations at this intersection, most traffic phases would still be saturated with high traffic demands and operate at an undesirable level of service. Adding LPIs in the signal cycles would further increase delays and deteriorate the intersection’s level of service. However, the use of LPIs should be further examined at the design stage as it is a proven pedestrian safety improvement measure. The Manual on Uniform Traffic Control Devices (MUTCD) specifies that an LPI should be at least three seconds in duration and timed to allow pedestrians to cross at least one lane of traffic. Also, consideration should be given to prohibiting vehicles from turning across the crosswalk for the duration of the LPI (2009 MUTCD with Revision Numbers 1 and 2 incorporated, Chapter 4E).
31 The traffic growth projection is based on the transportation planning model recently developed for the MPO’s Long-Range Transportation Plan. With no major infrastructure (major new highway and transit) changes in the vicinity of Brookline, the model predicts that traffic in the study area would increase by three percent (0.25 percent annually) in the AM peak period and four percent (0.3 percent annually) in the PM peak period from 2019 to 2030.