Low-Cost Improvements to Express-Highway Bottleneck Locations
Project Managers
Seth Asante and Chen-Yuan Wang
Project Principal
Mark Abbott
Data Analysts
Benjamin Erban
Kathy Jacob
Graphics
Ken Dumas
Cover Design
Jane Gillis
Editor
Meghan Connolly
The preparation of this document was supported
by Federal Highway Administration through
MPO 3CPL FFY2019 Contract #105757
Central Transportation Planning Staff
Directed by the Boston Region Metropolitan
Planning Organization. The MPO is composed of
state and regional agencies and authorities, and
local governments.
Abstract
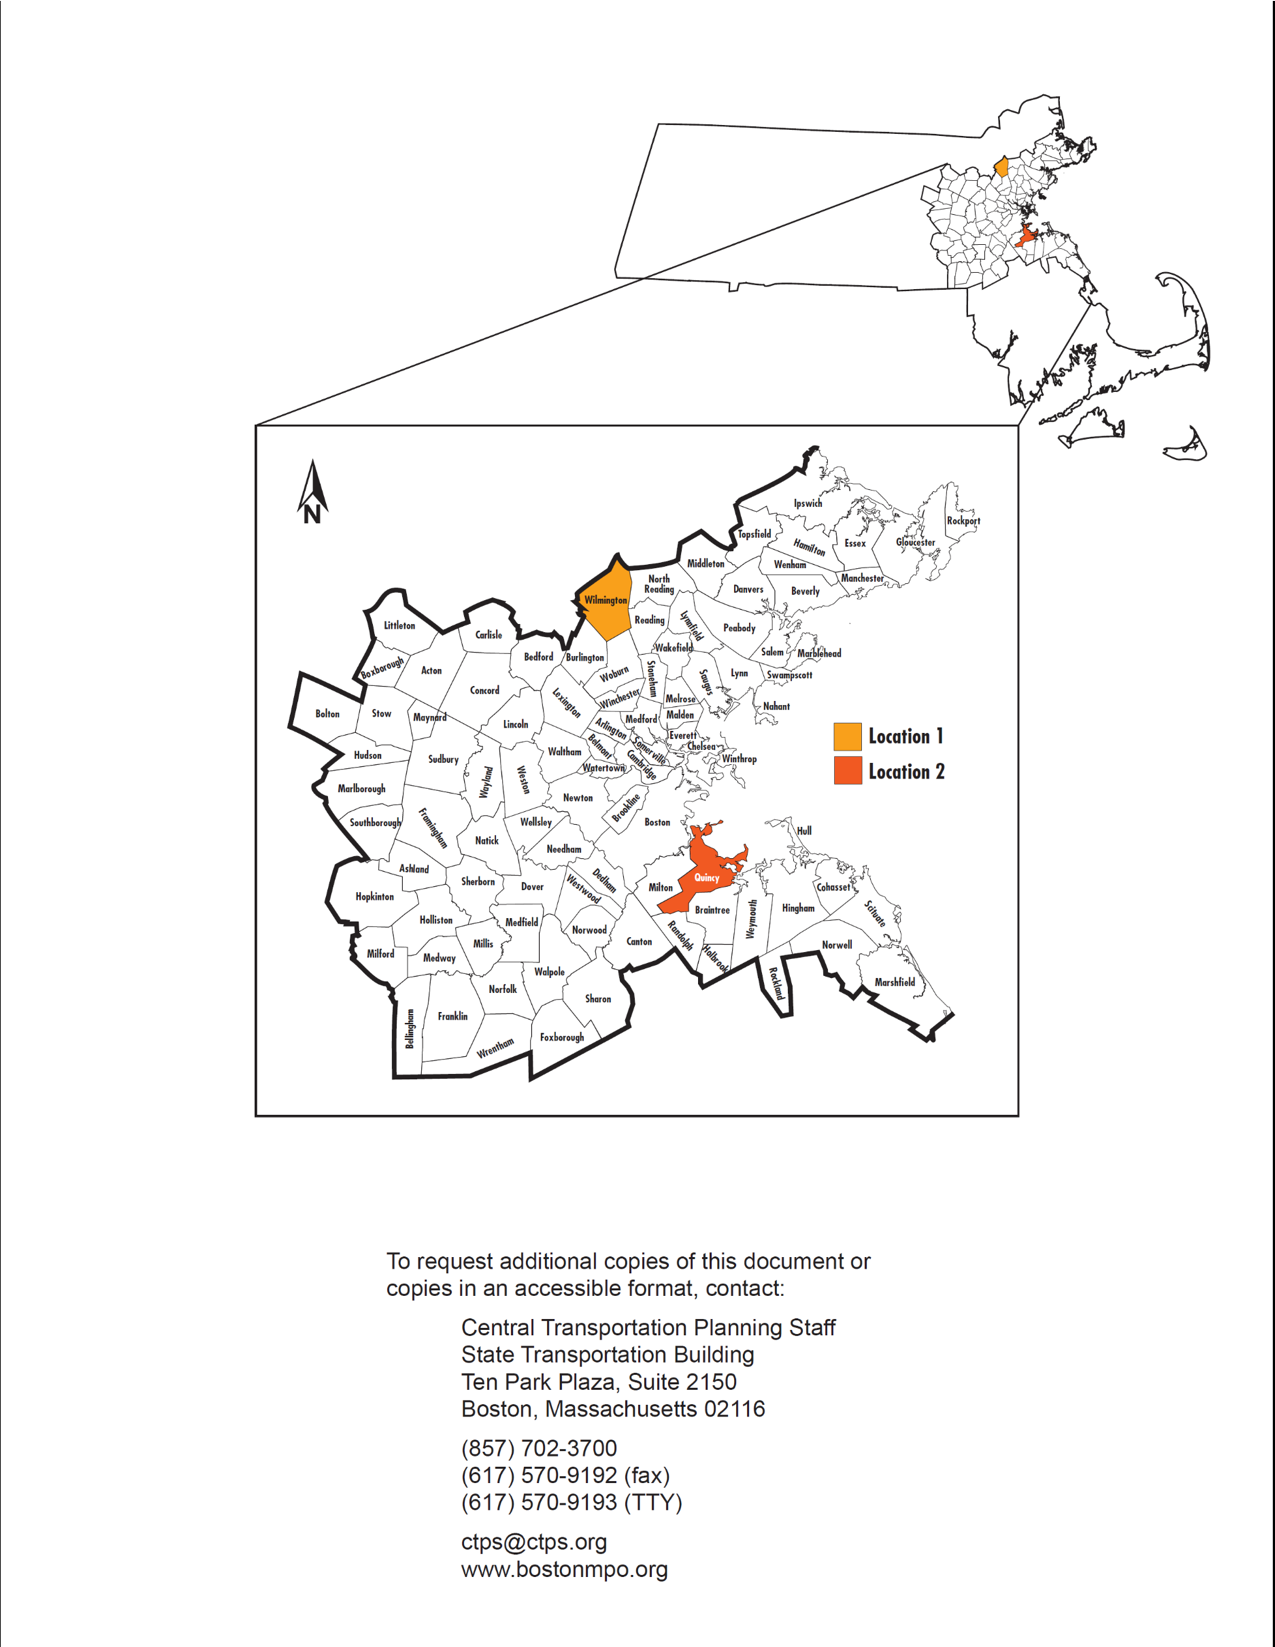
Candidate locations were selected based on input from the MassDOT Highway Division and Congestion Management Process data. The screening process yielded two locations that had the potential to respond to low-cost improvement measures. These locations included:
Both locations regularly experience poor level of service (LOS) because of one or more freeway bottlenecks during peak travel periods. MPO staff developed low-cost improvement proposals to address each bottleneck. If implemented, the modifications would result in capacity and safety improvements on these two high-volume facilities.
This report summarizes the analyses and recommendations from the study. The report is divided into multiple chapters, with two chapters covering each study location. Each location chapter summarizes existing conditions, proposes various low-cost measures to address the bottlenecks, and evaluates the efficacy of the proposed alternatives using methodology from the Highway Capacity Manual. The report concludes with a summary of the recommendations, followed by figures that illustrate features of the proposed improvements. As an addendum, the report includes technical appendices that cite the methods used and the data applied.
Chapter 2—Selection of Study Locations...................................................... 13
Chapter 3—Data Collection and Uses............................................................ 17
4.1 ..... Existing Freeway Characteristics....................................................... 21
4.1.1 Basic Freeway Section......................................................... 21
4.1.2 Entrance Ramp.................................................................. 21
4.1.3 Exit Ramp......................................................................... 22
4.1.4 I-93/Route 125 Interchange.................................................. 22
4.3.1 High Traffic Volume............................................................. 23
4.3.2 Short Acceleration Lane....................................................... 23
4.3.3 Short Deceleration Lane....................................................... 24
4.3.4 Traffic Congestion from I-93 Northbound Downstream Bottleneck. 24
4.4.1 Crashes............................................................................ 24
4.4.2 Travel Speed..................................................................... 26
4.4.3 Level of Service.................................................................. 27
4.5.1 Alternative 1: Create an Auxiliary Lane for Merging and Diverging Traffic 29
4.5.2 Alternative 2: Examine Potential Improvements at the Downstream Lane Drop Location 30
4.6...... Effectiveness and Cost of the Improvements....................................... 30
5.1...... Existing Freeway Characteristics....................................................... 33
5.1.1 Basic Freeway Section......................................................... 33
5.1.2 Entrance Ramps................................................................. 33
5.1.3 Exit Connector................................................................... 33
5.5.1 Crashes............................................................................ 35
5.5.2 Travel Speed..................................................................... 37
5.5.3 Level of Service.................................................................. 37
5.6.1 Alternative 1: Lengthen the Distance for the HOV Merge............. 39
5.6.2 Alternative 2: Lengthen Acceleration Distance for Furnace Brook Parkway On-Ramp 39
5.6.3 Alternative 3: Alternatives 1 and 2 Combined............................ 39
5.7...... Effectiveness and Cost of the Improvements....................................... 39
5.7.1 HCS Analysis Results.......................................................... 39
5.7.2 VISSIM Simulation Results................................................... 42
5.7.3 Costs............................................................................... 42
Chapter 6—Conclusion and Next Steps......................................................... 45
Table 2 LOS Criteria for Basic Freeway, Merging/Diverging, and Weaving Segments. 19
Table 8 Location 2—I-93 Southbound at the End of the HOV Zipper Lane: 2030 Future LOS Analysis 41
Table 9 Location 2—I-93 Southbound at the End of the HOV Zipper Lane: Traffic Simulation Analysis 42
Figure 6 Location 2—I-93 Southbound at the End of the HOV Zipper Lane:.................. 51
Figure 9 Location 2—I-93 Southbound at the End of the HOV Zipper Lane: Congestion Scan 54
Appendix A: Review Comments and Selection Process
Appendix B: ATR and Classification Data
Appendix C: Crash Tables
Appendix D: HCS Printouts
This report summarizes the results of the analyses and improvement alternatives considered in the federal fiscal year 2019 study, Low-Cost Improvements to Express-Highway Bottleneck Locations. The report begins with background information and describes the purpose of the study, followed by the selection of study locations, an assessment of the safety and operational problems, and a discussion of the potential improvement strategies. The final section presents the study recommendations. The report concludes with technical appendices, which cite the study methods, describe how the data and analyses were applied, including detailed reports from the freeway merge and diverge analyses. If implemented, the report’s recommendations would not only result in improvements on the freeway facilities; they would improve traffic safety, make traffic operations more efficient, and reduce congestion at the bottlenecks.
According to the Federal Highway Administration (FHWA),
Much of the recurring congestion is due to physical bottlenecks—potentially correctible points on the highway system where traffic flow is restricted. While many of the nation’s bottlenecks can only be addressed through costly major construction projects, there is a significant opportunity for the application of operational and low-cost infrastructure solutions to bring about relief at these chokepoints.1
To be consistent with this guidance, the FHWA Massachusetts Division has recommended, as part of its comments on the Unified Planning Work Program process, that the Boston Region Metropolitan Planning Organization (MPO) identify the worst bottlenecks in the region that can be mitigated with low-cost countermeasures and develop recommendations for such countermeasures at these locations.
In general, recurring bottlenecks are influenced by the design or operation present at the point where the bottleneck begins; for example, at merge locations, diverges, lane drops, traffic weaving, and abrupt changes in highway alignment. In previous years, MPO staff analyzed several express-highway bottleneck locations in four consecutive studies, which were well received by the Massachusetts Department of Transportation (MassDOT) and the FHWA.2 ,3,4,5 Study locations included sections of Interstate 95 (I-95) in Burlington, Lexington, and Weston; sections of Interstate 93 (I-93) in Woburn; sections of Route 3 in Braintree; and sections of Route 24 in Canton and Randolph.
The MassDOT Highway Division has implemented many of the recommendations from those studies, and the FHWA has interviewed MPO staff about these successful implementations, including
The purpose of this study is twofold. First, the study aims to identify two bottleneck segments or points where low-cost mitigation improvements seem applicable. Second, the study aims to recommend low-cost mitigation improvements based on analysis of geometric design, traffic volumes and other data, and projected service performance associated with the improvements at each location.
Since 2011, the MPO has conducted four bottleneck studies in the Boston region to identify low-cost methods to reduce congestion, increase safety, and improve traffic operations. In the current study, MPO staff will rely on technical expertise regarding the nature of bottlenecks and will seek input from the MassDOT Highway Division staff, who are familiar with the region’s express-highway system operations, to develop and evaluate a comprehensive list of potential improvements at the bottleneck locations.
Chapter 2—Selection of Study Locations
To select the study locations, MPO staff had to first inventory and screen all candidate locations.6 MPO staff developed an initial list of candidate locations in the MPO region based on the following parameters:
Table 1 presents the inventory process, which yielded nine bottleneck locations in the Boston Region MPO area for screening.
Table 1
Inventory of Express-Highway Locations for Screening
Location Number |
City/Town |
MassDOT District |
Express-Highway Section |
Problem |
1 |
Wilmington |
4 |
I-93 northbound between Exit 40 (Route 62) and Exit 41 (Route 125) |
Merge and diverge |
2 |
Quincy and Braintree |
6 |
I-93 southbound at the end of the HOV zipper lane |
Merge and weave during the PM commute |
3 |
Medford |
4 |
I-93 southbound between Route 16 on-ramp and Exit 31 (Route 16 off-ramp) |
Weave |
4 |
Reading |
4 |
I-95 northbound between Exit 37 (I-93) and Exit 38 (Route 28) |
Weave |
5 |
Boston |
6 |
I-93 northbound at the end of the HOV zipper lane in Savin Hill |
Merge during the AM commute |
6 |
Boston |
6 |
I-90 westbound and eastbound (just west of Ted Williams Tunnel Portal) |
Westbound—diverge; Eastbound—merge |
7 |
Canton and |
6 |
I-93 northbound between Exit 1 (I-95) and |
Merge, diverge, and weave |
8 |
Canton and |
6 |
I-93 southbound between Exit 1 (I-95) and |
Merge, diverge, and weave |
9 |
Newton |
6 |
I-90 eastbound in Newton between Exit 16 and Exit 17 |
Merge, diverge, and weave |
Note: Shading indicates locations selected for study
HOV = high occupancy vehicle. I-93 = Interstate 93. I-95 = Interstate 95. MassDOT = Massachusetts Department of Transportation.
Source: Central Transportation Planning Staff
MPO staff used the following three criteria to screen the bottleneck locations:
Locations selected for study must meet these criteria and the number of locations selected for the study is dependent on allocated funding.
Based on the screening criteria and consultations with the MassDOT Highway Division officials, MPO staff selected location numbers 1 and 2 for study. Figure 1 shows the study locations.7 Although locations 3, 4, 5, 6, 7, and 8 met the screening criteria, MPO staff did not select them for this study due to funding concerns. However, MPO staff would consider these locations in a future bottleneck study. In addition, MassDOT is currently developing a project to address the bottleneck at Location 9. Appendix A contains comments about the study from the MassDOT Highway Division and a memorandum to the MPO that describes the selection process in detail.
This mile-long segment of highway (with four travel lanes) is a bottleneck because of merging and diverging activities, which causes congestion, especially during the PM peak periods. In the segment, there are two exit ramps and three entry ramps connecting Routes 62 and 125 to I-93. The ramps also carry high volumes of traffic because of office and industrial parks located off Route 125.
At both exits, the northbound ramps have approximately 500 vehicles per hour (vph) and 700 vph exiting I-93 northbound to Route 62 and Route 125 during the AM peak period, respectively, and about 700 vph and 1,000 vph during the PM peak period. During the same periods, the on-ramps from Route 62 and Route 125 to I-93 northbound receive about 500 vph and 300 vph during the AM period, respectively, and about 400 vph and 600 vph during the PM peak period.
This entering and exiting of traffic interacts with approximately 4,000 to 5,500 vph on the mainline during the AM peak period and approximately 7,000 to 7,500 vph during the PM peak period. The merging and diverging maneuvers in the vicinity creates a bottleneck that backs up traffic on the mainline.
This bottleneck is located on I-93 southbound at the end of the HOV zipper lane, where traffic exits the southbound HOV lane and then merges with the traffic on the mainline. The bottleneck occurs only during PM peak periods when the southbound HOV lane is in operation. Traffic from six lanes is forced onto a four-lane freeway segment. The reduction in the number of lanes, merging, diverging, and weaving of traffic, and the high number of lane-changing maneuvers to disperse traffic to continue on I-93 southbound or head to Route 3 southbound, dramatically reduces capacity in the segment, creating a bottleneck. During PM peak periods, about 5,100 to 5,500 vph pass through the bottleneck—600 vph from the Furnace Brook Parkway on-ramp, 3,500 vph in the four general-purpose lanes, and 1,000 vph in the HOV lane. Given an upstream traffic demand of 8,000 vph, which is far greater than the capacity of the bottleneck, a long traffic queue forms on the mainline, which extends five miles to Columbia Road in Dorchester.
Chapter 3—Data Collection and Uses
The MassDOT Highway Division’s Traffic Data Collection Program conducted automatic traffic recorder (ATR) counts for the ramps, freeways, and arterial roadways at the locations selected for study. The ATR counts traffic continuously for at least 48 hours. MPO staff used these counts to determine the average weekday traffic of a highway and operations performance. The traffic volume data are included in Appendix B. In addition, MassDOT collected turning movement counts (TMCs) for the signalized intersections at the ramp-arterial junction on Route 125. MassDOT performed TMCs during the weekday AM peak travel period (6:00 AM to 9:00 AM) and weekday PM peak travel period (3:00 PM to 6:00 PM).
MPO staff used crash data from January 2012 to December 2016 from the MassDOT’s Registry of Motor Vehicles database to evaluate safety for motorists. Crash data are included in Appendix C.
The CMP maintains average speed data on express-highway systems in the MPO region with use of the INRIX historical traffic speed data.8 MPO staff used the current speed data from the CMP (spring 2015 and fall 2015) to determine the average weekday travel speeds through the bottlenecks.
Level of service (LOS) is a quality measure describing operational conditions within a traffic stream, generally in terms of such service measures as speed and travel time, freedom to maneuver, traffic interruptions, and comfort and convenience. Factors influencing LOS are volume, lane width, lateral obstructions, traffic composition, grade, and speed. The Highway Capacity Manual (HCM) methodology demonstrates driving conditions on freeways in terms of LOS ratings from A through F.9 The LOS criteria characterize freeway performance measures in terms of density (passenger cars per lane mile, [pc/lane mile]). The LOS criteria has been developed for each freeway component—basic freeway, ramp merge/diverge, and weaving segments. The locations and traffic flow characteristics at each of the components are described below.
Table 2 shows the LOS criteria for basic freeway, merge/diverge, and weaving segments.
Table 2
LOS Criteria for Basic Freeway, Merging/Diverging, and Weaving Segments
|
Basic Freeway Segment |
Ramp Merge/Diverge and Weaving Segments |
LOS |
Density (pc/lane mile) |
Density (pc/lane mile) |
A |
0–11 |
0–10 |
B |
11–18 |
10–20 |
C |
18–26 |
20–28 |
D |
26–35 |
28–35 |
E |
35–45 |
>35 |
F |
>45 |
Demand exceeds capacity (V/C>1) |
LOS = level of service. pc/lane mile = passenger cars per lane mile. V/C = volume-to-capacity ratio.
Source: Highway Capacity Manual 2010.
LOS A represents the best operating conditions (unrestricted operations) while LOS F represents the worst operating conditions. LOS A through LOS D represent acceptable operating conditions. LOS E represents operating conditions at capacity. LOS F represents failing conditions (demand exceeds capacity).
The traffic operations analyses conducted by MPO staff were consistent with HCM methodologies. Using the data collected, MPO staff then built traffic analysis networks for the AM and PM peak hours using the 2010 Highway Capacity Software (HCS) to assess the capacity and quality of traffic flow at the two bottleneck areas.
Study location 1 is a stretch of I-93 northbound in Wilmington. Figure 1 shows the location of the bottleneck within the MPO region. The northbound off- and on-ramps connect to and from Route 62 (Salem Street) and Route 125 (Ballardvale Street), and a service plaza. The bottleneck conditions form primarily during the PM peak period, when high volumes of rush hour traffic heads northbound on I-93. This interchange and the roadways are under the jurisdiction of the MassDOT Highway Division, located in District 4.
Operations at this bottleneck are associated with the following freeway components.
The basic freeway section of I-93 northbound has four 12-foot travel lanes, a 12-foot right shoulder, and a 6-foot left shoulder. This section carries approximately 4,000 to 5,500 vph during the AM peak period and 7,000 to 7,500 vph during the PM peak period.10 The posted speed limit is 65 miles per hour (mph). Freeway exit signs are posted at one-mile and one-half-mile intervals to guide drivers to Routes 62 and 125.
The entrance ramp from Route 62 to I-93 northbound is a one-lane, one-way roadway. It carries about 250 to 450 vph during the AM peak period and 250 to 400 vph during the PM peak period. The length of the acceleration lane for traffic entering the section from Route 62 westbound is approximately 300 feet long, and the design speed of the entrance ramp is presumed to be 25 mph (no posted speed limits observed).11 Based on highway design and entrance ramp curve design speeds, the length of the acceleration lane does not meet MassDOT standards. The MassDOT Highway Division’s current Project Development and Design Guide specifies a minimum acceleration lane of 1,220 feet for a freeway facility with a design speed of 65 mph, an entrance ramp curve design speed of 25 mph, and a grade of two percent or less.12
The exit ramp from I-93 northbound to Route 125 is a one-way, one-lane roadway that gradually widens and splits into two approaches to connect Route 125 eastbound and westbound at the end of the ramp. The Route 125 eastbound (right-turn) approach has two lanes and the Route 125 westbound (left-turn) approach has only one lane, and the intersection is signalized. The ramp carries about 500 to 850 vph during the AM peak period and about 750 to 1,050 vph during the PM peak hour.
The length of the deceleration lane is approximately 400 feet long and the posted speed limit on the exit ramp is 30 mph. Based on highway design and exit ramp curve design speeds, the length of the deceleration lane is insufficient to meet the MassDOT design standards. The MassDOT Project Development and Design Guide specifies a minimum deceleration length of 440 feet for a freeway facility with a design speed of 65 mph, an exit ramp curve design speed of 35 mph, and a grade of two percent or less. The deceleration lane is the parallel type (at least half the length of the deceleration lane is parallel with the mainline) as recommended by the MassDOT design guide.
The exit ramp at Route 125 is signalized as part of a coordinated system that includes the traffic signals at I-93 southbound exit ramp and at Ballardvale Street. It is essential to ensure that traffic operations at the interchange would not cause traffic backup on the off-ramp into the I-93 northbound mainline, especially in the PM peak period when the ramp carries a high volume of traffic.
MPO staff conducted intersection capacity analyses and traffic simulations for the three intersections on Route 125 by using the Synchro traffic analysis and simulation program.13 The PM peak hour analyses indicate that both intersections at the interchange operate at a desirable LOS A, and the intersection of Route 125 at Ballardvale Street operates at an acceptable LOS D. At the I-93 northbound off-ramp and Route 125 intersection, the off-ramp is evaluated to operate at LOS C, with an average queue length of about 100 feet and an estimated 95th percentile queue length of about 150 feet14. Traffic simulation runs showed no traffic queues from the ramp backing up into the I-93 northbound travel lanes.
The existing bottleneck creates an intense interruption of traffic flow primarily during PM peak travel periods, experienced by virtually all drivers in this section. Meanwhile, traffic on I-93 northbound is already congested during the same travel periods, due to a lane-drop bottleneck on the I-93 mainline about 1.2 miles downstream from this location.15 Travel speeds on the freeway mainline in this section usually reduce to under 55 mph during the PM peak period. In addition, staff identified a number of crashes on I-93 northbound from Exit 40 to Exit 41, especially in the diverge area of the exit ramp to Route 125.
The following factors contribute to traffic congestion in this I-93 northbound section:
Figure 2 shows the traffic flows during the AM and PM peak periods. In the AM peak period (6:00–10:00), the I-93 mainline and the entrance and exit ramps generally carry moderate traffic volumes and do not cause serious traffic congestion. However, in the PM peak period (3:00–7:00), the I-93 mainline and the exit ramp carry high traffic volumes, causing traffic congestion at this bottleneck location.
The short acceleration lane for the traffic entering I-93 northbound from Route 62 forces drivers to merge quickly and does not give them the distance needed to reach safe freeway speeds. Meanwhile, the merging maneuver is difficult during the PM peak period due to the congested conditions on the freeway mainline. The merging operation slows down I-93 mainline traffic, affecting traffic flow upstream from the merge location.
Although the acceleration lane for the exit ramp to Route 125 is just short of MassDOT design standards, it carries a high volume of traffic during the PM peak hours. Under the congested conditions, drivers usually experience delays in reaching the exit ramp and occasionally some drivers would use the breakdown lane to access the ramp.
I-93 northbound reduces from four to three travel lanes about 1.2 miles downstream from this section. During the PM peak travel periods, traffic queues from the downstream bottleneck location frequently spill back into this section, increasing difficulties for the merging and diverging operations.
Table 3 presents a summary of the crashes in this segment. There were 102 crashes in this area based on MassDOT crash data from 2012–16. Figure 3 shows the location of these crashes. The majority of crashes (69 crashes to be exact) occurred near the off-ramp at Exit 41.
Table 3
Crash Summary (2012–16): Location 1—I-93 Northbound between Exit 40 (Route 62) and Exit 41 (Route 125)
Crash Variable |
Number of Crashes |
Crash severity |
|
Property damage only (none injured) |
69 |
Non-fatal injury |
31 |
Not reported |
2 |
Fatal injury |
0 |
Manner of collision |
|
Rear-end |
57 |
Single vehicle crash |
25 |
Angle |
9 |
Sideswipe, same direction |
11 |
Sideswipe, opposite direction |
0 |
Head-on |
0 |
Not reported |
0 |
Road surface conditions |
|
Dry |
89 |
Wet |
9 |
Snow/Ice |
4 |
Unknown |
0 |
Ambient light conditions |
|
Daylight |
79 |
Dark—roadway not lighted |
17 |
Dark—lighted roadway |
4 |
Dusk |
2 |
Dawn |
0 |
Not reported |
0 |
Weather conditions |
|
Clear |
66 |
Cloudy |
17 |
Unknown |
11 |
Rain |
5 |
Snow |
3 |
Travel period |
|
38 |
|
Other |
64 |
Total crashes |
102 |
Note: The weekday evening peak period is 3:00 PM to 7:00 PM from Monday through Friday.
Source: Central Transportation Planning Staff.
A summary of the crashes in this segment are as follows:
Figure 4 is a congestion scan that covers the I-93 northbound stretch about three miles upstream and downstream of this study location. It shows the average travel speeds on I-93 northbound from the Concord Road interchange (Exit 39) to the Dascomb Road interchange (Exit 42). The 2015 spring and fall midweek Tuesday to Thursday travel time data (provided by INRIX) were used for this analysis.16
Travel speeds at the study location, in most cases, reduce to under 55 mph from 2:45 PM to 3:15 PM and from 4:30 PM to 6:00 PM. Travel speeds during the AM peak are less affected, and remain greater than 55 mph. The congestion scan shows that the downstream lane drop location (approximately at the 36.5-mile marker) is actually a more severe bottleneck than this study location. Travel speeds generally reduce to under 45 mph from 2:30 PM to 3:30 PM and from 4:30 PM to 6:00 PM. Field observations indicate that I-93 northbound traffic queues frequently extend from this location to the vicinity of the Route 62 interchange. The congestion scan also shows an interesting dual-peak phenomenon (2:30–3:30 PM and 4:30–6:00 PM) at the lane-drop bottleneck location. It is a combined effect of the lane drop bottleneck and the travel demand management strategy (use of the shoulder as a travel lane during the PM peak period), currently applied to the I-93 sections downstream use of the breakdown lane.
During the weekday PM period from 3:00 to 7:00, travel in the I-93 northbound breakdown lane is permitted beginning approximately a quarter mile north of the lane drop all the way to the north side of Merrimack River before Exit 46. The first wave of congestion begins around 2:30 PM when I-93 traffic gradually increases but travel in the breakdown lane is prohibited. After 3:00 PM, when travel in the breakdown lane is permitted, traffic congestion gradually dissipates. The severe congestion begins after 4:00 PM, and peaks around 5:30 PM. The congestion gradually dissipates after 6:00 PM, when the I-93 northbound sections carry most commuter traffic heading home in the north.
MPO staff conducted traffic operations analyses consistent with HCM methodologies. Using data from MassDOT, MPO staff built traffic analysis networks for the AM and PM peak hours with the HCS suite to assess the capacity and quality of traffic flow at the bottleneck area.17 Full HCS reports are included in Appendix D.
Table 4 presents the results of the LOS analyses for existing conditions at Location 1. It contains the HCM merging and diverging analyses. The section between the merge area and diverge area was not analyzed as a basic freeway section because it is shorter than 1,000 feet and it is entirely within the merge and diverge influence areas.18
Table 4
LOS Analysis–Existing Conditions: Location 1—I-93 Northbound between Exit 40 (Route 62) and Exit 41 (Route 125)
Location |
Peak Hour |
Density (pc/lane mile) |
Speed (mph)a |
V/C Ratiob |
LOSc |
HCM Analysis Type: Merge Aread |
-- |
-- |
-- |
-- |
-- |
AM |
24.4 |
62.1 |
0.64 |
C |
|
Ramp from Route 62 |
PM |
30.8 |
59.9 |
0.88 |
D |
HCM Analysis Type: Diverge Area |
-- |
-- |
-- |
-- |
-- |
AM |
27.1 |
55.3 |
0.64 |
C |
|
Exit 41 to Route 125 |
PM |
36.9 |
54.4 |
0.88 |
E |
a Refers to ramp influence area speed for merge/diverge areas.
b Refers to the freeway section’s volume-to-capacity ratio.
c LOS A through LOS D represent acceptable operating conditions; LOS E represents operating conditions at capacity; and LOS F represents failing conditions (demand exceeds capacity).
d In HCM merge and diverge analyses, acceleration and deceleration lanes are measured from the tip of the painted gore to the end of the taper. This may differ from the AASHTO length. AASHTO, or The American Association of State Highway Transportation Officials, is a nonprofit, nonpartisan association representing highway and transportation departments in the 50 states, the District of Columbia, and Puerto Rico. It represents all transportation modes, including air, highways, public transportation, active transportation, rail, and water. Its primary goal is to foster the development, operation, and maintenance of an integrated national transportation system.
HCM = Highway Capacity Manual. LOS = level of service. mph = miles per hour. pc/lane mile = passenger cars per lane mile. V/C = volume-to-capacity. vph = vehicles per hour.
Table 4 illustrates that both areas operate at LOS C during the AM peak hour, while the merge area operates at LOS D and the diverge area operates at LOS E during the PM peak hour. The PM peak-hour analysis shows that the diverge area has a high density of vehicles, causing delay for the traffic exiting to Route 125. Traffic congestion on I-93 northbound mainline frequently builds up from the downstream lane-drop location to the vicinity of this location, adding difficulties to the diverge operation. In addition, the estimated freeway speeds in the PM peak hour could be somewhat higher than the observed speeds (see Figure 4), as the downstream bottleneck congestion is not applicable to the HCM analyses.
The analyses identified that the on-ramp acceleration length and the off-ramp deceleration length do not meet MassDOT standards. A simple solution could be to extend their lengths; however, it would not be suitable at this location. As the two ramps are located in close proximity (about 1,600 feet), further extending the acceleration or deceleration length and reducing the space in between would potentially increase crash risk.19,20 The analyses also identified that one of the key problems at this location is the I-93 mainline congestion, causing difficulties for the merge and diverge maneuvers. However, this congestion is mainly due to the downstream lane drop bottleneck.
Under these conditions, there are not many applicable low-cost improvement alternatives. However, MPO staff developed two improvement alternatives to address safety and operational issues at this location. These improvements include:
An auxiliary laneis defined as the portion of the roadway adjoining the traveled freeway for speed change, merging, diverging, weaving, and other purposes supplementary to through-traffic movement. Alternative 1 would create an auxiliary lane between the on-ramp at Exit 40 and the off-ramp at Exit 41. This lane would extend the distance available for merging or diverging traffic maneuvers and would provide sufficient distance to accommodate speed changes and vehicle weaving. The auxiliary lane would also upgrade the acceleration lane to meet MassDOT standards.
Figure 5 shows the improvements recommended in Alternative 1, including:
Although improvements could be made, Alternative 1 does present some design difficulties. First, the less-than-minimal right shoulder areas would require a design exception report. When conditions warrant, a design exception may be granted for a project design that proposes one or more controlling substandard design elements if it can be documented that a lesser design is the best practical alternative. Second, while the paved shoulder along this stretch of highway is wide enough to accommodate an extra travel lane, it is not wide enough to fit an additional emergency pullover or stopping area. Any such area would require additional paving and grading work due to a moderate slope to the right of the roadway.
This study identified that traffic congestion at this bottleneck location is mainly caused by a downstream bottleneck where the I-93 northbound mainline reduces from four to three lanes. Traffic operations at this location would be improved if the congested conditions from the downstream bottleneck can be substantially decreased. One possible solution is to open up the breakdown lane for travel earlier downstream of the bottleneck. Based on observations throughout the region, it is acknowledged that the peak congestion periods are expanding, so opening the breakdown lane may help to alleviate this bottleneck. However, this solution is beyond the scope of the current study.
Table 5 presents the 2030 future LOS analyses compiled using HCS software, and compares the results from the no-build scenario and Alternative 1, where modifications would affect system operations. Full HCS reports are included in Appendix D. All scenarios use a uniform four percent growth for 2030 traffic volumes estimated based on the MPO regional travel demand model for this study area. Alternative 2 is a proposed future study and therefore, not included in Table 5. Approximations made as part of the HCM analysis are provided when applicable.
Table 5
2030 LOS Analysis–No-Build and Improvement Alternative 1 for Location 1—I-93 Northbound between Exit 40 (Route 62) and Exit 41 (Route 125)
Scenario and HCM Analysis Type |
Peak Hour |
Density (pc/lane mile) |
Speed (mph)a |
V/C Ratiob |
LOSc |
No-Build: Merge Area HCM Analysis |
-- |
-- |
-- |
-- |
-- |
Ramp from Route 62 |
AM |
25.3 |
61.9 |
0.67 |
C |
Ramp from Route 62 |
PM |
32.2 |
59.1 |
0.92 |
D |
No-Build: Diverge Area HCM Analysis |
-- |
-- |
-- |
-- |
-- |
Exit 41 to Route 125 |
AM |
28.3 |
55.1 |
0.67 |
D |
Exit 41 to Route 125 |
PM |
38.5 |
54.3 |
0.92 |
E |
Alternative 1: Weaving Segment HCM Analysis |
-- |
-- |
-- |
-- |
-- |
I-93 northbound between Exit 40 and Exit 41 |
AM |
21.9 |
57.2 |
0.61 |
C |
I-93 northbound between Exit 40 and Exit 41 |
PM |
32.3 |
53.6 |
0.83 |
D |
a Refers to ramp influence area speed for merge/diverge areas and average of weaving and non-weaving speeds for the weaving segment.
b Refers to the freeway section’s volume-to-capacity ratio.
c LOS A through LOS D represent acceptable operating conditions; LOS E represents operating conditions at capacity; and LOS F represents failing conditions (demand exceeds capacity).
HCM = Highway Capacity Manual. LOS = level of service. mph = miles per hour. pc/lane mile = passenger cars per lane mile. V/C = volume-to-capacity. vph = vehicles per hour.
A crash modification factor (CMF) is an estimate of the change in crashes expected after the implementation of a countermeasure. Using CMFs from the HSM and the CMF Clearinghouse show that adding continuous auxiliary lanes for weaving between the entrance ramp and the exit ramp would reduce crashes by 20 to 25 percent.21,22 In addition, the LOS for Exit 41 would improve from D to C during the AM peak and from E to D during the PM peak by lengthening the acceleration lane. However, the merge from Route 62 would remain at LOS C in the AM peak and LOS D in the PM peak.
MPO staff recommends Alternative 1 because of the beneficial effects on safety and operational efficiency. Alternative 1 provides more space for entering and exiting traffic to move to and from the mainline travel lanes and would potentially reduce crashes in this I-93 northbound section. In addition, staff recommends studying possible alternatives, similar to those presented in Alternative 2, as a proposed future study for the I-93 northbound lane drop bottleneck about 1.2 miles downstream from this location. Traffic operations and crash risk at this location would be greatly improved if the congested conditions from the downstream bottleneck could be substantially decreased.
Chapter 5—Location 2: I-93 Southbound Segment at the End of the HOV Zipper Lane in Quincy and Braintree
The affected segment, approximately 0.8 miles long, extends from the beginning of Furnace Brook Parkway on-ramp at Exit 7 to the Route 3 diverge at Exit 8. The interchange and freeway, which are located in District 6, are under the jurisdiction of the MassDOT Highway Division. Figure 1 shows the location of the bottleneck within the MPO region. It is located on the I-93 southbound barrel at the end of the HOV zipper lane. The bottleneck occurs during PM peak southbound HOV lane operations, which begins at 3:00 PM and ends at 7:00 PM. This bottleneck is where traffic merges and weaves in order to continue onto I-93 southbound or Route 3 southbound. It is also where the on-ramp from Furnace Brook Parkway merges onto I-93 southbound. Just 0.4 miles north of the end of the HOV zipper lane exit, traffic heading to Route 3 southbound diverges off I-93.
The basic freeway section is about 1,000 feet long when the HOV lane is in operation. It has four 12-foot travel lanes, and an 11- to 12-foot right shoulder. There is no left shoulder at this section because of HOV lane operations during peak travel periods and storage of the zipper barriers during off-peak travel periods.
There are two ramp merge areas relevant to this bottleneck location: the on-ramp from Furnace Brook Parkway and the HOV lane exit. Furnace Brook Parkway is a one-lane, on-ramp with an 800-foot acceleration lane.23 Traffic in the HOV lane exits and merges with the mainline traffic about 200 feet north of Furnace Brook Parkway. The exit and merge area of the HOV is about 1,000 feet long.
The Exit 7 connector to Route 3 southbound is a two-lane major diverge with design speed similar to that of the freeway. It is important to note that downstream bottlenecks on Route 3 southbound during the PM peak travel period create a traffic queue that extends into the subject bottleneck and exacerbates traffic conditions.
The existing bottleneck creates a recurring long traffic queue on the mainline, which extends five miles northerly to Columbia Road in Dorchester. It reduces traffic flow to stop-and-go conditions with average travel speeds of less than 25 mph, even though the posted speed limit is 55 mph. In addition, the congested conditions lead to many crashes, pollution, and high person-hours of delay.
Physical design constraints and operational conflicts inherent in the location create the bottleneck, including the following:
At the bottleneck, traffic from six lanes (four on the mainline and one each on the HOV lane and the on-ramp from Furnace Brook Parkway) are forced onto four travel lanes in a short segment about 1,500–2,000 feet long. In addition, a high number of lane-changing maneuvers (merging, weaving, and diverging) take place within the segment to disperse traffic to continue on I-93 southbound or head to Route 3 southbound. These factors along with the close proximities of the merge and diverge areas dramatically reduce capacity in the segment.
Figure 6 shows the PM peak-period traffic volumes. During this period, when the HOV lane is in operation, the entry ramp from Furnace Brook Parkway serves about 600 vph while the HOV lane serves an average of 1,200 vph. The mainline serves about 3,500 vph. Traffic data are included in Appendix B.
In all, the bottleneck serves between 5,200 vph and 5,400 vph while the traffic demand is around 8,000 vph during PM peak periods. This suggests that traffic demand at the bottleneck greatly exceeds the capacity and results in a long traffic queue trailing the bottleneck for over five miles to Columbia Road in Dorchester. Interestingly, between 2:00 PM and 3:00 PM when the HOV is not in operation, the four I-93 southbound lanes carry around 6,000 vph, which is even greater than the volume when the HOV lane is operation.24
Over the years, there have been several lane reconfigurations at the bottleneck to address safety operations and safety issues. The current configuration started in 2014. Before that, the mainline had the same four lanes; however, about 1,000 feet to the diverge to Route 3 southbound, the lane next to the rightmost lane widened to about 22 feet, which was used as a shared lane for traffic heading to either Route 3 southbound or continuing on I-93 southbound. In effect, three lanes headed to Route 3 southbound and two lanes went to I-93 southbound.
Assessment of the current configuration indicates that it reduces the lane changing maneuvers at the bottleneck and streamlines traffic heading to Route 3 southbound in anticipation of downstream bottlenecks. While the current configuration has safety benefits, a tradeoff to this may be reduced traffic flow.
Table 6 presents a summary of the crashes at the bottleneck. There were 132 crashes in this section between 2012 and 2016 (Appendix C). Figure 7 shows the location of these crashes. The majority, 108 of the crashes, occurred near the diverge area at Exit 7. Interestingly, the number of crashes between 2012 and 2016 (132 crashes) represent a 10 percent reduction to the five-year total between 2005 and 2009 (146 crashes). This suggests that the change in lane configuration around 2013 significantly influenced crash frequency. Figure 8 shows the location of the 31 crashes that occurred in the same period when the HOV lane is in operation, which represents 23 percent of the crashes.
Table 6
Location 2—I-93 Southbound at the End of the HOV Zipper Lane: Five-Year Crash Summary (2012–16)
Crash Variable |
All Crashes |
Peak-Period Crashes |
Crash severity |
¾ |
|
Non-fatal injury |
37 |
4 |
Property damage only (none injured) |
90 |
26 |
Not reported |
5 |
1 |
Manner of collision |
¾ |
|
Rear-end |
71 |
22 |
Single vehicle crash |
24 |
2 |
Sideswipe, same direction |
22 |
4 |
Angle |
13 |
2 |
Not reported |
2 |
1 |
Road surface conditions |
¾ |
|
Dry |
109 |
27 |
Wet |
18 |
3 |
Snow/Ice |
4 |
0 |
Unknown |
1 |
1 |
Ambient light conditions |
¾ |
|
Daylight |
85 |
25 |
Dark—lighted roadway |
45 |
5 |
Not reported |
1 |
1 |
Dark–roadway not lighted |
1 |
0 |
Weather conditions |
¾ |
|
Clear |
91 |
24 |
Cloudy |
15 |
1 |
Unknown |
11 |
4 |
Rain |
11 |
2 |
Snow |
4 |
0 |
Travel period |
¾ |
|
Weekday evening peak period |
31 |
31 |
Other |
101 |
0 |
Total crashes |
132 |
31 |
Note: Weekday evening peak period is 3:00 PM to 7:00 PM Monday through Friday.
Source: Central Transportation Planning Staff.
A summary of the crashes in this segment are as follows:
Figure 9 is a congestion scan that shows the average travel speeds on I-93 southbound at the bottleneck. Based on these data, the bottleneck reduces travel speeds to less than 25 mph between the hours of 3:00 PM and 7:00 PM. Vehicle speeds this far below free-flow speed correlate with LOS F conditions on the freeway. In addition, speeds at this bottleneck can fall to less than 25 mph and stay that low for two to three hours. The congestion scan also shows severe slowdowns (queue) trailing the bottleneck. The gradual relief after the bottleneck suggests that the HOV lane merge and Furnace Brook Parkway on-ramp merge are not the only causes of congestion, and that more issues are present further downstream on I-93 southbound and Route 3 southbound.
Traffic operations at the bottleneck are complex as merging, diverging, and weaving maneuvers all take place within the segment at the same time. MPO staff conducted traffic operations analyses consistent with HCM methodologies. Using the MassDOT data, MPO staff built traffic analysis networks for the PM peak hours with the HCS suite to assess the capacity and quality of traffic flow at the bottleneck area.25 The analyses included
The HCM methodology has some limitations concerning weaving analysis, as it does not address the following conditions, which exist at the bottleneck, such as:
Some simplifications were necessary to align the HCS model with observed conditions, such as the breaking up of multiple weave segments into merge and simple weave segments for analysis.
Table 7 presents the results of the LOS analyses for existing conditions. The results indicate that traffic in the HOV lane and Furnace Brook Parkway on-ramp operate at LOS D when they merge with the mainline traffic. In addition, the analyses indicate that traffic operating conditions at the weaving segment (where traffic weaves from the HOV lane, Furnace Brook Parkway on-ramp, and the freeway onto Route 3 southbound and I-93 southbound) is LOS F. Full HCS reports are included in Appendix D.
Based on these analyses, the primary cause of the bottleneck is intense weaving due to a lack of lane balance rather than merging or diverging conditions. The volume-to-capacity (v/c) ratios for the weaving segment was 1.4, meaning that the traffic demand is higher than maximum throughput of the weave segment with the given features. HCS suite does not provide density and speed data for scenarios that result in LOS F or have a v/c greater than 1.0.
Table 7
Location 2—I-93 Southbound at the End of the HOV Zipper Lane: Existing Conditions LOS Analysis
Analysis Type |
Density a (pc/lane mile) |
Speed a (mph)f |
V/C Ratiob |
LOSc |
|
HOV lane merge |
Merge |
38.4 |
48.7 |
0.84 |
D |
Furnace Brook Parkway on-ramp merge |
Merge |
42.7 |
49 |
0.93 |
D |
Weaving from HOV lane to Route 3 southbound (one-sided) |
Weave |
-- |
-- |
1.41 |
F |
Weaving from Furnace Brook Parkway to I-93 southbound (one-sided) |
Weave |
-- |
-- |
1.21 |
F |
Weaving from HOV lane to I-93 southbound (two-sided) |
Weave |
-- |
-- |
0.85 |
F |
Weaving from Furnace Brook Parkway to Route southbound (two-sided) |
Weave |
36 |
47 |
0.78 |
E |
a HCM does not provide density and speed data for scenarios that result in LOS F.
b Refers to the freeway section’s v/c ratio.
c LOS A through LOS D represent acceptable operating conditions; LOS E represents operating conditions at capacity; and LOS F represents failing conditions (demand exceeds capacity).
HCM = Highway Capacity Manual. HOV = high-occupancy vehicles. LOS = level of service. mph = miles per hour. pc/lane mile = passenger cars per lane mile. v/c = volume-to-capacity. vph = vehicles per hour.
Source: Central Transportation Planning Staff.
All three alternatives have the objective of lengthening the merging and weaving segments to give drivers more space to carry out their intended maneuvers.
Alternative 1 would move the HOV exit about 600 feet further north to lengthen the distance in which HOV traffic merges with the mainline traffic. The extension is expected to provide HOV lane drivers with ample distance for merging and weaving safely and comfortably to continue on I-93 southbound and Route 3 southbound. Figure 10 shows the improvements recommended in Alternative 1.
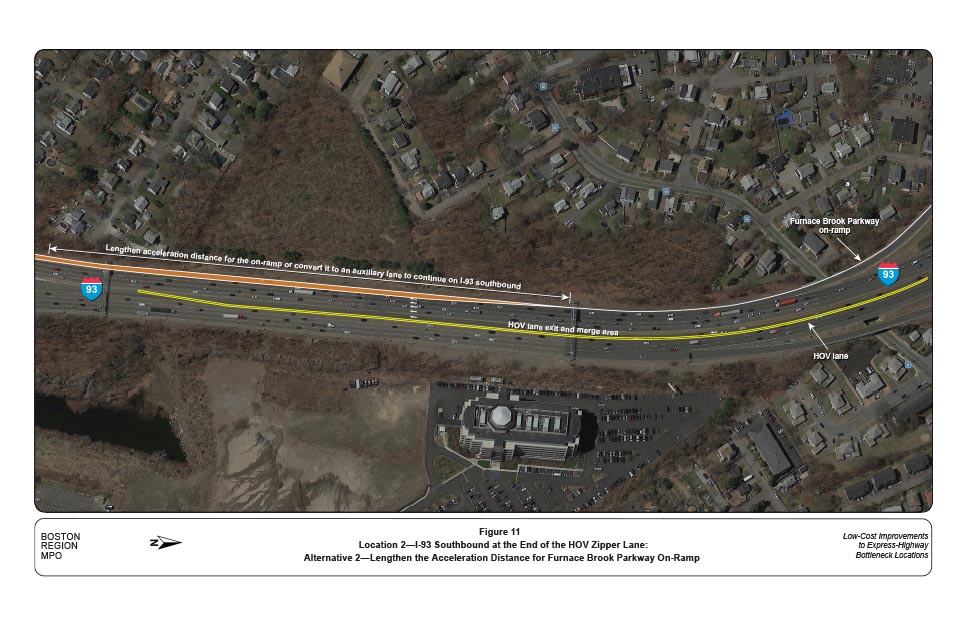
Figure 11 shows the improvements recommended in Alternative 2. Alternative 2 would extend the acceleration lane distance for the Furnace Brook Parkway on-ramp about 600 feet using the existing right shoulder. An 11- to 12-foot right shoulder exists along the entire length of the bottleneck.
Alternative 3 combines the improvement recommendations of both Alternatives 1 and 2 for added benefits.
Table 8 presents the results of the 2030 LOS analyses compiled using the HCS suite. The HCS analyses results show marginal benefits with the recommended improvements but does not appear to reduce the impacts of intense weaving at the bottleneck, resulting in a LOS F for all weaving analyses.
Table 8
Location 2—I-93 Southbound at the End of the HOV Zipper Lane: 2030 Future LOS Analysis
Scenario |
Analysis Type |
Density a (pc/lane mile) |
Speed a (mph)f |
V/C Ratiob |
LOSc |
HOV lane merge |
-- |
-- |
-- |
-- |
-- |
Existing |
Merge |
38.4 |
48.7 |
0.84 |
D |
Alternative 1 |
Merge |
38.6 |
49.7 |
0.86 |
D |
Alternative 2 |
Merge |
39.2 |
48.6 |
0.86 |
D |
Alternative 3 |
Merge |
38.6 |
49.7 |
0.86 |
D |
Furnace Brook Parkway on-ramp merge |
|
|
|
|
|
Existing |
Merge |
42.7 |
49 |
0.93 |
D |
Alternative 1 |
Merge |
43.4 |
49 |
0.94 |
D |
Alternative 2 |
Merge |
43.2 |
50 |
0.94 |
C |
Alternative 3 |
Merge |
43.2 |
50 |
0.94 |
C |
Weaving from HOV lane to Route 3 southbound (one-sided) |
|
|
|
|
|
Existing |
Weave |
-- |
-- |
1.41 |
F |
Alternative 1 |
Weave |
-- |
-- |
1.42 |
F |
Alternative 2 |
Weave |
-- |
-- |
1.42 |
F |
Alternative 3 |
Weave |
-- |
-- |
1.41 |
F |
Weaving from Furnace Brook Parkway on-ramp to I-93 southbound (one-sided) |
|
|
|
|
|
Existing |
Weave |
-- |
-- |
1.21 |
F |
Alternative 1 |
Weave |
-- |
-- |
1.27 |
F |
Alternative 2 |
Weave |
-- |
-- |
1.27 |
F |
Alternative 3 |
Weave |
-- |
-- |
1.27 |
F |
Weaving from HOV lane to I-93 southbound (two-sided) |
|
|
|
|
|
Existing |
Weave |
-- |
-- |
0.85 |
F |
Alternative 1 |
Weave |
-- |
-- |
0.83 |
F |
Alternative 2 |
Weave |
-- |
-- |
0.87 |
F |
Alternative 3 |
Weave |
-- |
-- |
0.83 |
F |
Weaving from HOV lane to I-93 southbound (two-sided) |
|
|
|
|
|
Existing |
Weave |
36.0 |
47 |
0.78 |
E |
Alternative 1 |
Weave |
37.6 |
40 |
0.78 |
E |
Alternative 2 |
Weave |
37.6 |
40 |
0.78 |
E |
Alternative 3 |
Weave |
37.6 |
40 |
0.78 |
E |
a HCM does not provide density and speed data for scenarios that result in LOS F.
b Refers to the freeway section’s volume-to-capacity ratio.
c LOS A through LOS D represent acceptable operating conditions; LOS E represents operating conditions at capacity; and LOS F represents failing conditions (demand exceeds capacity).
HCM = Highway Capacity Manual. HOV = heavy-occupancy vehicle. LOS = level of service. mph = miles per hour. pc/lane mile = passenger cars per lane mile. v/c = volume-to-capacity. vph = vehicles per hour.
Source: Central Transportation Planning Staff.
In addition to the HCS suite, MPO staff used VISSIM traffic simulation software to analyze future traffic operations at the bottleneck.26 Due to the complex nature of the bottleneck and limitations of the HCS analyses, VISSIM was used to account for all the maneuvers at the bottleneck simultaneously. Table 9 presents the results of the VISSIM analyses for the existing conditions and improvement alternatives. The primary performance measure in the simulation analysis was the total volume of traffic simulated through the bottleneck—the higher the total volume, the more effective the alternative. The results show that separately, Alternatives 1 and 2 would have minimal effect on the bottleneck and the trailing queue. VISSIM simulations show that while Alternative 3 may improve traffic operations at the bottleneck to some extent, it would not be able to reduce the trailing traffic queue significantly.
Table 9
Location 2—I-93 Southbound at the End of the HOV Zipper Lane: Traffic Simulation Analysis
Scenario |
Total Volume Simulated (vph) |
Average Speed (mph) |
Existing |
5,300 |
19 |
Alternative 1 |
5,500 |
22 |
Alternative 2 |
5,400 |
20 |
Alternative 3 |
5,900 |
23 |
HOV = high-occupancy vehicle. mph = miles per hour. vph = vehicles per hour.
Source: Central Transportation Planning Staff.
Alternative 1 is estimated to cost between $300,000 and $500,000 to construct. This estimate includes the relocation of existing median barriers, preparing the median area for staging HOV operations, restriping travel lanes, and the relocation and installation of signs and pavement markings.
Alternative 2 is estimated to cost between $100,000 and 300,000 to construct, and would require restriping travel lanes, possibly repaving, relocating rumble strips, creating an emergency pullover lane, and drainage systems.
Alternative 3 is estimated to cost about $1.0 million to construct, and includes all of the same items listed for Alternatives 1 and 2.
MPO staff recommends Alternative 1, as it produces safety and operational benefits.
The HOV lane is a contra-flow reversible lane meaning that a lane is borrowed from the off-peak direction to serve the peak direction. The HOV lane heads northbound in the morning peak period using a lane borrowed from the southbound direction, and in the afternoon peak period, that operation is reversed. Both the morning and afternoon HOV operations share a common space for staging and operations. Because of the shared space, the space requirements for the proposed improvements would need further evaluation regarding HOV staging and operations for the morning northbound HOV operations. MPO staff advises further consultation with personnel involved with HOV lane operations and maintenance.
Alternative 2 would have operational improvements during the PM peak period; however, it would also eliminate the existing shoulder for disabled vehicles. Another concern with Alternative 2 is that drivers would choose to enter the longer acceleration lane to "bypass" slow traffic in the general travel lanes. For these concerns, MPO staff cannot recommend Alternatives 2 and 3 without further assessment of safety and operational effects.
Chapter 6—Conclusion and Next Steps
MPO staff, working in conjunction with the MassDOT Highway staff, identified, developed, and evaluated improvements for two bottleneck locations in the MPO region. The study provides the MassDOT Highway Division with an opportunity to assess the most critical needs at the two bottleneck locations and to start planning design and engineering efforts. If implemented, these low-cost, short-term improvements would increase traffic safety, make traffic operations more efficient, and reduce congestion at the bottlenecks. The study aligns with the MPO’s goals of managing capacity and improving mobility, and increasing safety on the region’s highway system.
Figure 1
Regional Map of Study Areas
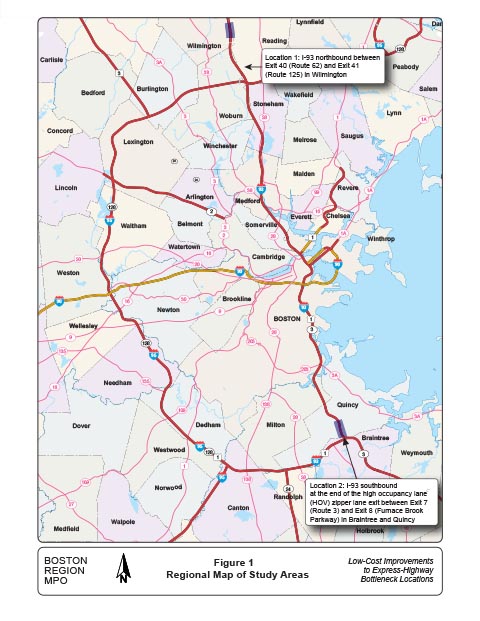
Figure 2
Location 1—I-93 Northbound between Exit 40 (Route 62) and Exit 41 (Route 125): Peak Period Traffic Volumes
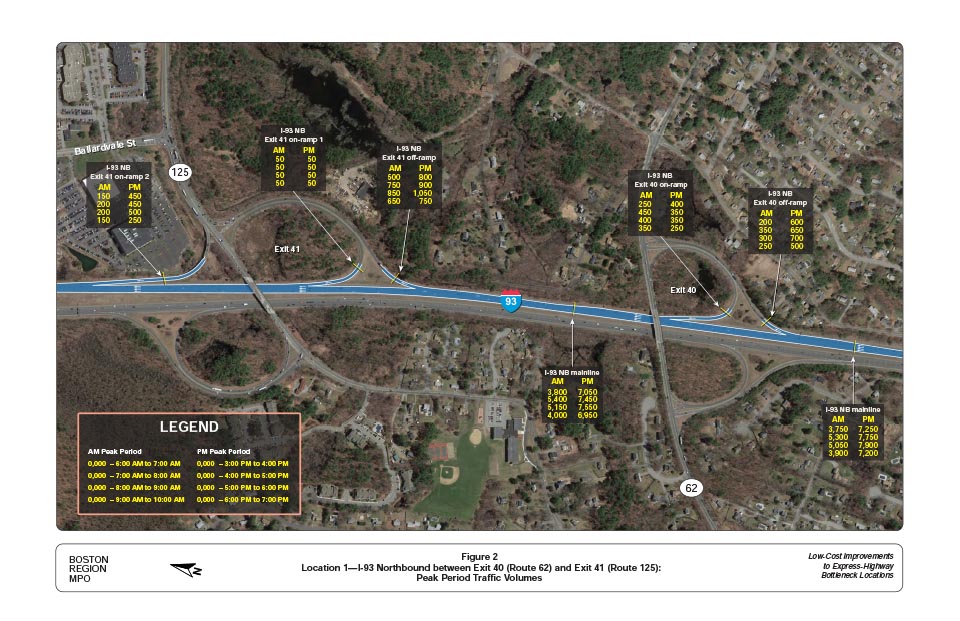
Figure 3
Location 1—I-93 Northbound between Exit 40 (Route 62) and Exit 41 (Route 125): Location and Number of Crashes
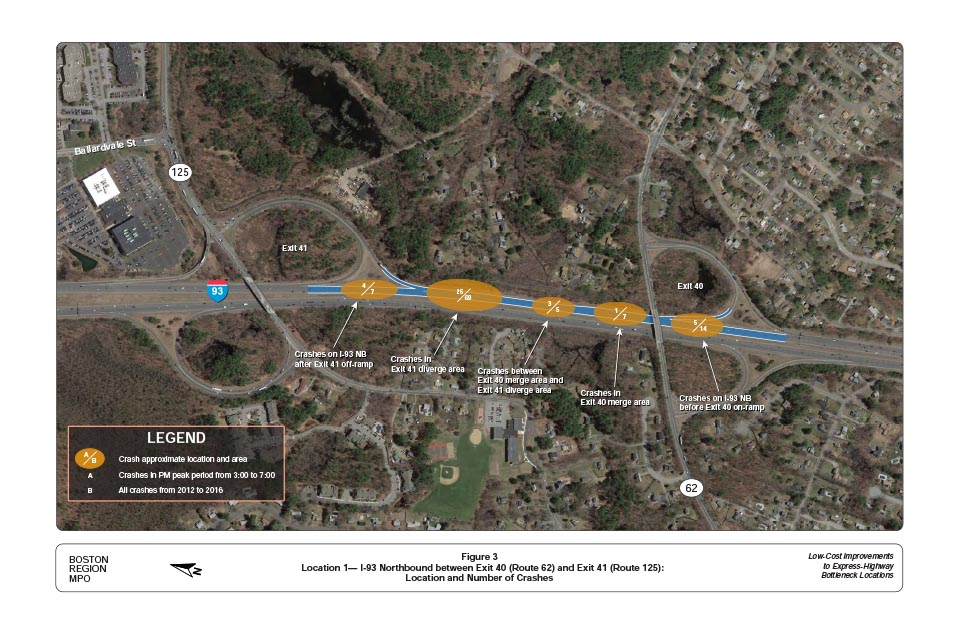
Figure 4
Location 1—I-93 Northbound between Exit 40 (Route 62) and Exit 41 (Route 125): Congestion Scan
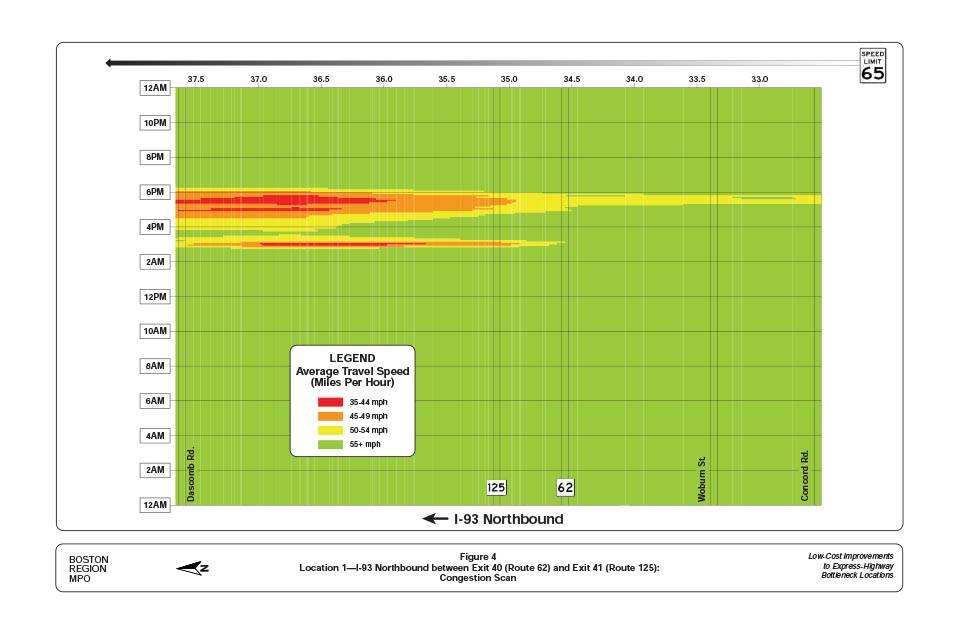
Figure 5
Location 1—I-93 Northbound between Exit 40 (Route 62) and Exit 41 (Route 125): Alternative 1—Create Auxiliary Lane
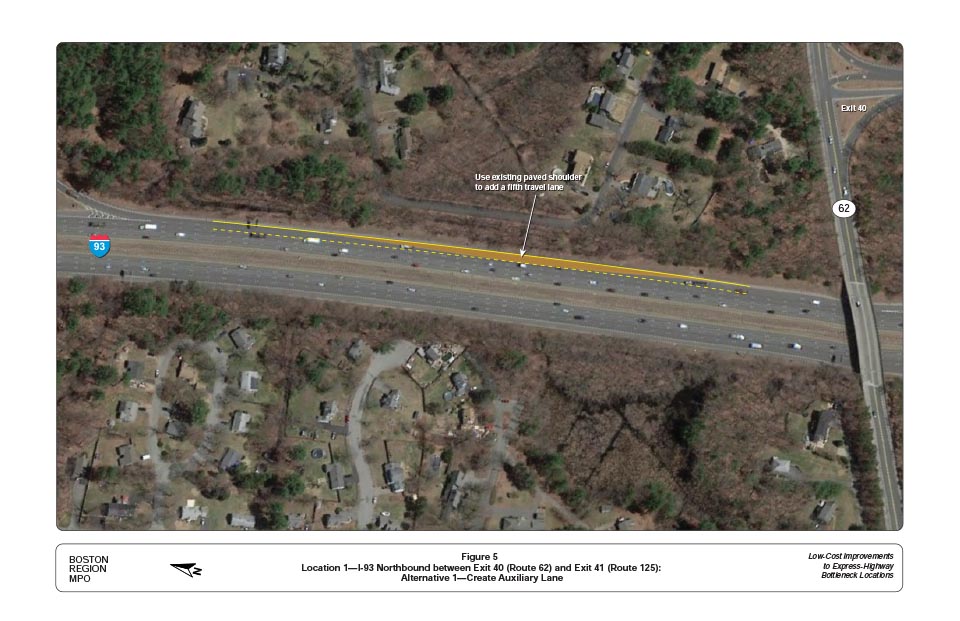
Figure 6
Location 2—I-93 Southbound at the End of the HOV Zipper Lane:
Peak Period Traffic Volumes
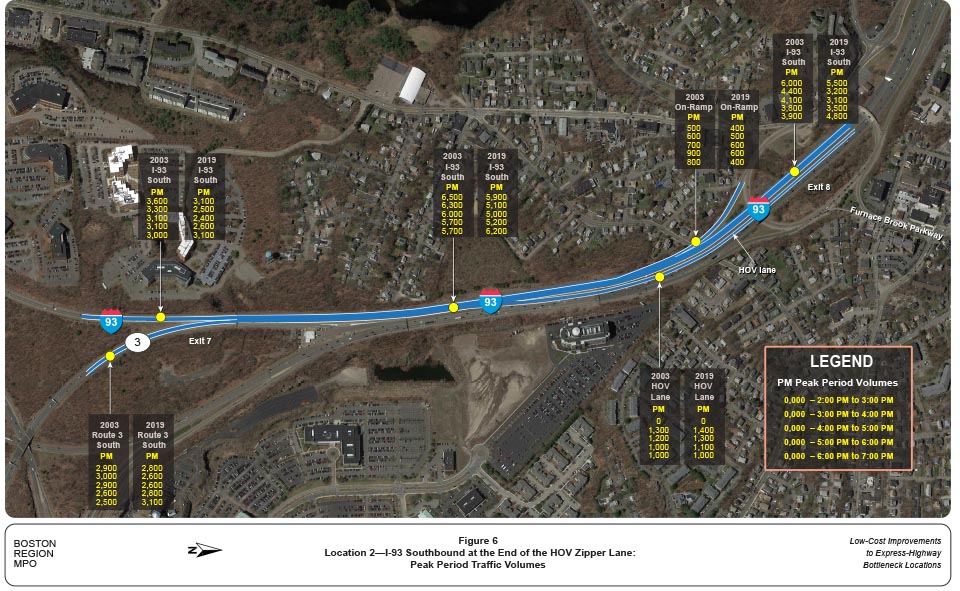
Figure 7
Location 2—I-93 Southbound at the End of the HOV Zipper Lane: Location and Number of Crashes
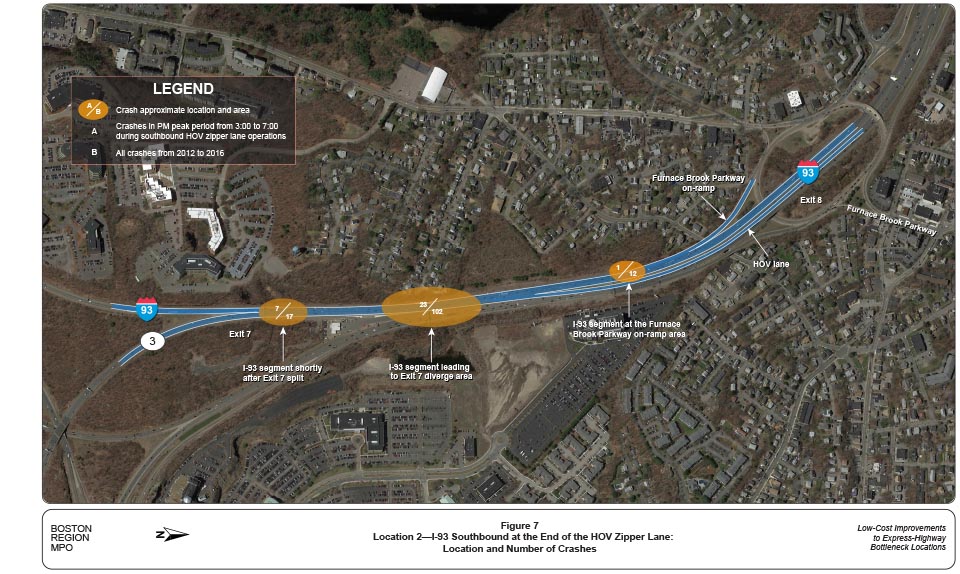
Figure 8
Location 2—I-93 Southbound at the End of the HOV Zipper Lane: Five-Year (2012–16) Crashes when the HOV Lane is in Operation (3:00 PM to 7:00 PM)
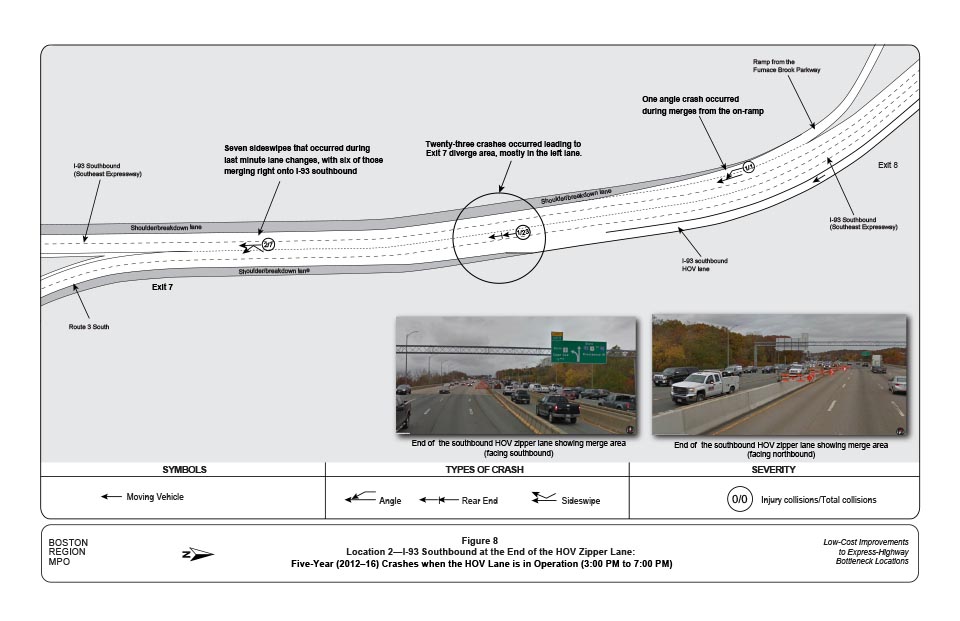
Figure 9
Location 2—I-93 Southbound at the End of the HOV Zipper Lane: Congestion Scan
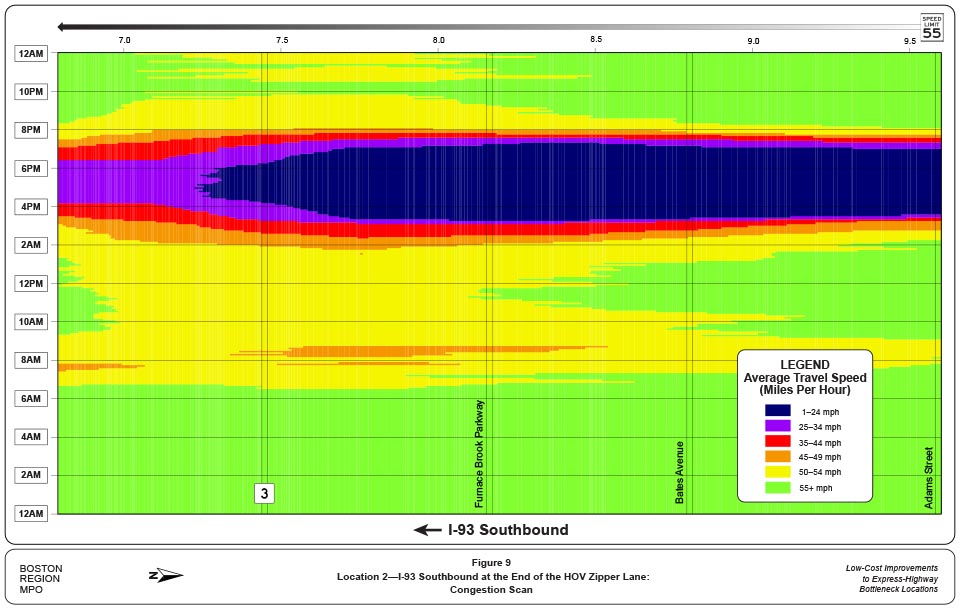
Figure 10
Location 2—I-93 Southbound at the End of the HOV Zipper Lane: Alternative 1—Lengthen the HOV Lane Merge Distance
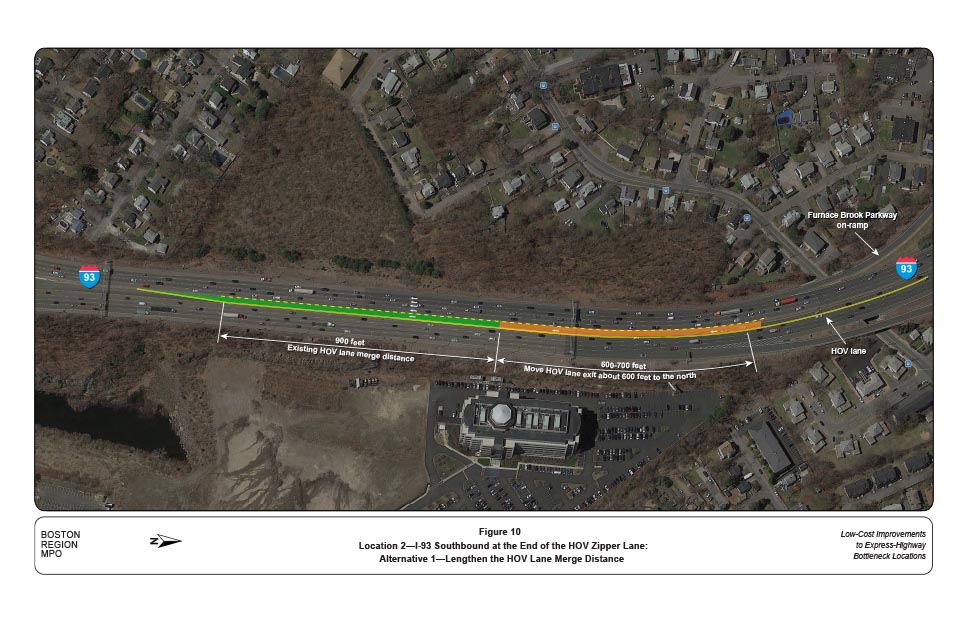
Figure 11
Location 2—I-93 Southbound at the End of the HOV Zipper Lane: Alternative 2—Lengthen the Acceleration Distance for Furnace Brook Parkway On-Ramp
1 Federal Highway Administration, Recurring Traffic Bottlenecks: A Primer: Focus on Low-Cost Operations Improvements, US Department of Transportation, Federal Highway Administration, June 2009, p. 1.
2 Seth Asante, MPO staff, memorandum to the Transportation Planning and Programming Committee of the Boston Region MPO, “Low-Cost Improvements to Bottleneck Locations, Phase I,” June 2, 2011.
3 Chen-Yuan Wang, MPO staff, memorandum to the Transportation Planning and Programming Committee of the Boston Region MPO, “Low-Cost Improvements to Bottleneck Locations, Phase II,” March 12, 2012.
4 Seth Asante, MPO staff, memorandum to the Boston Region MPO, “Low-Cost Improvements to Express-Highway Bottleneck Locations,” December 3, 2015.
5 Seth Asante and Ben Erban, “Low-Cost Improvements to Express-Highway Bottleneck Locations,” January 18, 2018.
6Seth Asante, MPO staff, memorandum to the Boston Region MPO, “Low-Cost Improvements to Express-Highway Bottleneck Locations: Selection of Study Locations,” April 2, 2015.
7All figures are included at the end of the report.
8 INRIX is a private company that collects roadway travel times and origin-destination data for most roadways that are collectors, arterials, limited-access roadways or freeways.
9Highway Capacity Manual 2010, Transportation Research Board of the National Academies, Washington, DC, December 2010.
10 The AM peak period is 6:00 AM to 10:00 AM, and the PM peak period is 3:00 PM to 7:00 PM. Source: Central Transportation Planning Staff.
11 Acceleration and deceleration lanes are measured from the point where the lane reaches 12 feet wide to the first controlling curve. Source: A Policy on Geometric Design of Highways and Streets, AASHTO, 2004. Chapter 10 Grade Separations and Interchanges.
12 Massachusetts Highway Department, Project Development and Design Guide, January 2006. The Guidebook describes the project development procedures and design guidelines applicable to projects with MassDOT Highway Division involvement. It provides guidance to municipalities, authorities, and other entities involved in the design and development of highways and streets, and other transportation facilities.
13 Synchro Version 10.3 was used for the analyses. This software is developed and distributed by Trafficware Ltd. It can perform capacity analysis and traffic simulation (when combined with SimTraffic) for an individual intersection or a series of intersections in a roadway network.
14 See Appendix D for detailed Synchro intersection-capacity analysis reports.
15 I-93 northbound travel lanes reduce from four to three lanes about one mile north of the Route 125, near the Wilmington/Andover town line.
16 INRIX is a private company headquartered in Kirkland, Washington. It provides location-based data and analytics, such as traffic and parking, to automakers, cities and road authorities worldwide.
17Highway Capacity Software 7, Version 7.3, McTrans Center, PO Box 116585, Gainesville, Florida, 2017.
18 For right-hand on-ramps, HCM defines the merge influence area to include the acceleration lane(s) and Lanes 1 and 2 of the freeway mainline (rightmost and second rightmost) for a distance of 1,500 feet downstream of the merge point. For right-hand off-ramps, the diverge influence area includes the deceleration lane(s) and Lanes 1 and 2 of the freeway mainline for a distance of 1,500 feet upstream of the diverge point. At this study location, the merge influence area overlaps with the diverge influence area for about 1,000 feet.
19 Ramp spacing is defined as the distance between the painted tips of successive ramps. As in this case, both the entrance and exit ramps are the parallel type; the spacing is estimated at the end of the solid white line extending from the painted tip of the two ramps.
20 Guidelines for Ramp and Interchange Spacing, NCHRP (National Cooperative Highway Research Program) Report 687, Transportation Research Board, Washington D.C., 2011.
21 American Association of State Highway and Transportation Officials. Highway Safety Manual. Washington, DC, 2010.
22 Crash Modification Factors Clearinghouse. The Crash Modification Factors Clearinghouse provides a searchable online database of CMFs along with guidance and resources on using CMFs in road safety practice. www.cmfclearinghouse.org/index.cfm.
23 Acceleration and deceleration distances are measured from the point where the lane reaches 12 feet wide to the first controlling curve. Source: A Policy on Geometric Design of Highways and Streets, AASHTO, 2004. Chapter 10 Grade Separations and Interchanges.
24 The AM peak period is 6:00 AM to 10:00 AM, and the PM peak period is 3:00 PM to 7:00 PM. Source: Central Transportation Planning Staff.
25 Highway Capacity Software 7, Version 7.3, McTrans Center, PO Box 116585, Gainesville, Florida, 2017.
26 VISSIM, PTV Group America, 1530 Wilson Blvd. Suite 510 Arlington VA 22209 United States.