Traffic Congestion in the Boston Region
Beyond the Daily Commute
Project Manager
Ryan Hicks
Project Principal
Mark Abbott
Data Analysts
Ryan Hicks
Paul Reim
Julian Chen
Ben Erban
Graphics
Jane Gillis
Kenneth Dumas
Cover Design
Jane Gillis
Kim DeLauri
The preparation of this document was supported
by the Federal Highway Administration and Federal
Transit Administration of the US Department of
Transportation through MPO Planning Contracts
#101725 and #105757, and MPO Transit §5303
Contracts #102694 and #106374.
Central Transportation Planning Staff
Directed by the Boston Region Metropolitan
Planning Organization. The MPO is composed of
state and regional agencies and authorities, and
local governments.
To request additional copies of this document or copies in an accessible format, contact:
Central Transportation Planning Staff
State Transportation Building
Ten Park Plaza, Suite 2150
Boston, Massachusetts 02116
(857) 702-3700
(617) 570-9192 (fax)
(617) 570-9193 (TTY)
ctps.org
rhicks@ctps.org
Abstract
Traffic conditions in the Boston region are monitored through the Boston Region Metropolitan Planning Organization’s Congestion Management Process (CMP). The purpose of the CMP is to identify locations where congestion occurs and the factors that contribute to it, and to develop strategies to alleviate the congestion. While most of the CMP’s traffic monitoring focuses on congestion caused by the recurring travel of the daily commutes residents in the region take to and from work in the morning and afternoon and evening peak travel periods, this study examined incidents when congested roadway conditions developed during times other than the traditional commuting hours or because of traveling associated with special events or holidays.
Seven case studies are included in this report detailing roadway congestion levels, times when congestion occurred, and specific roadway locations where congestion was the worst. The report discusses strategies that could be implemented in the future to address congestion when similar events occur. When events affected roadways on which MBTA buses operate, bus on-time performance was evaluated.
Chapter 1—Congestion in the Boston Region................................................ 13
Chapter 2—Selection and Analysis of Available Data Sources......................... 15
2.2...... Dataset Recommendations.............................................................. 16
Chapter 3—Performance Measures............................................................... 17
3.1...... Highway Performance Measures....................................................... 17
3.1.1 Congested Time................................................................. 17
3.1.2 Average Travel Speed......................................................... 17
3.1.3 Corridor/Segment Delay....................................................... 18
3.1.4 Bottleneck Factor................................................................ 18
3.1.5 Travel Time Index............................................................... 18
3.1.6 Planning Time Failure Index.................................................. 18
3.1.7 Minutes of Planning Time Failure........................................... 19
3.2...... Safety Performance Measure........................................................... 19
3.2.1 Number of Crashes during the Day of Event............................. 19
3.3...... Transit Performance Measure........................................................... 19
3.3.1 On-Time Performance......................................................... 19
3.4 ..... Freight Performance Measure.......................................................... 20
3.4.1 Level of Travel Time Reliability.................................................. 20
Chapter 5—Case Study: New England Patriots Regular Season Games............ 25
5.1...... Description of Event and Location..................................................... 25
5.2...... Performance Measure Summary....................................................... 26
5.2.1 Roadways......................................................................... 26
5.2.2 Safety............................................................................... 34
5.2.3 Findings............................................................................ 35
5.2.4 Strategies and Recommendations.......................................... 35
Chapter 6—Case Study: Red Sox Weekday Games......................................... 37
6.1...... Description of Event and Location..................................................... 37
6.2...... Performance Measure Summary....................................................... 38
6.2.1 Roadways......................................................................... 38
6.2.2 Safety............................................................................... 45
6.2.3 Findings............................................................................ 48
6.2.4 Strategies and Recommendations.......................................... 48
Chapter 7—Case Study: Saturdays............................................................... 49
7.1...... Description of Event and Location..................................................... 49
7.2...... Performance Measure Summary....................................................... 49
7.2.1 Roadways......................................................................... 49
7.2.2 Safety............................................................................... 56
7.2.3 Bus Service....................................................................... 59
7.2.4 Findings............................................................................ 60
7.2.5 Strategies and Recommendations.......................................... 60
Chapter 8—Case Study: Super Bowl Parade.................................................. 63
8.1...... Description of Event and Location..................................................... 63
8.2...... Performance Measure Summary....................................................... 64
8.2.1 Roadways......................................................................... 64
8.2.2 Safety............................................................................... 70
8.2.3 Findings............................................................................ 70
8.2.4 Strategies and Recommendations.......................................... 71
Chapter 9—Case Study: Wednesday before Thanksgiving............................... 73
9.1...... Description of Event and Location..................................................... 73
9.2...... Performance Measure Summary....................................................... 73
9.2.1 Roadways......................................................................... 73
9.2.2 Safety............................................................................... 89
9.2.3 Findings............................................................................ 90
9.2.4 Strategies and Recommendations.......................................... 91
Chapter 10—Case Study: Fridays................................................................. 93
10.1... Description of Event and Location..................................................... 93
10.2... Performance Measure Summary....................................................... 93
10.2.1 Roadways......................................................................... 93
10.2.2 Safety............................................................................. 102
10.4... Strategies and Recommendations.................................................... 103
Chapter 11—Case Study: Black Friday........................................................ 105
11.1... Description of Event and Location.................................................... 105
11.2... Performance Measure Summary..................................................... 105
11.2.1 Roadways........................................................................ 105
11.2.2 Freight Traffic on Black Friday.............................................. 118
11.4... Strategies and recommendations..................................................... 120
Chapter 12—Results and Summary of Case Studies..................................... 121
12.1... Congestion during Events.............................................................. 121
12.2... Recommended Strategies.............................................................. 123
Chapter 13—Recommendations and Next Steps........................................... 127
Table 1 Traffic Conditions on I-95: Weekday Peak Period versus Game Day
Table 2 Traffic Conditions on Route 1: Weekday Peak Period versus Game Day
Figure 5 Travel Speeds after Patriots Games Compared to Weekday Speeds
Table 3 Traffic Conditions on Route 1 Northbound: Worst Hour (4:45 PM to 5:45 PM)
Figure 6 Crashes on Route 1 and I-95: New England Patriots Game Days, 2011-15
Figure 7 Travel Speeds on I-90 Eastbound: Days of Red Sox Night Games
Figure 8 Travel Speeds on I-90 Westbound: Days of Red Sox Night Games
Figure 9 Travel Speeds on Route 9 Eastbound: Days of Red Sox Night Games
Figure 10 Travel Speeds on Route 9 Westbound: Days of Red Sox Night Games
Table 5 Top 5 Locations where Speeds Decrease on Days of Red Sox Night Games
Table 6 Crashes on Days of Red Sox Night Games versus Non-Game Days, 2011-15
Table 7 Locations with the Most Crashes on Days of Red Sox Night Games
Figure 12 Difference between Weekday Afternoon and Saturday Afternoon Travel Speeds
Figure 13 Difference between Weekday Evening and Saturday Evening Travel Speeds
Table 8 Traffic Conditions on Expressways and Arterials: Weekdays versus Saturdays
Table 13 Crashes on Weekdays and Saturdays: March – November 2015
Table 14 Expressway Locations with the Most Crashes on Weekends in 2015
Table 15 Arterial Locations with the Most Crashes on Weekends in 2015
Table 16 MBTA Bus Routes with Significant Declines in On-Time Performance: Saturdays, 2017
Figure 14 Patriots Super Bowl Parade Route
Figure 15 Difference between Weekday Morning and Super Bowl Parade Morning Travel Speeds
Table 17 Traffic Conditions on Expressways and Arterials: Weekdays versus Super Bowl Parade Day
Table 18 Expressway Locations with Significant Speed Decreases: Super Bowl Parade Day
Table 19 Arterial Locations with Significant Speed Decreases: Super Bowl Parade Day
Table 20 Crashes and Fatalities: Super Bowl Parade Day versus Weekdays, 2015
Figure 16 Difference between Weekday and Thanksgiving Eve Travel Speeds
Figure 17 Travel Times on I-93 Northbound from I-90 Interchange, Boston, to New Hampshire Border
Figure 18 Travel Times on I-93 Southbound from Zakim Bridge, Boston, to I-95 Interchange, Dedham
Figure 19 Travel Times on I-95 Northbound from I-90 Interchange, Weston, to New Hampshire Border
Figure 20 Travel Times on I-95 Southbound from I-93 Interchange, Dedham, to Rhode Island Border
Figure 21 Five-Year Crash Trend, Day before Thanksgiving, 2011-15
Table 25 Recommended Times to Leave Boston on the Day before Thanksgiving
Figure 22 Difference between Weekday and Friday Afternoon and Evening Travel Speeds
Table 26 Traffic Conditions on Expressways: Weekdays versus Fridays, PM Peak Period
Table 27 Friday Traffic Conditions on Expressways: I-90, Fridays, PM Peak
Table 28 Friday Traffic Conditions on Expressways: I-93, Fridays, PM Peak
Table 29 Friday Traffic Conditions on Expressways: I-95, Fridays, PM Peak
Table 30 Friday Traffic Conditions on Expressways: Route 3 South, Fridays, PM Peak
Figure 23 Travel Speeds on I-90 Westbound: Typical Weekday versus Friday
Figure 24 Travel Speeds on I-93 Northbound: Typical Weekday versus Friday
Figure 25 Travel Speeds on I-93 Southbound: Typical Weekday versus Friday
Figure 26 Travel Speeds on I-95 Northbound: Typical Weekday versus Friday
Figure 27 Travel Speeds on I-95 Southbound: Typical Weekday versus Friday
Figure 28 Travel Speeds on Route 3 Southbound: Typical Weekday versus Friday
Table 31 Expressway Locations with Speed Decreases on Friday, PM Peak Period
Table 32 Crashes and Crash Rates: Typical Weekday versus Fridays, 2015, Entire Day
Table 33 Recommended Leave Times on Fridays by Corridor
Figure 29 Travel Speeds on Arterials near the Natick Mall: Typical Weekday versus Black Friday, 2015
Figure 34 Difference between Weekday and Black Friday Travel Speeds
Table 35 Arterial Locations near Natick Mall where Speeds Decrease on Black Friday
Table 36 Traffic Conditions on Freight Network: Black Friday 2017
Table 37 Definitions of the Impact of Events
Table 38 Traffic Conditions during Case Studies
Table 39 Recommended Strategies from Case Studies
On a typical weekday in the Boston region, many residents who commute to their jobs by car find themselves in congested roadway conditions along with their fellow commuters who drive the same route each day at approximately the same time. This type of travel is referred to as recurring travel, as it occurs regularly at the same time and location day after day during the peak travel times. Roadway congestion caused by recurring travel is monitored by the Boston Region Metropolitan Planning Organization (MPO) through the Congestion Management Process (CMP).
Until recently, the CMP did not focus on incidents when congested roadway conditions developed during times other than the traditional commuting hours or because of traveling associated with special events or holidays. Now, with the availability of big data—which comprises large datasets that contain information that can be queried and analyzed relatively quickly—it is possible for the MPO to monitor and analyze traffic conditions that develop during off-peak travel times, weekends, holidays, and times leading up to special events and activities.
This report describes the results of seven case studies that examined incidents when congestion occurred in the Boston region during times other than typical commuting hours or during special events. The topics of the case studies are as follows:
The case studies examined roadway congestion levels, identified the times when the congestion occurred and specific roadway locations where congestion was the worst, and prioritized strategies that could be implemented to relieve the congestion from similar events or occurrences in the future. When events affected roadways on which Massachusetts Bay Transportation Authority (MBTA) buses operate, bus on-time performance was evaluated. The report also discusses the data sources and performance measures that were used to measure and evaluate the congestion.
Chapter 1—Congestion in the Boston Region
On a typical weekday in the Boston region, many residents who commute to their jobs by car find themselves in congested roadway conditions along with their fellow commuters who drive the same route each day at approximately the same time. This type of travel is referred to as recurring travel, as it occurs regularly at the same time and location day after day during the peak travel times. Roadway congestion caused by recurring travel is monitored by the Boston Region Metropolitan Planning Organization (MPO) through the Congestion Management Process (CMP).
Until recently, the CMP did not focus on incidents when congested roadway conditions developed during times other than the traditional commuting hours or because of traveling associated with special events or holidays. Now, with the availability of big data—which comprises large datasets that contain information that can be queried and analyzed relatively quickly—it is possible for the MPO to monitor and analyze traffic conditions that develop during off-peak travel times, weekends, holidays, and times leading up to special events and activities.
The purpose of this study was to identify locations in the Boston region where nonrecurring travel results in roadway congestion and determine strategies that could be employed to alleviate congestion when similar events occur in the future. The first sections of this report identify the methodology and the process of measuring congestion in the region, and the latter sections focus on seven case studies that examined incidents when congestion occurred in the Boston region either during times other than typical commuting hours or during special events. The topics of the case studies are as follows:
The case studies examined roadway congestion levels, identified the times when the congestion occurred and specific roadway locations where congestion was the worst, and prioritized strategies that could be implemented to relieve the congestion from similar events or occurrences in the future. When events affected roadways on which Massachusetts Bay Transportation Authority (MBTA) buses operate, bus on-time performance was evaluated. The report also discusses the data sources and performance measures that were used to measure and evaluate the congestion.
Chapter 2—Selection and Analysis of Available Data Sources
This section summarizes the results of a comparison of data sources that were available for use in this study to measure roadway congestion. Datasets from INRIX and Bing Maps, and the National Performance Management Research Data Set (NPMRDS) were compared. The focus area for this study included the 97 municipalities in Boston Region MPO’s planning area. (Some corridors monitored were in the 163-municipality area covered by the Boston Region MPO’s regional travel demand model.)
One of the CMP’s primary goals is to conduct performance monitoring for the regions roadways and transit system, as well as for safety (as measured by roadway crashes). The CMP employs performance measures, which are statistical indicators used to monitor system performance or track progress toward a goal, to conduct performance monitoring of the region’s highways and identify congested locations on the region’s highways.
In order to complete performance monitoring in 2013, the Boston Region MPO purchased a roadway monitoring dataset from INRIX (the 2012 dataset). The MPO staff used the dataset to produce two interactive dashboards and the Needs Assessment for the Long-Range Transportation Plan (LRTP), Charting Progress to 2040. The MPO was satisfied with the accuracy, coverage area, and overall usefulness of the dataset and decided to purchase a second dataset from INRIX (the 2015 dataset) in 2016. In addition, the MPO staff discovered other data sources that are also useful for roadway monitoring: the NPMRDS and the Bing Maps dataset.
At the outset of this study, it was important to determine the best datasets to use for each of the MPO’s congestion monitoring activities. The MPO staff initially compared the INRIX, NPMRDS, and Massachusetts Department of Transportation’s (MassDOT’s) Real Time Traffic Management (RTTM) datasets and documented the results in a memorandum titled “Massachusetts Department of Transportation and National Performance Management Research Dataset Roadway—Monitoring Dataset Analysis” and dated December 2015. (MassDOT’s RTTM dataset is now referred to as Go-Time.) Since the publication of that memorandum, the Boston Region MPO purchased the new 2015 INRIX dataset, the NPMRDS data provider changed from HERE to INRIX, and MPO staff discovered a new way to mine roadway travel-time data from online Bing Maps using application programming interface (API) calls.
In addition to these highway-specific datasets, additional datasets were used to analyze transit (bus on-time) performance and roadway safety (vehicle crashes per day) during events of interest.
A test was done to determine how well the datasets available to the Boston Region MPO gauge nonrecurring congestion. The test revealed that the INRIX dataset was able to show typical congestion patterns before, during, and after a New England Patriots game. The Bing Maps data was not able to accurately reflect the congestion patterns during those same time periods. Therefore, MPO staff recommended using INRIX data to measure nonrecurring congestion.
If INRIX data were not available for the analysis of an event of interest (if, for example, the INRIX dataset for the year of the event had not been purchased), then the MPO staff recommended using the NPMRDS. The MPO staff determined that the Bing Maps data should be used as a last resort, as this dataset has been evaluated the least. Also, it remains to be seen if the dataset is accurate on a basis of one-day samples, which were required for the evaluations in some of the case studies described in this report.
The MPO staff recommended using the NPMRDS freight dataset to analyze freight traffic only on expressways, as there were not enough samples from arterials. The freight dataset is incomplete, but it is the only dataset available that monitors freight traffic on the region’s roadways.
The MPO staff recommended using the MBTA’s Back on Track dataset to monitor bus on-time performance during nonrecurring events. This dataset was the most readily available dataset that tracks occurrences of bus delay. However, the MBTA’s Back on Track dataset was only available from 2016 to the present, so assumptions were made for certain case studies.
The MPO staff recommended using MassDOT’s crash database to analyze roadway safety conditions during nonrecurring events. At the time this study was done, crash records for the years prior to 2016 were available.
Chapter 3—Performance Measures
To monitor congested conditions resulting from nonrecurring events, the MPO staff relies on performance measures. Performance measures are statistical indicators that are used to monitor system performance or track progress toward a goal. The performance measures used in this study utilized transportation data to gauge nonrecurring congestion at specific locations. Highway, safety, and transit performance measures were used in this study. All performance measures—except those for corridor/segment delay, bottleneck factor, planning time failure, minutes of planning time failure, and number of crashes during the day—have previously been used in the Boston Region MPO’s CMP. Previous analyses are available on the MPO’s website.1 2
For the purpose of this report, the term “highway” refers to any roadway that is located on the CMP network, including both arterials and expressways. Arterials are full access roadways that are often equipped with signals at intersections. Expressways are limited access roadways that typically do not have signals. Generally, arterials are for local travel, while expressways are for regional, statewide, and interstate travel. The performance measures listed below can monitor the duration, extent, intensity, and variability of congestion.
Congested Time is the average number of minutes that drivers experience congested conditions during a specific time period. By the Boston MPO’s CMP standards, roadways are considered congested when vehicle speeds are below 35 miles per hour (MPH) on expressways or below 19 MPH on arterials. Congested time is measured in minutes per hour of analysis.
Average Travel Speed associated with a specific roadway is calculated using travel times and road segment lengths. The average observed travel speed is a good indicator of congestion in the roadway network and can highlight the need to identify solutions to mobility problems. Average travel speed is also a factor in calculating other metrics, such as travel time.
Delay is the extra time required to travel through a roadway segment or corridor during the time of the event compared to the time required during optimum conditions. Delay is calculated as the travel time during the period monitored minus travel time during free-flow conditions. This measure is effective for assessing travel time between two landmarks along a roadway or roadway corridor.
The Bottleneck Factor is the intensity of congestion—the average speed in the Traffic Messaging Channel (TMC) location—plus the duration of time that a TMC location is congested (congested time).3 This measure can be used to rank problem areas in the roadway network. The bottleneck factor is on an unlimited scale from zero, with zero indicating no congestion and severe congestion indicated by a value greater than one.
The Travel Time Index compares travel conditions during the peak period to travel conditions during free-flow periods. This measure is the ratio of peak-period time to free-flow time, and it indicates the severity of peak-period congestion on a roadway. Travel time index always has a value of at least 1.00, and a higher number indicates more congestion. For example, at a location that has a travel time index of more than 2.00, a vehicle will take twice as long to travel on that roadway during the monitoring time than during off-peak times.
The Planning Time Failure Index applies to instances in which the travel time during an event is longer than the amount of time that a traveler should budget for travel on a typical weekday, as measured by the planning time index.4 This performance measure shows where there is an extreme spike in congestion at a certain time and location. At locations that have a planning time failure index of more than 1.00, the travel time for vehicles during an event will be higher than the time indicated in the planning time index.
The performance measure for Minutes of Planning Time Failure shows the duration of time that the travel time during an event is longer than the planning time index travel time for a typical weekday.
In this study, safety performance measures were used to analyze the location and frequency of crashes during the time of interest, and to compare the number of crashes to those of a typical day. MassDOT’s crash database was the source of data for the safety analyses.
This performance measure compares the number of crashes that occurred during the day of the event to the number of crashes that occurred during a typical day during the same year to determine if the crash rate increased during the event. This performance measure may consider crashes that occurred during a typical weekday or weekend day, or a specific day of the week (for example, a typical Thursday compared to the Thursday of the event).
In this study, transit performance measures were used to analyze the on-time performance of the MBTA bus system during specific events. The MBTA Back on Track dataset was the data source used for these evaluations.
On-Time Performance is reported according to the MBTA’s definition of reliability. Data relating to this performance measure is available on the MBTA’s Back on Track dashboard. 5 Bus service is measured at the starting point and terminus of the route and at midpoints to determine the rate of travel.
In this study, one freight performance measure was used—Level of Travel Time Reliability (LOTTR). LOTTR is a performance measure that was developed by the Federal Highway Administration (FHWA). Freight monitoring was limited to the Black Friday case study.
LOTTR is an index that shows the reliability and variability of speed on a roadway segment over a period of time. LOTTR is calculated by dividing the 80th percentile travel time by the 50th percentile travel time. Roadway segments that have LOTTR higher than 1.50 are determined to be unreliable. LOTTR can also be calculated over a regional network to determine a percentage of the roadway network that is unreliable.
At the outset of this study, the MPO staff compiled a list of events and occurrences that could be evaluated to determine the degree of congestion on roadways at those times. For each event and occurrence, affected corridors and bus routes were identified. Then staff ranked each event and occurrence based on its potential to produce congestion and considered the availability of data for conducting a congestion analysis.
Some of these events occurred once and others were recurring. Therefore, some case studies relied on data specific to the time of the events—such as the case studies on sporting events—while others relied on average statistics—such as the case studies on weekend traffic.
Initially, in addition to the subjects selected for study, the MPO staff intended to pursue several other case studies to explore congestion resulting from events such as concerts and graduations at large institutions, roadway construction, vehicular crashes, and inclement weather, however those topics were ultimately excluded because of either a lack of data or inconclusive results. For example, a case study on the Blizzard of 2015 was excluded because of a lack of vehicle probe data resulting from the statewide travel ban that went into effect during the storm. Another case study that compared dry weather days to rainy days was inconclusive because the available data did not reveal a marked difference in travel patterns.
When the events and occurrences were identified for study, staff determined the location of the bottlenecks on the roadway network that were to be evaluated. In some cases, staff examined the entire network monitored by the Boston Region MPO’s CMP. For others, only a few selected corridors located near the event were evaluated.
Each case study includes the following information.
This section describes the nature and location of the event or occurrence, the duration of the traffic monitoring, the time of the day that the roadway system was affected by the event, and the roadways that were affected.
This section lists the dates during which congestion levels were analyzed. In certain cases, the dates of the analysis were different than the date that the event occurred. The reason for this is because some events alter traffic patterns on other days of the week. For example, in the case study on the Wednesday before Thanksgiving, traffic patterns were analyzed for the day before the holiday because many people travel on that day, rather than on Thanksgiving Day.
This section indicates the time of day that congestion levels were monitored.
This section indicates the roadway corridors that were analyzed. In many instances, a regional analysis focused on the entire Boston region CMP network.
This section lists the MBTA bus routes that were analyzed. Because of the limited availability of data and the fact that some areas of interest do not have bus service, some case studies did not analyze MBTA bus routes.
This section indicates the datasets that were used in the analysis. In most cases, INRIX was used to analyze the roadway network. However, there were a few instances in which the NPMRDS or Bing Maps data were used. The MBTA’s Back on Track dataset was used to monitor the MBTA’s bus network, and MassDOT’s crash database was used to analyze the safety of the roadway network.
This section discusses the performance of the roadway and/or bus networks and the safeness of the roadway network in the study area.
The results of the data analyses pertaining to roadways were compared to performance metrics. Some studies include corridor-specific analyses that examine delay during an event versus a typical peak travel period. The most congested locations in the analyzed corridors are indicated.
The case studies of events that affect the bus system report on the on-time performance of the bus system during the events as compared to the on-time performance during a typical weekday for the individual bus routes and the entire MBTA system.
The crash analyses typically show the number of crashes that occurred during an event compared to the average number of crashes that occur during a typical day at that location. In certain instances, a five-year trend from 2011 to 2015 was analyzed.
This section summarizes interesting results of the analysis and observations about system performance, identified bottlenecks, periods of severe congestion, effects on bus service, and crash trends.
This section recommends strategies to help relieve congestion during the event or occurrence. These strategies are based on the Boston Region MPO’s 2013 CMP report. Cost effective strategies, that do not require roadway expansion, are available to relieve nonrecurring congestion at locations throughout the region. Some of these strategies focus on reducing single-occupancy-vehicle (SOV) demand, while other strategies focus on minor infrastructure improvements to help the roadway network operate better. There are also strategies that help improve communication between vehicle operators and other roadway users to help both parties make better decisions.
Chapter 5—Case Study: New England Patriots Regular Season Games
The New England Patriots play their home games at Gillette Stadium in Foxborough, MA. During the 2015 National Football League (NFL) season, the team played six home games that started at 1:00 PM on Sundays. Because of the frequency of games played during this time slot, it was possible to analyze traffic patterns to identify recurrent traffic problems leading to and from Gillette Stadium on game days.
The specific dates and times of the analysis, roadways and routes of focus, and datasets used in the analysis are as follows:
The main roadways that provide access to Gillette Stadium are Interstate 95 and Route 1. The traffic patterns showed moderate congestion leading to the stadium before the game and extreme congestion leading from the stadium after the game. Traffic after the game was more intense because attendees typically leave the game at the same time, whereas fans traveling to the game are arriving over a longer period of time, typically to tailgate. Usually on game days, Route 1 has a contraflow operation between the interchange of Route1 and Interstate 95 and Interstate 495. One or more lanes on Route 1 are added to the peak direction before and after games to temporarily add capacity. In addition, vehicles are typically permitted to drive in the breakdown lane on highways near the stadium during these times.
The MBTA runs special commuter rail train service to Foxborough on game days and for other events for a round trip price of $20. One train travels from South Station in Boston and another train travels from TF Green Airport in Providence, Rhode Island, to the station near Gillette Stadium shortly before game time. Thirty minutes after the games, trains make the return trip to South Station and TF Green Airport. Both trains commonly sell out on game day. 6
Additionally, those attending these games might opt to use a ridesharing service, such as Uber or Lyft, to avoid the high cost of parking at the stadium (parking on game days is $40) and other issues related to parking.7 Ridesharing might have increased travel trips to the stadium, whereas in the past attendees would have carpooled or taken public transportation to the games.
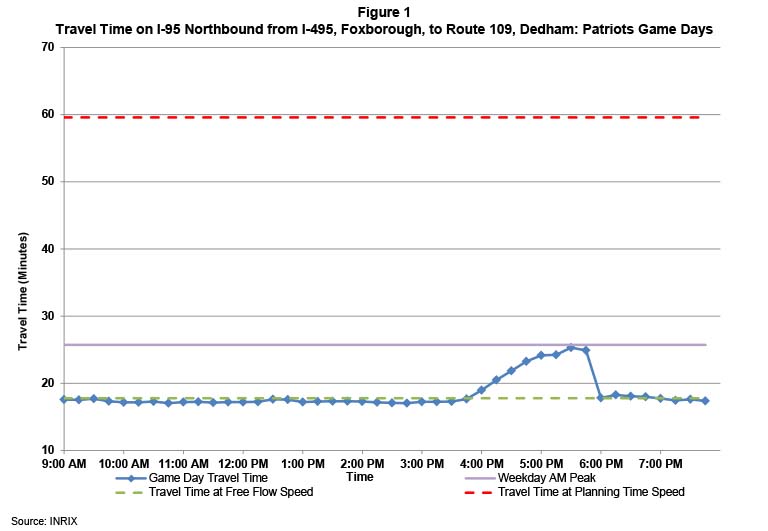
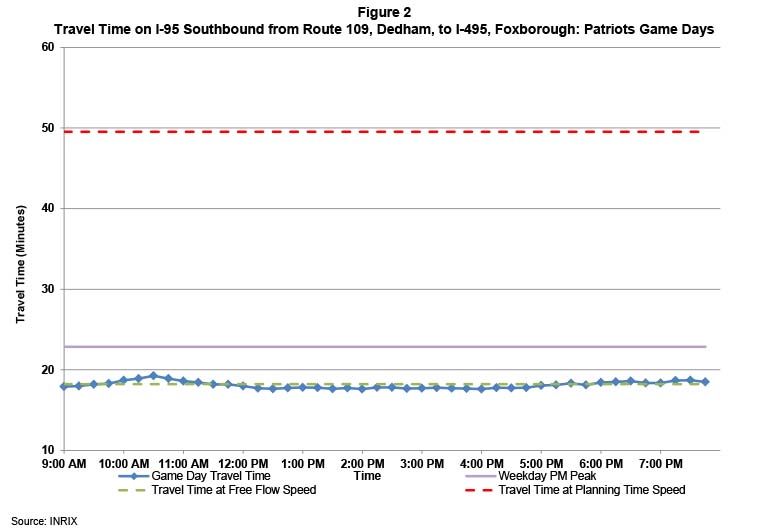
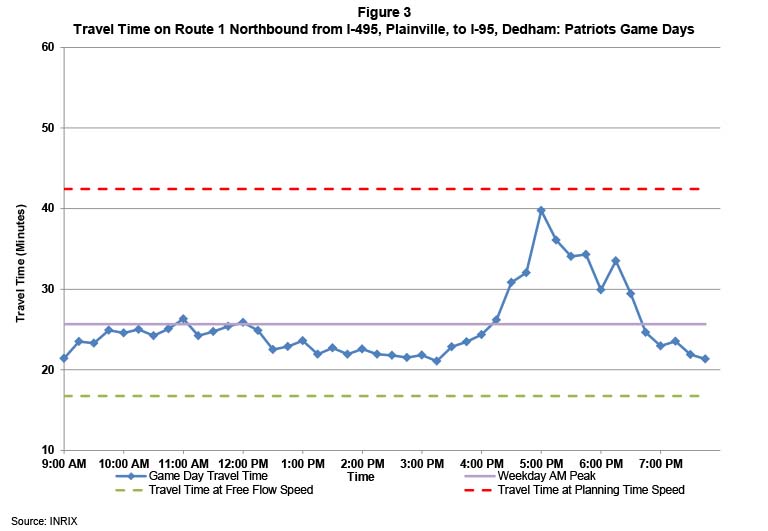
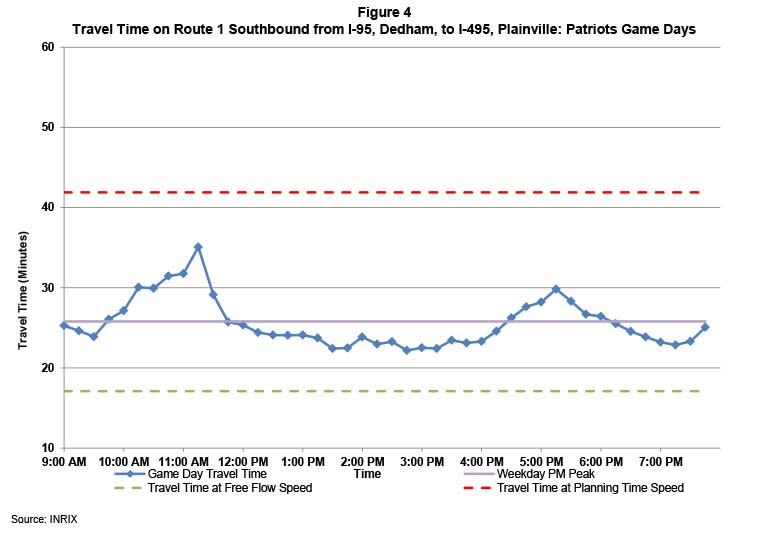
Figures 1, 2, 3, and 4 show the travel times on Interstate 95 northbound, Interstate 95 southbound, Route 1 northbound, and Route 1 southbound, respectively, on Patriots game days. Of the four directional corridors, both Route 1 northbound and southbound experienced travel times on game days that were worse than travel times on a typical weekday peak period.
Interstate 95 northbound experienced an increase in travel times between 4:00 PM and 6:00 PM, which represents traffic that was flowing from Foxborough to Boston and other surrounding communities after the Patriots games. Interstate 95 southbound experienced a slight increase in travel time between 10:00 AM and 11:00 AM, before the Patriots games.
Route 1 northbound experienced an increase in travel times of up to 100 percent between 3:15 PM and 6:30 PM; the worst travel times occurred between 4:45 PM and 5:45 PM. Route 1 southbound experienced two periods when there was an increase in travel times: from 9:30 AM to 11:30 AM and 4:00 PM to 7:00 PM. The morning travel times showed a more significant increase than the evening travel times; travel time increased by 50 percent between 9:30 AM and 11:30 AM. This trend represents game attendees traveling to Gillette Stadium before the Patriots games.
Tables 1 and 2 display the performance results for both Interstate 95 and Route 1 respectively. Both the typical weekday and game day performance results are displayed in each table. Both Interstate 95 northbound and southbound experienced less congestion than a typical weekday peak period on game days, but Route 1 northbound and southbound experienced an increase in congestion on game days. The Interstate 95 northbound and southbound corridors experienced no congested minutes per hour on game days. Route 1 northbound experienced the lowest speeds and had the highest travel time index of the corridors. Based on the average speed and other performance measures, the most congested location during a Patriots game day is on Route 1 northbound from North Street to Interstate 95 between 4:45 PM and 5:45 PM.
Table 1
Traffic Conditions on I-95: Weekday Peak Period versus Game Day
Performance Measure |
I-95 Northbound (Dedham –Foxborough) Weekday |
I-95 Northbound (Dedham –Foxborough) Game Day |
I-95 Southbound (Dedham –Foxborough) Weekday |
I-95 Southbound (Dedham –Foxborough) Game Day |
Distance (miles) |
19.99 |
19.99 |
20.3 |
20.3 |
Congested minutes per hour |
17:56 |
0:00 |
9:51 |
0:00 |
Average travel time (minutes) |
19:07 |
18:24 |
22:25 |
18:07 |
Average speed (MPH) |
62.72 |
65.17 |
54.34 |
67.26 |
Average delay (minutes) |
1:21 |
0:38 |
4:13 |
0:00 |
Bottleneck factor |
0.64 |
N/A |
0.38 |
N/A |
Travel time index |
1.08 |
1.03 |
1.23 |
1 |
Travel time / planning time ratio |
32% |
31% |
45% |
37% |
MPH = miles per hour.
Source: INRIX.
Table 2
Traffic Conditions on Route 1: Weekday Peak Period versus Game Day
Performance Measure |
Route 1 Northbound (Plainville – Dedham) Weekday |
Route 1 Northbound (Plainville – Dedham) – Game Day |
Route 1 Southbound (Plainville – Dedham) Weekday |
Route 1 Southbound (Plainville – Dedham) - Game Day |
Distance (miles) |
13.76 |
13.76 |
13.98 |
13.98 |
Congested minutes per hour |
5:52 |
6:29 |
5:17 |
5:34 |
Average travel time (minutes) |
22:57 |
25:30 |
23:58 |
25:34 |
Average speed (MPH) |
35.97 |
32.42 |
34.99 |
32.81 |
Average delay (minutes) |
6:13 |
8:44 |
6:51 |
8:28 |
Bottleneck factor |
0.39 |
0.54 |
0.37 |
0.51 |
Travel time index |
1.37 |
1.52 |
1.40 |
1.49 |
Travel time / planning time ratio |
54% |
60% |
57% |
61% |
MPH = miles per hour.
Source: INRIX.
Figure 5 shows the locations on Interstate 95 and Route 1 that experience a decrease in speed after 1:00 PM games concluded between 4:45 PM and 5:45 PM, compared to the weekday PM peak speeds. The most congested segment of Route 1 northbound at this time is between North Street and Interstate 95. This segment is located less than half a mile from Gillette Stadium.
Table 3 shows the performance results for Route 1 northbound between 4:45 PM and 5:45 PM on game days. At that time, motorists experienced 49 minutes of congestion per hour. Additionally, travel times on the corridor were worse than the planning time travel times for a typical peak period for 18 minutes out of every hour. Also, travel speeds were 12 MPH, and the travel time index was 3.9.
Figure 5
Travel Speeds after Patriots Games Compared to Weekday Speeds
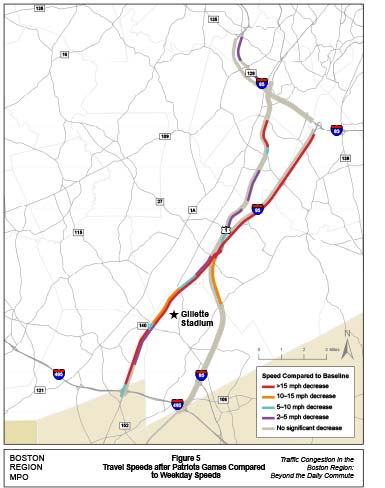
Table 3
Traffic Conditions on Route 1 Northbound:
Worst Hour (4:45 PM to 5:45 PM)
Performance Measure |
Route 1 Northbound (Plainville – Dedham) Weekday |
Route 1 Northbound (Plainville – Dedham) Game Day |
Distance (miles) |
13.76 |
13.76 |
Congested minutes per hour |
5:52 |
16:24 |
Average travel time (minutes) |
22:57 |
34:06 |
Average speed (MPH) |
35.97 |
24.21 |
Average delay (minutes) |
6:13 |
17:22 |
Bottleneck factor |
0.39 |
2.54 |
Travel time index |
1.37 |
2.04 |
Travel time / planning time ratio |
54% |
80% |
MPH = miles per hour.
Source: INRIX.
Figure 6 compares the number of crashes that occurred on Route 1 and Interstate 95 on New England Patriots game days in 2011 through 2015 to the number of crashes that occurred on a typical day at these locations during the same time period. Most of the crashes on Route 1 between North Street and Interstate 95, which is the most congested location after the Patriots games, were caused by rear-end collisions.
Figure 6
Crashes on Route 1 and I-95: New England Patriots Game Days, 2011-15
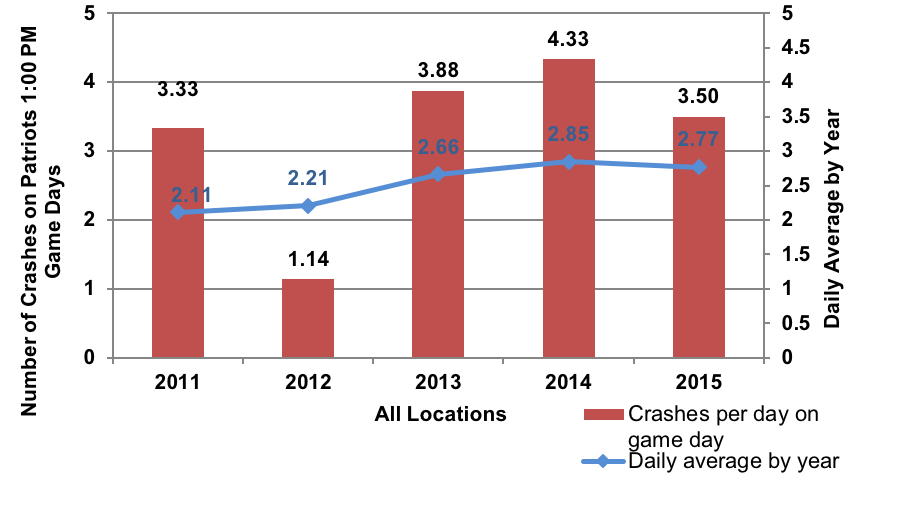
Source: MassDOT Crash Database.
Chapter 6—Case Study: Red Sox Weekday Games
In 2015, the Boston Red Sox baseball team played 162 games. Of the 81 home games at Fenway Park, 42 games were played on weekday nights starting between 7:00 PM and 8:00 PM. Unlike many of the case studies that were reviewed in this report, this case study highlights an event that takes place during peak period travel times. This case study compared travel times on weekdays when the Red Sox played nighttime home games to travel times on non-game weekdays to determine if there is a difference in traffic congestion on Interstate 90 and several arterials near Fenway Park.
Typically, Jersey Street (formerly Yawkey Way) and Van Ness Street are closed during the games. As of April 27, 2017, Landsdowne Street is also closed to traffic during games .8 In addition, some other streets near the ball park are closed and others are converted to a contraflow operation on game days.
This case study
The specific dates and times of the analysis, roadways and routes of focus, and datasets used in the analysis are as follows:
Table 4 shows the comparison of performance results for Interstate 90 between dates when the Red Sox had night games and dates when the team did not have night games. On Interstate 90, overall travel speeds were actually slower during the PM peak period on weekdays when the Red Sox did not play compared to weekdays when the team played night games. However, traffic speeds were slower at roadway segments near the stadium on dates when there were night games.
Performance Measure |
I-90 (Both directions) Game Day |
I-90 EB Game Day |
I-90 WB Game Day |
I-90 (Both directions) Weekday |
I-90 EB Weekday |
I-90 WB Weekday |
Distance (miles) |
22.1 |
11.45 |
10.66 |
22.1 |
11.45 |
10.66 |
Congested minutes per hour |
16:52 |
15:59 |
17:49 |
19:38 |
15:39 |
23:54 |
Average travel time (minutes) |
30:25 |
15:07 |
15:22 |
32:01 |
15:11 |
17:10 |
Average speed (MPH) |
43.6 |
45.44 |
41.64 |
41.41 |
45.26 |
37.27 |
Average delay (minutes) |
7:43 |
3:11 |
4:35 |
9:20 |
3:15 |
6:23 |
Bottleneck factor |
0.63 |
0.58 |
0.69 |
0.74 |
0.59 |
0.91 |
Travel time index |
1.34 |
1.27 |
1.43 |
1.41 |
1.27 |
1.59 |
Travel time / planning time ratio |
48% |
47% |
49% |
50% |
47% |
55% |
EB = eastbound; I = Interstate; MPH = miles per hour; WB = westbound.
Source: INRIX.
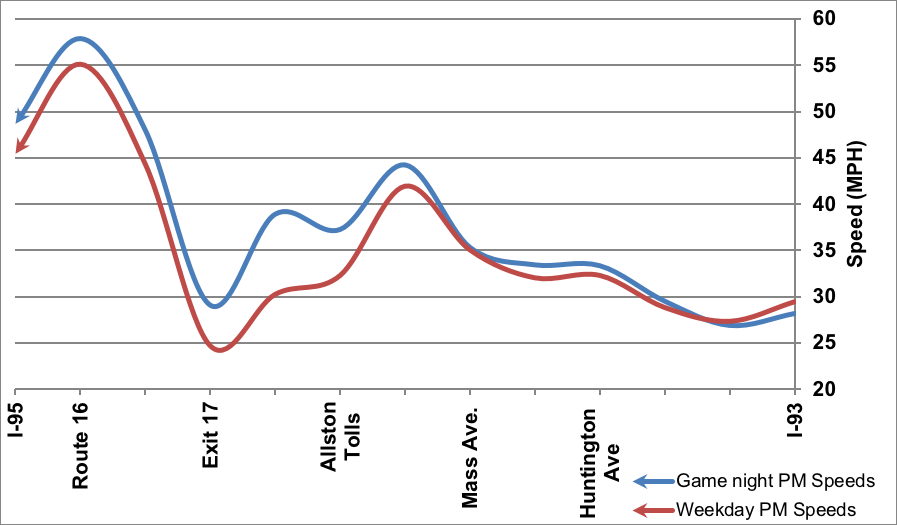
Figures 7 and 8 show the flow of game day and non-game day traffic speeds, by location and travel direction. The travel speeds on the eastbound lanes of Interstate 90 on game nights were slightly higher between Interstate 95 and the Allston Tolls. East of the Allston Tolls, motorists on Interstate 90 eastbound experienced slower speeds on game day compared to regular weekdays. The game day speeds on Interstate 90 westbound were higher at every location except between Interstate 93 and Huntington Avenue. The reason why travel speeds might be higher during game days could be because motorists avoid driving near Fenway Park during a game. In addition, the games tend to let out after 11:00 PM, which is during the off-peak travel period. Even though there would be an influx of traffic at this time, Interstate 90 has the capacity to carry this traffic without a resulting speed reduction.
Figure 7
Travel Speeds on I-90 Eastbound: Days of Red Sox Night Games
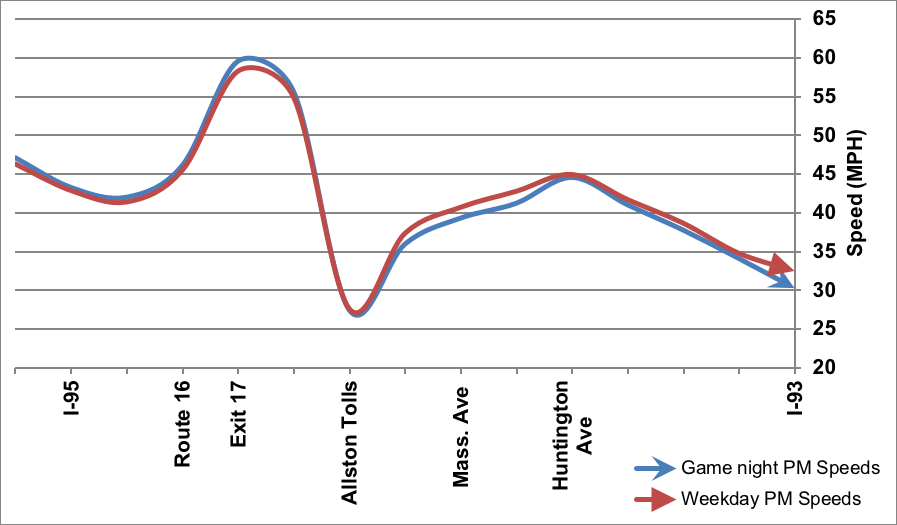
Figure 8
Travel Speeds on I-90 Westbound: Days of Red Sox Night Games
The combined average PM peak speeds for all arterials in the study area actually increased slightly during game days. In addition, the number of congested minutes per hour decreased by one minute and 13 seconds on game days versus non-game days. All arterials, except Massachusetts Avenue (both directions) and Brookline Avenue (both directions), experienced faster speeds and lower congested minutes on game days than on non-game days. In many cases, however, roadway speeds on game day were slower than speeds on non-game days on the roadways close to Fenway Park. In addition, Route 9 westbound, Massachusetts Avenue westbound, and Brookline Avenue eastbound all had a travel time index higher than 2.00 compared to a travel time index congested threshold standard of 1.30, which indicates that these locations are experiencing extreme congestion on game days.
Figures 9 and 10 show the travel speeds during the PM peak period on game days and non-game days on Route 9 eastbound and westbound, respectively. On Route 9 eastbound, the game night PM speeds were actually higher than the non-game night speeds west of Hammond Pond Parkway. However, the speeds for both nights were nearly equal east of Hammond Pond Parkway.
On Route 9 westbound, an interesting finding is that travel speeds were consistently higher on game days versus non-game days. At some locations, speeds were as much as five MPH higher. There might have been less traffic on game nights because many commuters may avoid Route 9 if they know that a Red Sox game is scheduled for that night. In addition, the congestion on Route 9 westbound usually occurs after the game and well after the peak travel period ends.
Figure 9
Travel Speeds on Route 9 Eastbound: Days of Red Sox Night Games
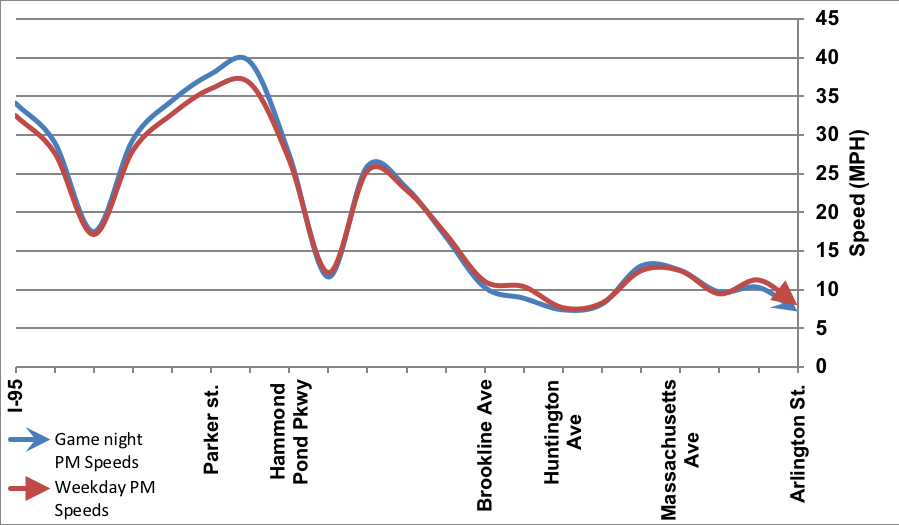
Figure 10
Travel Speeds on Route 9 Westbound: Days of Red Sox Night Games
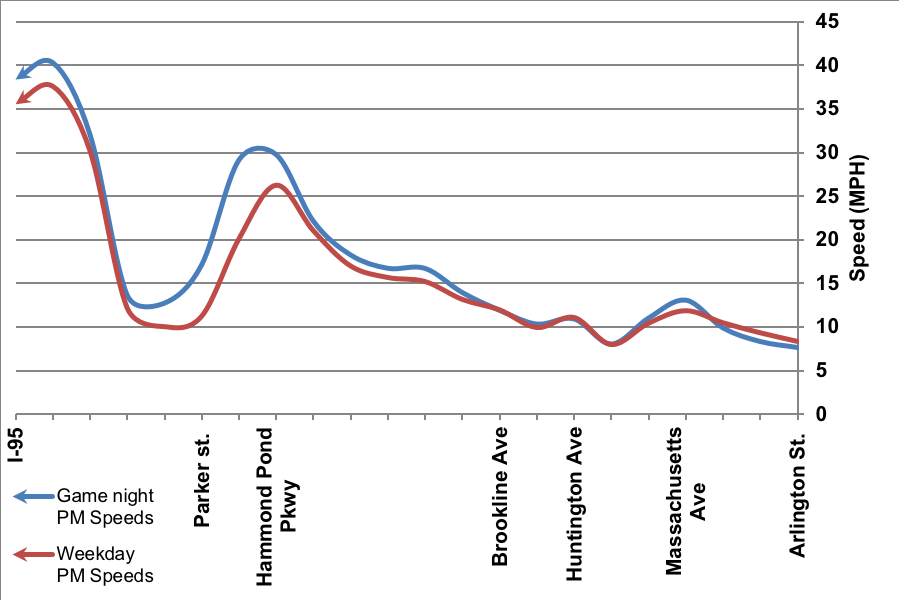
Figure 11 shows the locations near Fenway Park that experience a decrease in average speeds of more than 2 MPH on days when Red Sox night games were played. One map shows the locations where speeds decrease before the game between 3:00 PM and 7:00 PM. The other map shows the locations where speeds decrease after the games, between 10:00 PM and 12:00 AM. During the PM peak period before the game, most of the speed decreases occur near Fenway Park. After the game (10:00 PM to 12:00 AM), the decreases in speeds are more extreme at some locations and several locations experience decreases of more than 5 MPH.
Table 5 lists the specific locations where traffic speeds decreased on days when Red Sox night games were played. Most of the speed reductions occurred after the games ended and attendees were leaving the Fenway area. However, travel speeds on Storrow Drive, which is a limited-access arterial, typically decreased before a game compared to the same time on a non-game day.
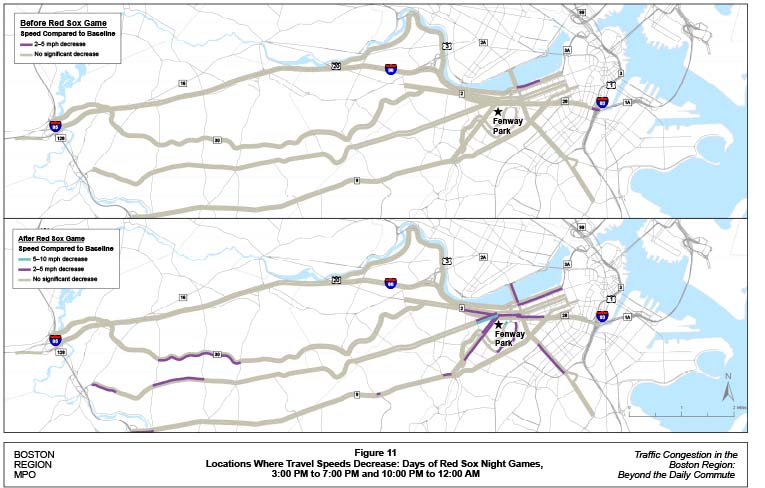
Table 5
Top 5 Locations where Speeds Decrease on Days of Red Sox Night Games
Roadway |
Direction |
From |
To |
Time |
Change in Speed (MPH) |
Storrow Drive (Boston) |
Westbound |
MA-28 |
Massachusetts Avenue |
5:30 PM-7:30 PM |
-14.60 |
Beacon Street (Newton) |
Westbound |
Walnut Street |
Chestnut Street |
11:00 PM- 12:00 PM |
-13.54 |
Boylston Street (Boston) |
Eastbound |
Boylston Street |
Park Drive |
10:00 PM- 12:00 PM |
-10.38 |
Beacon Street (Boston) |
Eastbound |
MA-2/Park Drive |
Commonwealth Avenue |
10:30 PM- 11:30 PM |
-9.34 |
Brookline Avenue (Boston) |
Eastbound |
Riverway/Park Drive |
Commonwealth Avenue |
10:00 PM- 11:30 PM |
-6.45 |
MA = Massachusetts highway route. MPH = miles per hour.
Source: INRIX.
Table 6 compares the crash rates on arterials and expressways near Fenway Park on weekdays in 2015 when the Red Sox night games were held to weekdays when night games were not held. The overall crash rates were slightly higher on game days than non-game days on both arterials and expressways and more crashes occurred per day on the arterials in the study area than on the expressways.
Table 6
Crashes on Days of Red Sox Night Games versus Non-Game Days, 2011-15
Event |
Number of Days (2015) |
Total Crashes on Arterials |
Crashes per Day on Arterials |
Total Crashes on Expressways |
Crashes per Day on Expressways |
Game Days |
42 |
113 |
2.7 |
67 |
1.6 |
Non-Game Days |
73 |
176 |
2.4 |
106 |
1.5 |
Source: INRIX.
Table 7 shows the locations where the most crashes occurred on game days. The location where the most crashes occurred is the Charlesgate interchange, which experienced a 74 percent increase in crashes on game days versus non-game days. The location that experienced the most significant increase in crash rate was Beacon Street, between Winchester Street and Harvard Avenue; the crash rate increased 248 percent on days when there were night games.
Table 7
Locations with the Most Crashes on Days of Red Sox Night Games
Route |
Location |
Crashes on Game Days |
Crashes per Day on Game Days |
Crashes on Non-game Days |
Crashes per Day on Non-game Days |
Change in Crashes per Day on Non-game Days |
Percent |
Storrow Drive |
Charlesgate Interchange |
9 |
0.21 |
9 |
0.12 |
0.09 |
74% |
Beacon Street |
Centre Street |
3 |
0.07 |
5 |
0.07 |
0 |
4% |
Route 9 |
The Shops at Chestnut Hill |
3 |
0.07 |
2 |
0.03 |
0.04 |
161% |
Storrow Drive |
Clarendon Street |
4 |
0.1 |
3 |
0.04 |
0.05 |
132% |
Beacon Street |
Winchester Street to Harvard Avenue |
4 |
0.1 |
2 |
0.03 |
0.07 |
248% |
Source: INRIX.
Chapter 7—Case Study: Saturdays
Congestion that occurs on Saturdays is assumed to be caused by non-work based trips, which may include travel for shopping, leisure, out of state travel, and events. These trips occur at various times of the day, resulting in traffic patterns that are unpredictable.
Originally, the CMP only monitored peak period congestion on weekdays. However, federal legislation passed in 2018 now requires MPOs to monitor congestion on Saturdays using the Level of Travel Time Reliability (LOTTR) performance measure. For this study, the 2015 INRIX dataset was used to compare Saturdays that correspond with CMP monitoring dates for two time periods: 12:00 PM to 4:00 PM and 4:00 PM to 8:00 PM. Traditional CMP performance measures (congested minutes, average speed, and travel time index) were used as a substitute for LOTTR to monitor Saturday congestion for this study.
The specific dates and times of the analysis, roadways and routes of focus, and datasets used in the analysis are as follows:
Figures 12 and 13 show the locations where vehicles experienced a decrease in speeds on Saturday afternoon and Saturday evenings compared to weekdays. The maps show the decrease in speeds for both arterials and expressways, comparing the Saturday afternoon period to the a typical weekday between 12:00 PM and 4:00 PM and the Saturday evening period compared to a typical weekday between 4:00 PM and 8:00 PM. During the Saturday afternoon period, travel speeds increased slightly on expressways and decreased slightly on arterials. The most significant speed decreases occurred in the downtown Boston area (particularly on Interstate 93) and in the suburbs.
On Saturday evenings, the average travel speeds increased by 5 MPH on expressways and 2 MPH on arterials, compared to weekdays at the same time. On Saturday evenings, there were significantly fewer locations that experienced decreases in speeds, compared to Saturday afternoons. Most of the locations where speeds decreased were concentrated on both Route 1 and Interstate 95, north of Boston where the two expressways converge. There were a small number of other locations across the region where speeds decreased.
Table 8 shows the performance results for expressways and arterials on Saturday afternoons and Saturday evenings, compared to the 12:00 to 4:00 PM and 4:00 to 8:00 PM weekday periods. The results for all of these performance measures show a slight increase in expressway travel speeds and a slight decrease in travel speeds on arterials on Saturday afternoons. Travel speeds increased noticeably on expressways and slightly on arterials on Saturday evenings.
Figure 12
Difference between Weekday Afternoon and Saturday Afternoon Travel Speeds
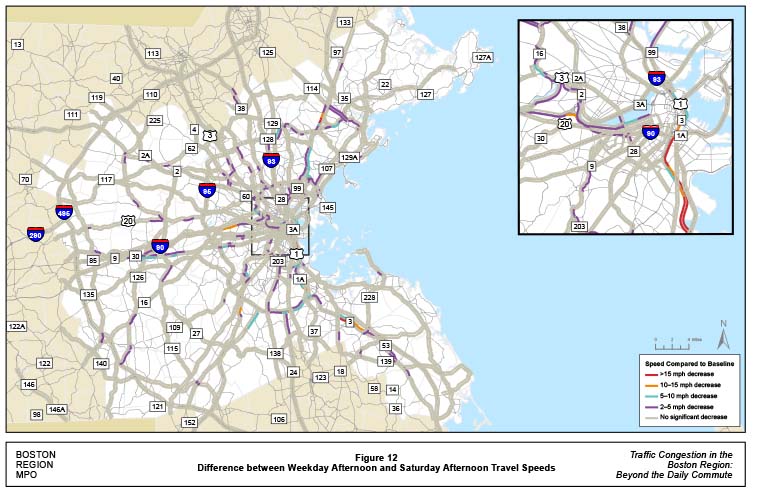
Figure 13
Difference between Weekday Evening and Saturday Evening Travel Speeds
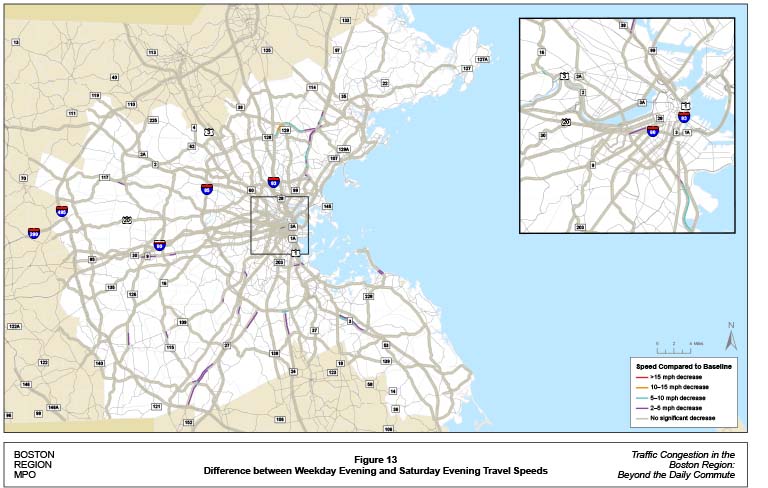
Table 8
Traffic Conditions on Expressways and Arterials:
Weekdays versus Saturdays
Performance Measure |
Weekday AM |
Weekday PM |
Saturday Afternoon |
Saturday Evening |
Expressway average speed (MPH) |
62.63 |
59.12 |
63.8 |
63.75 |
Expressway congested minutes |
1:29 |
5:25 |
1:39 |
1:10 |
Expressway travel time index |
1.04 |
1.11 |
1.03 |
1.03 |
Arterial average speed (MPH) |
28.79 |
27.83 |
28.46 |
29.37 |
Arterial congested minutes |
8:18 |
10:26 |
9:11 |
7:17 |
Arterial travel time index |
1.27 |
1.32 |
1.29 |
1.25 |
MPH = miles per hour.
Source: INRIX.
Table 9 show the expressway locations where the most significant speed reductions occurred on Saturdays between 12:00 PM and 4:00 PM. Except for Interstate 93, which is the only major north-south connector in the study area, all of these roadways are limited-access roadways that are not built to interstate standards. In addition, many of these expressways are near major shopping areas.
Route |
Direction |
From |
To |
Community |
Weekday Speed (MPH) |
12-4 PM Saturday Speed (MPH) |
Change in Speed (MPH) |
I-93 |
Northbound |
MA-203/Exit 12 |
US-1/Exit 24 |
Boston |
53.06 |
30.43 |
-22.63 |
MA-3 |
Southbound |
MA-18 /Exit 16 |
Derby Street St/Exit 15 |
Hingham, Weymouth |
59.92 |
38.37 |
-21.56 |
US-1 |
Southbound |
Lowell Street |
I-95/MA-128 |
Peabody |
43.71 |
25.44 |
-18.26 |
I-93 |
Southbound |
Massachusetts Ave/Exit 18 |
Morrissey Boulevard |
Boston |
43.44 |
28.22 |
-15.23 |
US-1 |
Southbound |
MA-99 |
MA-60 |
Revere |
44.18 |
30.66 |
-13.52 |
I = Interstate. MA = Massachusetts highway route. MPH = miles per hour. US = United States highway route.
Source: INRIX.
Table 10 shows the expressway locations that experience speed reductions on Saturdays from 4:00 PM to 8:00 PM. Again, some of these corridors are located on non-interstate roadways, near shopping areas and central business districts. For example, the Route 1 corridor is located on a right-in right-out limited-access roadway, which contains numerous shops and restaurants.
Route |
Direction |
From |
To |
Community |
Weekday Speed (MPH) |
4-8 PM Saturday Speed (MPH) |
Change in Speed (MPH) |
I-95 |
Southbound |
Walnut Street/ |
MA-28/Main Street/Exit 38 |
Lynnfield, Wakefield, Reading |
58.59 |
46.21 |
-12.38 |
I-93 |
Northbound |
Morrissey Boulevard/ |
Columbia Road/Exit 15 |
Boston |
45.40 |
36.87 |
-8.53 |
US-1 |
Southbound |
I-95/ Peabody Road |
I-95/MA-128 |
Peabody |
41.22 |
33.18 |
-8.04 |
I-93 |
Northbound |
MA-24/Exit 4 |
MA-28/ |
Quincy, Randolph |
55.73 |
48.88 |
-6.85 |
MA-3 |
Southbound |
MA-18/Exit 16 |
Derby Street/Exit 15 |
Hingham, Weymouth |
57.91 |
51.65 |
-6.26 |
I = Interstate. MA = Massachusetts highway route. MPH = miles per hour. US = United States highway route.
Source: INRIX.
Table 11 show the arterial locations where the most significant speed reductions occurred on Saturdays from 12:00 PM to 4:00 PM compared to the weekday peak periods. With the exception of Route 203 and Fresh Pond Parkway, all of the arterials where speed reductions occurred are located near shopping areas. Both the Route 9 and Route 30 corridors are located near the Natick Mall, which is analyzed in the Black Friday case study.
Route |
Direction |
From |
To |
Community |
Weekday Speed (MPH) |
12-4 PM Saturday Speed (MPH) |
Change in Speed (MPH) |
US-1 |
North-bound |
Pleasant Street |
Everett Street/ University Avenue |
Norwood |
36.65 |
26.45 |
-10.21 |
Fresh Pond Parkway |
East-bound |
MA-16/ Huron Avenue |
Mount Auburn Street |
Cambridge |
19.78 |
10.27 |
-9.50 |
MA-9 |
East-bound |
MA-30/ Edgell Road |
Oak Street |
Framingham, Natick |
32.51 |
23.55 |
-8.96 |
Memorial Drive |
West-bound |
New Rutherford Avenue |
MA-28/Charles Street |
Boston, Cambridge |
20.55 |
12.09 |
-8.46 |
MA-203 |
East-bound |
Granite Avenue/ Adams Street |
I-93/US-1/ MA-3A/ Southeast Expressway |
Boston |
21.84 |
14.57 |
-7.27 |
MA = Massachusetts highway route. MPH = miles per hour. US = United States highway route.
Source: INRIX.
Tables 12 show the arterial locations where the most significant speed reductions occurred between 4:00 PM and 8:00 PM. Unlike the 12:00 PM to 4:00 PM period, some locations where speed reductions occurred are not near shopping areas. Both Fresh Pond Parkway and Route 109 traverse residential areas. Most of the locations in Table 12 are in suburbs.
Route |
Direction |
From |
To |
Community |
Weekday Speed (MPH) |
4-8 PM Saturday Speed (MPH) |
Change in Speed (MPH) |
Fresh Pond Parkway |
East-bound |
Brattle Street |
Mount Auburn Street |
Cambridge |
16.29 |
10.94 |
-5.35 |
US-1 |
North-bound |
Madison Street |
North Street |
Wrentham, Foxboro |
40.29 |
35.17 |
-5.13 |
Morrissey Boulevard |
North-bound |
Popes Hill Street/ Tenean Street |
I-93/US-1/MA-3A/Freeport Street |
Boston |
29.12 |
24.07 |
-5.05 |
MA-9 |
East-bound |
Walnut Street |
Oak Street |
Natick |
28.32 |
24.99 |
-3.33 |
MA-109 |
East-bound |
Nahatan Street |
Gay Street |
Westwood |
24.89 |
21.61 |
-3.28 |
I = Interstate. MA = Massachusetts highway route. MPH = miles per hour. US = United States highway route.
Source: INRIX.
Table 13 shows a comparison of the number of crashes that occurred on Saturdays and the number of crashes that occurred on weekdays. The analysis covered 63 weekdays and 18 Saturdays between March and November 2015. The daily crash rate for both expressways and arterials was the highest during the weekday PM peak period. The Saturday evening crash rate was the lowest for both arterials and expressways. During the period analyzed, one fatality occurred during the weekday AM peak period on an expressway and another fatality occurred during a Saturday evening on an arterial.
Table 13
Crashes on Weekdays and Saturdays: March – November 2015
Measure |
CMP Weekdays AM Period |
CMP Weekdays PM Period |
CMP Saturday Afternoon |
CMP Saturday Evening |
Expressway crashes |
592 |
647 |
106 |
86 |
Expressway crash rate |
9.4 |
10.27 |
5.89 |
4.78 |
Expressway fatalities |
1 |
0 |
0 |
0 |
Arterial crashes |
869 |
1,299 |
288 |
195 |
Arterial crash rate |
13.79 |
20.62 |
16 |
10.83 |
Arterial fatalities |
0 |
0 |
0 |
1 |
CMP = Congestion Management Process.
Source: MassDOT Crash Database.
Table 14 shows the expressway locations in the region where the most crashes occurred on Saturdays in 2015. Interstate 93 at Interstate 95 in Woburn experienced the most Saturday crashes in 2015, followed by Route 3 at Route 18, and Interstate 93 at Furnace Brook Parkway. The number of crashes per day at all of the top ten crash locations were fewer on Saturdays as compared to weekdays.
Table 14
Expressway Locations with the Most Crashes on Weekends in 2015
Route |
Location |
Weekday Crashes |
Weekday Crashes per Day |
Saturday Crashes |
Saturday Crashes per Day |
Increase in Crashes per Day on Saturdays |
Percent Increase of Crashes per Day |
I-93 |
I-95 |
242 |
0.96 |
11 |
0.21 |
-0.76 |
-78.5% |
Route 3 South |
Route 18 |
91 |
0.36 |
9 |
0.17 |
-0.19 |
-53.2% |
I-93 |
Furnace Brook Parkway |
70 |
0.28 |
7 |
0.13 |
-0.15 |
-52.6% |
I-93 |
Route 28 |
83 |
0.33 |
7 |
0.13 |
-0.20 |
-60.1% |
Route 1 |
Between Route 60 and Lynn Street |
77 |
0.31 |
7 |
0.13 |
-0.17 |
-56.9% |
I = Interstate. MA = Massachusetts highway route. US = United States highway route.
Source: MassDOT Crash Database.
Table 15 shows the arterial locations in the region where the most crashes occurred on Saturdays in 2015. Most Saturday crashes occurred at Route 9 and Interstate 95 in Wellesley. The locations where crashes per day on Saturdays were highest relative to weekdays are Hanson Street and Route 1A in Lynn and Hopkins Street and Main Street in Reading.
Table 15
Arterial Locations with the Most Crashes on Weekends in 2015
Route |
Location |
Weekday Crashes |
Weekday Crashes per Day |
Saturday Crashes |
Saturday Crashes per Day |
Increase in Crashes per Day on Saturdays |
Percent Increase of Crashes per Day |
Route 9 and I-95 |
Wellesley |
120 |
0.48 |
5 |
0.22 |
-0.26 |
-54.5% |
East Main Street and Cedar Street |
Milford |
59 |
0.24 |
4 |
0.17 |
-0.06 |
-26.0% |
Route 28 |
Randolph |
70 |
0.28 |
4 |
0.17 |
-0.10 |
-37.6% |
Route 37 and Forbes Road |
Braintree |
81 |
0.32 |
4 |
0.17 |
-0.15 |
-46.1% |
Hanson Street and Route 1A |
Lynn |
19 |
0.08 |
4 |
0.17 |
0.10 |
129.7% |
I = Interstate. MA = Massachusetts highway route. US = United States highway route.
Source: MassDOT Crash Database.
In 2017, on-time performance for buses in the study area was on average 69 percent on Saturdays and 66 percent on weekdays. However, several routes experienced a decrease in on-time performance on Saturdays. They are displayed in Table 16. The most significant decrease was on Route 171, which experienced a 42 percent decrease in on-time performance on Saturdays as compared to weekdays. Route 171 connects Boston’s Roxbury neighborhood with Logan Airport through South Boston. The second highest decrease was on Route 90, where on-time performance decreased by 13 percent. The Route 90 bus travels from Davis Square in Somerville to Wellington Station in Medford. This route includes stops at Assembly Square in Somerville.
Table 16
MBTA Bus Routes with Significant Declines in On-Time Performance: Saturdays, 2017
Route |
Weekdays |
Saturday |
Difference |
171 |
59% |
17% |
-42% |
90 |
62% |
49% |
-13% |
104 |
59% |
48% |
-11% |
132 |
72% |
63% |
-9% |
86 |
58% |
50% |
-8% |
31 |
78% |
70% |
-8% |
9 |
75% |
67% |
-7% |
11 |
71% |
65% |
-6% |
89 |
62% |
57% |
-6% |
Source: MBTA Back on Track website.
Consider expanding the schedule for the Cape Flyer train, which travels from Boston to Hyannis, to provide year round service. The Cape Flyer currently runs from Memorial Day to Labor Day. This train provides travelers an alternative to driving from Boston to Cape Cod. Increasing train service would help alleviate a bottleneck on Route 3 southbound en route to Cape Cod.
Chapter 8—Case Study: Super Bowl Parade
When the New England Patriots football team wins the Super Bowl, it is customary for the City of Boston to host a victory parade, which draws thousands of spectators to downtown Boston. Following the Patriots’ Super Bowl victory in 2015, a parade was held on Wednesday, February 4, following a snow storm that occurred earlier in the week.9
The parade, coupled with the effects of the snow storm, had an adverse effect on traffic congestion in the morning of February 4. Figure 14 shows the parade route, which began at the Prudential Tower and ended at City Hall Plaza.10 Specifically, the parade traveled from the Prudential Tower eastbound on Boylston Street to Tremont Street. From there, the parade traveled northbound on Tremont Street and continued on Cambridge Street until reaching City Hall. The street closures included Boylston Street from Massachusetts Avenue to Tremont Street, Tremont Street from Boylston Street to Court Street, and Cambridge Street from Court Street to New Chardon Street.
Many additional trips were made that day by automobile and transit by fans attending the parade. The parade began at 11:00 AM, but many fans arrived earlier to settle into a good viewing location. This case study compared traffic congestion on the region’s roadways on the date of the Super Bowl parade with the traffic congestion that occurred on a typical weekday.
Figure 14
Patriots Super Bowl Parade Route
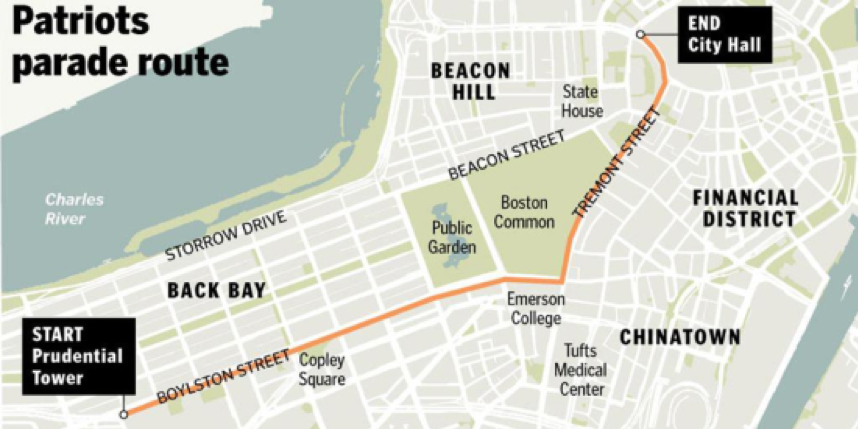
Source: Boston Globe.
The specific dates and times of the analysis, roadways and routes of focus, and datasets used in the analysis are as follows:
Figure 15 shows the expressway and arterial locations where travel speeds decreased on the morning of the Super Bowl parade versus a typical weekday. The most significant decreases occurred at select arterials in downtown Boston and expressways in the suburbs that lead to Boston. The widespread decreases in travel speeds might be attributed to the fact that the region experienced a major snow storm the day before the parade.
Table 17 compares the performance results for expressways and arterials on a typical weekday AM peak period and on the date of the Super Bowl parade. On the date of the parade, the average speeds on expressways decreased 2.7 MPH and the congested minutes per peak period hour increased by approximately 1.5 minutes. In addition, the travel time index on expressways increased by 0.05. This shows that traffic congestion increased slightly regionwide on expressways on the date of the parade, compared to a typical weekday.
On the day of the parade, the average speeds on arterial roadways decreased 0.5 MPH and the number of congested minutes decreased slightly. One reason that an increase in congestion was not evident is that parade traffic on arterials increased after the AM peak period ended as the parade began at 11:00 AM (the AM peak period is 6:30 AM to 9:30 AM). Additionally, local street closures and increased travel on arterials occurred closer to the start of the parade. In addition, many attendees might have opted to take public transportation to the parade rather than drive on the arterials close to Boston and look for parking.
Figure 15
Difference between Weekday Morning and Super Bowl Parade Morning Travel Speeds
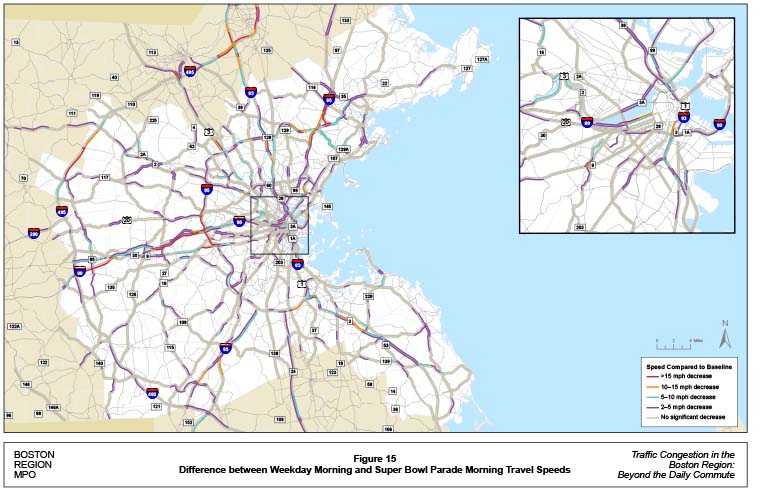
Table 17
Traffic Conditions on Expressways and Arterials: Weekdays versus Super Bowl Parade Day
Performance Measure |
Weekday AM |
Super Bowl Parade AM |
Expressway AM average speed (MPH) |
58.89 |
56.18 |
Expressway AM congested minutes |
5:44 |
7:25 |
Expressway AM travel time index |
1.11 |
1.16 |
Arterial AM average speed (MPH) |
28.24 |
27.67 |
Arterial AM congested minutes |
9:28 |
9:14 |
Arterial AM travel time index |
1.3 |
1.33 |
MPH = miles per hour.
Source: INRIX.
Tables 18 show the expressway locations where the most significant decreases in travel speeds occurred on the day of the parade. At some locations, speed decreases were as high as 53 MPH on the date of the parade. All of these locations are either on or outside the Route 128 corridor, which indicates that the most significant increase of traffic on the day of the parade might have been caused by fans from the suburbs driving directly into Boston or to an MBTA station.
Table 18
Expressway Locations with Significant Speed Decreases: Super Bowl Parade Day
Route |
Direction |
From |
To |
Times |
Speed (MPH) |
Change in Speed from Normal Peak Period (MPH) |
Worst Location |
I-95 |
Southbound |
MA-114/Andover Street/Exit 47 (Topsfield) |
MA-128/Exit 45 (Peabody) |
6 AM - 9 AM |
12.46 |
-53.54 |
US 1 to Route 128 |
I-95 |
Southbound |
MA-28/Main Street/Exit 38 (Reading) |
Totten Pond Road/Winter Street/Exit 27 (Waltham) |
9 AM - 11 AM |
10.13 |
-50.78 |
Middlesex Turnpike |
I-495 |
Southbound |
MA-97/Broadway/Exit 50 (Haverhill) |
I-93/Exit 40 (Andover) |
7 AM - 10 AM |
13.14 |
-48.67 |
Marston Street/ Merrimack Street |
I-90 |
Eastbound |
I-495 (Westborough) |
Exit 14 (Weston) |
8 AM - 11 AM |
18.19 |
-46.69 |
Route 30/Exit 13 |
MA-24 |
Southbound |
MA-123/Exit 17 (Brockton) |
US-44/Exit 13 (Bridgewater) |
4 PM - 5 PM |
16.54 |
-46.55 |
Route 104 |
I = Interstate. MA = Massachusetts highway route. MPH = miles per hour. US = United States highway route.
Source: INRIX.
Tables 19 show the arterial locations that had the most significant decreases in travel speeds on the day of the parade. These locations are throughout the Boston region, but some notable arterials are close to the parade route, including Storrow Drive and Brookline Avenue in Boston. These locations experienced speed reductions of as much as 35 MPH.
Table 19
Arterial Locations with Significant Speed Decreases: Super Bowl Parade Day
Route |
Direction |
From |
To |
Times |
Speed (MPH) |
Change in Speed from Normal Peak Period (MPH) |
Worst Location |
MA-9 |
Eastbound |
Weston Road (Natick) |
Cedar Street (Wellesley) |
7 AM - 12 PM |
9.03 |
-35.33 |
Oakland Street to Cedar Street |
Storrow Drive |
Westbound |
MA-28/Embankment Road (Boston) |
MA-2A/Massachusetts Avenue (Boston) |
7 AM – 12 PM |
15.28 |
-26.24 |
Clarendon Street to Massachusetts Avenue |
MA-28 |
Northbound |
Franklin Street (Stoneham) |
Montvale Avenue (Stoneham) |
5 AM – 6 AM |
23.00 |
-25.48 |
Franklin Street to Montvale Avenue |
MA-9 |
Eastbound |
MA-27/Main Street (Natick) |
Oak Street (Natick) |
2 PM – 3 PM |
11.08 |
-22.31 |
Walnut Street to Oak Street |
Storrow Drive |
Eastbound |
Charlesgate (Boston) |
MA-28/Embankment Road (Boston) |
8 AM – 10 AM |
16.97 |
-21.30 |
Boylston Street to Clarendon Street |
MA = Massachusetts highway route. MPH = miles per hour. US = United States highway route.
Source: INRIX.
Table 20 compares the number of crashes that occurred on the day of the Super Bowl parade with a typical weekday. This analysis compared crash frequencies and crash rates for expressways and arterials on the day of the Super Bowl Parade, February 4, 2015, to other weekdays in 2015. There were 46 crashes on expressways and 66 crashes and on arterials on the day of the parade. On other weekdays, there were 8,194 crashes, including 23 fatal crashes, on expressways and 16,035 crashes, including 26 fatal crashes, on arterials. The average daily crash rate was 31.3 per day and the fatal crash rate was 0.1 per day on expressways. The average daily crash rate was 61.2 per day and the fatal crash rate was 0.1 per day on arterials. Compared with other weekdays, the daily crash rate on Super Bowl Parade day increased 47 percent for expressways and 8 percent for arterials.
Table 20
Crashes and Fatalities: Super Bowl Parade Day versus Weekdays, 2015
Measure |
CMP Weekdays |
Super Bowl Parade Day |
Expressway crashes |
8,194 |
46 |
Expressway crash rate |
31.3 |
46 |
Expressway fatalities |
23 |
0 |
Expressway fatality rate |
0.1 |
0 |
Arterial crashes |
16,035 |
66 |
Arterial crash rate |
61.2 |
66 |
Arterial fatalities |
26 |
0 |
Arterial fatality rate |
0.1 |
0 |
Source: MassDOT Crash Database.
Inform the public about the location of the parade and road closures by social media, and news and radio outlets so that commuters can properly plan their travel for the day.
Chapter 9—Case Study: Wednesday before Thanksgiving
The day before Thanksgiving is a busy travel day. Oftentimes, travelers will leave the Boston region to travel to other areas of the country. Typically, travelers leave the Boston region during various times during the week, but the most popular time to leave is the Wednesday before Thanksgiving, between 12:00 PM and 10:00 PM.
This case study analyzed four expressway corridors in the region that typically contain the most congested locations on the day before Thanksgiving, according to Boston.com: Interstate 93 northbound between Interstate 90 and the New Hampshire border, Interstate 93 southbound between the Zakim Bridge and Interstate 95, Interstate 95 northbound from Interstate 90 to the New Hampshire border, and Interstate 95 from Interstate 93 to the Rhode Island border .11
The specific dates and times of the analysis, roadways and routes of focus, and datasets used in the analysis are as follows:
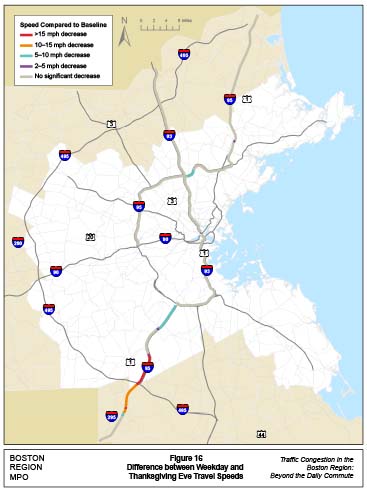
Figure 16 shows the locations where travel speeds decreased on the Wednesday before Thanksgiving in 2015 versus a typical weekday. Of the four corridors that were analyzed in this case study; the main locations where travel speeds decreased were Interstate 95 southbound between Interstate 93 and Interstate 290, Interstate 95 northbound at Route 62, and Interstate 95 northbound between Interstate 93 and Route 28.
Tables 21 and 22 show the performance results for the Interstate 93 and Interstate 95 corridors, respectively. Of the corridors, Interstate 93 southbound between the Zakim Bridge and Interstate 95 was the most congested on November 25, 2015; this location ranked as the worst in terms of congested minutes, average speed, delay per mile, bottleneck factor, and travel time index.
Figure 16
Difference between Weekday and Thanksgiving Eve Travel Speeds
Performance Measure |
I-93 Northbound (Boston – New Hampshire) Weekday |
I-93 Northbound (Boston – New Hampshire) Holiday |
I-93 Southbound (Boston –Dedham) Weekday |
I-93 Southbound (Boston –Dedham) Holiday |
Distance (miles) |
29.86 |
29.86 |
18.06 |
18.06 |
Congested minutes per hour |
21:22 |
6:00 |
34:30 |
30:00 |
Average travel time |
44:35 |
36:23 |
40:31 |
31:55 |
Average speed (MPH) |
40.19 |
49.24 |
26.7 |
33.97 |
Average delay (minutes) |
17:25 |
9:13 |
23:08 |
14:31 |
Bottleneck factor |
0.86 |
.19 |
1.73 |
1.23 |
Travel time index |
1.64 |
1.34 |
2.32 |
1.83 |
Travel time / planning time ratio |
48% |
39% |
49% |
38% |
Source: INRIX.
Performance Measure |
I-95 Northbound (Weston – New Hampshire) Weekday |
I-95 Northbound (Weston – New Hampshire) Holiday |
I-95 Southbound (Dedham- Rhode Island) Weekday |
I-95 Southbound (Dedham- Rhode Island) Holiday |
Distance (miles) |
51.50 |
51.50 |
26.07 |
26.07 |
Congested minutes per hour |
11:55 |
3:30 |
04:48 |
3:00 |
Average travel time |
61:18 |
56:22 |
26:29 |
28:13 |
Average speed (MPH) |
50.4 |
54.82 |
59.1 |
55.45 |
Average delay (minutes) |
14:38 |
9:41 |
3:31 |
1:24 |
Bottleneck factor |
0.49 |
.10 |
0.19 |
.09 |
Travel time index |
1.31 |
1.21 |
1.15 |
1.23 |
Travel time / planning time ratio |
53% |
88.9% |
59% |
102.8% |
Source: INRIX.
Figures 17, 18, 19, and 20 show the travel times on the corridors studied. Travel times on all four corridors were longer than travel times during a typical peak period at points between 12:00 PM and 10:00 PM on the day before Thanksgiving. Travel times on Interstate 95 southbound were longer than the planning time index of a typical weekday between 4:00 PM and 4:15 PM.
There was a spike in congestion on Interstate 93 northbound between Interstate 90 and the New Hampshire border beginning at 12:30 PM and continuing until 4:00 PM. After 4:00 PM, the travel times improved significantly until reaching free-flow travel time levels by 5:15 PM. The most congested location was between Interstate 95 and Interstate 495, which experienced congestion worse than that of a typical weekday peak period between 12:45 PM and 3:15 PM. At this time, the travel time index increased to 2.18, which is significantly higher than the travel time index of 1.64 as occurs on a typical PM peak on a weekday. In addition, this location experienced an average of 18 congested minutes per hour at this time.
Figure 17
Travel Times on I-93 Northbound from I-90 Interchange, Boston, to New Hampshire Border
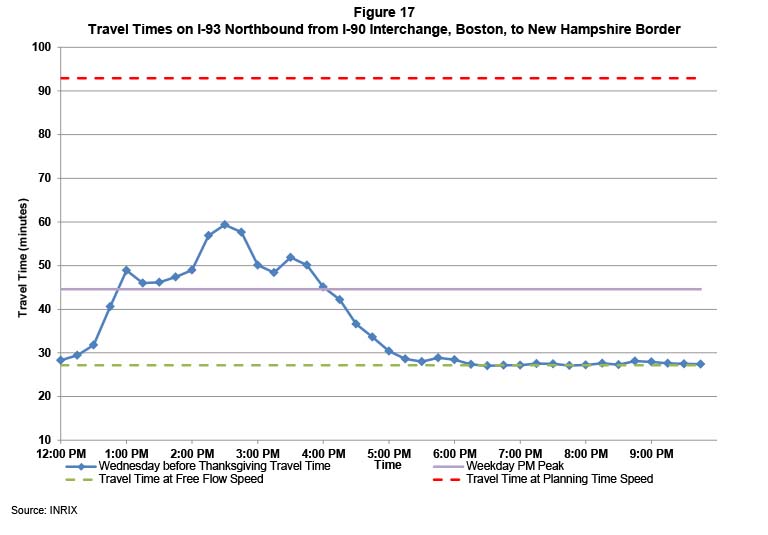
On November 25, 2015, I-93 southbound between Zakim Bridge and Interstate 95 was the most congested of the corridors analyzed. Travel times on Interstate 93 southbound were as much as 50 percent longer than on a peak period of a typical weekday between 2:00 PM and 4:30 PM. The entire corridor experienced extreme congestion. Between 2:00 PM and 4:30 PM the travel time index increased to 3.37 and there were 60 minutes of congestion per hour, which is the maximum. The analysis showed that Interstate 93 was constantly congested during this time and that travelers would have had to budget at least three times as much travel time to arrive at their destination on time versus when there are free-flow conditions.
Figure 18
Travel Times on I-93 Southbound from Zakim Bridge, Boston, to I-95 Interchange, Dedham
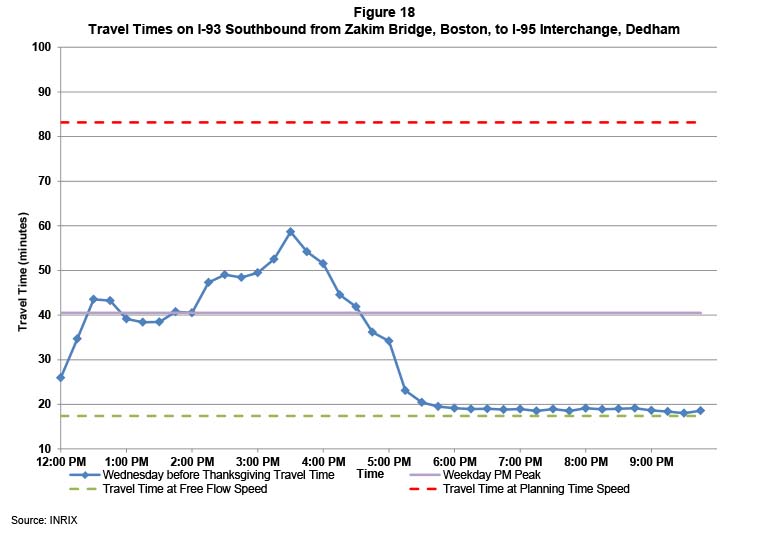
Interstate 95 northbound between Interstate 90 and the New Hampshire border experienced congestion that spikes between 3:00 PM and 4:00 PM on the Wednesday before Thanksgiving. The congestion level was 68 percent worse than on a typical weekday PM peak period. The spike in travel times on Interstate 95 northbound lasted a relatively short time, between 2:45 PM and 4:15 PM. The most congested location on the Interstate 95 northbound corridor was between Route 3 and I-93, where the travel time index spiked to 1.68 and there were 10.5 minutes of congestion per hour during the analysis period.
Figure 19
Travel Times on I-95 Northbound from I-90 Interchange, Weston, to New Hampshire Border
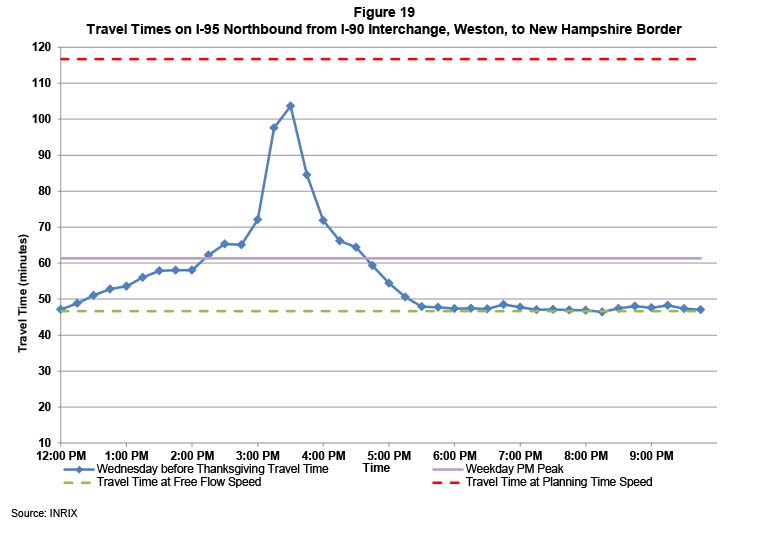
On November 25, 2015, Interstate95 southbound between Interstate 93 and the Rhode Island border experienced congestion up to 75 percent higher than a typical peak period. This corridor also briefly experienced travel times that were two percent longer than the planning time index travel time. The most congested times were between 3:45 PM and 5:00 PM and the congestion lasted from 2:45 PM to 6:00 PM. The most congested location was Interstate 95 between Interstate 93 and Interstate 495, which experienced travel times that were six percent higher than the weekday planning time index, and there were six congested minutes for every hour during the monitoring period.
Figure 20
Travel Times on I-95 Southbound from I-93 Interchange, Dedham, to Rhode Island Border
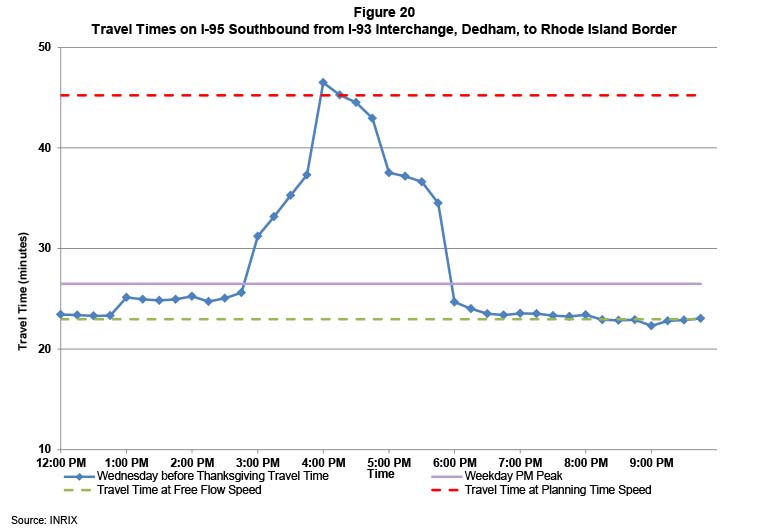
Tables 23 and 24 show the most congested corridors during a typical weekday and on the day before Thanksgiving on I-93 and I-95, respectively. On the day before Thanksgiving, the most congested locations and times along the corridors that were analyzed were as follows:
Interstate 95 between Interstate 93 and Interstate 495 experienced the highest increase in congested minutes per hour, with an increase of 27 minutes per hour. This corridor also had the most significant decline in travel speeds, with a decrease of 26.5 MPH on the day before Thanksgiving, compared to the weekday PM peak period. Travel times on this section of Interstate 95 were nearly as high as the planning time index travel time. Interstate 93 southbound from the Zakim Bridge to Route 3 had the highest increase in average delay and the highest travel time index during the most congested time. Interstate 95 northbound had the highest bottleneck factor during its most congested time.
Performance Measure |
I-93 North – I-95 to I-495 (Reading – Andover)-Weekday |
I-93 North – I-95 to I-495 (Reading – Andover)-Holiday |
I-93 South – Zakim Bridge to Route 3 (Boston – Braintree)-Weekday |
I-93 South – Zakim Bridge to Route 3 (Boston – Braintree) -Holiday |
I-93 South – Route 3 to I-95 (Braintree- Dedham)-Weekday |
I-93 South – Route 3 to I-95 (Braintree- Dedham) - Holiday |
Time of analysis |
PM Peak |
2:15 PM- |
PM Peak |
3:00 PM- |
PM Peak |
3:00 PM- |
Distance (miles) |
12.02 |
12.02 |
10.85 |
10.85 |
7.21 |
7.21 |
Congested minutes per hour |
11:28 |
27:37 |
46:31 |
57:13 |
16:26 |
28:06 |
Average travel time |
13:59 |
21:07 |
27:07 |
39:41 |
8:54 |
13:04 |
Average speed (MPH) |
51.55 |
34.15 |
24.02 |
16.40 |
48.61 |
33.10 |
Average delay (minutes) |
3:29 |
10:37 |
16:20 |
28:55 |
2:17 |
6:27 |
Bottleneck factor |
0.43 |
1.10 |
2.44 |
2.93 |
0.78 |
2.66 |
Travel time index |
1.33 |
2.01 |
2.52 |
3.68 |
1.35 |
1.97 |
Travel time / planning time ratio |
48% |
73% |
42% |
61% |
49% |
73% |
MPH = miles per hour.
Source: INRIX.
Performance Measure |
I-95 North – |
I-95 North – |
I-95 South – (Dedham–Foxborough |
I-95 South – (Dedham–Foxborough) |
Time of analysis |
PM Peak |
3:15 PM – 4:15 PM |
PM Peak |
4:00 PM – 5:00 PM |
Distance (miles) |
5.72 |
5.72 |
14.19 |
14.19 |
Congested minutes per hour |
36:10 |
43:45 |
6:05 |
33:38 |
Average travel time |
10:08 |
20:37 |
14:37 |
26:46 |
Average speed (MPH) |
33.84 |
16.64 |
58.29 |
31.82 |
Average delay (minutes) |
4:50 |
15:19 |
2:05 |
14:14 |
Bottleneck factor |
1.93 |
3.77 |
0.22 |
1.45 |
Travel time index |
1.91 |
3.14 |
1.17 |
2.14 |
Travel time / planning time ratio |
31% |
63% |
53% |
97% |
MPH = miles per hour.
Source: INRIX.
The traffic conditions on the four most congested roadway TMC locations of the corridors described in table 23 and table 24 on the day before Thanksgiving are described below.
This 2.5 mile stretch of roadway contains three interchanges. The most congestion was seen at this location between 2:15 PM and 2:45 PM. During that period, this location was congested every minute. The delay per mile was two minutes and 33 seconds and the travel time index spiked to 3.96 at this location. This section of Interstate 93 northbound has a narrow breakdown lane, therefore additional congestion can result during an incident.
The most congestion at this location occurred between 3:00 PM and 4:00 PM. This location includes the Braintree Split, where Route 3 diverges from Interstate 93. The bottleneck continues to the exit to Route 28, which is the exit before Route 24 diverges from Interstate 93 leading to locations such as New Bedford and Fall River. This location was congested for the full 60 minutes during the worst hour of the analysis. Also during the worst hour, this location had a delay per mile of up to two minutes and 10 seconds per mile and a travel time index of 3.31. Congestion at this location could be caused by weaving movements of vehicles at both the Braintree Split and before Route 24. Drivers commonly have to cross two or three lanes to exit or avoid exiting Interstate 93.
The most congested time at this location was between 3:15 AM and 4:15 PM. This location experienced congestion during this entire time with a delay per mile of five minutes and 13 seconds. The travel time index at this location was 7.33. There is a brief lane drop on Interstate 95 northbound at Interstate 93, where the expressway goes from four lanes to three lanes plus an auxiliary lane, which could be the cause of the bottleneck. The bottleneck may have been amplified because of a crash on Interstate 95 near North Avenue in Wakefield during this travel time sample.
The most congested time at this location was between 4:00 PM and 5:00 PM, when congested conditions endured for the entire hour. The delay per mile at this location was two minutes and 25 minutes per mile. The travel time index at this location was 3.78. The geometric configurations of the interchange between Interstate 95 and Interstate 495 should be analyzed to determine if improvements are needed at this interchange.
Figure 21 shows the five-year trend for crashes on the day before Thanksgiving. In most years, the number of crashes during the day before Thanksgiving is slightly higher than the number of crashes on a typical day for the corridors analyzed in this case study. However, there was a noticeable spike in crashes in 2013, where there were 17 crashes on the day before Thanksgiving compared to 6.15 crashes on a typical day at these locations in 2013. The reason for this spike in crashes on this date can be attributed to a rainstorm that dropped over an inch of water. In 2013, the most significant spikes in crashes on the day before Thanksgiving occurred on Interstate 93 between the Zakim Bridge and Route 3 and on Interstate 95 southbound between Interstate 495 and the Rhode Island border.
The locations that had the most crashes on the day before Thanksgiving between 2011 and 2015 were Interstate 95 northbound at Route 20 and Interstate 93 southbound at Neponset Circle; three crashes occurred at each location. On Interstate 95 northbound at Route 20, two of the three crashes were either rear-end or angle collisions. On Interstate 93 southbound at Neponset Circle, all three crashes were sideswipes in the same direction, which could indicate that vehicles changing lanes to exit the expressway caused the crashes. In addition, there was a crash on Interstate 95 northbound in Wakefield at 2:45 PM on November 25, 2015. This crash did result in an injury and was probably the cause of the spike in congestion on Interstate 95 northbound on that date.
Figure 21
Five-Year Crash Trend, Day before Thanksgiving, 2011-15
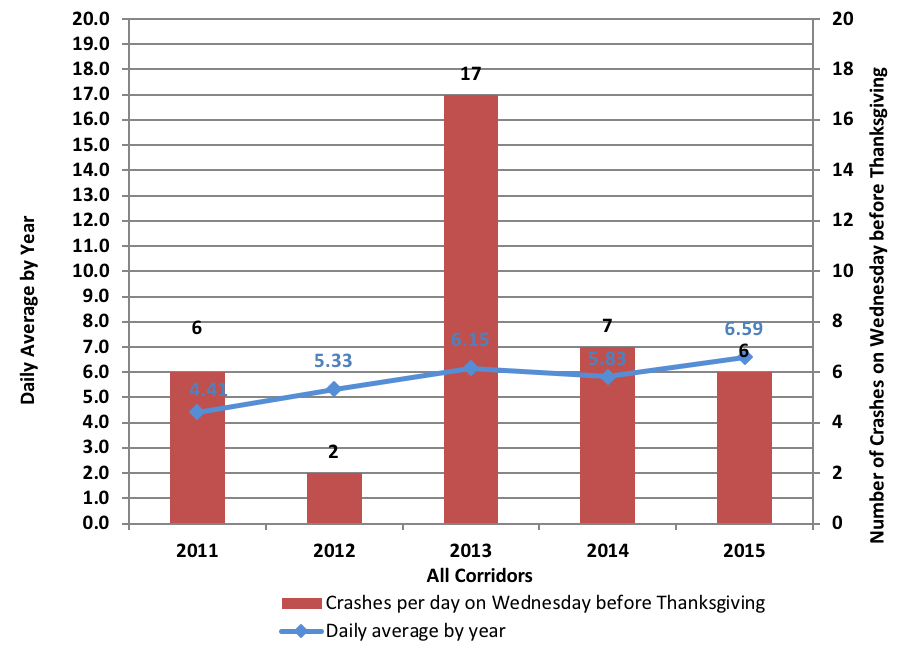
Source: MassDOT Crash Database.
Table 25
Recommended Times to Leave Boston on the Day before Thanksgiving
Corridor |
I-93 Northbound |
I-93 Southbound |
I-95 Northbound (from I-90) |
I-95 Southbound (from I-93 in Westwood) |
Recommended leave time |
Leave before 12:00 PM or after 4:45 PM |
Leave before 12:00 PM or after 5:15 PM |
Leave before 12:30 PM or after 5:00 PM |
Leave before 2:30 PM or after 6:00 PM |
Source: Central Transportation Planning Staff.
Chapter 10—Case Study: Fridays
Typically, through the CMP, congestion in the Boston region is monitored on Tuesdays, Wednesdays, and Thursdays. However, congestion that occurs on Fridays may be more extreme than mid-week congestion. The Friday evening peak period (3:00 PM to 7:00 PM) includes both work-based trips and trips for travelers heading out of town for the weekend. One possible cause of congestion on Fridays is traffic created by Boston area residents who leave the region for the weekend by taking Interstates 93, 90, 95, and Route 3.
The specific dates and times of the analysis, roadways and routes of focus, and datasets used in the analysis are as follows:
The entire expressway system for the Boston region was analyzed for the Friday PM peak period and compared to a typical CMP monitored weekday (Tuesdays, Wednesdays, and Thursdays). Figure 22 shows the expressway locations that experienced a decrease in speed during the Friday PM peak, compared to a typical weekday PM peak. The locations where the most significant speed decreases occurred on Fridays were on the expressways leading away from Boston, and on Interstate 495 between Lowell and Lawrence.
Table 26 compares the performance results for all expressways in the Boston region during the Friday PM peak period to the PM peak period of a typical weekday in 2015. Throughout the region, the expressways speeds decreased by 2 MPH during the Friday PM peak period compared to the peak period of a typical weekday. In addition, the congested minutes per hour increased by 2.5 minutes on Fridays.
Figure 22
Difference between Weekday and Friday Afternoon and Evening Travel Speeds
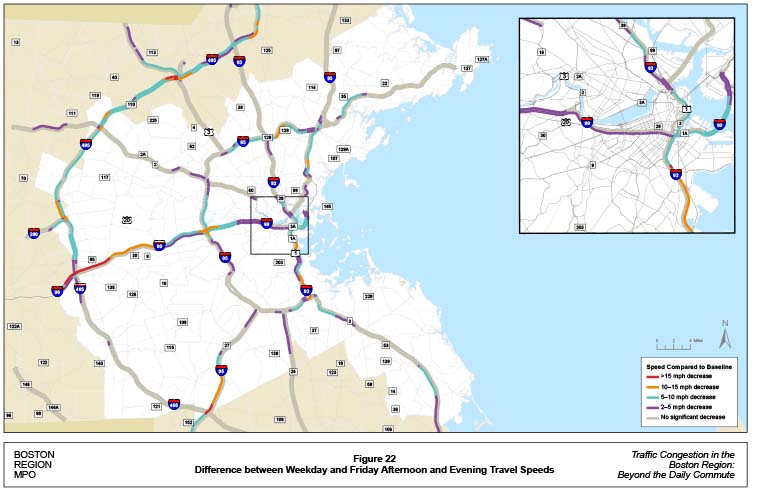
Table 26
Traffic Conditions on Expressways: Weekdays versus Fridays, PM Peak Period
Performance Measure |
Weekday (Tuesday – Thursday) PM |
Friday PM |
Average speed (MPH) |
58.84 |
56.83 |
Congested minutes |
5:54 |
8:21 |
Travel Time index |
1.11 |
1.15 |
MPH = miles per hour.
PM Peak Period = 3:00 PM to 7:00 PM.
Source: INRIX.
Tables 27, 28, 29 and 30 compare the performance results for the corridors of interest in this case study. Of the corridors, Interstate 93 southbound had the most congested minutes per hour, 19.16 minutes. All corridors experienced a net increase of travel time during the PM peak periods on Fridays. However, Interstate 90 westbound experienced the most percentage change in travel time between Fridays and a typical weekday. The most congested time was between 4:00 PM and 5:00 PM on Interstate 93 northbound and Interstate 95 northbound. The most congested time on all of the other corridors was between 5:00 PM and 6:00 PM.
Table 27
Friday Traffic Conditions on Expressways: I-90, Fridays, PM Peak
Performance Measure |
I-90 Westbound |
I-90 Westbound |
Distance (miles) |
30.11 |
30.11 |
Congested minutes per hour |
14:23 |
26.25 |
Average travel time |
38:16 |
47:16 |
Average speed (MPH) |
47.21 |
38.22 |
Average delay (minutes) |
9:55 |
18:55 |
Bottleneck factor |
.59 |
.79 |
Travel time index |
1.35 |
1.67 |
Travel time / planning time ratio |
46% |
57% |
MPH = miles per hour.
PM Peak Period= 3:00 PM to 7:00 PM.
Source: INRIX
Table 28
Friday Traffic Conditions on Expressways: I-93, Fridays, PM Peak
Performance Measure |
I-93 Northbound (Boston – New Hampshire) (Tuesday-Thursday) |
I-93 Northbound (Boston – New Hampshire) (Friday) |
I-93 Southbound (Boston – Dedham) (Tuesday-Thursday) |
I-93 Southbound (Boston – Dedham) (Friday) |
Distance (miles) |
29.86 |
29.86 |
18.06 |
18.06 |
Congested minutes per hour |
21:22 |
18:45 |
34:30 |
52:30 |
Average travel time |
44:35 |
44:31 |
40:31 |
41:14 |
Average speed (MPH) |
40.19 |
40.24 |
26.7 |
26.3 |
Average delay (minutes) |
17:25 |
17:21 |
23:08 |
23:50 |
Bottleneck factor |
0.86 |
.56 |
1.73 |
2.10 |
Travel time index |
1.64 |
1.64 |
2.32 |
2.37 |
Travel time / planning time ratio |
58% |
48% |
49% |
50% |
MPH = miles per hour.
PM Peak Period= 3:00 PM to 7:00 PM.
Source: INRIX.
Table 29
Friday Traffic Conditions on Expressways: I-95, Fridays, PM Peak
Performance Measure |
I-95 Northbound (Weston – New Hampshire) (Tuesday-Thursday) |
I-95 Northbound (Weston – New Hampshire) (Friday) |
I-95 Southbound (Dedham – Rhode Island) (Tuesday-Thursday) |
I-95 Southbound (Dedham – Rhode Island) (Friday) |
Distance (miles) |
51.50 |
51.50 |
26.07 |
26.07 |
Congested minutes per hour |
11:54 |
14:17 |
4:48 |
4.62 |
Average travel time |
61:18 |
66:57 |
26:29 |
28:30 |
Average speed (MPH) |
50.4 |
46.15 |
59.1 |
54.88 |
Average delay (minutes) |
14.38 |
20:17 |
3:31 |
5:32 |
Bottleneck factor |
.49 |
.73 |
0.19 |
0.16 |
Travel time index |
1.31 |
1.43 |
1.15 |
1.24 |
Travel time / planning time ratio |
53% |
57% |
59% |
63% |
MPH = miles per hour.
PM Peak Period= 3:00 PM to 7:00 PM.
Source: INRIX.
Table 30
Friday Traffic Conditions on Expressways: Route 3 South, Fridays, PM Peak
Performance Measure |
Route 3 South |
Route 3 South |
Distance (miles) |
42.47 |
42.47 |
Congested minutes per hour |
2.40 |
3.12 |
Average travel time |
43:52 |
45:01 |
Average speed (MPH) |
58.09 |
56.6 |
Average delay (minutes) |
5:03 |
6:13 |
Bottleneck factor |
0.10 |
.17 |
Travel time index |
1.13 |
1.16 |
Travel time / planning time ratio |
83% |
85% |
MPH = miles per hour.
PM Peak Period= 3:00 PM to 7:00 PM.
Source: INRIX.
Figures 23, 24, 25, 26, 27, and 28 show the travel speeds for Friday afternoons and evenings on Interstate 90 westbound, Interstate 93 northbound, Interstate 93 southbound, Interstate 95 northbound, Interstate 95 southbound, and Route 3 southbound, respectively. Interstate 90 westbound experienced the largest decline in travel speeds relative to a typical weekday; travel speeds were as much as 12.4 MPH (27 percent) slower at 5:00 PM on Fridays versus the same time on a typical weekday. On Interstate 93 northbound, the Friday speeds were slower before 5:00 PM and slightly faster after 5:00 PM. On Interstate 93 southbound, the Friday speeds were slower before 6:00 PM and nearly even afterwards. On Interstate 95 northbound, the travel speeds were slower on Friday between 2:00 PM and 7:00 PM and nearly even afterwards. On Interstate 95 southbound, the Friday speeds were slower between 3:00 PM and 9:00 PM. On Route 3 southbound, the Friday speeds were slower between 1:00 PM and 8:00 PM. The sustained decrease in speeds on Interstate 95 southbound and Route 3 southbound were likely due to the fact that these corridors are located further away from Boston than the other corridors. These corridors likely carry a higher percentage of travelers who are leaving the Boston region.
Figure 23
Travel Speeds on I-90 Westbound: Typical Weekday versus Friday
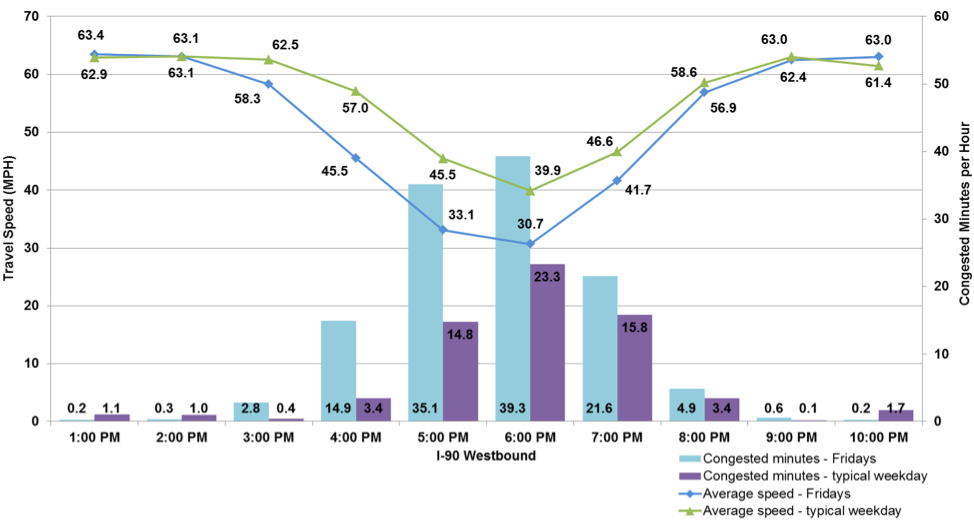
Figure 24
Travel Speeds on I-93 Northbound: Typical Weekday versus Friday
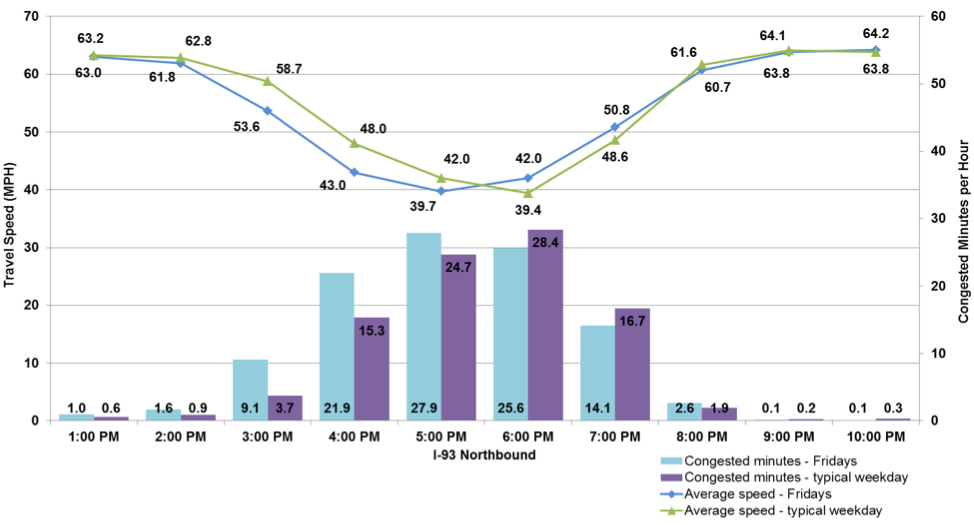
Figure 25
Travel Speeds on I-93 Southbound: Typical Weekday versus Friday
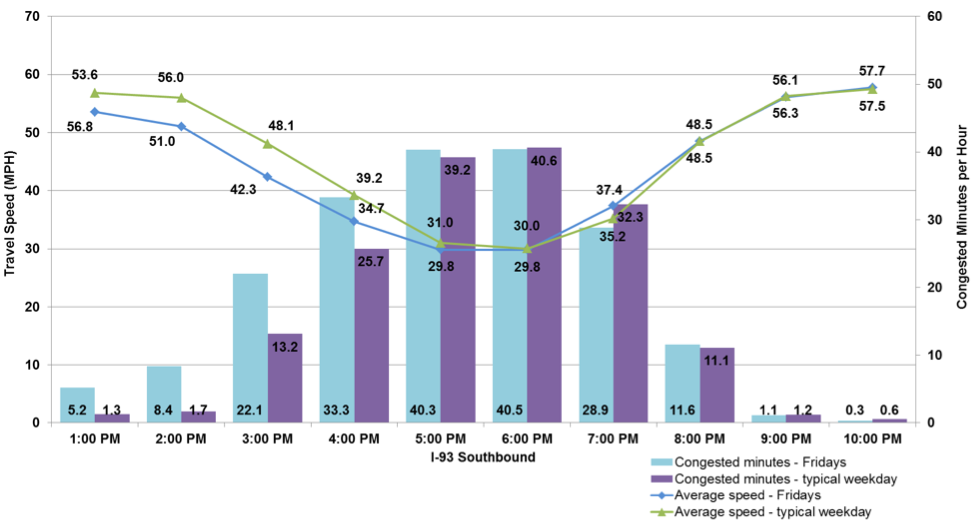
Figure 26
Travel Speeds on I-95 Northbound: Typical Weekday versus Friday
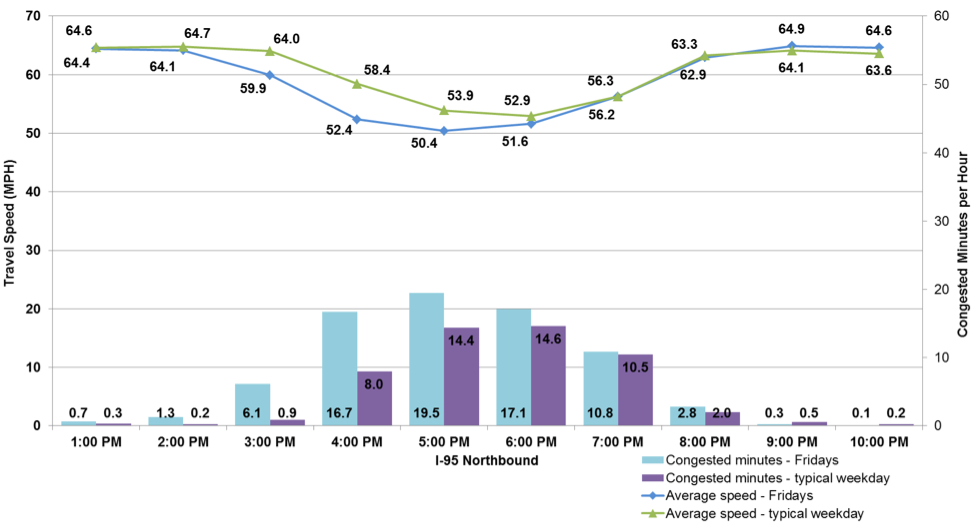
Figure 27
Travel Speeds on I-95 Southbound: Typical Weekday versus Friday
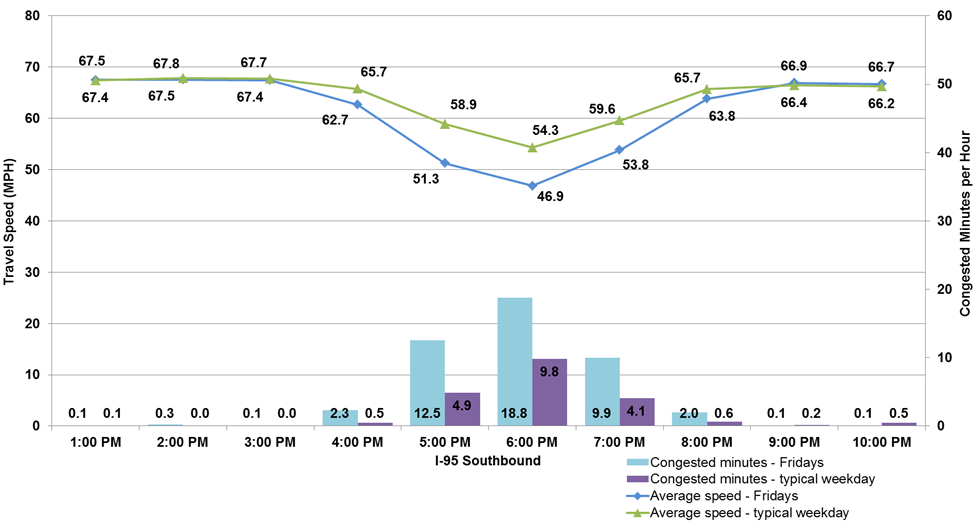
Figure 28
Travel Speeds on Route 3 Southbound: Typical Weekday versus Friday
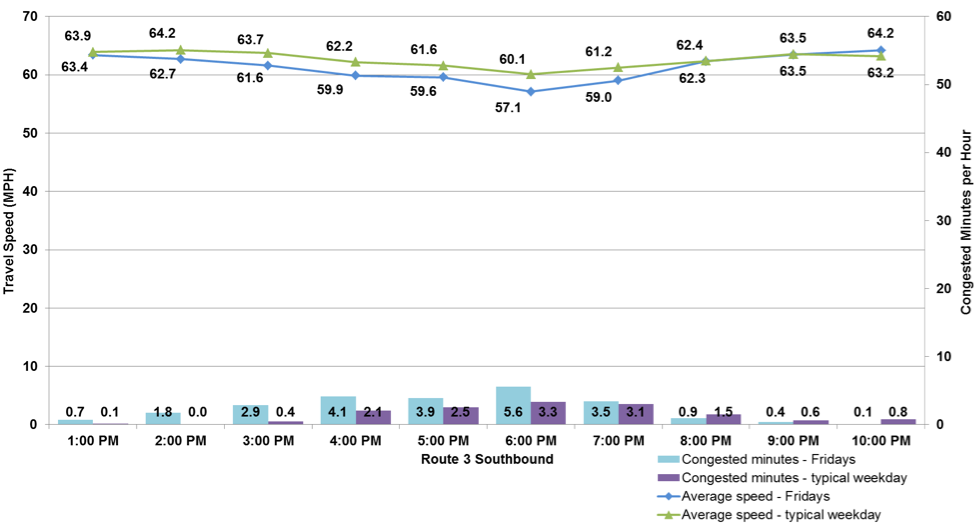
Table 31 shows the locations that experienced the most significant speed reductions on Fridays compared to a typical weekday. The location where the most significant speed reductions occurred was on Interstate 90 between Interstate 95 and the Westborough Plaza/Rest Stop. The spot with the worst congestion on this segment was at the Interstate 495 interchange where speeds declined by 30 MPH and congestion persisted between 2:00 PM and 8:00 PM.
Table 31
Expressway Locations with Speed Decreases on Friday, PM Peak Period
Route |
Direction |
From |
To |
Times |
Speed (MPH) |
Change in Speed from Normal Peak Period (MPH) |
Worst Location |
I-90 |
Westbound |
I-95 (Weston) |
Westborough Plaza (Westborough) |
2 PM to 8 PM |
34.61 |
-30.27 |
I-495 |
I-90 |
Westbound |
Allston Tolls (Boston) |
I-95 |
3 PM to 7 PM |
31.72 |
-21.98 |
Route16 |
I-95 |
Northbound |
Middlesex Turnpike (Burlington) |
I-93 (Woburn) |
2 PM to 5 PM |
32.35 |
-21.68 |
Winn Street |
MA-3 |
Southbound |
Union Street (Braintree) |
Derby Street (Hingham) |
1 PM to 4 PM |
36.11 |
-21.64 |
Route 18 to Derby Street |
I-95 |
Southbound |
Route 1 (Sharon) |
I-295 (Attleboro) |
3 PM to 7 PM |
28.71 |
-20.24 |
I-495 |
I = Interstate. MA = Massachusetts highway route. MPH = miles per hour. US = United States highway route.
PM Peak Period= 3:00 PM to 7:00 PM.
Source: INRIX.
As shown in Table 32, 693 crashes (crash rate = 33.0) occurred on expressways on Fridays in 2015. On other weekdays monitored by the CMP in 2015, 8,194 crashes (crash rate =31.3) occurred on expressways. The crash rate for expressways on Fridays was higher than crash rate on weekdays.
Table 32
Crashes and Crash Rates: Typical Weekday versus Fridays, 2015, Entire Day
Measure |
CMP Weekdays |
Fridays |
Expressway crashes |
8,194 |
693 |
Expressway crash rate |
31.3 |
33 |
CMP = Congestion Management Process.
Source: MassDOT Crash Database.
Table 33
Recommended Leave Times on Fridays by Corridor
Corridor |
Leave by |
I-90 Westbound |
Leave Boston by 2:15 PM |
I-93 Northbound |
Leave Boston by 2:15 PM |
I-93 Southbound |
Leave Boston by 1:15 PM |
I-95 Northbound |
Leave Weston by 3:30 PM |
I-95 Southbound |
Leave Westwood by 3:45 PM |
Route 3 South |
Leave Braintree by 3:00 PM |
Source: Central Transportation Planning Staff.
Chapter 11—Case Study: Black Friday
Black Friday, the day after Thanksgiving, is an important shopping day for consumers and retailers. On Black Friday, many consumers travel to shopping malls and other stores to purchase goods, which are sharply discounted for one day. Consumers will travel to these malls during all times on Black Friday, as stores are sometimes open for 24 hours.
This case study analyzed traffic patterns near the “Golden Triangle,” which is a location with a large cluster of commercial activity near the Natick Mall in the Natick-Framingham area. Sections of the following roadways in Natick and other nearby communities were analyzed over a 24-hour period on November 27, 2015: Route 9, Route 30, Route 126, Route 27, and Interstate 90.
The specific dates and times of the analysis, roadways and routes of focus, and datasets used in the analysis are as follows:
This case study involved a one-day analysis, so the availability of roadway data was limited for this case study. On Interstate 90, the data was reliable for the entire 24-hour period. However, the data availability on the arterials was intermittent between 11:00 PM and 6:00 AM. Therefore, in some instances, synthetic travel speeds, which were estimated based on the speed values of adjacent TMCs, were used for some TMCs between 11:00 PM and 6:00 AM.
Table 34 compares the performance results for the AM and PM peak periods on Black Friday to those of a typical weekday. Overall travel speeds on the arterials near Natick Mall were 3 MPH faster during the AM peak period and 1.5 MPH faster during the PM peak period on Black Friday compared to a typical weekday. The overall speeds might be higher in the peak periods on Black Friday because many workers in the Boston region may have taken the day off of work, which would reduce normal peak period traffic volumes and thereby offset the increase in traffic to shopping centers.
Performance Measure |
Weekday |
Weekday |
Black Friday AM |
Black Friday PM |
Average speed (MPH) |
28.04 |
26.00 |
31.25 |
27.45 |
Travel time index |
1.35 |
1.46 |
1.21 |
1.38 |
Source: INRIX
MPH = miles per hour.
Figure 29 shows the travel speeds on arterials located near the Natick Mall over the 24-hour period that corresponds with Black Friday in 2015. At most times of the day, the travel speeds on Black Friday were equal to or higher than the travel speeds on a typical weekday. The only times when the speeds were slower was overnight between 10:00 PM and 6:00 AM.
Figure 29
Travel Speeds on Arterials near the Natick Mall: Typical Weekday versus Black Friday, 2015
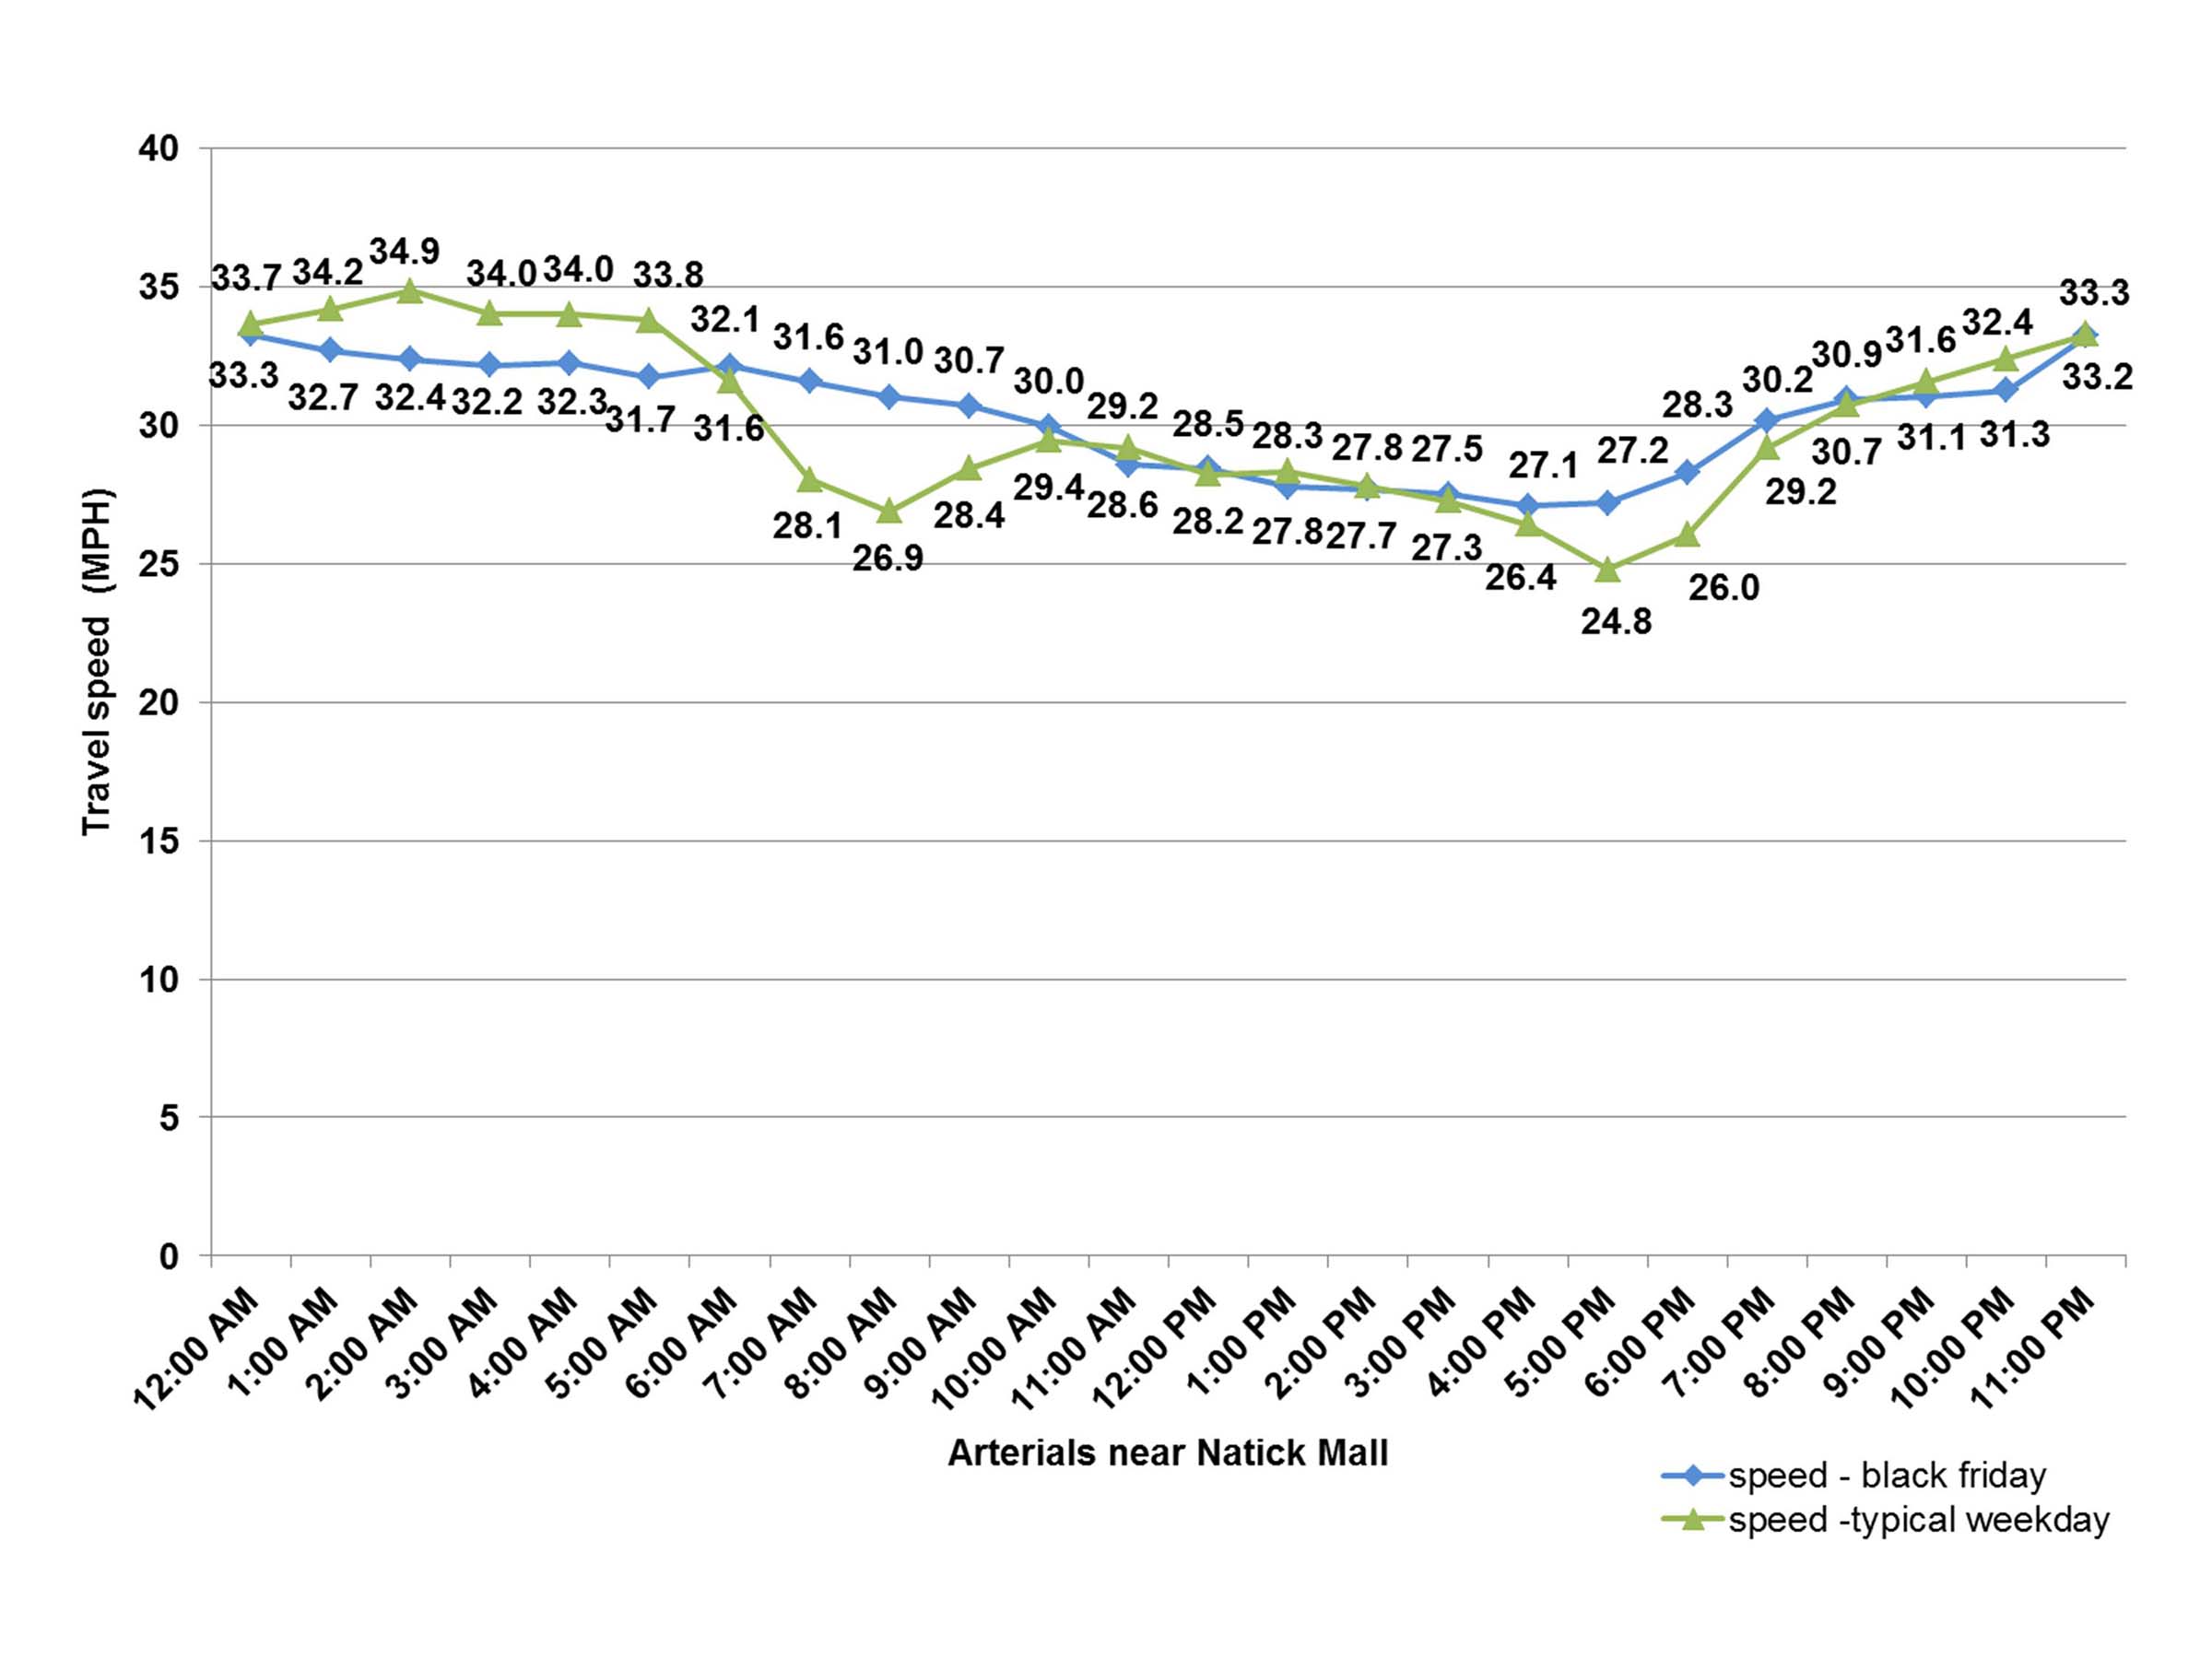
Figure 30 shows the travel speeds on Route 9 eastbound, during the duration of Black Friday. The uniform traffic congestion and speed decrease seen during the AM peak period of a typical weekday were not observed on Black Friday. However, between 1:00 PM and 6:00 PM on Black Friday the travel speeds were slower than the travel speeds on a typical weekday.
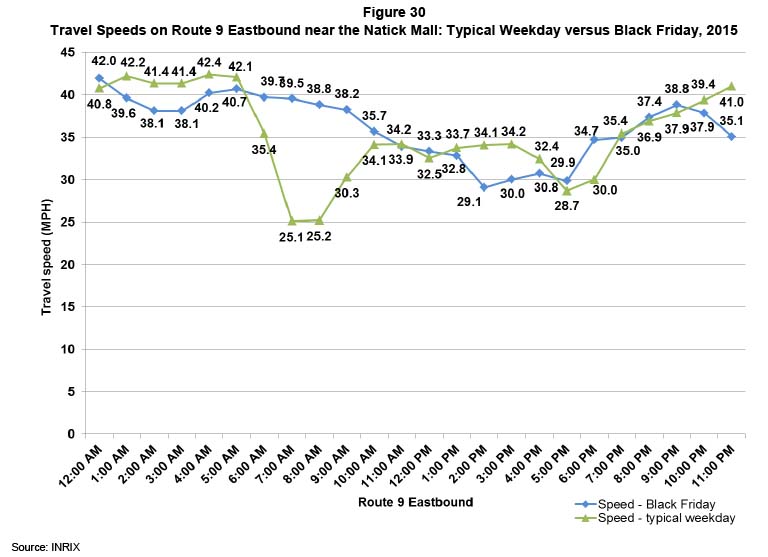
Figure 31 shows the travel speeds for Route 30 eastbound on Black Friday. Similar to Route 9, Route 30 eastbound experienced slower speeds between 12:00 PM and 3:00 PM, which highlights a peak shopping time at the Natick Mall on Black Friday. In addition, travel speeds between 10:00 PM to 6:00 AM were slower than those of a typical weekday.
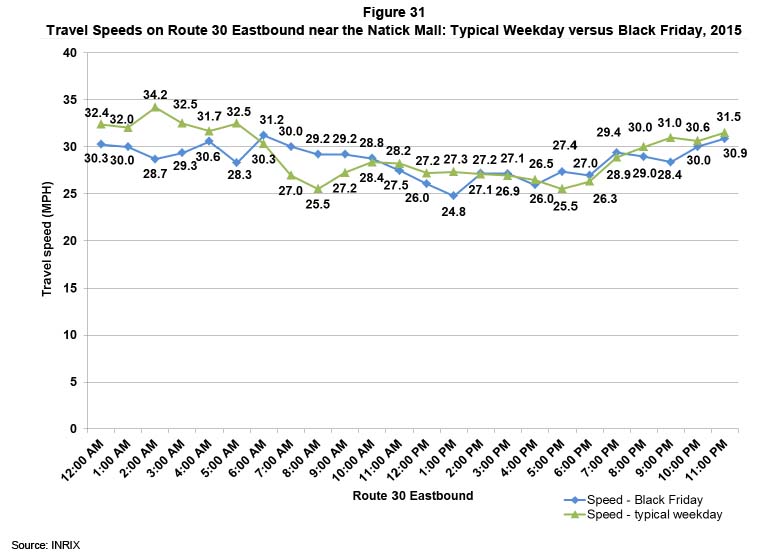
Figure 32 compares the travel speeds on Route 126 near the Natick Mall on Black Friday to the speeds on a typical weekday. The travel speeds on Route 126 were slower on Black Friday than on a typical weekday between 10:00 AM and 2:00 PM. This indicates that people were traveling from Framingham and points beyond to the Natick Mall, and that this is a peak shopping time at the Natick Mall on Black Friday.
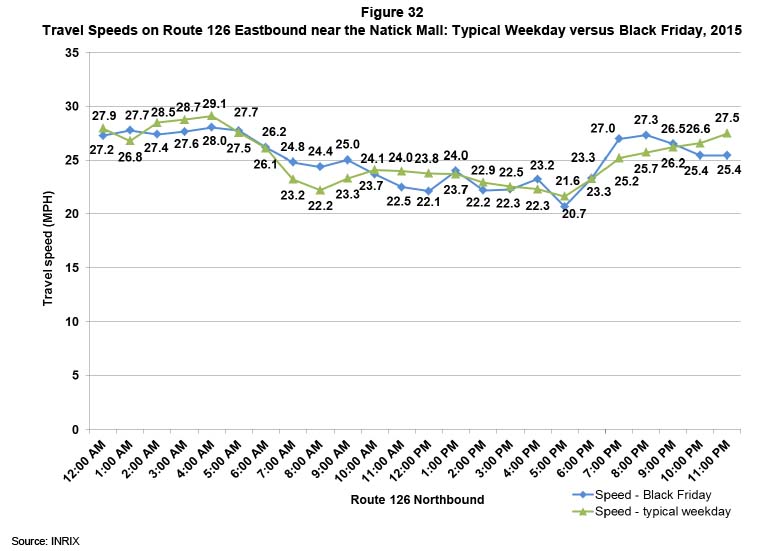
Figure 33 compares the travel speeds on Interstate 90 between Route 9 and Interstate 95 in both directions on Black Friday to a typical peak period. The travel speeds on Interstate 90 during Black Friday were consistent throughout the entire day, whereas the travel speeds on a typical weekday showed a clear slowdown during the peak periods. This indicates that there were not large numbers of travelers driving long distances to this mall. Also, these data confirm that significantly fewer people commute to Boston on Black Friday.
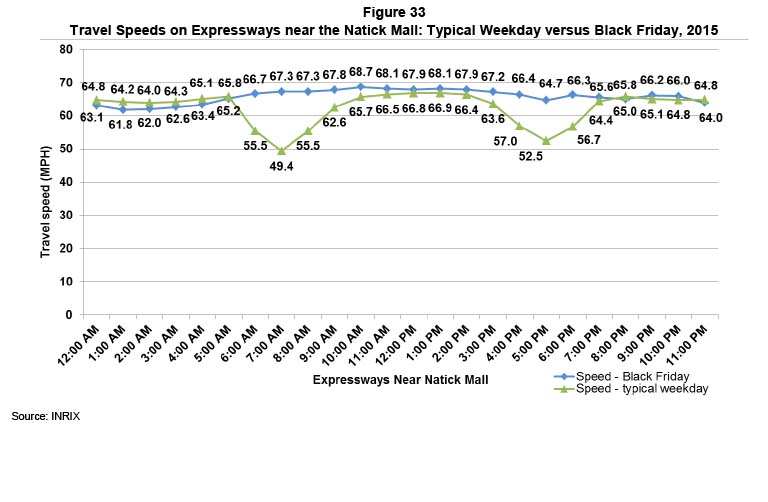
Figure 34 shows the locations near the Natick Mall where travel speeds were slower on Black Friday compared to a typical weekday. Additionally, table 35 compares the locations that experienced the largest decrease in travel speeds on Black Friday to a typical weekday. The location that experienced the largest decrease in travel speed was Route 9 eastbound between Walnut Street and Oak Street. A slowdown occurred between 2:00 PM and 8:00 PM, which could again indicate that this is a peak shopping time. Another location that experienced a decrease in travel speed was Route 30 between Route 9 and Interstate 90 at 4:00 AM to 6:00 AM. This speed decrease could have resulted from a combination of AM peak period commuter traffic and vehicles heading to the stores, as many stores open early on Black Friday.
Figure 34
Difference between Weekday and Black Friday Travel Speeds
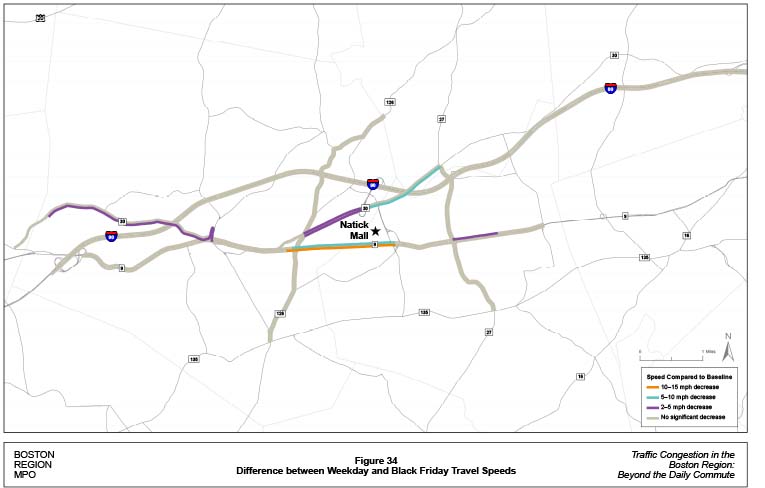
Table 35
Arterial Locations near Natick Mall where Speeds Decrease on Black Friday
Route |
Direction |
From |
To |
Times |
Weekday Speed (MPH) |
Speed (MPH) |
Change in Speed from Peak Period |
Route 9 |
Eastbound |
Walnut Street (Natick ) |
Oak Street (Natick) |
2 PM - 8 PM |
31.75 |
12.38 |
-19.37 |
Route 30 |
Eastbound |
Route 9 (Framingham) |
I-90 (Framingham) |
4 AM - 6 AM |
29.9 |
14 |
-15.9 |
Route 9 |
Eastbound |
Route 30 (Framingham) |
Speen Street (Natick) |
1 PM - 9 PM |
24.59 |
9.83 |
-14.76 |
Route 27 |
Northbound |
Route 135 (Natick) |
Route 9 (Natick) |
4 AM - 7 AM |
28.79 |
15 |
-13.79 |
Route 126 |
Northbound |
Route 9/ Route 30 (Framingham) |
Route 30 (Framingham) |
5 AM - 6 AM |
30.82 |
19 |
-11.82 |
I = Interstate.
Source: INRIX.
The Black Friday case study included a freight analysis focused on the region’s expressways. This analysis was conducted using the freight portion of the NPMRDS dataset. The freight data for expressways on Black Friday, November 24, 2017, was compared to the freight data available for the CMP monitoring dates in 2017, which represent a typical weekday. Due to the limited availability of the NPMRDS freight data, only 2017 data could be used to analyze freight traffic on Black Friday. Therefore, NPMRDS data from November 24, 2017, was used rather than data from November 27, 2015.
On that Black Friday, travel speeds were 6.5 MPH higher during the AM peak period and 5.5 MPH higher during the PM peak period than during those same periods on a typical weekday. The speed index also increased on Black Friday. Additionally, the Level of Travel Time Reliability (LOTTR) decreased from 1.20 to 1.06 in the AM peak period, and from 1.20 to 1.08 in the PM peak period, as compared to those periods on a typical weekday. The percentage of expressway miles that remained above (failed) the LOTTR congestion threshold changed from 11.7 percent on a typical day to 0.3 percent on Black Friday in the AM peak period, and from 9.2 percent on a typical day to 1.3 percent on Black Friday in the PM peak period.
Table 36
Traffic Conditions on Freight Network: Black Friday 2017
Performance Measure |
Value |
AM freight speed (MPH) |
54.46 |
AM Black Friday speed (MPH) |
60.97 |
AM freight LOTTR |
1.20 |
AM freight LOTTR percent of roadways congested |
11.7% |
AM Black Friday LOTTR |
1.06 |
AM Black Friday LOTTR percent of roadways congested |
0.3% |
PM freight speed (MPH) |
53.72 |
PM Black Friday speed (MPH) |
59.37 |
PM freight LOTTR |
1.20 |
PM freight LOTTR percent of roadways congested |
9.2% |
PM Black Friday LOTTR |
1.08 |
PM Black Friday LOTTR percent of roadways congested |
1.3% |
LOTTR = Level of Travel Time Reliability. MPH = miles per hour.
Source: NPMRDS.
The following locations failed the LOTTR threshold in the AM peak period:
The following locations failed the LOTTR threshold in the PM peak period:
The results of the analysis revealed that there was less freight congestion during both peak periods on Black Friday than on a typical weekday. Further, significantly more corridors failed to meet the LOTTR threshold during the PM peak period on Black Friday than during the AM peak.
Chapter 12—Results and Summary of Case Studies
The case studies discussed in this report examined incidents when congested roadway conditions developed during times other than the traditional commuting hours or because of traveling associated with special events or holidays. While these events are considered to be nonrecurring traffic for the purposes of traffic analysis and do not represent typical weekday congestion patterns, most of the events reoccur regularly. Because most of these events recur at least annually, sufficient data samples are usually available to detect regular traffic patterns.
Overall, congestion levels and roadway safety conditions varied between the events studied, based on the type of event, the day of the week, the time of day, and the location. Table 37 shows the definitions used to categorize the degree of impact each event had on roadway congestion, safety, and transit performance. Table 38 shows the traffic conditions that were present during the monitoring times of each case study, indicating the intensity of congestion on expressways and arterials, and the effect of congestion on buses (as evidenced by on-time performance).
Of all the events examined in the case studies, the most significant increase of arterial traffic occurred during the New England Patriots’ regular season games. Congestion on expressways was the worst on the day before Thanksgiving of 2015, the day of the Super Bowl Parade, and Fridays. Lastly, the analyses showed that all of the events affected transit performance less than roadway traffic, as the only time that MBTA buses experienced a moderate decrease in on-time performance was during Friday evenings.
Table 37
Definitions of the Impact of Events
Impact of Event |
Roadway Traffic |
Safety |
Transit Traffic |
None |
No change or increase in roadway speeds during event |
No change or decrease in crashes per day during event |
No change or increase in bus on-time performance during event |
Low |
Slight decrease in travel speeds during event |
Slight increase in crashes per day during event |
Slight decrease in bus on-time performance during event |
Moderate |
Noticeable decrease in travel speeds during event |
Noticeable increase in crashes per day during event |
Noticeable decrease in on-time performance during event |
High |
Significant decrease in travel speeds during event |
Significant increase in crashes per day during event |
Significant decrease in on-time performance during event |
Source: Central Transportation Planning Staff.
Table 38
Traffic Conditions during Case Studies
Case Study |
Prevalence of Event |
Arterial Traffic |
Expressway Traffic |
Safety |
Transit Traffic |
New England Patriots Regular Season Games |
As many as eight times annually |
High |
High |
Moderate |
N/A |
Red Sox 7:00 PM Weekday Games |
As many as 81 times annually |
Moderate |
Low |
Low |
Low |
Saturday Congestion |
As many as 52 times annually |
Moderate |
Moderate |
Moderate |
Low |
Super Bowl Parade |
Varies (no more than once annually) |
Moderate |
High |
Moderate |
N/A |
Wednesday before Thanksgiving |
Annually |
N/A |
Moderate |
Moderate |
None |
Fridays |
As many as 52 times annually |
N/A |
High |
Moderate |
Moderate |
Black Friday |
Annually |
Moderate |
None |
Low |
Low |
Source: Central Transportation Planning Staff.
The case studies resulted in recommendations of ways to alleviate roadway congestion during the time period of each event. Table 39 shows the types of strategies that were recommended in each case study. Travel demand management, improved incident management, better use of intelligent transportation systems, and encouraging the use of public transportation are popular strategies for relieving congestion during events. Enhancements to intelligent transportation systems remain the most effective strategy, which focuses on either coordinating signals or communicating the location of traffic congestion to drivers and suggesting alternative methods of travel during the events. For a detailed analysis of the recommended strategies, please refer to the individual case studies.
Table 39
Recommended Strategies from Case Studies
Case Study |
Travel Demand Management |
Incident Management |
Intelligent Transportation Systems |
Traffic Management and Operations |
Public Transportation |
New England Patriots Regular Season Games |
X |
X |
X |
X |
X |
Red Sox 7:00 PM Weekday Games |
X |
X |
|||
Saturday Congestion |
X |
X |
X |
||
Super Bowl Parade |
X |
||||
Wednesday before Thanksgiving |
X |
X |
X |
||
Friday Afternoon/Friday Evening |
X |
X |
X |
||
Black Friday |
X |
X |
X |
Source: Central Transportation Planning Staff.
Overall, congestion associated with many of the events studied could be alleviated by the implementation of intelligent transportation system (ITS) strategies. These solutions primarily entail communicating with travelers to inform them of locations and times when congestion is expected so that they can plan their travel accordingly. Another popular ITS strategy is to synchronize traffic signals on arterials. Also, adaptive signals may reduce congestion on arterials.
Another strategy for relieving congestion during events is to improve public transportation options. Although public transportation is available for many of these events, it is often overcrowded and inefficient. If funding is an issue for providing public transportation during these events, decision makers should look at innovative funding mechanisms such as advertising and branding.
A third strategy is to focus on traffic management and operations. These solutions are often location specific and offer direct improvements to a roadway location, such as by expanding or utilizing a shoulder, reconfiguring turn lanes, or reducing the number of access points to a retail location.
Chapter 13—Recommendations and Next Steps
The Boston Region MPO’s staff can create an online dashboard that can be posted on the MPO’s website to profile each of these case studies. The dashboard can display maps similar to those on the MPO’s existing Express Highway Performance Dashboard and Arterial Performance Dashboard. The new dashboard can also include graphs, data, and other visuals. This report and the new dashboard can be presented at future conferences and webinars as a resource for other MPOs considering similar studies.
The MPO staff will also reach out to communities that have congestion bottlenecks as a result of these events. The MPO board may recommend undertaking additional studies in its Unified Planning Work Program that will further examine congestion on specific corridors highlighted in this report. The results of the studies would be shared with engineers and planners from communities in the region who can then recommend projects or policies to address congestion problems.
Nonrecurring congestion in the Boston region has a major effect on mobility in the region. Also, congestion may have an impact on the attendance at the events or lower the quality of life for people who have to endure congestion on certain days of the week, even if it is not during the peak period. Events that cause nonrecurring congestion are unique and each has a variable effect on congestion levels. The traffic on the day before Thanksgiving functions quite differently from traffic on the day of a parade, for example. Many roadways examined in this study have congestion during nonrecurring events that is worse than peak period congestion.
The availability of big datasets, such as INRIX, has made it possible to study the Boston region’s congestion beyond the typical weekday peak travel periods. This dataset provided myriad data that were previously unavailable on traffic volumes during off-peak times, such as weekends, holidays, and special events. These data have allowed the Boston Region MPO staff to potentially expand the CMP monitoring beyond the traditional peak periods.
The MPO staff does not recommend that a community build its way out of the problem of nonrecurring congestion by expanding roads, as this option would require a significant investment to relieve congestion on facilities that may only experience congestion occasionally. In order to relieve congestion at the locations discussed in this report, strategies will need to be deployed. Implementing ITS, increasing public transportation options, and traffic management and operations solutions are all excellent strategies that can be used to alleviate nonrecurring congestion.
1 Boston Region MPO website, “Express Highway Performance Dashboard,” accessed on September 24, 2018, available online at https://www.ctps.org/maploc/www/apps/
express_dashboard_2015_Final/index.html.
2 Boston Region MPO website, “Arterial Performance Dashboard,” accessed on September 24, 2018, available online at https://www.ctps.org/maploc/www/apps/
arterial_dashboard_2015_Final/index.html.
3 The Traffic Messaging Channel (TMC) location code is a common industry convention developed and maintained by the leading electronic map database vendors to uniquely define road segments. For expressways, a TMC location is defined as the segment between two interchanges. Oftentimes, the TMC segment definition varies for arterial roadways.
4 The planning time index compares near-worst-case travel time to free-flow travel time to determine the contingency time needed to ensure on-time arrival 95 percent of the time. For example, a value of 2.5 means that to arrive on time 95 percent of the time, a traveler should budget an additional 45 minutes for a trip that takes 30 minutes during free-flow conditions.
5 For buses that have headway of 15 minutes or less, an on-time trip is defined as a trip that departs a timepoint no more than three minutes later than the scheduled time. For buses scheduled less frequently than every 15 minutes, an on-time trip is defined as a trip that departs a timepoint no more than six minutes later than the scheduled time.
6 MBTA website, “Gillette Stadium,” accessed on September 24, 2018, available online at https://www.mbta.com/destinations/gillette-stadium.
7 Gillette Stadium website, “Parking,” accessed on September 24, 2018, available online at https://www.gillettestadium.com/parking/.
8 Boston Globe, As a Precaution, Police to Shut down Lansdowne Street on Red Sox Game Days,” April, 27, 2017, available online at https://www.bostonglobe.com/metro/2017/04/27/precaution-boston-police-shut-lansdowne-street-near-fenway-park-game-days/vsp93qrvXhWnENim64Lq1M/story.html
9 Boston Globe, “Patriots victory parade is delayed until Wednesday,” February 2, 2015, available online at https://www.bostonglobe.com/metro/2015/02/02/parade/
hDkBsxq1Xtu6TSEAeFz0qJ/story.html.
10 SB Nation, “Patriots Super Bowl parade 2015: Victory celebration rescheduled for Wednesday,” February 2, 2015, available online at https://www.sbnation.com/nfl/2015/2/2/
7963327/patriots-super-bowl-victory-parade-2015-date-time-route.
11 Boston.com, “Boston’s 10 worst traffic bottlenecks around Thanksgiving, according to AAA”, November 18, 2017, available online at Boston's 10 worst traffic bottlenecks around Thanksgiving, according to AAA | Boston.com | Boston.com.