Transportation Access Studies of Central Business Districts
Project Manager
Andrew Clark
Project Principal
Katie Stetner
Cover Design
Kate Parker-O’Toole
The preparation of this document was supported
by the Boston Region Metropolitan Planning Organization through
MPO Planning Contract #105757 and MPO §5303 Contract #102694.
Central Transportation Planning Staff
Directed by the Boston Region Metropolitan
Planning Organization. The MPO is composed of
state and regional agencies and authorities, and
local governments.
To request additional copies of this document or copies in an accessible format, contact:
Central Transportation Planning Staff
State Transportation Building
Ten Park Plaza, Suite 2150
Boston, Massachusetts 02116
(857) 702-3700
(617) 570-9192 (fax)
(617) 570-9193 (TTY)
ctps@ctps.org
ctps.org
Abstract
Central business districts (CBDs) are the economic engines of regions across the country, host to employment centers, housing, and services. However, limited information is available to planners and public officials with regard to how people access these areas. This report documents a study undertaken by the Boston Region Metropolitan Planning Organization (MPO) to understand the modes of transportation customers use to access CBDs in the Boston region. MPO staff identified and classified the CBDs in the Boston region, which is comprised of 97 independent municipalities. A survey was distributed regionwide to business owners asking about their perception of their customers’ travel and spending patterns. Another survey was directed to customers at participating businesses in four locations selected for case studies. Staff compared travel patterns reported by customers, including mode splits, with merchants’ perceptions. Summary data on curb-lane designations also were collected and analyzed to understand how access to curb space might affect customer mode choice.
ES.2... Identification and Classification of Central Business Districts in the Boston Region
ES.3... Regionwide Business Survey
ES.4... Central Business District Case Studies
ES.4.5 Additional Analysis of Customer Survey Results
2.1...... Surveys of Central Business District Customers and Businesses
2.2...... Transportation Access Mode Splits
2.2.1 Comparison of Customer-Reported Mode Splits and Merchant Estimates
2.2.2 Customer Mode-Split Data from Other Studies.
2.3...... Frequency of Visits and Money Spent by Mode
2.4...... Percentage of Customers Local to the Study Area
2.6...... Conclusions and Lessons Learned
Chapter 3—Identification and Classification of Central Business Districts in the Boston Region
3.1...... Identification of Central Business Districts in the Boston Region
3.2...... Classification of Central Business Districts in the Boston Region
3.2.1 Group 1: Central business districts with rail rapid transit service
3.2.5 Group 5: Central business districts with only commuter rail service
3.2.6 Group 6: Central business districts with no transit service
Chapter 4—Regionwide Business Survey
4.2.1 Business Characteristics
4.2.2 Estimated Customer Mode Splits
4.2.3 Estimated Percentage of Customers Living or Working within Walking Distance
Chapter 5—Central Business District Case Studies
5.1...... Selection of Central Business Districts and Businesses
5.2...... Case Study Methodology
5.3.5 Additional Analysis of Customer Survey Results
Chapter 7—Literature Review References
Table 1 Comparison of Mode Split: Business Estimate versus Customer Survey
Table 2 Cambridge Mode Split by Neighborhood
Table 3 Number of Business Responses by Central Business District Group and Town
Table 4 Business Survey Responses by Business Type
Table 5 Estimated Customer Mode Splits by Central Business District Group—Weekday
Table 6 Estimated Customer Mode Splits by Central Business District Group—Weekend
Table 7 Number of Customer Responses per Central Business District
Table 8 Date and Time of Surveying
Table 9 Arlington Businesses where Customer Surveys were Conducted
Table 10 Framingham Businesses where Customer Surveys were Conducted
Table 11 Hamilton Businesses where Customer Surveys were Conducted
Table 12 Hingham Businesses where Customer Surveys were Conducted
Table 13 Customer-Reported Mode Splits by Central Business District
Figure 1 Comparison of Mode Split: Business Estimate versus Customer Survey
Figure 2 Cambridge Mode Split by Neighborhood
Figure 3 Classification of Central Business Districts in the Boston Region
Figure 4 Estimated Number of Customers by Business Type
Figure 5 Estimated Average Customer Spending
Figure 6 Estimated Customer Mode Splits by Central Business District Group—Weekday
Figure 7 Estimated Customer Mode Splits by Central Business District Group—Weekend.
Figure 9 Arlington Business District Curb Designations
Figure 10 Business-Estimated and Customer-Reported Mode Splits in Arlington
Figure 11 Frequency of Visits to the Arlington Central Business District
Figure 12 Annual Household Income of Customers in Arlington’s Central Business District
Figure 13 Framingham Business District Curb Designations
Figure 14 Business-Estimated and Customer-Reported Mode Splits in Framingham
Figure 15 Frequency of Visits to the Framingham Central Business District
Figure 16 Annual Household Income of Customers in Framingham’s Central Business District
Figure 17 Hamilton Business District Curb Designations
Figure 18 Business-Estimated and Customer-Reported Mode Splits in Hamilton
Figure 19 Frequency of Visits to the Hamilton Central Business District
Figure 20 Annual Household Income of Customers in Hamilton’s Central Business District
Figure 21 Hingham Business District Curb Designations
Figure 22 Business-Estimated and Customer-Reported Mode Splits in Hingham
Figure 23 Frequency of Visits to the Hingham Central Business District
Figure 24 Annual Household Income of Customers in Hingham’s Central Business District
Figure 25 Customer-Reported Mode Splits by Central Business District
Figure 26 Frequency of Visits to Participating Businesses by Drivers and Walkers
Figure 27 Frequency of Visits to the Central Business District by Drivers and Walkers.
Figure 28 Number of Businesses Visited by Drivers and Walkers
Figure 29 Annual Household Income of Survey Respondents by Mode
The central business districts (CBDs) in the Boston region are the economic hubs of the region’s cities and towns, providing housing, employment, services, and other economic opportunities. As transportation environments change—for example, as dedicated bus and bike lanes become more popular, or as ride-hailing services need increased access to curb space—it will be important to balance the needs of the many different modes competing for limited space. However, cities and towns have relatively little information about the characteristics of CBD customers. The goal of this study was to better understand the way customers access the region’s CBDs.
Because CBDs are rarely formally defined by a municipality, staff first constructed a model to identify the CBDs in the Boston region. This model defined the CBD as the area within a municipality that had the highest overall density, based on population density, employment density, street network density, and density of civic land uses.
After identifying the CBDs, they were classified into groups so that a sample of different types of CBDs could be selected for case studies. The selection of representative CBDs for the case studies was intended to enable municipal staff in locations that were not selected for case studies to evaluate the results of a CBD of a similar type.
The CBDs were classified according to the transit mode with the most frequent service available near the CBD because mode choice was expected to be influenced by the most readily available transportation modes. The CBDs with bus service but no rail rapid transit service were split into several groups because of the varying levels of bus service in the region. These CBDs were classified according to the population density of the overall municipality and the average headways and maximum spans of bus service in the CBD.
Staff sought to understand customers’ travel and spending patterns as well as merchants’ perceptions of their customers’ travel and spending patterns. A survey was distributed to businesses regionwide asking them to estimate by which modes their customers arrive, how much money they spend, how frequently they visit, and other metrics. A total of 121 businesses responded to the survey, representing business types including retail shops, restaurants, and household and professional services.
Overall, business owners estimated that most of their customers drove and that a small portion walked. Business owners estimated that the other modes brought relatively few customers, depending on what transit service was available. The business owners also estimated that between 20 and 40 percent of their customers lived or worked within walking distance, depending of the CBD group. There were many factors that likely affected these perceptions, including the type of CBD in which the business was located, the type of business, its operating hours, and customer volumes.
Based on the response rate from the business survey, support for and interest in the project from municipal staff, and the classification groups, staff selected the following CBDs as case study locations: Arlington, Framingham, Hamilton, and Hingham. In these case study locations, surveys were administered to the customers of businesses that responded to the initial business survey. The survey included questions about the mode by which they arrived at the business, how much money they spent, and how frequently they visited the business and the CBD. Curb-lane designation data also was collected in each of the CBD case study locations.
In Arlington, fewer than 50 percent of customer respondents drove to the CBD. This figure is less than the merchants’ estimate of slightly more than 70 percent. Almost 40 percent of customers walked, which was the highest rate of walking of all of the case studies. Merchants estimated that only 25 percent walked. While 55 percent of customers lived or worked within walking distance, merchants estimated that only 41 percent were within walking distance.
In Framingham, most customers who responded to the survey drove to the CBD; however, most of these customers were visitors to a single business. No customers reported walking to this business and many reported visiting from out of town. Other businesses in Framingham had fewer customers and walking was a more popular mode choice for those customers.
In Hamilton, 85 percent of customers drove. This figure was slightly higher than the merchants’ estimate of 79 percent. Merchants estimated that only 5 percent of customers walked; the customer-reported percentage was 11 percent. Merchants overestimated the percentage of customers who lived or worked within walking distance; while merchants estimated 49 percent, the customer-reported value was 38 percent.
In Hingham, customer-reported mode splits and merchants’ estimates were fairly similar. The customer survey revealed that 82 percent of customers drove; merchants estimated that 76 percent drove. The customer survey also revealed that 12 percent of customers walked; merchants estimated that 11 percent walked. Twenty-six percent of the customers reported living or working within walking distance, while the merchants’ estimate was 38 percent.
When considering the results across all case study locations, customers who walked were more frequent visitors to the business than those who drove, and those customers were nearly twice as likely to visit at least five times per week. On the other hand, 35 percent of drivers visited less than once per month.
Customers who drove to a business spent an average of approximately $54 per visit, while customers who walked to a business spent an average of approximately $32 per visit. When considering the frequency with which these two groups visited the surveyed businesses, the average driver spent approximately $73 to $120 per week, and the average walker spent approximately $63 to $99 per week at the business at which they were surveyed. However, walkers were more likely to visit multiple businesses per trip to a CBD and visited the CBD more often, so they may spend more at the CBD overall than drivers.
The results suggest that there may be a relationship between income and mode choice. People who drove tended to have higher incomes, while those who chose other means tended to have lower incomes. However, these results can be affected by a number of factors, including business type, how frequently a customer visits a particular business or business district, whether they live or work within walking distance, and how much money or time they expect to spend at the location.
The central business districts (CBDs) in the Boston region are the economic hubs of the region’s cities and towns. These hubs are subject to high demands from their various users: Workers need access to their jobs, residents need access to household services, and businesses need access to customers and deliveries of goods.
Municipalities typically have relatively little information about the characteristics of CBD customers and, as a result, the transportation planning process for these areas is often governed by perceptions that may or may not be correct. Understanding the transportation access modes, spending patterns, and demographic characteristics of CBD customers could help municipal planners in their work to improve transportation access to CBDs. This information may also help planners make the case for improving transit and non-motorized vehicle access to curbside lanes.
Through this transportation access study of Boston region CBDs, staff sought to understand how people access CBDs and to compare business owners’ perceptions of how their customers arrive with how their customers actually arrive at the businesses. Staff also sought to understand how existing curb-lane designations may affect mode choice.
To answer these questions, staff first conducted a literature review to learn about similar study efforts throughout the United States and Canada. Staff then developed a process to identify the CBDs of the 97 municipalities of the Boston region and classified them into similar groups based on certain characteristics that were expected to affect travel mode choice. A regionwide business survey was distributed to gather information about merchants’ perceptions of their customers' travel and spending habits and to gauge businesses’ interest in participating in a case study.
Based on the response rate from the business survey and the CBD classification groups, staff selected a set of CBDs to serve as case study locations for further analysis. In each case study location, staff conducted an inventory of existing curb-lane designations and surveyed customers of the businesses that replied to the initial survey. Finally, staff compared the merchants’ estimates of their customers’ travel mode choices from the business survey to the customer-reported mode choices.
To inform the methodology of this study, staff identified similar studies about transportation access to CBDs in other locations. These studies were typically undertaken as part of efforts to gauge support for potential changes to street layouts—especially in the context of improving multimodal access and safety—or in conjunction with economic development efforts.
Staff identified studies in the following locations that compared customer travel and shopping patterns with merchants' perceptions of those patterns:
Studies that collected data on customer travel habits and patterns but did not compare that data to perceptions from business owners were more common. This literature review included studies of customer mode shares in the following locations:
A common method of extracting data from CBD shoppers is through customer intercept surveys. In the studies identified in the literature review, "CBD customer" can be more broadly interpreted as "CBD visitor," encompassing not only shoppers but those who live, work, or go to school in the area, those who are meeting friends, or those who are just passing through. These surveys are often performed by surveyors who approach individuals on the street, interview willing participants, and enter their responses either on paper forms or a handheld device. Most references stress the importance of obtaining a representative sample, in terms of factors such as age, gender, and race.
Depending on staff or volunteer resources available, surveys are typically distributed on one or more representative days of the week—including both a weekday and weekend if there is reason to suspect a significant difference in responses would be found—and at several locations throughout a study area (outside major attractions or at major intersections, for example). Time of day and weather conditions are additional considerations.
The questionnaires used in the access studies varied widely depending on the information desired, but often asked for the following information:
Merchants are often surveyed, as well, to compare the merchants’ estimates of their customers’ access modes with the customers’ reported access modes. Eliciting business participation in surveys can be more of a challenge than surveying customers. In Toronto, researchers noted that employee time may have been limited, business hours may not have matched the study period, and businesses may not have been interested in participating. Surveyors reached out to all ground-floor merchants in the study area to encourage participation and then followed up a second time if there was no response. Merchant response rates were between approximately 25 and 60 percent, depending on the location. To increase participation and reduce the time required from businesses, the surveys were only five or six questions long. In the Dublin surveys, researchers randomly selected storefronts until they reached a sample size of 30 businesses that responded in each location. Again, surveys were kept deliberately short, requiring only a minute or two of a merchant's time.
The Los Angeles surveys report the number of "taxed businesses" within the study area and the number of businesses surveyed. By these metrics, approximately 15 percent of businesses in the study areas, on average, were surveyed. In any case, an inventory of existing businesses in a study area can be helpful to determine how representative the respondents' data may be of the business community as a whole.
In five locations—Los Angeles, Toronto, Dublin, Bristol, and Graz—merchants were asked to estimate by which mode their customers arrive. Surveyors then asked visitors how they actually arrived. A comparison of the results is shown in Figure 1 and Table 1.
Figure 1
Comparison of Mode Split: Business Estimate versus Customer Survey

Sources: See Chapter 7.
Table 1
Comparison of Mode Split: Business Estimate versus Customer Survey
Location |
Data Source |
Drive |
Did Not Drive |
Transit |
Walk |
Bike |
Other |
Los Angeles |
Estimate |
57% |
N/A |
6% |
44% |
7% |
1% |
Los Angeles |
Reported |
17% |
N/A |
42% |
37% |
4% |
1% |
Toronto |
Estimate |
32% |
68% |
N/A |
N/A |
N/A |
N/A |
Toronto |
Reported |
11% |
N/A |
26% |
49% |
12% |
2% |
Dublin |
Estimate |
16% |
N/A |
70% |
9% |
4% |
2% |
Dublin |
Reported |
10% |
N/A |
65% |
20% |
6% |
0% |
Bristol |
Estimate |
41% |
N/A |
11% |
42% |
6% |
0% |
Bristol |
Reported |
22% |
N/A |
13% |
55% |
10% |
0% |
Graz |
Estimate |
58% |
N/A |
12% |
25% |
5% |
0% |
Graz |
Reported |
32% |
N/A |
16% |
44% |
8% |
0% |
N/A = not applicable. Estimate = business estimate. Reported = customer-reported.
Sources: See Chapter 7.
In each case, merchants overestimated the percentage of their customers who drove. The percentage of customers who walked and biked was typically underestimated and, in Los Angeles, the percentage of customers who arrived by transit was significantly underestimated. We also see that—regardless of merchants’ perceptions—those who drove made up a small percentage of overall visitors in the locations studied.
Several studies to gather local data about customer travel and shopping patterns have been conducted in the Boston region. The City of Cambridge distributed a series of customer intercept surveys in several business districts from 2009 to 2016. The surveys asked respondents about the mode that they used to access the various neighborhoods, among other questions. The results are shown in Figure 2 and Table 2.
Figure 2
Cambridge Mode Split by Neighborhood

Table 2
Cambridge Mode Split by Neighborhood
Neighborhood |
Drive |
Subway |
Bus |
Walk |
Bike |
Central Square |
12% |
15% |
5% |
55% |
13% |
Kendall Square |
23% |
47% |
7% |
17% |
7% |
Porter Square |
21% |
16% |
5% |
49% |
10% |
East Cambridge |
22% |
7% |
12% |
48% |
11% |
Inman Square |
13% |
2% |
10% |
58% |
17% |
Alewife/Fresh Pond |
66% |
16% |
5% |
17% |
12% |
Harvard Square |
19% |
29% |
16% |
39% |
15% |
Overall |
29% |
22% |
8% |
35% |
12% |
Sources: See Chapter 7.
Citywide, the customer access mode was approximately evenly split between driving, riding transit, and walking, while biking represented a smaller portion. When considering individual survey locations, some variability became apparent: for example, most visitors drove to the Alewife/Fresh Pond area, which has a suburban character; most took the subway to Kendall Square, which is an employment and commuting hub; and most walked to Inman Square, which is not served by rapid transit. In most cases, those who drove were in the minority. The results of this study showed that even within a single municipality, access modes vary depending on the characteristics of each business district.
Another local study about access modes was performed in Brookline's Coolidge Corner business district. Fifty-six percent of respondents walked to the neighborhood. (Approximately 60 percent of all respondents were Brookline residents.) Eleven percent arrived by transit. The neighborhood is served by the Massachusetts Bay Transportation Authority’s (MBTA) Green Line C Branch and by MBTA bus Route 66. Of those two transit modes, the Green Line was more commonly used by respondents of the survey.
Many of the surveys asked customers how frequently they visited the study area and how much money they would typically spend in the area (either per visit or an estimated total per month):
Many surveys asked how much money the customers spent in the CBD. In some cases, this data could be combined with the frequency results to get overall spending by access mode:
These studies suggest that those who walk, bike, or ride transit to business districts tend to spend more over time than those who drive. Even when drivers spend more during a single visit than others, over time they are outspent by customers using other modes given drivers’ less frequent visits.
Surveyors commonly sought to understand the geographic context of the respondents’ trips to the CBD, either by asking for their home location in varying levels of detail (such as asking for their home city, home zip code, or a major intersection near their home) or by asking how far they had traveled to reach the study area:
The studies show that most shoppers in the locations in which surveys were conducted are local. Local shoppers may be more likely to walk, bike, or ride transit to the CBD, and they may be more likely to visit more frequently and spend more money. In all the study locations, drivers lived further away, visited less frequently, and spent less over time than customers who traveled to the CBD by other modes.
Many surveys asked about the purpose of a survey respondent's visit to a business district. Many of the respondents to the customer surveys in the reference locations were visiting for a number of purposes other than shopping:
The purpose of one's visit can have implications on the transportation mode chosen. For large shopping trips—for example, a weekly trip to the grocery store, or to purchase a large or bulky item—driving can be a natural choice. For smaller shopping trips, walking or biking can be more attractive. For an evening of entertainment and dining or drinks, visitors may prefer not to drive and rely instead on transit.
We draw the following conclusions from our literature review:
This literature review has shown that there can be a disconnect between customers' travel and shopping patterns and merchants' perception of those patterns. Obtaining a better understanding of how visitors access CBDs can help planners and elected officials balance the needs of the many users of business districts.
Chapter 3—Identification and Classification
of Central Business Districts in the Boston Region
The first step in this study was to identify the CBDs in the region. Because there are 97 municipalities in the Boston Region MPO area, identifying the location of each CBD by consulting maps and collecting information from municipalities would be prohibitively time consuming. Instead of manual identification, staff constructed a model to identify the CBD in each municipality in the region.
This study was designed to collect data from a sampling of CBDs in the region. To enable the selection of a sample of case study locations that reflected the different kinds of CBDs in the region, staff established classifications to describe and group the CBDs. The CBDs were classified according to characteristics that may affect mode choice, including the type and level of transit service in the CBD and population density in the municipality.
The Boston Region MPO area encompasses 97 municipalities, each with varying levels of employment and population densities and different types of built form. In the most urban setting, CBDs are characterized by roadways with heavy traffic and multimodal streets lined with buildings of three or four stories or more that are built directly to the street with limited or no setbacks. In CBDs in more rural settings, multimodal use may be more limited, buildings are generally only one or two stories tall, and ample setbacks and green space create an open sense of place. Between these two extremes we find quintessential small town Main Streets, lined with shops and restaurants, street trees and planters, and buildings two to three stories in height.
Such variation requires that the term CBD be carefully described if that definition is to be applied over the entire region. For this reason, staff developed a model using GIS to identify the region’s CBDs. The model uses the variation of density within a municipality to identify the area with the highest density. The CBD of a municipality was defined as the highest-density area within the municipality.
Staff identified four elements that are readily available from geographic datasets to use as inputs to the CBD identification model:
This section describes the datasets used as inputs to the CBD identification model in more detail.
For this analysis, staff used employment data defined at the transportation analysis zone (TAZ) level. TAZs are geographic areas defined by major transportation corridors that typically have populations of approximately 3,000 people.
Employment density was determined by dividing the number of jobs in a TAZ by the area of that TAZ. More populous municipalities are divided into more TAZs and, thus, can show greater variation in employment density. In rural municipalities, because the TAZs are much larger, employment density varies less when the TAZ is the unit of analysis.
While employment density is often highest in the CBD, in some municipalities significant employment centers are also located in suburban office park settings. In spite of the jobs, services, and shopping opportunities provided in these areas, they do not reflect the traditional downtown sense of place typically ascribed to a CBD. A hallmark of the traditional downtown neighborhood is a dense and connected street grid. Thus, street network data were used to identify areas with relatively dense street networks within each municipality.
In many municipalities, town and village centers developed around buildings with popular civic uses, such as town halls and schools. To account for the density that arose over time in these areas, staff collected point-feature datasets representing town and city halls, public schools and colleges, public libraries, police and fire stations, farmers' markets, and community health centers. Staff analyzed the locations of these types of buildings to identify areas with a relatively high density of civic activity.
In many locations, a tendency towards mixed use—where commercial areas and residences exist in close quarters—signals a traditional downtown neighborhood. Staff used TAZ-level population data from the US Census Bureau to identify areas of high population density.
Staff calculated population density by dividing the population of a TAZ by the area of that TAZ. As with employment density, more populous municipalities are divided into more TAZs and, thus, there can be more variation in population density. In rural municipalities, there is less variation in population density when the TAZ is the unit of analysis.
For each municipality, the four datasets were analyzed to identify the area with the highest overall density, which was defined as the municipality's CBD for the purpose of this analysis.
The model was initially run with each input weighted equally. After running the model, staff consulted satellite imagery and local knowledge to verify the results. The model satisfactorily identified the CBDs of 60 municipalities. There were four common ways the model did not produce satisfactory results:
Because each of the municipalities were affected by the inputs in different ways, staff determined that rerunning the model with different weightings for the inputs would not improve the results for all of the CBDs that were incorrectly identified, and doing so could introduce more errors to the results for other locations. Instead, staff post-processed the model results by manually adjusting the CBD locations in the 37 municipalities where the model did not produce satisfactory results.
To make efficient use of resources, this study was designed to collect data from a sample of case study locations that would be representative of the different types of CBDs throughout the region. Staff classified the CBDs into six groups with similar characteristics that were expected to affect mode choice, including the travel modes available, average headways of transit vehicles, transit span of service, and population density in the municipality. By classifying the CBDs in this way, staff of municipalities whose CBDs were not selected for case studies could assess the applicability of the findings to their own CBDs.
Customer mode choice is driven in part by what modes are available and by the frequency of service of those modes. For this reason, staff began by classifying the CBDs according to their most frequent transit mode.
While rail rapid transit and commuter rail services are generally both consistent in their headways and spans of service, bus service levels in the region can vary considerably. To further classify the large group of CBDs with bus service but without rail rapid transit service, staff analyzed population density and bus service characteristics because these factors were expected to have an effect on the mode choice of visitors to those CBDs.
Population density was expected to be related to the levels of bus service provided in those areas. When considering population density, staff used the population density of the entire municipality because population densities for the relatively small geographies of the CBDs as identified by the model were not available. Staff established three groupings based on the population density of the municipalities: more than 10,000 people per square mile, 4,000 to 10,000 people per square mile, and less than 4,000 people per square mile.
Staff also considered the bus service levels in the CBDs classified by population density. Staff calculated the maximum span of service and the all-day average headway in these areas. Staff identified each bus stop within a quarter-mile distance of the CBD, as defined by the CBD identification model. At each stop, the maximum span and average headway for all routes combined was calculated, and these stop-level averages were used to calculate a CBD-level average. Staff used these factors because the information is readily available regionwide, and the level and type of transit service available was anticipated to have a significant impact on transportation mode choice. While each CBD in the region is different, we expect to see similar trends in the transportation access modes to CBDs within each group.
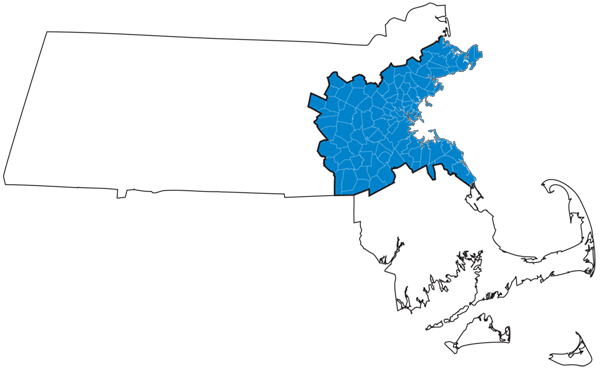
The following sections list the CBDs in each group and describe the characteristics of the groups. Figure 3 shows a map of the municipalities in the region according to the classification of their CBD.
Boston, Braintree, Brookline, Cambridge, Malden, Newton, Quincy, and Somerville
The first group of CBDs are those within one-half mile of a rapid transit station. The MBTA's rapid transit network provides service from approximately 5:00 AM to 1:00 AM with peak service headways of approximately 3 to 6 minutes and off-peak headways of 8 to 12 minutes. The characteristics of the rapid transit system and related high-density development in these CBDs likely have a significant influence on the mode choice of CBD customers.
Chelsea and Everett
The second group of CBDs are those in densely populated municipalities that have bus service and lack rail rapid transit service. The Chelsea CBD is not served by rail rapid transit but is served by the Chelsea branch of the Silver Line, which for the purposes of this study is considered to have service characteristics more similar to bus than rail rapid transit. The weekday span of service is 4:25 AM to 1:45 AM and peak headways are approximately 10 to 15 minutes.
The Everett CBD is not served by rail rapid transit but is within at least one-quarter mile of bus service. The average span of service is long—approximately 19.4 hours—and the average headway is relatively short—approximately 22 minutes.
Municipalities in this group are more densely populated than most of the rest of the region, with approximately 12,000 people per square mile in Everett and nearly 16,000 people per square mile in Chelsea.
Arlington, Belmont, Lynn, Marblehead, Medford, Melrose, Revere, Salem, Swampscott, Waltham, Watertown, and Winthrop
The CBDs of the municipalities in this group are not served by rail rapid transit but are within at least one-quarter mile of bus service. The average spans of service range from approximately 14.5 to 19.5 hours per day. The average headways are approximately 20 to 45 minutes.
Municipalities in this group have medium levels of population density, ranging from approximately 4,400 people per square mile in Waltham to approximately 8,400 people per square mile in Revere.
The CBDs of the municipalities in this group are not served by rail rapid transit but are within at least one-quarter mile of bus service. The average spans of service range from approximately 12.4 to 19.3 hours per day except in two outliers: the CBDs in Danvers and Saugus each have approximately 10 hours of service per day. The average headways for this group range from approximately 25 to 60 minutes, though there are four outliers: headways in Canton, Beverly, and Milton are approximately 1 hour and 40 minutes, and headways in Nahant are more than 3 hours.
Municipalities in this group have lower population densities, ranging from approximately 500 people per square mile in Hopkinton to approximately 3,400 people per square mile in Hull.
This large group has been subdivided based on population densities greater than or less than 2,000 people per square mile.
Group 4a (more than 2,000 people per square mile): Beverly, Burlington, Dedham, Framingham, Hull, Milton, Nahant, Natick, Needham, Norwood, Peabody, Randolph, Reading, Saugus, Stoneham, Wakefield, Wellesley, Weymouth, Winchester, and Woburn
Group 4b (less than 2,000 people per square mile): Ashland, Bedford, Canton, Danvers, Franklin, Gloucester, Hingham, Holbrook, Holliston, Hopkinton, Hudson, Lexington, Littleton, Marlborough, Marshfield, Milford, Norfolk, Rockland, Rockport, Scituate, Southborough, Walpole, Wayland, Westwood, Wilmington, and Wrentham
Concord, Hamilton, Ipswich, Lincoln, Manchester, and Sharon
The CBDs of the municipalities in this group are not served by rail rapid transit or bus but are within one-half mile of a commuter rail station.
Acton, Bellingham, Bolton, Boxborough, Carlisle, Cohasset, Dover, Essex, Foxborough, Lynnfield, Maynard, Medfield, Medway, Middleton, Millis, North Reading, Norwell, Sherborn, Stow, Sudbury, Topsfield, Wenham, and Weston
The CBDs of the municipalities in this group are beyond one-quarter mile of bus service and more than one half-mile from rail rapid transit and commuter rail service.
Figure 3
Classification of Central Business Districts in the Boston Region

Chapter 4—Regionwide Business Survey
A key objective of this study was to understand the mode of transportation customers use when visiting CBDs and the perception that business owners have of the modes their customers use. Staff developed and, with the help of municipal staff, distributed an online survey to businesses throughout the region asking about their perceptions of their customers’ travel and spending patterns. The business survey was also used to assess whether a business owner would like to participate in the customer survey of travel and spending habits if their CBD was selected as a case study. This chapter provides an analysis of business owners’ perceptions from all those who responded to the business survey, whether or not they participated in the customer survey. These findings represent the views from a small sample of businesses in the region.
Staff distributed a survey to businesses regionwide to collect information about merchants’ perceptions of their customers' travel and spending habits and general information about their business. The survey was also used to gauge their interest in participating in a case study. The business survey is included as Appendix A.
The survey asked business owners to estimate the following:
The survey also asked business owners to provide the following information about their business:
Business owners could opt in to having their customers surveyed by checking the appropriate box. If this option was selected, they were asked to provide their contact information so staff could follow-up to coordinate a time and date to conduct the customer surveys.
Staff distributed the survey via email to municipal officials—including elected officials, town and city managers and administrators, and key planning department staff—and leaders of business outreach and economic development organizations—including chambers of commerce—across the region. These municipal and business officials were encouraged to distribute the survey in turn to their mailing lists and other key contacts. Staff chose this approach because it allowed all municipalities an opportunity to demonstrate their interest in participating as a case study while minimizing the burden on municipal staff of conducting the business surveys and relaying the results to MPO staff. The online approach also minimized MPO staff resources needed, as the online survey results were recorded and reported automatically, and could be monitored in the days and weeks after the survey was published.
The online survey was published on Monday, March 4, 2019, and closed on Friday, April 5, 2019. MPO staff received feedback on the survey from some municipal staff, including suggestions that might increase participation. MPO staff worked to incorporate these suggestions in a revision of the survey. Some municipal staff and staff from a downtown business association offered to help distribute the survey in-person. This additional targeted surveying of businesses was performed using a paper version of the survey in Arlington, Hingham, and Framingham throughout April and May.
The survey was initially provided in English. After receiving feedback from Framingham municipal staff about the language needs of business owners in that community, the business survey was translated and distributed in Spanish and Portuguese.
While the primary purpose of the business survey was to gather interest and participation in the customer survey, the responses from the businesses also provided insights into businesses in CBDs in the region.
A total of 121 businesses responded to the survey from across the region. At least one business responded from each of the CBD classification groups except Groups 1 and 2. Table 3 shows the number of businesses that responded by CBD group and town.
Table 3
Number of Business Responses by
Central Business District Group and Town
CBD Group |
Town |
Responses |
Group 3 |
Arlington |
19 |
Group 3 |
Lynn |
7 |
Group 3 |
Waltham |
1 |
Total Group 3 |
blank |
27 |
blank |
blank |
blank |
Group 4a |
Framingham |
6 |
Group 4a |
Natick |
6 |
Group 4a |
Needham |
1 |
Group 4a |
Saugus |
1 |
Total Group 4a |
blank |
14 |
blank |
blank |
blank |
Group 4b |
Ashland |
17 |
Group 4b |
Gloucester |
1 |
Group 4b |
Hingham |
20 |
Group 4b |
Holliston |
1 |
Group 4b |
Littleton |
1 |
Group 4b |
Rockport |
1 |
Group 4b |
Scituate |
3 |
Group 4b |
Wilmington |
5 |
Total Group 4b |
blank |
49 |
blank |
blank |
blank |
Group 5 |
Hamilton |
9 |
Total Group 5 |
blank |
9 |
blank |
blank |
blank |
Group 6 |
Cohasset |
7 |
Group 6 |
Essex |
1 |
Group 6 |
Foxborough |
1 |
Total Group 6 |
blank |
9 |
blank |
blank |
blank |
Unknown |
U blank |
13 |
All groups |
Grand total |
121 |
Note: There were no responses from businesses in Groups 1 or 2.
The business survey asked respondents to identify their business type. Staff categorized the responses into eight general business types, shown in Table 4. Retail, clothing, and household goods stores were the most common respondents, followed by financial institutions and other businesses that offered professional services. Other business types included restaurants, theaters, and grocery stores.
Table 4
Business Survey Responses by Business Type
Business Type |
Responses |
Retail, clothing, household goods |
31 |
Bank, financial, other professional service |
27 |
Household service, pharmacy, salon |
16 |
Theatre, performance venue, art gallery, recreation |
12 |
Food and beverage service |
10 |
Public service, non-profit |
9 |
Food and beverage sales |
6 |
Fitness/yoga/dance center, gym |
5 |
The business survey asked respondents to estimate their average number of customers per weekday and weekend day. Figure 4 shows the results by business type.
Figure 4
Estimated Number of Customers by Business Type

In general, for most business types, the number of customers was larger on weekend days, especially Saturdays (many businesses reported being closed on Sundays), than on weekdays. Food and beverage businesses—both sales and service—tended to generate the highest numbers of customers of the businesses that responded to the survey.
The business survey asked respondents to estimate how much a customer typically spends at the business, including weekday and weekend day estimates. Ten answer options were provided, ranging from less than five dollars to $300 or more. Figure 5 shows the results. (These results exclude businesses categorized as "bank, financial, other professional service.")
Figure 5
Estimated Average Customer Spending

For the businesses that responded to the survey, the majority of merchants estimated that their customers spent between $10 and $59. Estimated spending was slightly higher on weekend days than on weekdays.
To better understand merchants' perceptions of their customers' travel, the business survey asked respondents to estimate the percentage of their customers who arrived by various transportation modes. Figure 6 and Table 5 show the weekday estimates from our sample of businesses that responded to the survey by CBD group.
Figure 6
Estimated Customer Mode Splits
by Central Business District Group—Weekday

Table 5
Estimated Customer Mode Splits
by Central Business District Group—Weekday
Mode |
Group 3 |
Group 4a |
Group 4b |
Group 5 |
Group 6 |
Total |
Bike |
3% |
3% |
1% |
1% |
7% |
2% |
Bus or rapid transit |
9% |
1% |
1% |
0% |
0% |
3% |
Commuter rail |
1% |
1% |
0.4% |
8% |
0% |
1% |
Drive |
72% |
79% |
87% |
78% |
70% |
80% |
Dropped off |
5% |
1% |
3% |
9% |
7% |
4% |
Walk |
11% |
16% |
5% |
3% |
16% |
9% |
Other |
0.2% |
0% |
0.1% |
1% |
1% |
0.2% |
Responses |
24 |
14 |
42 |
5 |
9 |
94 |
Note: There were no responses from businesses in Groups 1 or 2.
On weekdays, driving was assumed to be the most common mode choice—estimated to be the choice of approximately 75 to 85 percent of customers. In Group 3—CBDs with bus service and medium density—businesses estimated that approximately 10 percent of customers walked or took the bus or rapid transit. In Group 4a—CBDs with bus service and low density—and Group 6—CBDs with only commuter rail service—merchants estimated that a non-trivial portion of customers arrived on foot: approximately 15 percent. Merchants estimated that fewer customers chose the other travel modes.
Figure 7 and Table 6 show the estimated customer mode splits for the weekend.
Figure 7
Estimated Customer Mode Splits
by Central Business District Group—Weekend

Table 6
Estimated Customer Mode Splits
by Central Business District Group—Weekend
Mode |
Group 3 |
Group 4a |
Group 4b |
Group 5 |
Group 6 |
Total |
Bike |
4% |
4% |
1% |
1% |
8% |
3% |
Bus or rapid transit |
10% |
1% |
1% |
0% |
0% |
2% |
Commuter rail |
0% |
1% |
1% |
8% |
1% |
1% |
Drive |
64% |
72% |
89% |
78% |
69% |
79% |
Dropped off |
7% |
3% |
2% |
9% |
5% |
4% |
Walk |
15% |
19% |
6% |
2% |
18% |
11% |
Other |
0.4% |
0% |
0.1% |
1% |
1% |
0.3% |
Responses |
14 |
11 |
37 |
5 |
8 |
75 |
On weekends, again driving was estimated as the most common mode, though slightly less so compared with weekdays, especially as reported from Group 3 businesses. In turn, merchants estimated a slightly larger walk mode split on weekends than on weekdays. The shares for the rest of the modes were largely unchanged.
Figure 8 shows the merchants' estimates of the percentage of their customers living or working within walking distance by CBD group.
Figure 8
Estimated Percentage of Customers Living or Working
within Walking Distance of Central Business District

In all of the CBD groups, merchants estimated that a non-trivial percentage of customers lived or worked within walking distance, ranging from 20 to 40 percent.
Chapter 5—Central Business District Case Studies
Using the CBD classifications described in Chapter 3, staff selected a set of representative CBDs as case study locations for further study. In the selected CBDs, customer surveys were conducted at participating businesses to understand how customers access CBDs and how the customer-reported mode splits compared to the business owners’ perceptions in those CBDs. Also, an inventory of curb-lane designations and off-street public parking lots was completed, as the availability of parking and infrastructure for pedestrians, bicyclists, and transit vehicles may affect mode choice.
This study was designed to collect survey and curb-lane data from a sample of CBDs that represented the variety of CBDs in the Boston region. The CBDs were chosen to provide the most utility for the study and to allow staff to collect the largest sample possible. Case study locations were selected based on several factors:
Based on these criteria, staff selected the CBDs in Arlington, Framingham, Hingham, and Hamilton as case study locations.
Staff conducted surveys of customers at the businesses that responded to the business survey, provided estimated customer mode splits, and opted to have their customers surveyed. Table 7 shows the number of customer survey responses received in each CBD.
Table 7
Number of Customer Responses
per Central Business District
CBD |
Number of businesses surveyed |
Number of customer responses |
Arlington |
6 |
47 |
Framingham |
5 |
43 |
Hamilton |
4 |
99 |
Hingham |
6 |
53 |
In most CBDs in the Boston region, there is high demand for limited street space, especially at the curb lane, where customers search for parking, delivery vehicles load and unload goods, and transit services and ride-hail companies pick up and drop off riders. To better understand how municipalities have allocated curb-lane space for various travel modes, staff also conducted an inventory of existing curb-lane designations.
Staff devised a survey to ask customers of the participating businesses about their travel and spending patterns. The customer survey, included as Appendix B, included questions about the following:
For each municipality, staff identified an optimal time to conduct the customer surveys by consulting the responses to the surveys completed by participating businesses, particularly noting the number of average weekday and weekend customers the businesses reported, the hours of operation, and the busiest times of the day. Staff noted when the busiest periods of the businesses in each CBD coincided and, based on field staff availability, scheduled surveying shifts accordingly. Staff coordinated with the businesses to confirm the chosen survey time and answered questions about the process.
Customers were surveyed in each CBD during the times shown in Table 8.
Table 8
Date and Time of Surveying
CBD |
Day of week |
Date |
Time |
Arlington |
Saturday |
May 18, 2019 |
12:45 PM–4:45 PM |
Framingham |
Saturday |
June 8, 2019 |
1:45 PM–6:45 PM |
Hamilton |
Thursday |
May 9, 2019 |
2:00 PM–6:00 PM |
Hamilton |
Thursday |
May 16, 2019 |
2:00 PM–6:00 PM |
Hingham |
Friday |
May 17, 2019 |
2:00 PM–7:00 PM |
Hingham |
Friday |
May 31, 2019 |
3:30 PM–8:00 PM |
Surveyors distributed paper forms for respondents to complete. The surveys were available in English, Chinese (simplified and traditional), French, Haitian Creole, Spanish, and Vietnamese. Signage was provided to each surveyor to notify respondents that the survey was available in these languages.
To conduct the curb-lane inventories, surveyors visited each CBD and identified the curb-lane designations along major streets. Marking paper maps and aerial photographs, surveyors identified the following curb-lane designations:
Surveyors collected a limited amount of curb-lane designation data due to time and budget limitations. To ensure the inventory remained at a summary level, surveyors were instructed to note the predominant designation along each block. As such, accessible parking, fire hydrants, curb cuts, curb extensions, and other details were not recorded.
Surveyors were also instructed to note any examples where the apparent use of the curb lane was inconsistent with its designation. They were asked to observe, for example, if automobiles were parked in bike lanes or if passengers were picked-up or dropped-off in inappropriate locations. No such instances were recorded, although it should be noted that these inventories present only a single snapshot of conditions at the time of the data collection.
This section summarizes the CBD location, survey results, and key findings for each case study.
As shown in Figure 9, the Arlington CBD is on Massachusetts Avenue, extending from approximately the intersection of Massachusetts Avenue and Mill Street to the intersection with Palmer Street. The area is served by MBTA bus Routes 67, 77, 79, 90, 87, and 350. The Minuteman Commuter Bikeway bisects the area. The Arlington CBD is a Group 3 CBD, served by bus and in a municipality with medium population density.
Curb lanes in the neighborhood are primarily used for metered four-hour limit parking, except near intersections where the space is used for general traffic and turning lanes. Between Swan Place and Mystic Street, there are dedicated bike lanes and no parking along both sides of Massachusetts Avenue to accommodate the Minuteman Bikeway. There is a taxi stand on Massachusetts Avenue between Broadway and Medford Street, which is the only dedicated passenger pick-up and drop-off space noted in the four CBD case study locations. There are two public parking lots in the area.
Figure 9
Arlington Business District Curb Designations

Staff surveyed customers at six businesses in Arlington. Table 9 shows the businesses where customers were surveyed, and the number of responses received at each. All of the respondents completed surveys in English.
Table 9
Arlington Businesses where Customer Surveys were Conducted
Business name |
Business type |
Customer survey responses |
Artful Heart |
Retail |
8 |
The Book Rack |
Retail |
6 |
Common Ground Bar and Grill |
Food and beverage service |
9 |
Portal Crystal Gallery |
Retail |
11 |
Regent Theatre |
Theater |
7 |
Swanson Jewelers |
Retail |
6 |
Figure 10 shows the business-estimated and customer-reported mode splits in Arlington. The businesses that responded to the survey overestimated the percentage of customers who drove to the CBD and underestimated the percentage of those who walked. The Arlington surveys were completed on a Saturday afternoon under sunny and pleasant weather conditions, which may have encouraged customers to walk rather than travel by other modes. The higher percentage of people who walked is also consistent with the classification of the Arlington CBD as having bus service in a medium-density municipality. The businesses surveyed included small retail shops, a theater, and a restaurant.
Figure 10
Business-Estimated and Customer-Reported Mode Splits in Arlington

Figure 11 shows how frequently respondents visited the Arlington CBD. Respondents were most likely to visit the CBD either 5 or more times per week or 1 to 3 times per month. The sample size of survey responses in Arlington was not sufficient to analyze frequency of visits by customer mode. However, an analysis of frequency by mode for all of the case study locations combined is provided in Section 5.3.5.
Figure 11
Business-Estimated and Customer-Reported Mode Splits in Arlington

In Arlington, merchants estimated that 41 percent of their customers lived or worked within walking distance.1 The customer-reported figure was 55 percent. This is consistent with merchants underestimating the percentage of their customers that walk and overestimating the percentage of those who drive.
Figure 12 shows the distribution of annual household incomes as reported by survey respondents. More than 50 percent of respondents reported annual household incomes of $100,000 per year or more. The sample size of survey responses in Arlington was not sufficient to analyze household income by customer mode. However, an analysis of income and mode split for all of the case study locations combined is provided in Section 5.3.5.
Figure 12
Annual Household Income of Customers
in Arlington’s Central Business District

As shown in Figure 13, the Framingham CBD is located in the area surrounding the intersection of Waverly Street (Route 135) and Concord Street (Route 126). The neighborhood is divided by the Worcester Line of the MBTA commuter rail and is served by Framingham Station. Bus service is provided by the MetroWest Regional Transportation Authority. The Framingham CBD is a Group 4a CBD, served by bus in a municipality of medium-low density.
To the north of the CBD, the curb lane is used primarily for two-hour parking. To the south, the on-street parking is a combination of spaces with two-hour time limits and spaces that are unregulated. In these locations, some of the curb lanes—particularly at intersections—have been recently reconfigured with the installation of pedestrian amenities, planted buffers, and other streetscape improvements. Eastward along Waverly Street are dedicated bike lanes. On Howard Street, parking is unregulated. Surrounding Jack's Abby restaurant and brewery, parking is unregulated, except for a strip of parking along Clinton Street. This block of Clinton Street is a private way and the parking is reserved for customers of Jack's Abby and Springdale Barrel Room.
Figure 13
Framingham Business District Curb Designations

Staff surveyed customers at five businesses in Framingham. Table 10 shows the businesses where customers were surveyed, and the number of responses received at each. Five surveys were completed in Spanish and four surveys were completed in Portuguese. The rest of the respondents completed surveys in English.
Table 10
Framingham Businesses where Customer Surveys were Conducted
Business name |
Business type |
Customer survey responses |
Jack's Abby |
Food and beverage service |
33 |
Neca's Bakery |
Food and beverage sales |
3 |
Power Mobile |
Retail |
2 |
Sabor de Casa |
Food and beverage service |
1 |
Tesoro Supermarket |
Food and beverage sales |
4 |
Figure 14 shows the business-estimated and customer-reported mode splits in Framingham. Overall, the percentage of drivers was underestimated by the businesses. The results in Framingham are primarily from one business—which received 75 percent of the overall responses—to which all respondents drove. Surveyors reported a large number of customers at this business commented that they were visiting from out of town, and thus drove.
These results are consistent with another metric reported in that business' response; the percentage of customers living or working within walking distance was estimated at only 5 percent. The other businesses were smaller grocery, retail, and restaurant establishments, which on the day of the survey did not have large numbers of customers. Staff could not meaningfully analyze this subset of smaller businesses in further detail because the collective sample size of survey responses was too small.
Figure 14
Business-Estimated and Customer-Reported Mode Splits in Framingham

Figure 15 shows how frequently respondents visited the Framingham CBD. Most were infrequent visitors. This finding is likely due to the relatively large number of responses from the business that attracted a large percentage of out-of-town drivers. The sample size of survey responses in Framingham was not sufficient to analyze frequency of visits by customer mode. However, an analysis of frequency by mode for all of the case study locations combined is provided in Section 5.3.5.
Figure 15
Frequency of Visits to the Framingham Central Business District

Most businesses estimated that between 50 to 80 percent of their customers live or work within walking distance of the CBD. But, one business estimated only 5 percent; this was the business that had a high number of out-of-town visitors, and a high percentage of drivers. The data shows a relatively low rate of customers living or working within walking distance because so much of the data from Framingham came from that business. The overall estimated figure was 16 percent; the customer-reported figure was 28 percent.
Figure 16 shows the distribution of annual household incomes as reported by survey respondents. The respondents were fairly evenly distributed among the household income brackets. The sample size of survey responses in Framingham was not sufficient to analyze household income by customer mode. However, an analysis of income and mode split for all of the case study locations combined is provided in Section 5.3.5.
Figure 16
Annual Household Income of Customers
in Framingham’s Central Business District

As shown in Figure 17, the Hamilton CBD is centered around Bay Road and the intersections of Bay Road with Railroad Avenue and Walnut Road. This location is bisected by the Newburyport Line of the MBTA commuter rail and directly served by the Hamilton/Wenham Station. All of the businesses where customers were surveyed are located in the Hamilton Crossing shopping center just east of the railroad tracks. Off-street parking is provided for customers of Hamilton Crossing in a private parking lot. The shopping center is also directly adjacent to the commuter rail station. The Hamilton CBD is a Group 6 CBD, which is served only by commuter rail and not by rail rapid transit or bus.
Railroad Avenue is lined with local small businesses. Along both sides of this street the curb lane is used for parking, restricted to a two-hour limit. Beyond the intersection with Willow Street, there is no time restriction. Between Linden Street and Railroad Avenue on Bay Road there are intermittent parking opportunities. On the northbound side of the road these are restricted to a two-hour limit. On the opposite side, no time restriction was indicated. Northeast of Railroad Avenue, there is no parking along Bay Road on either side. There may be enough space for parking, but there are many intersections, curb cuts, and the railroad crossing. The shoulder is wide enough for riding a bike comfortably, but it is not marked as a dedicated bike lane. The curb lanes along Walnut Road are used for general travel; the road is too narrow for travel lanes and parking.
Figure 17
Hamilton Business District Curb Designations

Staff surveyed customers at four businesses in Hamilton, although no customer responses were received at one of these businesses. Table 11 shows the businesses where customers were surveyed, and the number of responses received at each. All of the respondents completed surveys in English.
Table 11
Hamilton Businesses where Customer Surveys were Conducted
Business name |
Business type |
Customer survey responses |
BoSoma School of Dance |
Dance studio |
9 |
Crosby's Marketplace |
Food and beverage sales |
46 |
CVS Pharmacy |
Household service |
44 |
French Lessons Boutique |
Retail |
0 |
Figure 18 shows the business-estimated and customer-reported mode splits in Hamilton. Merchants slightly underestimated the number of drivers and walkers, and overestimated the percentage of customers who arrived by commuter rail or were dropped off. The businesses surveyed were located in a strip mall development with ample surface parking, which was a likely factor in customers’ choice of transportation mode to access them. For example, when visiting a grocery store, driving may be a natural choice for customers who expect to purchase large amounts of goods.
Figure 18
Business-Estimated and Customer-Reported Mode Splits in Hamilton

Figure 19 shows how frequently respondents visited the Hamilton CBD. Most respondents were frequent or very frequent visitors. Nearly 80 percent of respondents visited more than once per week, and only 10 percent visited less than once per week. The businesses surveyed in Hamilton included a grocery store, a pharmacy, and a dance studio, all of which could attract customers to make multiple visits to the CBD per week.
Figure 19
Frequency of Visits to the Hamilton Central Business District

The sample size of survey responses in Hamilton was not sufficient to analyze frequency of visits by customer mode. However, an analysis of frequency by mode for all of the case study locations combined is provided in Section 5.3.5.
In Hamilton, merchants estimated that 49 percent of their customers lived or worked within walking distance. The figure from the customer surveys was 38 percent. One business estimated 100 percent of their customers live or work within walking distance; this response appears to be an outlier and could have been recorded in error or as a result of misunderstanding of the question.
Figure 20 shows the distribution of annual household incomes as reported by survey respondents. Approximately half of the survey respondents reported annual household incomes of $100,000 or more. The sample size of survey responses in Hamilton was not sufficient to analyze household income by customer mode. However, an analysis of income and mode split for all of the case study locations combined is provided in Section 5.3.5.
Figure 20
Annual Household Income of Customers in Hamilton’s Central Business District

As shown in Figure 21, the Hingham CBD is centered around the square formed by Central Street, Main Street, South Street, and North Street, and continues to the east towards the waterfront. The area is served by MBTA bus Route 220. Near the square, two-hour parking spaces line most streets. There are also two locations reserved for commercial vehicle loading at certain times of the day. The participating businesses are located near the square. Closer to the harbor, most parking is provided in two large public lots on either side of Station Street. Additional two-hour parking is available along the south side of North Street, and unrestricted parking is available along some side streets. The Hingham CBD is a Group 4b CBD, which is served by bus and in a municipality with low population density.
The curb-lane inventory data comes from a 2009 report to the Town of Hingham that detailed parking occupancy and capacity given the land use at the time.2 That report was updated in 2017 and found that "sufficient parking continues to be provided … to support the current land uses…"3
Figure 21
Hingham Business District Curb Designations

Staff surveyed customers at six businesses in Hingham. Table 12 shows the businesses where customers were surveyed, and the number of responses received at each. All of the respondents completed surveys in English.
Table 12
Hingham Businesses where Customer Surveys were Conducted
Business name |
Business type |
Customer survey responses |
Artisans in the Square |
Retail |
1 |
Carolann's |
Retail |
9 |
Maggie's Dog House |
Retail |
9 |
Nona's Homemade |
Food and beverage service |
26 |
Ralph's Hingham Wine Merchant |
Food and beverage sales |
8 |
Whitney Gordon's Jewelers |
Retail |
0 |
Figure 22 shows the business-estimated and customer-reported mode splits in Hingham. Merchants slightly underestimated the number of drivers and overestimated the customers using the other modes. Hingham is served by MBTA bus Route 220, but service is infrequent and ample on-street parking and two large public off-street parking lots make driving attractive. Both of these factors are likely to influence mode choice.
Figure 22
Business-Estimated and Customer-Reported Mode Splits in Hingham

Figure 23 shows how frequently respondents visited the Hingham CBD. Most responded that they visited the CBD multiple times per week or 1 to 3 times per month. The sample size of survey responses in Hingham was not sufficient to analyze frequency of visits by customer mode. However, an analysis of frequency by mode for all of the case study locations combined is provided in Section 5.3.5.
Figure 23
Frequency of Visits to the Hingham Central Business District

In Hingham, merchants estimated that 38 percent of their customers lived or worked within walking distance. The customer survey figure was 26 percent.
Figure 24 shows the distribution of annual household incomes as reported by survey respondents. More than 60 percent of respondents reported annual household incomes of $100,000 per year or more. The sample size of survey responses in Hingham was not sufficient to analyze household income by customer mode. However, an analysis of income and mode split for all of the case study locations combined is provided in Section 5.3.5.
Figure 24
Annual Household Income of Customers
in Hingham’s Central Business District

This section provides additional analysis of the customer survey results. The customer-reported mode splits from the four case study locations are compared in Section 5.3.5. The remaining sections provide analyses of items that could not be analyzed for each individual CBD because the sample sizes were too small. These results are presented in the aggregate for the four CBD case study locations.
For ease of comparison, Figure 25 and Table 13 show the customer mode splits in each CBD as presented in Sections 5.3.1–5.3.4.
Figure 25
Customer-Reported Mode Splits by Central Business District

Table 13
Customer-Reported Mode Splits by Central Business District
Mode |
Arlington |
Framingham |
Hingham |
Hamilton |
Bike |
4% |
0% |
2% |
2% |
Bus |
4% |
0% |
2% |
0% |
Commuter rail |
0% |
2% |
0% |
2% |
Drive |
49% |
88% |
83% |
85% |
Dropped off |
4% |
2% |
2% |
0% |
Walk |
38% |
7% |
12% |
11% |
Responses |
47 |
42 |
52 |
97 |
In each of the CBDs, driving was the most common mode choice for customers, followed by walking. The other modes were less utilized at the times and locations of the surveying. Arlington’s CBD, which was classified as a Group 3 CBD—having bus service but no rail rapid transit service and in a municipality of medium population density—had the highest percentage of both customers who walked and customers who lived or worked within walking distance. The other case study CBDs had lower population densities and fewer customers within walking distance.
A number of factors can affect the results of a one-day survey, including the time of day, day of the week, and weather conditions when the surveying took place. Some of the customer surveying for this study was conducted during weekends when there may have been lower rates of transit usage, as opposed to weekdays when customers may commute by transit and visit the CBD on their way to or from work. Also, some of the customer surveying was conducted during suboptimal weather conditions for biking or walking.
The customer survey asked respondents how frequently they visit the business where they received the survey. Figure 26 shows the results for drivers and walkers. (Due to small sample size, the results for the remaining modes are not discussed.)
Figure 26
Frequency of Visits to Participating Businesses by Drivers and Walkers

Customers who walked to the business were more frequent visitors than those who drove and were nearly twice as likely to visit at least five times per week. Of the drivers, 35 percent visited less than once per month.
Customers who drove spent an average of approximately $54 per visit at the business at which they were surveyed, while customers who walked to the CBD spent on average approximately $32 per visit. When considering the frequency with which these two groups visited a business, the average driver spent approximately $73 to $120 per week, and the average walker spent approximately $63 to $99 per week. These results are provided in ranges because the question “How often do you visit this business?” was answered by selecting an option that contained a range. While drivers reported spending more money over time at the business at which they were surveyed, walkers were more likely to visit multiple businesses per trip to a CBD and visit more often. So, walkers may spend more at the CBD overall than drivers.
Because the frequency of visits to a particular business likely differs from the frequency of visits to the CBD overall, the customer survey asked respondents how frequently they visit the CBD as a whole. Figure 27 shows the results.
Figure 27
Frequency of Visits to the Central Business District by Drivers and Walkers

Walkers tended to be very frequent visitors of the CBD; more than 50 percent of walkers who responded to the survey at a participating business visited the CBD five or more times per week, and very few visited less than once per month. On the other hand, only 25 percent of drivers visited the CBD five or more times per week, and approximately 15 percent visited less than once per month.
The customer survey asked respondents to report the number of businesses they visit on an average trip to the CBD. Figure 28 shows the results.
Figure 28
Number of Businesses Visited by Drivers and Walkers

Drivers were more likely than walkers to visit only one business per trip to the CBD. Walkers, on the other hand, were more likely to visit more than one business. Overall, the average driver visited 2.18 businesses per trip to the CBD, while the average walker visited 2.50 businesses.
Customer surveys were performed at businesses of the following types:
Certain business types are likely to affect mode choice. However, due to a low sample size—in terms of the number and type of businesses where surveying was performed, and low customer response rate at some of those businesses—staff found no relationship between business type and mode choice in the survey responses that were received.
Figure 29 shows average household income for the surveyed drivers and walkers. The results suggest that there may be a relationship between income and mode choice. People who drove tended to have higher incomes, while those who walked tended to have lower incomes. However, mode choice may be affected by a number of factors, including the specific conditions at the time of surveying, the business at which the customer was surveyed, the time of day, the day of the week, weather conditions, the transportation modes available, and the underlying income distribution of a CBD.
Figure 29
Annual Household Income of Survey Respondents by Mode

This study corroborated many of the findings seen in similar studies performed in other regions. The results of two metrics in this study, customer mode shares and the percentage of customers local to the area, varied according to the CBD in which the data were collected. The literature review found that in most locations, a majority of CBD visitors did not drive and that merchants tended to overestimate the percentage of their customers who did. These studies were undertaken in very densely populated urban and commercial corridors where trips can be conveniently made by transit, by bike, or on foot. The case studies in the Boston region were performed in less densely populated business districts where fewer trips were taken by transit, by bike, or on foot.
The results varied according to density. While driving was the most common mode choice in each case study, the mode splits in each case study reflected the transportation options and density in the location. Arlington was the densest CBD studied and the location with the most frequent transit service. The Arlington CBD is accessible by MBTA bus service and also by biking and walking. Arlington had the largest percent of customers arriving by modes other than driving. In addition, merchants overestimated the percentage of their customers who drove. On the other hand, relatively small numbers of customers in the lower-density CBDs of Hingham and Hamilton did not drive to the CBD. In these locations, merchants slightly underestimated the percentage of their customers who drove. Transit service in these CBDs is limited, and infrastructure for biking and walking is less robust compared with Arlington.
The literature review also found that most customers to CBDs are local; thus, they are more likely to walk or bike. In our study, of the four CBDs analyzed, it was Arlington’s CBD that had the highest percentage of customers who lived or worked within walking distance of the CBD, and Arlington merchants tended to underestimate the percentage of local customers. In Hingham and Hamilton, the percentage of local customers was lower and merchants in these towns tended to overestimate the percentage of local customers.
Another key focus of both the studies discussed in the literature review and this study was understanding how frequently customers visited the CBD and how much money they typically spent, and especially how these metrics compare across users of different transportation modes. The literature review found that in other locations people who drove to a CBD were likely to spend more money per trip. Our survey did not ask about overall spending at the CBD level, but we found that people who drove were likely to spend more than those who walked on a per-business basis.
Similar studies found that people who walked to a CBD are likely to visit more frequently than those who drove. Our study produced similar findings. Both on a CBD and per-business basis, those who walked were likely to visit more frequently than those who drove.
Similar studies found that because those who walked to a CBD visited more frequently than those who drove, the walkers were likely to spend more money over time. Our study asked only about spending on a per-business basis and found that, even when accounting for the lesser frequency with which drivers visit, drivers spend more money at the business over time than those who walked. We did find that walkers were likely to visit a CBD more frequently than drivers and likely to visit more businesses per trip than drivers, but from our data we cannot draw a conclusion about overall spending over time by mode at the CBD level.
This study has revealed a number of avenues for additional research. One is to repeat the methodology in other case study locations throughout the Boston region to build a more holistic understanding of how customers access CBDs regionwide, especially in different types of CBDs than those that were studied. Selecting case studies from the most densely populated municipalities in the region—the CBDs we classified into Group 1—could yield particularly illuminating data, because these are the locations most readily served by multiple transit modes and where the percentage of those who drive is typically smaller. This is also where space to accommodate those modes—whether parking for those who drive, dedicated transit rights-of-way for those who take transit, bike parking for those who bike, or wider sidewalks for those who walk—is in highest demand.
Another avenue for additional research is to repeat the methodology in the selected CBDs on a semi-annual basis to gain a better understanding of how mode choice is changing over time, if at all. Studies could also be performed before and after changes to streetscapes or curb-lane designations.
An adjustment in methodology that could improve sample size is to decouple a customer’s response from a specific business. In the studies discussed in the literature review, researchers surveyed as many businesses as possible and then as many CBD visitors as possible, regardless of the particular businesses they were visiting, if any. This practice allowed researchers to collect a greater number of responses overall, but it did not allow for comparisons between the responses of individual businesses and their associated customers.
Another strategy to improve sample size is to perform business surveys in-person. In-person surveying in the case study locations, which was conducted by municipal and downtown business association staff, successfully generated a higher response rate than was achieved by advertising the online survey alone.
Staff acknowledge the assistance received from municipal and downtown business association staff in each of the case study locations, and we thank them for their help. In addition to surveying the businesses in-person, the municipal staff assisted with refining the business survey and provided additional helpful information to assist in our data collection and analyses.
Chapter 7—Literature Review References
Sustrans. "Shoppers and how they travel." 2006.
Cambridge, City of. "Central Square Customer Intercept Survey Summary Report." December 2009.
———. "Kendall Square Customer Intercept Survey Summary Report." December 2011.
———. "Porter Square Customer Intercept Survey Summary Report." December 2012.
———. "East Cambridge Customer Intercept Survey Summary Report." December 2013.
———. "Inman Square Customer Intercept Survey Report." April 2015.
———. "Alewife & Fresh Pond Customer Intercept Survey Report." December 2015.
———. "Harvard Square Customer Intercept Survey Report," December 2016.
Brookline, Town of. "Coolidge Corner Consumer Survey 2014." 2014.
O'Connor, David, James Nix, Simon Bradshaw, and Enda Shiel. "Report on shopper travel behavior in Dublin City Centre." 2011.
Sustrans. "Traffic restraint and retail vitality." 2003.
Los Angeles, City of. "Great Streets LA: Benchmarking Great Streets." Part 6, Van Nuys Blvd.; Part 9, Central Ave.; Part 11, Venice Blvd.; Part 13, Hollywood Blvd.; Part 14, Cesar Chavez Ave. Fall 2016.
San Francisco County Transportation Authority. "Geary Corridor Bus Rapid Transit: Customer Intercept Survey Preliminary Results." May 2013.
San Francisco Municipal Transportation Agency. "Polk Street Intercept Survey Results." Spring 2013.
Seattle Department of Transportation. "Pike/Pine Neighborhood Intercept Survey." December 2014.
———. "Green Lake Neighborhood Intercept Survey." December 2014.
———. "Capitol Hill/15th Ave E Neighborhood Intercept Survey." November 2016.
———. "University District Neighborhood Intercept Survey." January 2017.
———. "South Lake Union Neighborhood Intercept Survey." June 2017.
———. "Ballard Neighborhood Intercept Survey." October 2017.
———. "West Seattle Neighborhood Intercept Survey." October 2017.
———. "Uptown/Lower Queen Anne Neighborhood Intercept Survey." November 2017.
———. "Magnolia Neighborhood Intercept Survey." October 2018.
Chan, Maxine, Greg Gapski, Kevin Hurley, Estuardo Ibarra, Laura Pin, Aliza Shupac, and Eva Szabo. "Bike Lanes, On-Street Parking, and Business: A Study of Queen Street West in Toronto's Parkdale Neighborhood." December 2016.
Clean Air Partnership. "Bike Lanes, On-Street Parking, and Business: A Study of Bloor Street in Toronto's Annex Neighborhood." February 2009.
———. "Bike Lanes, On-Street Parking, and Business, Year 2 Report: A Study of Bloor Street in Toronto's Bloor West Village." 2010.
Qubu, Nour Abu, Kaylan Bubeloff, Evan Kataoka, Iris Lau, Joyce Lau, Jessica Leung, Sarah Mater, Arin Mardirossian, Mays Masud, Luke Stephens, and Emilie Taillon. "Bike Lanes, On-Street Parking, and Business, Year 2 Report: A Study of Danforth Avenue in Toronto's Danforth Neighborhood." April 2014.
1 The merchants' estimates—in each of the four CBDs—were weighted by the number of customer responses received at each business.
2 Town of Hingham, “Parking Study: Downtown Hingham Business District”, February 2009.
3 Jeffrey Dirk, Vanasse & Associates, “Shared Parking Model Update: Downtown Hingham Business District”, August 2017.