Technical Memorandum
DATE: December 17, 2020
TO: Congestion Management Committee
FROM: Ryan Hicks, MPO Staff
RE: 2017–18 Inventory of Park-and-Ride Lots at MBTA Facilities
The primary purpose of this memorandum is to present the results from the 2017–18 inventory of park-and-ride lots serving Massachusetts Bay Transportation Authority (MBTA) facilities. Comparisons with the 2006, 2010, and 2012–13 inventories are also included in this memorandum.
In the spring and fall seasons between April 2017 and November 2018, Boston Region Metropolitan Planning Organization (MPO) staff inventoried MBTA, private, and town-operated parking facilities at 152 locations comprising 121 commuter rail stations, 27 rapid transit stations, two ferry terminals, and two express bus origin locations.1 Appendix A contains parking utilization rates for all of the parking lots that were inventoried. Information about parking fees and several maps that display inventoried data are found in Appendices B, C, D, and E.
This memorandum has seven main sections and five appendices. The main sections of this memorandum are:
Civil Rights, nondiscrimination, and accessibility information is on the last page. |
This monitoring effort of the park-and-ride lots is part of the Congestion Management Process (CMP), which is an ongoing task of the Boston Region MPO. The CMP is a multimodal program that monitors highways, arterials, high-occupancy vehicle facilities, park-and-ride facilities, bicycle, and pedestrian facilities. As part of the CMP, data are collected on a periodic basis. Planners and decision makers can refer to these data to identify needs, and to prioritize transportation projects and program funds.
Parking utilization is defined in this memorandum as the percentage of nonaccessible spaces that do not require a permit, which are occupied by the end of the MBTA-defined AM peak period.2,3. Parking utilization rates can assess the surplus or deficiencies of parking capacity and indicate how commuters can be impacted by changes, such as MBTA fare price changes, parking fee changes, parking lot construction, the addition or removal of parking spaces, or the opening or closure of stations. When parking utilization data are available on the web, commuters can make informed decisions on travel in the most efficient way possible.
MPO staff last collected park-and-ride data from October 2012 to June 2013.4 The MPO completed previous park-and-ride monitoring efforts in 2009–10, 2005–06, 2002, and 2000.
The park-and-ride lots were inventoried by performing a one-time observation during the morning peak period of a typical weekday from April 2017 to November 2018. A typical weekday is defined as a Tuesday, Wednesday, Thursday, or Friday. Holidays were not included in this definition.5,6
For the purpose of this study, MPO staff developed a data collection form (Appendix C). The form contains information about each parking lot, including the parking lot ownership, parking cost and restrictions, number of parking spaces, and number of parked vehicles. This information is summarized in Appendix A. The data collectors were instructed to visit each lot immediately after the last inbound peak-period trip. The time of the last inbound train, express bus, or ferry varied by station. After the last AM peak-period train, ferry, or express bus departed the station, the data collector inventoried each parking lot that was used for a given station or express bus origin location. A separate form was completed for each parking lot, as many stations have several nearby parking lots.
The lots inventoried included all MBTA-owned, privately owned, and town lots at all commuter rail, rapid transit, and commuter ferry stations, and at all express bus origin locations. Lots serving only commuters who used non-MBTA transportation were not inventoried.7 The locations of these lots were ascertained from past inventories, information provided on the MBTA’s website (www.mbta.com), and from field visits performed by MBTA staff.
All of the parking spaces referred to in this memorandum, unless otherwise indicated, were nonaccessible, non-permit parking spaces, and the total capacity and utilization rates were calculated for each station. Section 7.2 provides data on the availability of accessible parking along each transit line. Many stations have permit-only lots in addition to public lots. Most permit-parking lots are either municipally or privately owned, and use is restricted to permit holders. In many cases, a local residency is required to obtain a permit. Because the focus of this memorandum is on the availability of parking to the general public at MBTA park-and-ride lots, the permit-only and resident-only parking spaces were excluded from the totals and utilization percentages for all modes of transit. However, Section 7.3 provides a discussion on these permit-only and resident-only parking spaces, which were included in the data collection.
There were MBTA parking lot changes since the previous park-and-ride data collection effort that could impact capacity and utilization. These include changes to the number of parking spaces, in MBTA parking fees, MBTA service changes, the economy, ridesharing, bikesharing, popularity of public transportation, land use pattern changes, station parking lot construction, and conversions of public parking to permit-only parking.
Since the 2012–13 inventory, changes were made to parking capacity at MBTA lots. One of the changes was a net increase of 1,583 public, non-permit parking spaces near all MBTA stations. This was the result of an additional 4,658 spaces, and the removal of 3,075 spaces at MBTA stations. Included in this increase was a total of 701 spaces that were added at the new Assembly and Wachusett stations, both of which opened since the 2012–13 inventory was conducted. The parking capacity and use of the new Wachusett and Assembly stations were included in the current 2017–18 inventory analysis. The additional parking spaces associated with the new stations contribute to the perception that the overall use of the MBTA parking system has decreased.
The Littleton, North Leominster, Plymouth, Beverly Depot and Salem commuter rail stations have all experienced construction that added parking capacity since the 2012–13 inventory was collected. Additionally, capacity changed at several stations due to factors, such as the inclusion of an existing parking facility into the inventory for the first time (Haverhill, Route 128), and the structural change of nearby parking lots (Mansfield).
Lechmere, Walpole, Wellington, and North Quincy stations experienced a reduction of parking spaces due to the reconfiguring or closing of nearby parking lots. Additionally, parking capacity reduction occurred along the ferry system, due to the permanent closure of a MBTA ferry terminal (Quincy/Fore River Ferry Terminal) or conversion of public parking to permit-only parking (Hull).
Table 1 shows the MBTA stations with significant changes (either the addition or subtraction of 150 parking spaces, or a change in capacity of at least 50 percent at a station) in the current inventory, compared to the parking capacity in the 2012–13 inventory.
Table 1
Stations with Significant Changes in the Number of Parking Spaces between the 2012–13 and 2017–18 Inventories
Station Name |
Transit Line |
Mode |
Total |
Total |
Change in Total Spaces |
Four Corners/Geneva |
Fairmount |
Commuter rail |
0 |
3 |
3 |
Talbot Ave (1B side) |
Fairmount |
Commuter rail |
0 |
1 |
1 |
Uphams Corner |
Fairmount |
Commuter rail |
0 |
2 |
2 |
Ayer |
Fitchburg |
Commuter rail |
52 |
83 |
31 |
Littleton |
Fitchburg |
Commuter rail |
52 |
220 |
168 |
North Leominster |
Fitchburg |
Commuter rail |
0 |
436 |
436 |
Wachusett |
Fitchburg |
Commuter rail |
0 |
351 |
351 |
Waltham |
Fitchburg |
Commuter rail |
48 |
86 |
38 |
Walpole |
Franklin |
Commuter rail |
677 |
479 |
-198 |
Haverhill |
Haverhill |
Commuter rail |
153 |
544 |
391 |
Plymouth |
Kingston/Plymouth |
Commuter rail |
92 |
332 |
240 |
Wedgemere |
Lowell |
Commuter rail |
31 |
119 |
88 |
West Medford |
Lowell |
Commuter rail |
20 |
0 |
-20 |
Beverly Depot |
Newburyport/Rockport |
Commuter rail |
40 |
483 |
443 |
Salem |
Newburyport/Rockport |
Commuter rail |
449 |
765 |
316 |
Mansfield |
Providence/Stoughton |
Commuter rail |
365 |
667 |
302 |
Route 128 |
Providence/Stoughton |
Commuter rail |
2,008 |
2,528 |
520 |
Hull |
Ferry |
Ferry |
236 |
0 |
-236 |
Quincy/Fore River |
Ferry |
Ferry |
370 |
0 |
-370 |
Lechmere |
Green Line |
Green Line |
369 |
0 |
-369 |
Assembly |
Orange Line |
Orange Line |
0 |
350 |
350 |
Wellington |
Orange Line |
Orange Line |
2,409 |
2,183 |
-226 |
North Quincy |
Red Line |
Red Line |
1,512 |
1,173 |
-339 |
Source: 2017–18 Boston Region MPO Park-and-Ride Inventory.
Daily parking fees changed at 84 MBTA stations since the 2012–13 inventory. These MBTA stations are listed in Table 2. For the current inventory, most commuter rail stations charged $2.00 to $6.00 per day, and parking fees ranged from $4.00 to $7.00 at most of the rapid transit stations.
In addition to the changes in parking fees at MBTA stations (between the 2012–13 and 2017–18 inventories), the MBTA also adjusted the prices of several park-and-ride lots near MBTA stations during the collection of the 2017–18 park-and-ride data.8 These were market-based adjustments to encourage commuters to park at underutilized stations. According to the MBTA’s website, these changes included
In some cases, the MBTA park-and-ride lots were observed either before or after the parking price changes had taken effect (The date of observation is stated in Tables A-1, A-2, A-3 and A-4 in Appendix A). As a result, several stations had different parking prices than what was stated at the time of the 2017–18 inventory. Tables 2 and 3 provide the changes in parking fees from the 2012–13 inventory to the 2017–18 inventory, and the current parking fees at the time of this memorandum.
Table 2
MBTA Stations with Parking Fare Changes—Commuter Rail
2017–18
Station |
Rail Line |
Minimum Parking Fee at Time of 2012–13 Inventory |
Minimum Parking Fee at Time of 2017–18 Inventory |
Fee Change Between the 2012 and 2018 Inventories |
Current Parking Fee (2020)9 |
|
|||||
Fairmount |
Fairmount |
$4.00 |
$4.50 |
$0.50 |
$4.00 |
|
|||||
Readville |
Fairmount |
$4.00 |
$4.50 |
$0.50 |
$2.00 |
|
|||||
Belmont |
Fitchburg |
$3.00 |
$5.00 |
$2.00 |
$5.00 |
|
|||||
Brandeis/Roberts |
Fitchburg |
$4.00 |
$4.50 |
$0.50 |
$4.00 |
|
|||||
Fitchburg |
Fitchburg |
$3.00 |
$4.00 |
$1.00 |
$3.00 |
|
|||||
Kendal Green |
Fitchburg |
$0.00 |
$4.00 |
$4.00 |
$4.00 |
|
|||||
Littleton |
Fitchburg |
$4.00 |
$4.50 |
$0.50 |
$6.00 |
|
|||||
South Acton |
Fitchburg |
$2.50 |
$5.00 |
$2.50 |
$5.00 |
|
|||||
West Concord |
Fitchburg |
$4.00 |
$4.50 |
$0.50 |
$5.00 |
|
|||||
Ashland |
Framingham/Worcester |
$4.00 |
$4.50 |
$0.50 |
$4.00 |
|
|||||
Auburndale |
Framingham/Worcester |
$0.00 |
$4.50 |
$4.50 |
$6.00 |
|
|||||
Grafton |
Framingham/Worcester |
$4.00 |
$4.50 |
$0.50 |
$4.00 |
|
|||||
Southborough |
Framingham/Worcester |
$4.00 |
$4.50 |
$0.50 |
$6.00 |
|
|||||
Wellesley Hills |
Framingham/Worcester |
$0.00 |
$0.00 |
$0.00 |
$6.00 |
|
|||||
Wellesley Farms |
Framingham/Worcester |
$4.50 |
$6.00 |
$1.50 |
$6.00 |
|
|||||
Wellesley Square |
Framingham/Worcester |
$4.50 |
$6.00 |
$1.50 |
$6.00 |
|
|||||
West Natick |
Framingham/Worcester |
$4.00 |
$4.50 |
$0.50 |
$6.00 |
|
|||||
West Newton |
Framingham/Worcester |
$4.00 |
$4.00 |
$0.00 |
$4.00 |
|
|||||
Westborough |
Framingham/Worcester |
$4.00 |
$4.50 |
$0.50 |
$6.00 |
|
|||||
Worcester |
Framingham/Worcester |
$3.00 |
$3.00 |
$0.00 |
$4.00 |
|
|||||
Dedham Corp Center |
Franklin |
$4.00 |
$4.50 |
$0.50 |
$2.00 |
|
|||||
Forge Park |
Franklin |
$4.00 |
$4.50 |
$0.50 |
$4.00 |
|
|||||
Franklin |
Franklin |
$4.00 |
$4.00 |
$0.00 |
$6.00 |
|
|||||
Islington |
Franklin |
$4.00 |
$4.50 |
$0.50 |
$4.00 |
|
|||||
Norwood Central |
Franklin |
$4.00 |
$4.50 |
$0.50 |
$4.00 |
|
|||||
Norwood Depot |
Franklin |
$4.00 |
$4.50 |
$0.50 |
$2.00 |
|
|||||
Walpole |
Franklin |
$3.00 |
$4.50 |
$1.50 |
$4.00 |
|
|||||
Cohasset |
Greenbush |
$4.00 |
$2.00 |
-$2.00 |
$0.00 |
|
|||||
East Weymouth |
Greenbush |
$4.00 |
$6.00 |
$2.00 |
$6.00 |
|
|||||
Greenbush |
Greenbush |
$4.00 |
$2.00 |
-$2.00 |
$2.00 |
|
|||||
Nantasket Junction |
Greenbush |
$4.00 |
$2.00 |
-$2.00 |
$2.00 |
|
|||||
North Scituate |
Greenbush |
$4.00 |
$2.00 |
-$2.00 |
$4.00 |
|
|||||
Bradford |
Haverhill |
$4.00 |
$4.50 |
$0.50 |
$2.00 |
|
|||||
Haverhill |
Haverhill |
$4.00 |
$4.00 |
$0.00 |
$2.00 |
|
|||||
Lawrence |
Haverhill |
$3.50 |
$4.00 |
$0.50 |
$4.00 |
|
|||||
Melrose Highland |
Haverhill |
$3.00 |
$3.00 |
$0.00 |
$2.00 |
|
|||||
Reading |
Haverhill |
$4.00 |
$6.00 |
$2.00 |
$6.00 |
|
|||||
Wakefield |
Haverhill |
$4.00 |
$4.50 |
$0.50 |
$6.00 |
|
|||||
Halifax |
Kingston/Plymouth |
$4.00 |
$4.50 |
$0.50 |
$2.00 |
|
|||||
Plymouth |
Kingston/Plymouth |
$4.00 |
$2.00 |
-$2.00 |
$2.00 |
|
|||||
South Weymouth |
Kingston/Plymouth |
$4.00 |
$2.00 |
-$2.00 |
$2.00 |
|
|||||
Whitman |
Kingston/Plymouth |
$4.00 |
$6.00 |
$2.00 |
$6.00 |
|
|||||
Anderson/Woburn |
Lowell |
$4.00 |
$4.00 |
$0.00 |
$8.00 |
|
|||||
Lowell |
Lowell |
$5.00 |
$7.00 |
$2.00 |
$8.00 |
|
|||||
Wedgemere |
Lowell |
$0.00 |
$5.00 |
$5.00 |
$5.00 |
|
|||||
West Medford |
Lowell |
$0.00 |
$5.00 |
$5.00 |
$5.00 |
|
|||||
Brockton |
Middleborough/ Lakeville |
$3.00 |
$4.00 |
$1.00 |
$4.00 |
|
|||||
Campello |
Middleborough/ Lakeville |
$4.00 |
$2.00 |
-$2.00 |
$2.00 |
|
|||||
Bellevue |
Needham |
$4.00 |
$4.50 |
$0.50 |
$4.00 |
|
|||||
Hersey |
Needham |
$4.00 |
$4.50 |
$0.50 |
$4.00 |
|
|||||
Highland |
Needham |
$4.00 |
$4.50 |
$0.50 |
$4.50 |
|
|||||
Station |
Rail Line |
Minimum Parking Fee at Time of 2012–13 Inventory |
Minimum Parking Fee at Time of 2017–18 Inventory |
Fee change Between the 2012 and 2018 Inventories |
Current Parking Fee (2020) |
||||||
Needham Heights |
Needham |
$4.00 |
$4.50 |
$0.50 |
$4.00 |
||||||
Needham Junction |
Needham |
$4.00 |
$6.00 |
$2.00 |
$6.00 |
||||||
Roslindale Village |
Needham |
$4.00 |
$4.50 |
$0.50 |
$4.00 |
||||||
West Roxbury |
Needham |
$4.00 |
$4.50 |
$0.50 |
$6.00 |
||||||
Beverly Depot |
Newburyport/Rockport |
$0.0 0 |
$5.00 |
$5.00 |
$2.00 |
||||||
Gloucester |
Newburyport/Rockport |
$4.00 |
$4.50 |
$0.50 |
$2.00 |
||||||
Hamilton/Wenham |
Newburyport/Rockport |
$4.00 |
$4.50 |
$0.50 |
$4.00 |
||||||
Lynn |
Newburyport/Rockport |
$4.00 |
$4.00 |
$0.00 |
$2.00 |
||||||
Montserrat |
Newburyport/Rockport |
$4.00 |
$4.50 |
$0.50 |
$4.00 |
||||||
Newburyport |
Newburyport/Rockport |
$4.00 |
$4.50 |
$0.50 |
$4.00 |
||||||
North Beverly |
Newburyport/Rockport |
$4.00 |
$4.50 |
$0.50 |
$4.00 |
||||||
Rowley |
Newburyport/Rockport |
$4.00 |
$4.50 |
$0.50 |
$2.00 |
||||||
Salem |
Newburyport/Rockport |
$4.00 |
$4.00 |
$0.00 |
$5.00 |
||||||
Swampscott |
Newburyport/Rockport |
$4.00 |
$6.00 |
$2.00 |
$6.00 |
||||||
West Gloucester |
Newburyport/Rockport |
$4.00 |
$4.50 |
$0.50 |
$2.00 |
||||||
Canton Center |
Providence/Stoughton |
$4.00 |
$4.50 |
$0.50 |
$4.00 |
||||||
Hyde Park |
Providence/Stoughton |
$4.00 |
$4.50 |
$0.50 |
$4.00 |
||||||
Newtonville |
Providence/Stoughton |
$7.50 |
$4.50 |
-$3.00 |
$4.50 |
||||||
Providence |
Providence/Stoughton |
$9.00 |
$15.00 |
$6.00 |
$15.00 |
||||||
South Attleboro |
Providence/Stoughton |
$3.00 |
$6.00 |
$3.00 |
$6.00 |
||||||
TF Green Airport |
Providence/Stoughton |
$6.75 |
$5.00 |
-$1.75 |
$5.00 |
||||||
Wickford Junction |
Providence/Stoughton |
$4.00 |
$0.00 |
-$4.00 |
$0.00 |
||||||
MBTA = Massachusetts Bay Transportation Authority.
Source: MBTA, 2017–18 Boston Region MPO Park-and-Ride Inventory.
Table 3
MBTA Stations with Parking Fare Changes—Rapid Transit
2017–18
Station |
Rail Line |
Minimum Parking Fee at Time of 2012–13 Inventory |
Minimum Parking Fee at time of 2017–18 Inventory |
Fee Change Between the 2012 and 2018 Inventories |
Current Parking Fee (2020)10 |
Wonderland |
Blue Line |
$5.00 |
$5.00 |
$0.00 |
$7.00 |
Maverick |
Blue Line |
$7.00 |
$12.00 |
$5.00 |
$12.00 |
Hingham |
Ferry F2 |
$4.00 |
$2.00 |
-$2.00 |
$2.00 |
Forest Hills |
Orange Line |
$6.00 |
$6.00 |
$0.00 |
$9.00 |
Malden |
Orange Line |
$6.00 |
$6.00 |
$0.00 |
$7.50 |
Oak Grove |
Orange Line |
$6.00 |
$6.00 |
$0.00 |
$9.00 |
Sullivan Square |
Orange Line |
$4.00 |
$5.00 |
$1.00 |
$9.00 |
Alewife |
Red Line |
$7.00 |
$7.00 |
$0.00 |
$9.00 |
Braintree |
Red Line |
$7.00 |
$7.00 |
$0.00 |
$9.00 |
Mattapan |
Red Line |
$4.00 |
$4.00 |
$0.00 |
$2.00 |
Quincy Adams |
Red Line |
$4.50 |
$7.00 |
$2.50 |
$9.00 |
MBTA = Massachusetts Bay Transportation Authority.
Source: MBTA, 2017–18 Boston Region MPO Park-and-Ride Inventory.
There were several MBTA boarding fare changes in the period of time between the 2012–13 and 2017–18 inventories. The latest fares available before the 2017–18 park-and-ride inventory commenced are displayed in Appendix E. The notable fare changes are described as follows:
The MBTA has opened several new stations since the 2012–13 inventory including Talbot Avenue, Four Corners/Geneva Avenue and Newmarket on the Fairmount Line, Wachusett Station on the Fitchburg Line, Boston Landing on the Framingham/Worcester Line, and Assembly Station on the Orange Line.
Between 2012 and 2018, most commuter rail lines either maintained the same number of trains or added trains during the AM peak period. Notable changes include the Providence Line adding two peak-period trains and the Worcester Line adding four peak-period trains. The only line that had less trains traveling in the AM peak period in 2018 was the Lowell Line.
Additionally, positive train control systems were installed on the Newburyport/Rockport, Lowell, Haverhill, Franklin and Worcester Lines in 2017–18 to prevent collisions and improve reliability. The Beverly drawbridge was also replaced on Newburyport/Rockport Line. On the rapid transit system, the Orange Line headway was increased from five minutes to six minutes.
The United States economy went through a recession that began in 2007. Although the Boston region was not one of the hardest hit regions, the impact of the recession was evident. An economic recession generally results in a decrease in daily commuting to the central business district or at various commercial activity centers. When fewer people commute to work, the result is a drop in utilization of all transportation facilities. Since this economic decline, the economy has steadily recovered. This trend is reflected the 2009–10 and 2012–13 inventories, and is even more evident in the 2017–18 inventory.
Ridesharing has transformed from a being a niche travel option for early adopters to becoming a major mode of travel in the region since the 2012–13 inventories were conducted. In 2018, over 50 million transportation network company (TNC) trips began in Boston and Cambridge alone.12 Many MBTA riders do not live within walking distance to an MBTA station. Therefore, many commuters have difficultly commuting from the station to residences. Ridesharing can provide MBTA riders access from residences to transit stations. However, ridesharing is not a complete solution to first- and last-mile commutes, as ridesharing can potentially increase single-occupancy travel, and could have a negative impact on traffic conditions. There are reports that transit trips are eliminated altogether in favor of TNC trips.13
Both dock and dockless bikesharing became popular after the 2012–13 inventory, especially in Boston and the inner-ring suburbs. This mode of transportation has the potential to help solve the last-mile connection between MBTA stations and commuter residences, while not increasing motor vehicular traffic. This commuting method could also help increase transit ridership while potentially reducing parking utilization at crowded parking lots near MBTA stations, since bikesharing is often cheaper than parking at these lots.
In recent years, transit ridership has declined in many major cities in the United States, including Boston. Between 2014 and 2018, the MBTA bus system and all MBTA subway lines exp1erienced declines in ridership, except for the Blue Line. Possible causes of ridership decline include competition between ridesharing services, lower gas prices, and urban sprawl.14 Commuter rail ridership declined by 6.7 percent since the last inventory was collected.15 ,16 The decrease in ridership on the commuter rail can be attributed to the fare increases that were imposed during this time period. Fare increases can be especially burdensome for low-income riders.17 Other causes of this decrease in ridership could include train delays and overall reliability of the MBTA transit system, which has experienced severe issues related to weather in recent years.
Over the last few years, the central core of the Boston region has maintained its population level though migration and has remained a vibrant region, however; some residents have moved further from the central core. This could explain the drop in ridership on the subway system, while the commuter rail ridership has remained relatively consistent.
Conversely, many suburban areas have attempted to change the land use patterns to make communities more attractive to younger people. One of the biggest trends is the implementation of transit-oriented development (TOD), which is the process of upzoning and encouraging high-density development near existing transit stations. TODs often provide commuters in suburban areas more opportunities to live within walking distance to a transit station, which can eliminate the need for a private vehicle to complete a trip.
Several MBTA station platforms, elevators, ramps, and other access points were under construction for the 2017–18 inventory. Appendix A provides information about specific stations under construction. Construction at MBTA stations can prompt commuters to use other MBTA stations to complete a trip, which may have resulted in an increase in parking utilization at nearby stations. This is especially true if the construction temporarily causes a station to cease to be Americans with Disabilities Act (also known as ADA)-accessible.
Construction in the parking lots near MBTA stations may also temporarily reduce parking capacity, which can make it appear that parking utilization has increased. Another effect of parking lot construction is the resulting confusion of commuters on where parking is permitted and how much it costs. If resources permit, stations that were under construction at the time of the inventory may be recounted at a later date after the construction is complete.
The permitted usage of municipally and privately-owned parking lots near some MBTA stations has changed since the 2012–13 inventory for various reasons. Public lots allow any commuter to park in the lot with a parking fee. Permit-only parking lots allow only commuters who have a parking pass from a municipality or other entity to park at a specified location.18 Permit parking is generally not included in the analysis performed for this memorandum, as the memorandum focuses on parking availability for the general public. However, the locations of permit-only and resident-only parking near MBTA stations are discussed in Section 7.3.
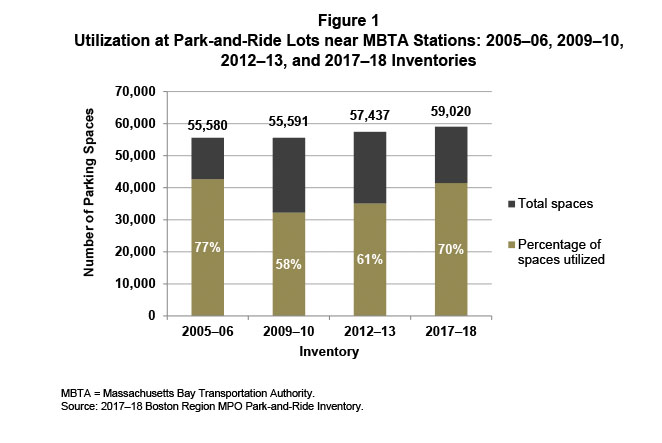
An analysis of the inventory results indicated a total net increase of about 1,583 parking spaces in the MBTA park-and-ride system from the 2012–13 inventory to the 2017–18 inventory. On a typical weekday morning, 70 percent of all parking spaces for all transit modes in the MBTA system were used. As shown in Figure 1, there was a nine percent increase in utilization from the 2012–13 survey to the 2017–18 survey, but a seven percent decrease in the utilization rate from the 2005–06 inventory due to a net increase in the number of parking spaces. Major changes that have affected the utilization include the opening of the Wachusett and Assembly stations, the closure of parking lots near Lechmere Station and Quincy/Fore River Ferry Terminal, and the inclusion of several parking facilities near stations, which were not included in the previous inventories.
The breakdown of parking utilization rates across the different transit modes was 64 percent utilization for the commuter rail system, 85 percent utilization for the rapid transit system, 78 percent utilization for express bus, and 65 percent utilization for commuter ferry.19 Figure 2 shows the parking capacity and utilization for each individual station that was collected for the 2017–18 inventory. For a graphical comparison of the parking utilization difference between the 2012–13 and 2017–18 inventories by individual station, refer to Figure B-1 in Appendix B.
Figure 1
Utilization at Park-and-Ride Lots near MBTA Stations: 2005–06, 2009–10, 2012–13, and 2017–18 Inventories
MBTA = Massachusetts Bay Transportation Authority.
Source: 2017–18 Boston Region MPO Park-and-Ride Inventory.
Figure 2
Park-and-Ride Lot Capacity and Utilization, 2017–18 Inventory
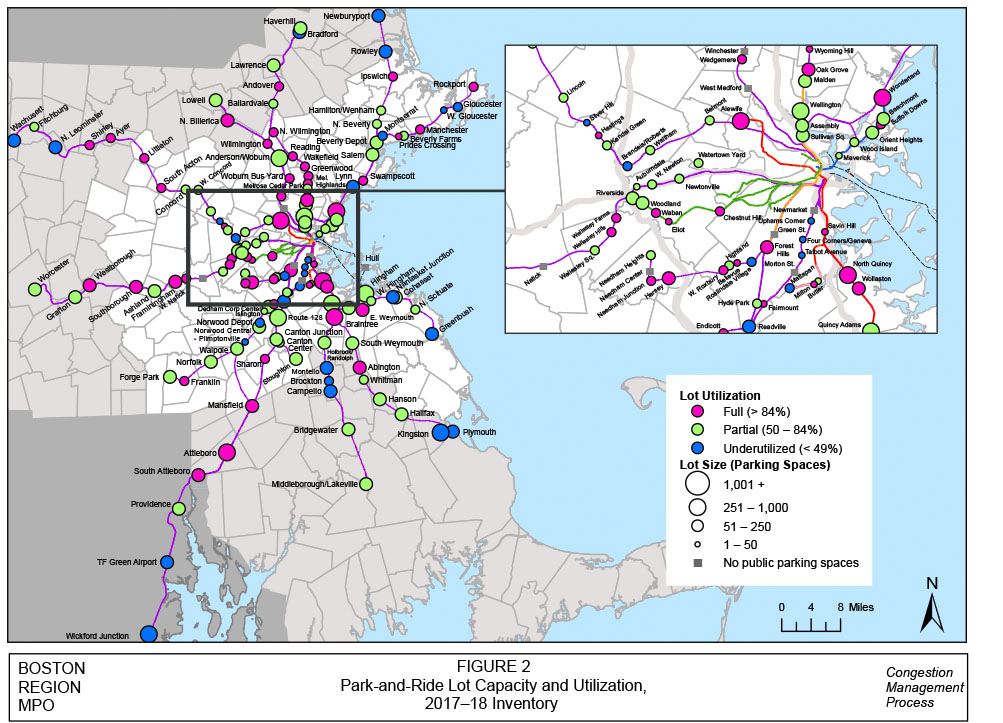
Table 4 shows the 2017–18 commuter rail park-and-ride utilization by line.
Table 4
Commuter Rail Parking Inventory and Percent of Parking Utilization at Park-and-Ride Lots near MBTA Stations, 2017–18
Commuter Rail Line |
Number of Parking Spaces |
Percent Utilization |
Fitchburg Line |
2,283 |
60% |
Haverhill Line* |
2,332 |
64% |
Lowell Line |
2,939 |
76% |
Newburyport/Rockport Line* |
4,362 |
47% |
North Side Total |
11,916 |
60% |
Fairmount Line |
381 |
40% |
Framingham/Worcester Line |
3,841 |
82% |
Franklin Line |
3,562 |
69% |
Greenbush Line* |
2,906 |
47% |
Kingston/Plymouth Line* |
3,372 |
56% |
Middleborough/Lakeville Line |
2,778 |
51% |
Needham Line |
933 |
81% |
Providence/Stoughton Line* |
9,143 |
71% |
South Side Total |
26,916 |
65% |
Grand Total |
38,832 |
64% |
*The parking lots near the Beverly Farms, Haverhill, Mansfield, Nantasket Junction, Plymouth, and Rockport stations were under construction at the time of the 2017–18 survey. The parking utilization and capacity may have been temporarily affected as a result.
MBTA = Massachusetts Bay Transportation Authority.
Source: 2017–18 Boston Region MPO Park-and-Ride Inventory.
More parking spaces at commuter rail stations were filled during the AM peak period of the 2017–18 parking inventory than were filled during the 2012–13 inventory. However, in the 2017–18 inventory, parking utilization was lower than its peak in 2005–06, and the increase of total parking capacity went from 32,975 to 38,832 spaces.
Of the 12 commuter rail lines surveyed in the 2017–18 inventory, every line experienced an increase in utilization since the 2012–13 inventory, except the Fitchburg Line, which stayed the same. The utilization on the Fitchburg Line remained the same despite experiencing an increase of 918 parking spaces since 2012–13, including 351 spaces at the newly-opened Wachusett Station. Figure 3 shows the utilization of the commuter rail system for the past four inventories. For detailed information, such as parking lot capacity, utilization, and ownership at every commuter rail station, refer to Tables A-1 and A-2 in Appendix A.
Figure 3
MBTA Commuter Rail Park-and-Ride Utilization:
2005–06, 2009–10, 2012–13, and 2017–18 Inventories
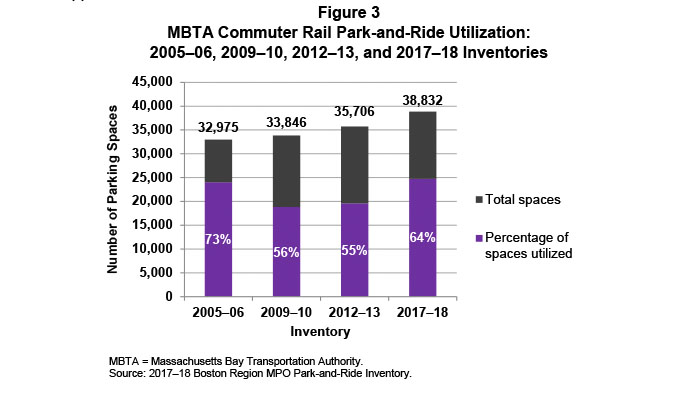
MBTA = Massachusetts Bay Transportation Authority.
Source: 2017–18 Boston Region MPO Park-and-Ride Inventory.
Fitchburg Line
On the Fitchburg Line, 60 percent of all parking spaces were utilized during the AM peak period. This represented a decrease of one percent from the 2012–13 inventory. The utilization remained the same despite an increase of 918 parking spaces, including 351 spaces at the newly-opened Wachusett Station. At the 16 stations that routinely provide parking on this line, Ayer, Hastings, Littleton, Shirley, and South Acton were filled during the AM peak period. Ayer and Littleton were 100 percent filled at the time of observation. South Acton, Shirley, and Hastings were 96 percent, 88 percent, and 86 percent filled, respectively. Wachusett Station, which opened in 2016, had a utilization of 24 percent. There were 71 accessible spaces available along the Fitchburg Line, of which 15 percent were utilized.
Haverhill Line20
During the AM peak period, 64 percent of the 2,332 parking spaces available for public use were filled. This represented an increase of seven percent from the previous inventory. At the 12 stations on the Haverhill Line that have parking lots, Andover, Greenwood, Melrose Highlands, North Wilmington, Reading, Wakefield, and Wyoming Hill were filled during the AM peak period. While there were an additional 311 spaces at Reading Station and 26 spaces at Bradford Station, these spaces were only available to residents of these respective communities. There were 56 accessible parking spaces near stations along the Haverhill Line, and 21 percent of those spaces were utilized.
Lowell Line
Out of the 2,939 parking spaces near stations on the Lowell Line, 76 percent were utilized. This represented an increase of 10 percent on the Lowell Line from the previous inventory. Of the five stations on the Lowell Line that have parking, North Billerica, Wedgemere, and Wilmington stations were filled during the AM peak period. The Lowell line had 64 accessible spaces near its stations, and 17 percent of those spaces were utilized.
Newburyport/Rockport Line21
There were 4,362 parking spaces available for public use on the Newburyport/Rockport Line; 47 percent of those parking spaces were in use during the AM peak period, which represented a one percent increase from the previous inventory. Of the 16 stations on the line that have parking lots, Ipswich, Manchester, Prides Crossing, Rockport and Swampscott were filled during the AM peak period. Additionally, there were 131 permit-only parking spaces at Beverly Depot, and an additional 15 permit-only parking spaces at Swampscott. All of the resident-only parking spaces were utilized during the AM peak period. The Newburyport/Rockport Line had 107 accessible spaces near its stations, and 21 percent of those spaces were utilized.
Fairmount Line
There were a total of seven stations on the Fairmount Line, and five of these stations had parking nearby.22 Three new stations (Four Corners/Geneva, Newmarket and Talbot Avenue) were built along the Fairmont Line since the 2012–13 inventory was conducted, and both Four Corners/Geneva and Talbot Avenue stations had parking spaces near them. There were 381 parking spaces located near the Fairmount Line, and 40 percent of those parking spaces were utilized during the AM peak period. This represented an increase of five percent from the previous inventory. There were no permit-only parking spaces on this line. The Fairmount Line had 25 accessible parking spaces, and eight percent of those spaces were utilized.
Framingham/Worcester Line
Out of the 13 stations on the Framingham/Worcester Line that had parking, Wellesley Hills, Wellesley Square and Wellesley Farms lots were filled entirely during the AM peak period. Additionally, the Framingham, Southborough, and Westborough lots were 93 percent, 96 percent, and 98 percent utilized, respectively. Of the 3,841 parking spaces on this line, 82 percent were filled during the AM peak period, which represented an increase of 19 percent from the previous inventory. There were permit-only lots at Framingham and Natick stations that had 408 and 139 spaces, respectively. The Framingham lot had 31 percent utilization, and the Natick lot had 52 percent utilization. There were 99 accessible parking spaces along the Framingham/Worcester Line, 24 percent of which were utilized.
Franklin Line
There were a total of 3,562 parking spaces available along the Franklin Line, 69 percent of which were filled.23 This represented an increase of 13 percent from the previous inventory. Of the 10 stations on the Franklin Line, Endicott was the only station that was completely filled during the AM peak period. Additionally, Franklin Station experienced 90 percent utilization during the AM peak period. In addition to the public spaces, there were 60 permit-only spaces at Franklin Station, which was 63 percent utilized during the AM peak period. The Franklin Line had 66 accessible spaces, with nine percent of the spaces utilized during the AM peak period.
At the seven stations on the Greenbush Line, no lots were completely filled during the AM peak period. East Weymouth had the highest utilization along the Greenbush line at 93 percent. There were 2,906 parking spaces available for public use, 47 percent of which were filled during the AM peak period. This represented a three percent increase from the previous inventory. The parking lots along the Greenbush Line had 76 accessible parking spaces, 18 percent of which were utilized.
At the seven stations on the Kingston/Plymouth Line that have parking, no parking lots were completely filled. However, Abington had 89 percent parking utilization. There were 3,372 parking spaces available for public use on this line, 56 percent of which were filled during the AM peak period. This represented a 12 percent increase from the previous inventory. There were an additional 171 permit-parking spaces at Kingston Station, and 198 permit-parking spaces at Abington Station, which were at 49 percent and 43 percent utilization, respectively. There were 73 accessible parking space along the Kingston/Plymouth Line, of which seven percent were utilized.
At the six stations on the Middleborough/Lakeville Line that have parking, no lots were filled during the AM peak period. There were 2,778 parking spaces available for public use, and 51 percent were filled during the AM peak period. This represented an increase of seven percent from the previous inventory. There were no permit-only or resident-only parking spaces on the Middleborough/Lakeville Line. There were 68 accessible parking spaces along the Middleborough/Lakeville Line, and the utilization for the accessible parking spaces was 10 percent.
Needham Line
There were 933 parking spaces available for public use, 81 percent of which were filled during the AM peak period. This represented a 16 percent increase from the previous inventory. Of the eight stations on the Needham Line, both the Hersey and Bellevue stations were 100 percent utilized in the AM peak period. Additionally, the Needham Junction and West Roxbury stations experienced 93 percent and 92 percent utilization, respectively. There were 21 accessible parking spaces along the Needham Line, 19 percent of which were utilized.
Providence/Stoughton Line26, 27
There were a total of 9,143 parking spaces available for public use on the Providence/Stoughton Line, 71 percent of which were filled during the AM peak period. This represented a 10 percent increase from the previous inventory. An additional 1,210 parking spaces on the line were designated for resident-only parking; 73 percent of those were in use during the AM peak period. Of the 12 stations on the Providence/Stoughton Line that had parking, no lots were filled completely during the AM peak period. However, the Mansfield, Attleboro, Sharon and South Attleboro stations had utilization of 99 percent, 98 percent, 95 percent, and 88 percent, respectively. There were 174 accessible parking spaces along the line, 20 percent of which were utilized.
All four rapid transit lines experienced an increase in park-and-ride utilization between the 2012–13 and 2017–18 inventories. The total parking utilization for the rapid transit lines increased to 85 percent from 74 percent in 2012–13. In the 2017–18 inventory, six stations were completely filled during the AM peak period, while in 2012–13 only three stations were completely filled during the AM peak period. In 2009–10, no rapid transit station filled during the AM peak period. Figure 4 shows the utilization of the rapid transit system for the past four inventories. For detailed information, such as parking lot capacity, utilization, and ownership at every rapid transit station, refer to Table A-3 in Appendix A.
Figure 4
MBTA Rapid Transit Park-and-Ride Utilization:
2005–06, 2009–10, 2012–13, and 2017–18 Inventories
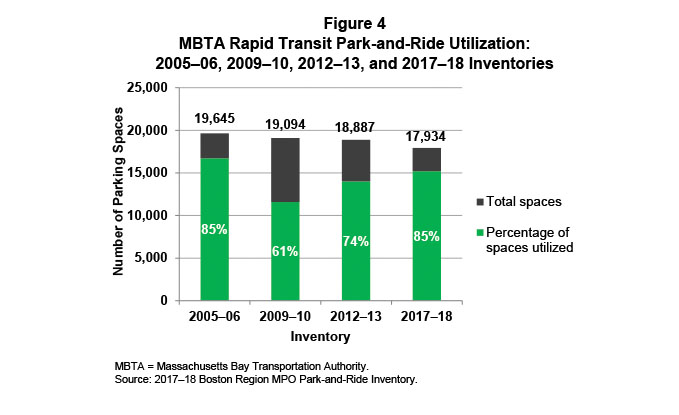
MBTA = Massachusetts Bay Transportation Authority.
Source: 2017–18 Boston Region MPO Park-and-Ride Inventory.
Table 5 shows the percent of parking utilization by rapid transit line.
Table 5
Rapid Transit Parking Inventory and Percent Utilization at Park-and-Ride Lots near MBTA Stations, 2017–18
Rapid Transit Line |
Number of Parking Spaces |
Percent Utilization |
Blue Line |
3,288 |
84% |
Green Line |
1,679 |
74% |
Orange Line* |
5,031 |
81% |
Red Line and Mattapan High-Speed Line* |
7,936 |
90% |
Total |
17,934 |
85% |
*The parking lots near Alewife and Forest Hills were under construction at the time of the 2017–18 survey. The parking utilization and capacity may have been temporarily affected as a result.
MBTA = Massachusetts Bay Transportation Authority.
Source: 2017–18 Boston Region MPO Park-and-Ride Inventory.
For the current inventory, the Blue Line had six stations that provided parking. No lots were completely filled during the AM peak period. Eighty-four percent of the 3,288 spaces were utilized during the AM peak period, which represented a 19 percent increase from the 2012–13 inventory. However, Suffolk Downs and Wonderland stations had 90 percent and 88 percent utilization, respectively. There was no permit-only parking on this line. There were 58 accessible parking spaces near the Blue Line stations, 48 percent of which were utilized.
The Green Line had 1,679 spaces, 74 percent of which were in use during the AM peak period. This represented an 18 percent increase from the 2012–13 inventory. Five Green Line stations had parking, and Chestnut Hill, Eliot and Waban were completely filled during the AM peak period. A parking lot near Lechmere Station, which had 369 spaces in the previous inventory, was removed in 2018. There were 39 accessible parking spaces near the Green Line stations; the utilization rate for those spaces was 21 percent.
The Orange Line had 5,031 spaces, 81 percent of which were in use during the AM peak period. This represented an increase of eight percent from the previous inventory. Six stations on the Orange Line had public parking lots, none of which were completely filled. However, public parking at Forest Hills and Oak Grove stations had 98 percent and 96 percent utilization, respectively. Oak Grove had 106 permit-only parking spaces, of which 79 spaces were in use. There were 84 permit-only spaces near Green Street Station, of which 49 spaces were in use. There were 86 accessible parking spaces along the Orange Line; 41 percent of those spaces were utilized. Assembly Station, which opened in September 2014, provided 350 parking spaces, with 84 percent utilization during the AM peak period.
The Red Line and Mattapan High-Speed Line together had nine stations with parking lots. Of the 7,936 parking spaces available for the public, 90 percent were filled during the AM peak period. This represented a seven percent increase from the 2012–13 inventory. The Alewife, Milton, and Wollaston parking lots were all filled to capacity during the AM peak period. The parking lots near the Red Line and Mattapan High-Speed provided 118 accessible parking spaces. The utilization of these spaces was 48 percent.
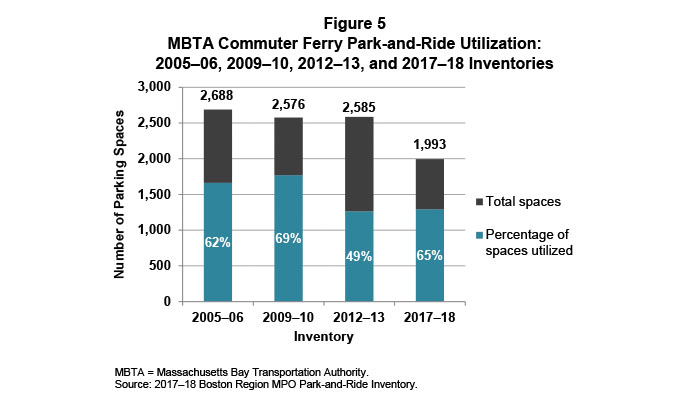
As shown in Figure 5, parking utilization increased at commuter ferry terminals from 62 percent in 2005–06 to 69 percent in 2009–10, and decreased to 49 percent in 2012–13. In the current inventory, parking utilization increased to 65 percent. This was the result of a decrease in parking capacity; the closure of the Quincy/Fore River Ferry Terminal, and the conversion to permit-only parking in Hull.
For the current inventory, Hingham was the only commuter ferry terminal that offered non-permit parking. Hingham had 1,993 parking spaces, 65 percent that were utilized during the AM peak period. Hingham had 36 accessible parking spaces; 25 percent that were utilized during the AM peak period.
Figure 5
MBTA Commuter Ferry Park-and-Ride Utilization:
2005–06, 2009–10, 2012–13, and 2017–18 Inventories
MBTA = Massachusetts Bay Transportation Authority.
Source: 2017–18 Boston Region MPO Park-and-Ride Inventory.
During the current inventory, there were two express bus parking lots surveyed, the Watertown Bus Lot and the Woburn Bus Lot. The Watertown Bus Lot was served by the 52, 57, 502, and 504 MBTA buses, and had 194 parking spaces. The Woburn Bus Lot was served by the 354 MBTA bus, and had 67 parking spaces. The express bus parking lots were 77 percent filled during the current inventory. This represented a decrease from the 84 percent utilization that was observed during the 2012–13 inventory. The Woburn Bus Lot at Montvale Avenue was 99 percent filled during the AM peak period in the current inventory. There were a total of two accessible parking spaces at the express bus lots, zero of which were filled during the AM peak period.
Table 6 shows how parking utilization at stations may have been influenced by parking fee changes between the 2012–13 and 2017–18 inventories. Commuter rail stations that experienced a parking fee decrease since the previous inventory had an increase in utilization of 5.1 percent. Stations that had increases or no changes in parking fees had an increase in utilization of 9.3 percent. This disparity might be a result of the MBTA adjusting the parking fees based on parking demand at each station over time. Additionally, rapid transit stations that experienced an increase in parking fees had an increase in utilization of 2.4 percent, compared to change in utilization of 15 percent for stations that did not have a change in parking fees. For all modes, parking utilization increased 5.8 percent for stations that experienced parking fee decreases, compared to an 8.3 percent increase for stations with a parking fee increase, and 10 percent for stations that did not have a change in parking fees.
Table 6
Breakdown of Change in Parking Utilization per Station between the
2012–13 and 2017–18 Inventories by Mode and Parking Fee Changes
Mode |
Change in Utilization at Stations with Parking Fee Increase |
Change in Utilization at Stations with Parking Fee Decrease |
Change in Utilization at Stations Without Parking Fee Change |
Change in Utilization by Mode |
Commuter rail |
9.2% |
5.1% |
9.3% |
8.9% |
Rapid transit |
2.4% |
N/A |
15.0% |
10.0% |
Ferry |
N/A |
13.0% |
N/A |
13.0% |
Bus |
N/A |
N/A |
-5.0% |
-5.0% |
All modes |
8.3% |
5.8% |
10.0% |
8.9% |
N/A = not applicable.
Source: 2012–13 and 2017–18 Boston Region MPO Park-and-Ride Inventory.
There are several parking garages and lots serving the MBTA system that are located strategically throughout the MBTA service area to attract a large number of users from many communities. For the purposes of this analysis, all major regional park-and-ride lots are defined as having at least 500 parking spaces. These facilities are typically located at the end of a commuter rail or transit line, or near highways or at major roadway interchanges, and generally have greater capacity than most other stations. These lots include the facilities at Braintree and the Anderson Regional Transportation Center, which are near Route 3 and Interstate 93, respectively. Other stations with such facilities are Route 128 and the South Attleboro stations, which are located directly off of Interstate 95, and the Alewife Station, which is located directly off of Route 2.
These parking facilities have the ability to serve many users due to the convenient location and size, and the facilities supply more than 67 percent of all parking spaces near MBTA transportation facilities, including express bus lots and commuter ferry terminals. Table 7 provides the regional park-and-ride lots serving the MBTA system. Of these lots, Salem, Providence, Malden Center, and Lawrence experienced the biggest decline in utilization between the 2012–13 and 2017–18 inventories. Ashland, Haverhill, Attleboro, Wickford Junction, Wonderland, Riverside, and Woodland stations all experienced parking lot utilization increases of more than 20 percent.
Table 7 does not include accessible parking. The totals also omit 850 permit-only parking spaces, including106 at Oak Grove, 423 at Mansfield, 150 at Attleboro and 171 at Kingston. Overall, 68 percent of these permit-only spaces were used during the AM peak period.
Table 7
Major Regional Parking Garages and Lots near MBTA Stations: 2017–18 Capacity and Utilization
Station Name |
Transit Line |
Number of Parking Spaces |
Percent Utilization |
Ashland |
Framingham/Worcester |
678 |
81% |
Worcester |
Framingham/Worcester |
615 |
69% |
Forge Park |
Franklin |
703 |
55% |
Norfolk |
Franklin |
619 |
82% |
Norwood Central |
Franklin |
791 |
73% |
Greenbush |
Greenbush |
978 |
23% |
Haverhill* |
Haverhill |
544 |
50% |
Lawrence |
Haverhill |
745 |
60% |
Kingston |
Kingston/Plymouth |
1,008 |
48% |
South Weymouth |
Kingston/Plymouth |
623 |
67% |
Anderson/Woburn |
Lowell |
1,200 |
70% |
Lowell |
Lowell |
866 |
69% |
North Billerica |
Lowell |
563 |
92% |
Campello |
Middleborough/Lakeville |
541 |
31% |
Middleborough/Lakeville |
Middleborough/Lakeville |
756 |
60% |
Lynn |
Newburyport/Rockport |
965 |
28% |
Newburyport |
Newburyport/Rockport |
865 |
40% |
Salem |
Newburyport/Rockport |
765 |
56% |
Attleboro |
Providence/Stoughton |
1,036 |
98% |
Canton Junction |
Providence/Stoughton |
925 |
78% |
Mansfield* |
Providence/Stoughton |
667 |
99% |
Providence |
Providence/Stoughton |
669 |
72% |
Route 128 |
Providence/Stoughton |
2,528 |
71% |
South Attleboro |
Providence/Stoughton |
779 |
88% |
TF Green |
Providence/Stoughton |
591 |
10% |
Wickford Junction |
Providence/Stoughton |
1,077 |
29% |
Commuter Rail Total |
|
22,097 |
62% |
Wonderland |
Blue Line |
2,248 |
88% |
Riverside |
Green Line |
959 |
69% |
Woodland |
Green Line |
548 |
76% |
Malden Center |
Orange Line |
828 |
73% |
Oak Grove |
Orange Line |
682 |
96% |
Sullivan Square |
Orange Line |
569 |
71% |
Wellington |
Orange Line |
2,183 |
78% |
Alewife* |
Red Line |
2,439 |
100% |
Braintree |
Red Line |
1,177 |
97% |
North Quincy |
Red Line |
1,173 |
97% |
Quincy Adam |
Red Line |
2,319 |
77% |
Wollaston |
Red Line |
524 |
100% |
Rapid Transit Total |
15,649 |
86% |
|
Hingham |
Ferry |
1,993 |
65% |
Commuter Ferry Total |
|
1,993 |
65% |
All Regional Stations |
Grand Total |
39,739 |
71% |
*The station was under construction at the time of the survey.
MBTA = Massachusetts Bay Transportation Authority.
Source: 2017–18 Boston Region MPO Park-and-Ride Inventory.
The tables in Appendix D summarize the amenities at MBTA stations that have parking lots. This information pertaining to accessible platforms and ramps, along with the absence or presence of benches, bicycle racks, and shelters, was collected as part of this inventory.
Out of the 121 commuter rail stations inventoried, 95 had fully raised or “mini-high” accessible platforms. All of the stations included in this inventory on the Middleborough/Lakeville, Plymouth/Kingston, Fairmount, Greenbush and Needham lines had accessible platforms.
Out of the 27 rapid transit stations inventoried, 24 had accessible platforms, including all of the stations on the Red, Orange, and Blue lines. Three of the inventoried Green Line stations did not have accessible platforms. Hingham and the express bus lots had accessible sidewalk ramps, and all of the buses were low-level, kneeling buses. Table 8 lists the stations that lack accessible platforms.
Table 8
Stations Without Accessible Platforms:
2017–18 Inventory
Station Name |
Transit Line |
Transit Mode |
Concord |
Fitchburg/South Action Line |
Commuter Rail |
Ayer |
Fitchburg/South Action Line |
Commuter Rail |
Belmont |
Fitchburg/South Action Line |
Commuter Rail |
Hastings |
Fitchburg/South Action Line |
Commuter Rail |
Kendal Green |
Fitchburg/South Action Line |
Commuter Rail |
Lincoln |
Fitchburg/South Action Line |
Commuter Rail |
Shirley |
Fitchburg/South Action Line |
Commuter Rail |
Silver Hill |
Fitchburg/South Action Line |
Commuter Rail |
Auburndale |
Framingham/Worcester Line |
Commuter Rail |
Natick |
Framingham/Worcester Line |
Commuter Rail |
Newtonville |
Framingham/Worcester Line |
Commuter Rail |
Wellesley Farms |
Framingham/Worcester Line |
Commuter Rail |
Wellesley Hills |
Framingham/Worcester Line |
Commuter Rail |
Wellesley Square |
Framingham/Worcester Line |
Commuter Rail |
West Newton |
Framingham/Worcester Line |
Commuter Rail |
Endicott |
Franklin Line |
Commuter Rail |
Franklin |
Franklin Line |
Commuter Rail |
Islington |
Franklin Line |
Commuter Rail |
Plimptonville |
Franklin Line |
Commuter Rail |
Walpole |
Franklin Line |
Commuter Rail |
Greenwood |
Haverhill Line |
Commuter Rail |
Melrose Cedar Park |
Haverhill Line |
Commuter Rail |
Wakefield |
Haverhill Line |
Commuter Rail |
Wyoming Hill |
Haverhill Line |
Commuter Rail |
West Medford |
Lowell Line |
Commuter Rail |
Winchester |
Lowell Line |
Commuter Rail |
Prides Crossing |
Newburyport/Rockport Line |
Commuter Rail |
Chestnut Hill |
Green Line |
Rapid Transit |
Eliot |
Green Line |
Rapid Transit |
Waban |
Green Line |
Rapid Transit |
Source: 2017–18 Boston Region MPO Park-and-Ride Inventory.
Accessible parking spaces are defined in this memorandum as parking spaces that are specifically designated to provide people with disabilities better access to MBTA facilities by automobile. These parking spaces can be identified by surveyors from signs, which include the international symbol of accessibility. A special permit needs to be obtained before a commuter can park in an accessible parking space.
Out of the MBTA stations surveyed for the current 2017–18 inventory, 90 percent provided at least one public accessible parking space. At the time of the inventory, 1,239 accessible parking spaces were located near MBTA stations, with 24 percent of those spaces utilized. The utilization rate for accessible parking spaces had increased three percent since the 2012–13 inventory, despite a two percent increase in accessible parking capacity. Rapid transit had more than double the utilization rate of all other modes, at 43 percent in the current inventory. Table 9 shows the utilization rates of accessible parking spaces by transit line.
Table 9
Accessible Parking near MBTA Stations by Transit Line:
2017–18 Capacity and Utilization
Transit Line |
Accessible Parking Spaces |
Accessible |
Fairmount |
25 |
8% |
Fitchburg |
71 |
21% |
Framingham/Worcester |
99 |
24% |
Franklin |
66 |
9% |
Greenbush* |
76 |
18% |
Haverhill* |
56 |
21% |
Kingston/Plymouth* |
73 |
7% |
Lowell |
64 |
17% |
Middleborough/Lakeville |
68 |
10% |
Needham |
21 |
19% |
Newburyport/Rockport* |
107 |
21% |
Providence/Stoughton* |
174 |
20% |
Commuter Rail Total |
900 |
17% |
Blue Line |
58 |
48% |
Green Line |
39 |
21% |
Orange Line* |
86 |
41% |
Red Line* |
118 |
48% |
Rapid Transit Total |
301 |
43% |
Commuter Ferry Total |
36 |
25% |
Bus Total |
2 |
0% |
Total Accessible Spaces |
1,239 |
24% |
*The parking lots near the Beverly Farms, Haverhill, Mansfield, Nantasket Junction, Plymouth, Rockport, Alewife and Forest Hills stations were under construction at the time of the 2017–18 survey. The parking utilization and capacity may have been temporarily affected as a result.
MBTA = Massachusetts Bay Transportation Authority.
Source: 2017–18 Boston Region MPO Park-and-Ride Inventory.
Permit-only and resident-only parking spots are generally reserved for commuters who either purchase a permit for a certain period of time (for example, yearly or monthly) or commuters who are residents of the local municipality in which the MBTA station (commuter rail or rapid transit) is located. While the main purpose of this memorandum is to show the parking utilization rates for the general public, permit-only and resident-only parking remains a commuter option for MBTA users, so it is included in the analysis.
Table 10 displays the locations of the permit-only and resident-only parking lots near MBTA stations. In the current inventory, there were 3,681 permitted or resident-only parking spaces near MBTA stations, 3,322 parking spaces near commuter rail stations, 190 parking spaces near rapid transit stations, and 169 parking spaces near ferry terminals. The total utilization rate for the lots was 69 percent. Permit parking along the Haverhill Line, Lowell Line, and the Hull Ferry Terminal had the highest rates of permit-parking utilization.
Table 10
Permit-Only and Resident-Only Parking Spaces near MBTA Stations:
2017–18 Inventory Capacity and Utilization
Station Name |
Transit Line |
Permit-Only and Resident-Only Parking Spaces |
Permit-Only and Resident-Only Parking Space Utilization |
Belmont |
Fitchburg |
9 |
33% |
West Concord |
Fitchburg |
57 |
58% |
Lincoln |
Fitchburg |
54 |
100% |
South Acton |
Fitchburg |
322 |
73% |
Framingham |
Framingham/Worcester |
408 |
31% |
Natick |
Framingham/Worcester |
83 |
52% |
Franklin |
Franklin |
60 |
63% |
Bradford |
Haverhill |
26 |
65% |
Reading |
Haverhill |
311 |
94% |
Abington |
Kingston/Plymouth |
198 |
43% |
Kingston |
Kingston/Plymouth |
171 |
49% |
Wedgemere |
Lowell |
32 |
75% |
West Medford |
Lowell |
71 |
90% |
Winchester |
Lowell |
164 |
82% |
Beverly Depot |
Newburyport/Rockport |
131 |
100% |
Swampscott |
Newburyport/Rockport |
15 |
100% |
Attleboro |
Providence/Stoughton |
150 |
51% |
Mansfield* |
Providence/Stoughton |
423 |
80% |
Sharon |
Providence/Stoughton |
500 |
81% |
Stoughton |
Providence/Stoughton |
137 |
49% |
Commuter Rail Total |
|
3,322 |
68% |
Green Street |
Orange Line |
84 |
58% |
Oak Grove |
Orange Line |
106 |
75% |
Rapid Transit Total |
|
190 |
67% |
Commuter Ferry Total |
|
169 |
94% |
Total Permit Parking Spaces |
3,681 |
69% |
|
*Parking lots at Mansfield Station were under construction at the time of the survey. The parking utilization and parking capacity may have been temporarily affected as a result.
MBTA = Massachusetts Bay Transportation Authority.
Source: 2017–18 Boston Region MPO Park-and-Ride Inventory.
The MPO staff last collected bicycle parking data from the spring and fall of April 2017 to November 2018, and from an earlier inventory conducted in 2012–13 on bicycle parking facilities’ capacity and utilization for all MBTA stations.30 The inventory included 143 rapid transit stations, 129 commuter rail stations, six commuter ferry terminals, and two major bus stops. Of the 280 stations included in the bicycle inventory, 86 percent had bicycle racks. This included 114 of the 143 rapid transit stations, 120 of the 129 commuter rail stations, five of the six ferry terminals, and one of the two major bus stops. The MBTA stations that either currently had or will have bike ports or bicycle cages are listed in Appendix D.
The station with the highest bike parking capacity was Alewife with 494 spaces. Between the previous bicycle parking inventory in 2012–13, and the current 2017–18 bicycle parking inventory, there was a 6 percent increase in the number of parked bicycles, and a 20 percent increase in the number of bicycle parking spaces. Table 11 shows the percentages of bicycle rack utilization by mode and line throughout the system. Figures B-3 and B-4 in Appendix B are maps of the bicycle parking capacity and utilization by station.
Table 11
Bicycle Parking Capacity and Utilization at Park-and-Ride Stations near MBTA Stations, 2017–18
Transit Line |
Bicycle Parking Spaces |
Percent Utilization |
Newburyport/Rockport |
383 |
29% |
Haverhill |
216 |
20% |
Lowell |
161 |
30% |
Fitchburg |
383 |
22% |
Framingham/Worcester |
247 |
30% |
Needham |
91 |
20% |
Franklin |
162 |
23% |
Fairmount |
143 |
1% |
Providence/Stoughton |
348 |
43% |
Middleborough/Lakeville |
147 |
6% |
Kingston/Plymouth |
98 |
16% |
Greenbush |
98 |
20% |
Commuter Rail Total |
2,429 |
25% |
Red Line |
1,875 |
55% |
Mattapan High-Speed Line |
99 |
3% |
Blue Line |
512 |
30% |
Orange Line |
1,074 |
36% |
Green Line |
1,117 |
31% |
Silver Line Washington Street |
194 |
13% |
Silver Line Waterfront |
202 |
35% |
Silver Line SL3 |
47 |
26% |
Rapid Transit Total |
4,783 |
40% |
Commuter Ferry Total |
62 |
29% |
Bus Total |
12 |
8% |
Grand Total |
7,286 |
35% |
Note: Bicycles and racks are counted more than once at stations that serve more than one transit line. In those cases, each bicycle and each rack is counted once for each line. However, in each of the totals for that station, these spaces are counted only once.
MBTA = Massachusetts Bay Transportation Authorty.
Source: 2017–18 Boston Region MPO Park-and-Ride Inventory.
Most of the MBTA stations with park-and-ride lots have shelters. In the current inventory, a shelter was defined as any structure that provides some protection from the weather. The structure could be a roof over a platform, a completely enclosed station, or a stand-alone structure with a roof and walls. The locations that do not have a shelter include the Hastings, Lincoln, and Plimptonville stations, and the Hingham Ferry Terminal. All rapid transit stations, parking lots for MBTA bus service, and the Hull Ferry Terminal had shelters on the inbound side. Certain stations, such as Alewife and Braintree, had shelters on both the inbound and outbound sides.
In summary, the data from the 2017–18 park-and-ride inventory analysis provided the following suggestions and conclusions.
Park-and-ride utilization has increased from 61 percent to 70 percent since the previous parking inventory in 2012–13. However, there was a net increase of 1,583 parking spaces from the previous inventory. To compare by transit mode, commuter rail park-and-ride lots increased by 3,126 spaces, rapid transit park-and-ride lots decreased by 953 spaces, and commuter ferry park-and-ride lots decreased by 592 spaces.
Although more spaces were added since the previous inventory, more park-and-ride lots at MBTA stations were filled in the current inventory than in the 2012–13 inventory. This is consistent with the nationwide trend of more commuters traveling by public transportation, which can be attributed to the improvement of the economy since the recession in 2007.
In the current inventory, 37 percent of the stations surveyed had parking lots that filled to 85 percent or more of lot capacity. Park-and ride lots at 19 percent of the stations surveyed were less than half-utilized at the end of the AM peak period. Of the 53 lots that filled to 85 percent of more of lot capacity, 36 were smaller lots (with 250 spaces or fewer); by contrast, larger lots (with 1,000 spaces or more) were 96 percent utilized, on average.
Overall, commuter rail utilization increased along with an increase in parking spaces near commuter rail stations. However, the data also showed that utilization declined at certain stations, notably Providence, Malden Center, and Quincy Adams stations.
There was at least one station on every MBTA commuter rail line where 45 percent or more of parking was available on a typical weekday morning, with the exception of the Lowell and Framingham/Worcester lines, where there was at least one station that had 30 percent available parking on a typical weekday morning.
Major commuter garages and facilities, located near major highways, provided more than 67 percent of the MBTA system’s parking capacity. There were several park-and-ride lots at commuter rail stations that experienced significant increases, such as the 44 percent increase in utilization at the Ashland Station. Additionally, there were decreases in parking utilization, such as the 10 percent decrease in utilization at the Lawrence station.
Parking utilization continued to increase at park-and-ride lots near rapid transit stations, despite the increase in parking fees at most parking lots. Additionally, there were 953 less parking spaces in the current inventory, compared to the 2012–13 inventory. The reduction in parking spaces was due in large part to the closure of the parking lot near Lechmere. The Red Line had the highest utilization of all of the rapid transit lines at 90 percent, which was an increase of 7 percent from the 2012–13 inventory.
Currently, the only commuter ferry terminal that had parking nearby was Hingham. This terminal experienced an increase in parking utilization, possibly due to the closure of the Quincy/Fore River Ferry Terminal. The Quincy/Fore River Ferry Terminal is approximately 2.5 miles away from the Hingham Ferry Terminal, so it is very plausible that many commuters shifted to the Hingham Ferry Terminal when the Quincy/Fore River Ferry Terminal closed.
The parking utilization at express bus lots decreased from the 2012–13 parking inventory. A possible reason for this could be due to the decline in bus ridership in recent years.
The Salem and Providence park-and-ride lots experienced the biggest decline in utilization among commuter rail stations from the 2012–13 inventory to the current 2017–18 inventory. The Salem and Providence parking lots experienced a 17 percent and 14 percent decline in utilization, respectively. The decrease in utilization at the Salem Station parking facility was due to construction during the 2012–13 inventory, when parking capacity was temporarily decreased. The Ashland and Attleboro stations experienced parking utilization increases of 44 percent and 31 percent since the 2012–13 inventory, respectively. The increase in parking at the Ashland commuter rail stop could be evidence of the population growth of the MetroWest region in recent years.
The Woodland and Riverside park-and-ride lots experienced parking lot utilization increases of 33 percent and 29 percent, respectively. The Malden Center parking lot experienced a decline of 11 percent since the 2012–13 inventory.
The overall utilization of accessible parking spaces has increased since the 2012–13 inventory. Both the Red Line and the Blue Line had the highest utilization rate for accessible parking spaces at 48 percent.
Permit-only and resident-only parking located along the Haverhill Line, Lowell Line, and Hingham Ferry Terminal had the highest utilization. All three of these lines had utilization of 83 percent or higher.
The number of bicycles parked and bicycle spaces at MBTA stations increased from the 2012–13 bicycle parking inventory to the 2017–18 bicycle parking inventory. However, the bicycle parking utilization decreased during that same time period due to the increase in bicycle parking.
The Boston Region MPO is always exploring ways to better communicate findings to commuters in the Boston region, as this information can be vital for improving long-term planning for parking capacity at MBTA stations. As part of this effort, an interactive dashboard has been created for the Boston Region MPO website, which will allow commuters and regional planners to view parking information at all MBTA stations.
This dashboard includes information contained in this memorandum and provides a sample of the parking conditions at every parking lot near MBTA stations, including parking capacity, parking utilization, and the location of park-and-ride lots near each transit station.
In addition to surveying MBTA station parking, the Boston Region MPO also surveys bicycle parking at every MBTA station. A summary of the results of the bicycle parking survey is in Section 7.4. There is also a separate detailed memorandum that analyzes the bicycle parking capacity and utilization for the MBTA network that will be posted to the Boston Region MPO website in the near future.
While the Boston Region MPO was surveying stations for automobile and bicycle access, the MPO was able to collect vehicle license plate data for many of the stations that were surveyed. The MPO is exploring the possibility of using these data to conduct an origin-destination analysis for the surveyed parking lots. This origin-destination analysis will be useful for the CMP and the travel demand modeling because it provides the travel patterns of commuters. These data can also inform planners and engineers of problem areas on the roadway network leading to transit stations.
Appendix A: Parking Utilization: Comprehensive Results of 2017–18 Inventory
Appendix B: Maps of Park-and-Ride Lots and Bicycle Parking
Appendix C: Park-and-Ride Lot Survey Form 2017–18
Appendix D: Amenities: Comprehensive Results of Inventory
Appendix E: MBTA Fare Increase: State Fiscal Year 2017
The Boston Region Metropolitan Planning Organization (MPO) operates its programs, services, and activities in compliance with federal nondiscrimination laws including Title VI of the Civil Rights Act of 1964 (Title VI), the Civil Rights Restoration Act of 1987, and related statutes and regulations. Title VI prohibits discrimination in federally assisted programs and requires that no person in the United States of America shall, on the grounds of race, color, or national origin (including limited English proficiency), be excluded from participation in, denied the benefits of, or be otherwise subjected to discrimination under any program or activity that receives federal assistance. Related federal nondiscrimination laws administered by the Federal Highway Administration, Federal Transit Administration, or both, prohibit discrimination on the basis of age, sex, and disability. The Boston Region MPO considers these protected populations in its Title VI Programs, consistent with federal interpretation and administration. In addition, the Boston Region MPO provides meaningful access to its programs, services, and activities to individuals with limited English proficiency, in compliance with U.S. Department of Transportation policy and guidance on federal Executive Order 13166. The Boston Region MPO also complies with the Massachusetts Public Accommodation Law, M.G.L. c 272 sections 92a, 98, 98a, which prohibits making any distinction, discrimination, or restriction in admission to, or treatment in a place of public accommodation based on race, color, religious creed, national origin, sex, sexual orientation, disability, or ancestry. Likewise, the Boston Region MPO complies with the Governor's Executive Order 526, section 4, which requires that all programs, activities, and services provided, performed, licensed, chartered, funded, regulated, or contracted for by the state shall be conducted without unlawful discrimination based on race, color, age, gender, ethnicity, sexual orientation, gender identity or expression, religion, creed, ancestry, national origin, disability, veteran's status (including Vietnam-era veterans), or background. A complaint form and additional information can be obtained by contacting the MPO or at http://www.bostonmpo.org/mpo_non_discrimination. To request this information in a different language or in an accessible format, please contact Title VI Specialist |
1 Please note that some of the stations that were surveyed are located outside of the Boston Region MPO area.
2 Accessible parking spaces are defined in this memorandum as parking spaces that are specifically designated to provide people with disabilities better access to MBTA facilities by automobile. Refer to Section 7.2 for more information.
3 The last peak-period commuter rail train typically begins its inbound trip before 9:00 AM and arrives at either North Station or South Station by 9:50 AM. The last peak-period rapid transit, bus or ferry vehicle typically begins its inbound trip before 9:00 AM.
4 Boston Region MPO memorandum titled 2012–13 Inventory of Park-and-Ride Lots at MBTA Facilities, available online at https://www.ctps.org/data/pdf/programs/cmp/Park_and_Ride.pdf (accessed March 23, 2020).
5 If unusual circumstances occurred during the day of observation, such as delays in MBTA service, inclement weather, construction, major events, holidays, and traffic incidents, the survey of that parking lot was conducted on a different day.
6 All public and private lots near MBTA stations were included in the analysis of this memorandum; the parking capacities of the MBTA stations that are listed in this memorandum may differ from the capacities that are displayed on the MBTA’s website.
7 Some MBTA stations also serve independent transportation entities, such as Logan Express or Amtrak. These stations sometimes have designated overnight parking lots for those services. These lots were excluded from the inventories reflected in this memorandum.
8 MBTA, “MBTA Parking Prices Update,” Available online at
https://www.mbta.com/projects/parking-prices-update (accessed March 24, 2020).
9 On September 1, 2018, the MBTA changed the parking fees for several of the MBTA operated parking lots to consummate with demand. The prices of these lots either increased, decreased or stayed the same after this date.
10 On September 1, 2018, the MBTA changed the parking fees for several of the MBTA operated parking lots to consummate with demand. The prices of these lots either increased, decreased or stayed the same after this date.
11 Jonathan Belcher, Central Transportation Planning Staff, “Changes to Transit Service in the MBTA District: 1964-2020,” http://www.transithistory.org/roster/MBTARouteHistory.pdf (accessed on March 24, 2020).
12 Commonwealth of Massachusetts, “2018 Data Report—Rideshare in Massachusetts,” available online at https://tnc.sites.digital.mass.gov/ (accessed March 24, 2020).
13 Mass Transit Magazine, “It’s time for transit agencies to (actually) double down on rider focus,” available online at https://www.masstransitmag.com/technology/passenger-info/article/21085554/its-time-for-transit-agencies-to-actually-double-down-on-rider-focus (accessed March 24, 2020).
14 Adam Vaccaro, Boston Globe, “MBTA Subway Ridership is Dropping…except on the Blue Line” https://www.bostonglobe.com/metro/2018/11/28/mbta-subway-ridership-dropping-except-blue-line/qXThqCoRCCeuAkhXl0El1L/story.html (accessed on March 24, 2020).
15 Federal Transit Administration, “Massachusetts Bay Transportation Authority 2018 Annual Agency Profile,” available online at https://www.transit.dot.gov/ntd/transit-agency-profiles/massachusetts-bay-transportation-authority (accessed March 24, 2020).
16 Federal Transit Administration, “Massachusetts Bay Transportation Authority 2013 Annual Agency Profile,” available online at https://www.transit.dot.gov/ntd/transit-agency-profiles/massachusetts-bay-transportation-authority (accessed March 24, 2020).
17 Ben Berke, Enterprise News, “Report: high commuter rail fares holding back growth in Brockton,” available online at https://www.enterprisenews.com/news/20190911/report-high-commuter-rail-fares-holding-back-growth-in-brockton (accessed March 24, 2020).
18 Since the 2012–13 inventory was collected, 42 parking spaces were converted to permit-only spaces at Reading Station, 26 spaces were converted to permit-only spaces at West Medford, and 74 spaces were converted to permit-only spaces at Stoughton Station.
19 Some stations with parking serve both commuter rail and rapid transit. To avoid confusion, these stations are all categorized as rapid transit in this inventory.
20 The parking lot near Haverhill Station was under construction at the time of the observation.
21 Parking lots near Beverly Farms and Rockport stations were under construction at the time of the observation.
22 Readville Station is served by both the Fairmount Line and the Franklin Line. To avoid confusion, Readville data were counted as Fairmount Line data for all of the quantitative analyses for this memorandum.
23 These totals exclude Readville Station (see the previous footnote).
24 The parking lot near Nantasket Junction was under construction at the time of the observation.
25 One parking lot near Plymouth Station was under construction at the time of the observation.
26 There were 533 overnight parking spaces at the Route 128 MBTA station that were previously excluded from inventories included in the current inventory for the first time.
27 Some of the lots near the Mansfield Station were under construction at the time of the observation.
28 One of the parking lots near Forest Hills Station was under construction at the time of observation.
29 Section 2B of the Alewife parking garage was under construction at the time of the observation.
30 Hiral Gandhi, Boston Region Metropolitan Planning Organization titled “2012 Inventory of Bicycle Parking Spaces and Number of Parked Bicycles at MBTA Stations,” available online at https://www.ctps.org/data/pdf/programs/cmp/Inventory_of_Bicycle_Parking.pdf (accessed March 25, 2020).