
Technical Memorandum
DATE: January 4, 2021
TO: Boston Region MPO Board
FROM: Emily Domanico, Central Transportation Planning Staff (CTPS)
RE: Staff Generated Research: Using United States (US) Census Data as a Proxy for Transit Rider Survey Data
This document summarizes the methodology and results of the Staff Generated Research Project: Using US Census Data as a Proxy for Transit Rider Survey Data. This project investigated the relationship between the demographic characteristics of transit riders and the characteristics of all residents in walking distance to the bus stops (used by those transit riders). CTPS developed an interactive application to investigate this relationship using demographic data from the 2015–17 Massachusetts Bay Transportation Authority (MBTA) systemwide passenger survey and the US Census American Community Survey (ACS) 2013–17 five-year estimates. The interactive application can be accessed at https://ctps.shinyapps.io/SurveyToCensus/. CTPS found that the available survey data was not sufficient to distinguish between transit riders and nontransit riders, which is a necessary distinction to reliably compare demographic characteristics between the two populations.
Transit agencies and other analysts rely on transit rider demographic data to conduct service equity analyses. These data are collected through rider surveys. However, there are times when rider demographic data are not available from a survey, such as when a new service is proposed or an existing service has been significantly altered. In these cases, analysts rely on census demographic data for the residents of the service area to represent potential transit riders. However, census demographics of the residents near transit service are not necessarily representative of actual transit riders. This study sought to relate the two sources of data to allow planners to estimate the demographics of likely bus transit riders based on census data. CTPS determined that in order to reliably link the datasets, staff need more comprehensive sampling of both riders and nonriders along bus routes.
To investigate the relationship between the bus rider demographics and residents of the service area, staff used data on the demographic characteristics of transit riders from the 2015–17 MBTA systemwide passenger survey and analogous demographic information about residents within walking distance of bus stops from the ACS 2013–17 five-year estimates. Spatial data for key bus routes and stops were built from the fall 2017 MBTA General Transit Feed Specification (GTFS) rating to best match bus stop names on the boarding location reported in the survey responses. This section describes these data sources, the source limitations, and how these data shaped and limited the analysis.
CTPS used the responses to the following questions from the MBTA systemwide passenger survey conducted from 2015–17 for the demographic information of transit riders. The survey included the following questions:
Figure 1 shows the “About Me” portion of the passenger survey with response choices as presented. When demographic information was not provided on a survey response, it was reported as “Unknown.” When demographic data was “Unknown” or “Prefer not to say,” staff kept both options as distinct percentages in the demographic summaries.
Figure 1
Demographics Questions from Ridership Survey
Source: Central Transportation Planning Staff, MBTA 2015–17 Systemwide Passenger Survey (2018), p. 41. https://www.ctps.org/apps/mbtasurvey2018/2015_2017_Passenger_Survey_Final_Report.pdf.
Ideally, the ridership survey data would be used to randomly sample any bus stop from the MBTA and compile a stop-level demographic summary of use. However, the ridership survey sampling plan did not target individual bus stops due to the extraordinary costs of trying to obtain results at a finer level, with no guarantee of actually obtaining the required responses. The following section outlines what survey responses were included in the analysis and how the responses are grouped into stop groups.
Several factors limited the use of the MBTA survey data and shaped the way the analysis was structured.
In order to associate survey responses with bus stops, CTPS relied on the boarding stop locations reported in the first MBTA service question from the Ridership Survey (Figure 2). This detail was important, as it provided the geographic connection between the demographic data and where the passenger boarded the bus along the bus route. However, not all survey responses included a boarding location. If a boarding location was recorded, in order to assign survey responses at a sub-route level, the text provided in the survey response had to be an exact match to the stop name present in the MBTA’s Stop Data file. Staff limited the analysis to key bus routes after determining that survey responses on key bus routes had more reliable and accurate stop name reporting.
Figure 2
First MBTA Service Questions from Ridership Survey
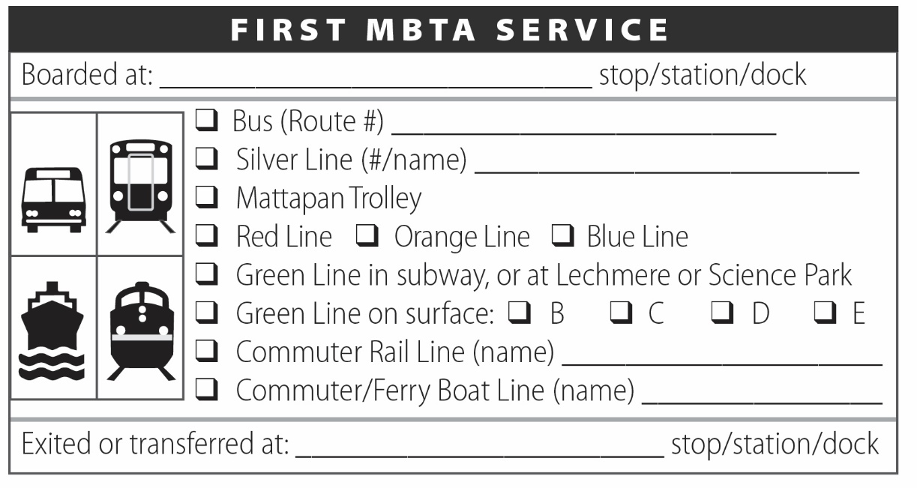
MBTA = Massachusetts Bay Transportation Authority.
Source: Central Transportation Planning Staff, MBTA 2015–17 Systemwide Passenger Survey (2018), p. 33 https://www.ctps.org/apps/mbtasurvey2018/2015_2017_Passenger_Survey_Final_Report.pdf.
The purpose of this project was to determine if census demographic data, which is home-based, could be used as a proxy for survey demographic data. Because of this, staff was limited to using surveys from bus trips that included home-based travel where the bus was the first leg of the trip. This detail was reported on the survey response questions shown in Figure 3. This enabled staff to compare demographic characteristics for people who resided in the area to those in the area who used bus transit.
Figure 3
Trip Activity Question from Ridership Survey

Source: Central Transportation Planning Staff, MBTA 2015–17 Systemwide Passenger Survey (2018), p. 27. https://www.ctps.org/apps/mbtasurvey2018/2015_2017_Passenger_Survey_Final_Report.pdf.
The constraints and limitations of the survey data noted above provided too few responses associated with individual stops to support a stop-level analysis. An analysis at the route level would not adequately address the goal of the project, as bus routes often travel through many neighborhoods with differing demographics. As a result, staff constructed stop groups as a way to analyze survey responses at a sub-route level. Stop groups were made by pooling together stops from the same route, direction, and variation on a five stop-rolling basis. This meant that survey responses linked to the first five stops in one direction along a route became group A, and responses linked to the second to sixth stops became group B, until the last stop on the route was part of a stop group. All groups had five stops assigned to them. A single survey response could be associated with many stop groups, depending on where the stop was located on each route, and the number of routes that served the stop.
Staff chose to use five stops for the stop grouping as a balance between reasonable walkability and the potential to obtain a sufficient number of survey responses. Staff recognize that this grouping methodology may ignore instances where there are geographic barriers (bridges, large streets, gaps in pedestrian infrastructure) within a stop group. Stops were grouped on a rolling basis to mitigate the impact of the artificial boundaries established by the stop groupings. If five-stop stop groups were not rolling (Stop 1 to Stop 5 are stop group A, Stop 6 to Stop 10 are stop group B), then the grouping strategy introduces divisions between groups that are more a result of the analysis process than a measure of actual access to stops on the ground. Staff wanted to work with the assumption that a transit rider at Stop 5 would have as much access to Stop 6 as they would to Stop 4.
In total, 3,228 home-based trips were found on key bus routes. Seventy percent (or 2,261) of those survey responses reported a boarding location. Of these, 84 survey responses could not be joined to MBTA bus stops, as the boarding details provided was unclear. Demographics from survey responses that were successfully linked to MBTA bus stops were grouped on a five-stop rolling basis to form 2,251 total stop groups, as the stop groups were designed so that one survey response could be associated to many stop groups.
The US Census ACS 2013–17 five-year estimates were used at the block group level for demographic information of residents in the service area. Staff selected demographic variables that best matched survey demographic categories as a basis of comparison between the datasets, as described below.
In order to relate each bus stop group to the surrounding census geography, a buffer of the same radius was applied to each stop in a given stop group creating a circular shape surrounding the stop point location. The buffers were then merged for stops in the same group. Block groups that intersected the merged buffer were grouped together to identify the census geography associated with that bus stop group. The demographic characteristics for the grouped census blocks were then summarized as percentages of the population along with a margin of error.
Each stop group was analyzed at buffer distances of one-quarter mile, one-half mile, three-quarter mile, and one mile distances. Figure 4 shows an example of the spatial relationship between a stop group for Route 117 when a half-mile buffer is selected, and the block groups that intersect that buffer (in dark gray).
Figure 4
Stop Group Buffer and Intersecting Census Block Groups Example
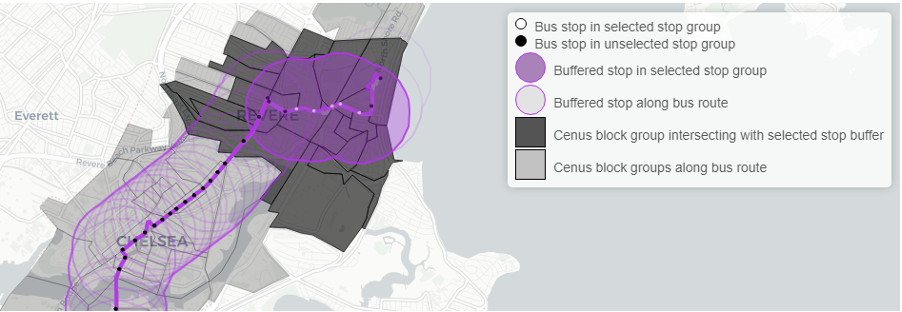
Note: Spatial relationship between grouped stops (white) from Route 117, inbound, with a half-mile merged buffer (purple) and the intersecting block groups (dark gray).
Sources: Bus route and stop location data from MBTA, General Transit Feed Specification, (fall 2017). https://cdn.mbtace.com/archive/20171130.zip. U.S. Census Bureau, 2017 Block Groups, Cartographic Boundaries. https://www.census.gov/geographies/mapping-files/time-series/geo/carto-boundary-file.2017.html.
The analysis of the survey demographic data and the census demographic data identified several concerns about the sufficiency of the survey responses that limited confidence in using census data from a sub-route service area to predict the demographics of bus riders.
While investigating the stop groups created to analyze demographics at a sub-route level, staff realized that the grouping strategy could not account for the lack of data for routes that had long stretches of stops with no survey response matches. For example, Figure 5 shows the number of survey responses in each five-stop group for all key routes, specifically Route 15. Route 15 had a large number of stop groups for which we could not assign survey responses. This could be due to uneven response rate on the ridership survey, low ridership along Route 15, or it could be a reflection of the challenge in assigning survey responses to MBTA stops. These gaps are likely a reflection of the ridership survey’s focus on route-level data for bus routes.
Figure 5
Distribution of Frequency of Survey Responses in Individual Stop Groups
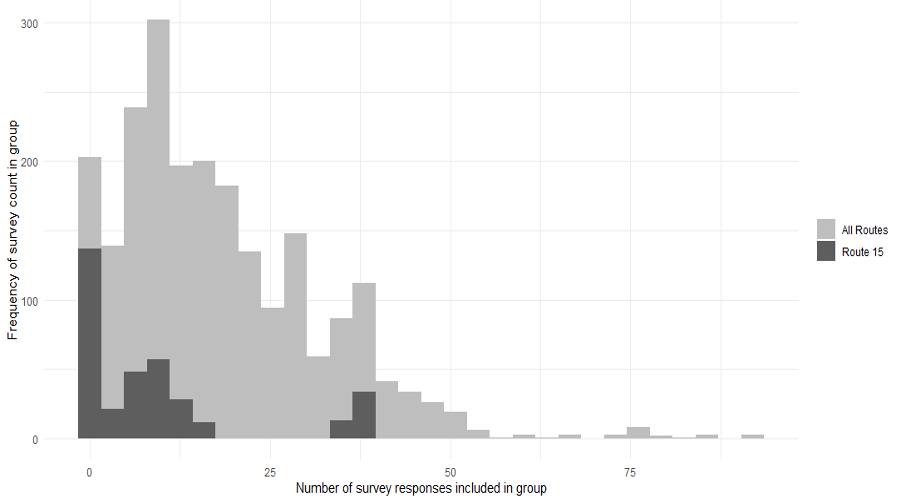
Source: Central Transportation Planning Staff, MBTA 2015–17 Systemwide Passenger Survey (2018).
While the ridership survey can support comparative analysis between transit riders throughout the system, it is a biased dataset of the total population living in the service area because the survey was only distributed to and completed by transit riders. In order to try to predict the portion of residents in the service area that could be transit riders, demographic information would be needed for nontransit riders. Without these data on non-riders, the skewed survey demographic inputs could not reliably train a model to predict how many members of a population are transit riders.
An imbalanced dataset is one where the distribution of examples across the known classes is skewed to one population over another. In terms of this study, it is assumed that people living in an area surrounding transit will either be a transit rider or a nontransit rider. The ridership survey only supplies demographic data on transit riders, which means that our dataset does not represent both potential classes evenly.
It is important to note that while the transit survey responses are an imbalanced dataset relative to all residents of the service area, the ridership survey is still a careful and interesting survey on transit riders. The MBTA systemwide ridership survey was designed to fulfill the Federal Transit Administration requirement to survey transit riders and therefore, was not designed to survey the entire population of the service area.
While the ridership survey is a valuable data source for demographic information on transit ridership, it may still contain biases that prevent a comparison between riders and the population in the MBTA service area. Supplementing future ridership surveys by collecting demographics on nontransit riders could help identify some of these potential biases, such as a non-response bias. A non-response or a participation bias occurs when there are systematic differences between survey responders and non-responders.
Figure 6 provides an example of the results when comparing the gender/sex population proportions from survey responses from riders boarding in stop groups, and the intersecting census block groups for all stop groups in Route 57. While the census demographics are around 50 percent male for all block groups surrounding Route 57, survey responses show a higher percentage of women as bus riders. This pattern is consistent across many other key routes throughout the system suggesting that 1) a higher proportion of women ride the bus; 2) there is a higher response rate from women than men; or 3) a combination of 1 and 2. Adding nontransit riders to the survey will help identify potential non-response bias by providing a reference point to compare demographics of transit riders versus nontransit riders with the entire population.
Figure 6
Percent of Population Comparison between Survey and Census for Gender/Sex on Route 57
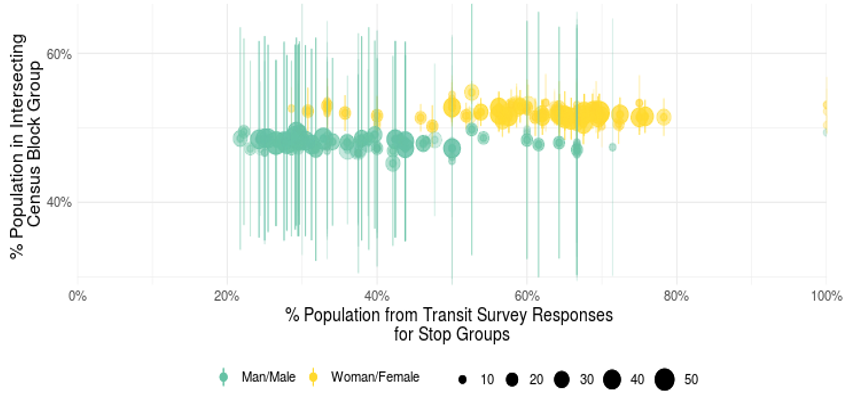
Note: Vertical lines represent the margin of error from census population estimates. The size of the circle corresponds to the number of survey responses in the stop group.
Sources: Central Transportation Planning Staff, MBTA 2015–17 Systemwide Passenger Survey (2018.
U.S. Census Bureau, American Community Survey, 2013–17 five-year estimates, Table B01001.
The Survey to Census application (https://ctps.shinyapps.io/SurveyToCensus/) is an interactive tool that summarizes and presents data prepared for this project. The application is designed to let a user interact with the census demographic summaries and related survey responses using the stop grouping and buffering methods previously described. Users can select a key bus route, the route variation and direction, and a buffer distance to display the survey and census demographic summaries for selection. Figure 7 shows an example display of the demographic summaries from survey and census data for a stop group on Route 39 with a one-quarter mile buffer.
Figure 7
Display from the Survey to Census Application
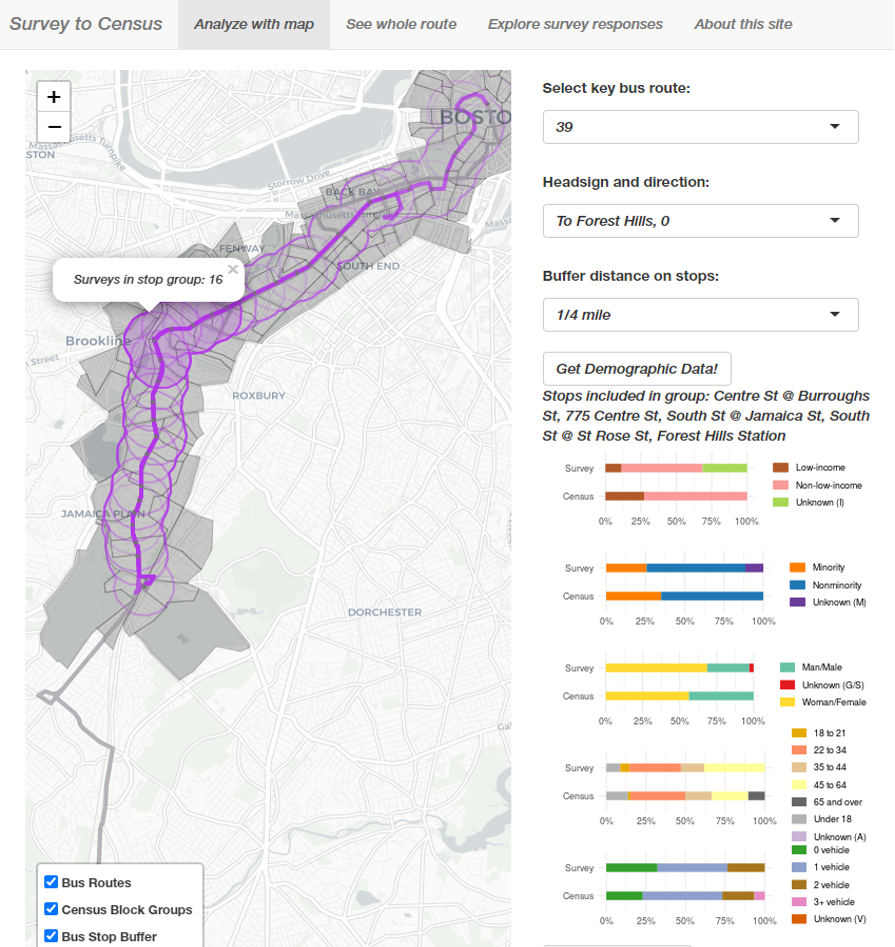
Note: An example display from the Survey to Census Application showing a comparison between survey and census demographics for a stop group on Route 39.
Source: https://ctps.shinyapps.io/SurveyToCensus/.
In order to pursue a model that would estimate transit rider demographics based on census data, a future survey would need to be designed for both riders and non-riders for that purpose. Because it would be cost prohibitive to obtain the number of responses required to support a stop level or even stop-group level analysis systemwide, staff could instead focus on increasing the number of responses from riders on one or two representative routes. To account for the inherent bias to the survey methodology, nontransit riders would be surveyed from the service area of these routes. It may be possible to more accurately train a model with demographic data from a small number of nontransit rider survey responses. The number of responses from nontransit riders necessary to train a model could be proportionally smaller than the number of rider responses, although the exact number should be determined based on the sample size necessary for the survey design. An additional consideration is that nontransit rider responses would need to be associated with a specific service area to be analyzed by the model.
Future work could also involve improvements to the design and user experience of the Survey to Census Application. Potential improvements to the application would be
If a ridership prediction model is attainable following a future rider and non-rider survey, the application could present ridership predictions based on proposed service changes to assist in transportation planning and service equity analysis.
The Boston Region Metropolitan Planning Organization (MPO) operates its programs, services, and activities in compliance with federal nondiscrimination laws including Title VI of the Civil Rights Act of 1964 (Title VI), the Civil Rights Restoration Act of 1987, and related statutes and regulations. Title VI prohibits discrimination in federally assisted programs and requires that no person in the United States of America shall, on the grounds of race, color, or national origin (including limited English proficiency), be excluded from participation in, denied the benefits of, or be otherwise subjected to discrimination under any program or activity that receives federal assistance. Related federal nondiscrimination laws administered by the Federal Highway Administration, Federal Transit Administration, or both, prohibit discrimination on the basis of age, sex, and disability. The Boston Region MPO considers these protected populations in its Title VI Programs, consistent with federal interpretation and administration. In addition, the Boston Region MPO provides meaningful access to its programs, services, and activities to individuals with limited English proficiency, in compliance with U.S. Department of Transportation policy and guidance on federal Executive Order 13166.
The Boston Region MPO also complies with the Massachusetts Public Accommodation Law, M.G.L. c 272 sections 92a, 98, 98a, which prohibits making any distinction, discrimination, or restriction in admission to, or treatment in a place of public accommodation based on race, color, religious creed, national origin, sex, sexual orientation, disability, or ancestry. Likewise, the Boston Region MPO complies with the Governor's Executive Order 526, section 4, which requires that all programs, activities, and services provided, performed, licensed, chartered, funded, regulated, or contracted for by the state shall be conducted without unlawful discrimination based on race, color, age, gender, ethnicity, sexual orientation, gender identity or expression, religion, creed, ancestry, national origin, disability, veteran's status (including Vietnam-era veterans), or background.
A complaint form and additional information can be obtained by contacting the MPO or at http://www.bostonmpo.org/mpo_non_discrimination. To request this information in a different language or in an accessible format, please contact
Title VI Specialist
Boston Region MPO
10 Park Plaza, Suite 2150
Boston, MA 02116
civilrights@ctps.org
857.702.3700 (voice)
617.570.9193 (TTY)