
Technical memorandum
DATE: June 25, 2020
TO: Boston Region Metropolitan Planning Organization (MPO)
FROM: Kate White, Transportation Planner/Public Outreach Coordinator
RE: Public Engagement for the Transportation Improvement Program (TIP) Project Evaluation Criteria Revisions
This memorandum describes the outreach that the Boston Region Metropolitan Planning Organization (MPO) staff conducted with members of the public and advocacy groups regarding revisions to the Transportation Improvement Program (TIP) criteria in response to the endorsement of the Long-Range Transportation Plan (LRTP), Destination 2040. It discusses the approaches staff used to engage people across the region and summarizes input and feedback by MPO goal area. The memorandum also provides next steps for further outreach after the first draft TIP criteria are completed.
To better understand transportation priorities of the Boston region and help shape proposals for TIP criteria changes, staff set out to conduct a combination of in-person and online public outreach. Over the course of the fall of 2019, MPO staff hosted seven focus groups with advocacy and civic engagement organizations and released an online survey. Both the online survey and focus groups included one main question that asked participants to choose their top priorities out of a list of 15. The list of 15 priorities consisted of current TIP criteria goals and other priorities identified in the Long-Range Transportation Plan, Destination 2040. Online survey respondents were asked to choose both their top five and their number one priority, and then add to or comment on if there should be additional priorities. Focus group participants were asked to choose three priorities, rank them, and provide additional notes and comments. Staff worked to specifically connect with groups that primarily serve equity populations for the focus groups as well as to broadcast the survey in their social networks and email lists. This outreach effort resulted in 93 participants in the focus groups and 462 online survey responses from across the Boston Region.
The goals of revising the TIP criteria are to
In the survey and the focus groups, the 15 priorities included were tied to MPO goal areas. Table 1 shows the results of the online survey and Figure 1 shows the results of the focus groups.
Table 1
Online Survey Results: Top Five Priorities for Transportation
| Rank |
Priority |
Number of Times Selected |
Percentage of Times Selected |
MPO Goal Area |
|---|---|---|---|---|
1 |
Improving pedestrian safety |
261 |
56.49% |
Safety |
2 |
Promoting more equitable transportation mobility |
248 |
53.68% |
Transportation Equity |
3 |
Reducing emissions and pollution |
238 |
51.52% |
Clean Air/Sustainable Communities |
4 |
Improving bicycle safety |
227 |
49.13% |
Safety |
5 |
Reducing congestion |
198 |
42.86% |
Capacity Management and Mobility |
6 |
Creating new connections in the bicycle network |
181 |
39.18% |
Capacity Management and Mobility |
7 |
Prioritizing buses with dedicated bus lanes |
178 |
38.53% |
Capacity Management and Mobility |
8 |
Maintaining the existing transit system |
175 |
37.88% |
System Preservation and Modernization |
9 |
Promoting more economic development by increasing access to jobs and services |
116 |
25.11% |
Economic Vitality |
10 |
Maintaining and improving existing roads and bridges |
112 |
24.24% |
System Preservation and Modernization |
11 |
Enhancing climate resiliency and the ability to respond to emergencies |
98 |
21.21% |
System Preservation and Modernization |
12 |
Maintaining and improving existing sidewalks |
87 |
18.83% |
System Preservation and Modernization |
13 |
Limiting the environmental impact of projects, including impacts on water quality, natural resources, and open space |
86 |
18.61% |
Clean Air/Sustainable Communities |
14 |
Improving auto safety |
34 |
7.36% |
Safety |
15 |
Improving safety and mobility for trucks |
8 |
1.73% |
Capacity Management and Mobility |
Figure 1
Focus Groups Priorities
Respondents primarily selected larger thematic priorities, with “improving pedestrian safety” being the most selected in the online survey and the second most selected in the focus groups. “Promoting more equitable mobility” was the most selected during the focus groups and the second most selected in the online survey. “Maintaining the existing transit system” and “prioritizing buses with dedicated bus lanes” were among the most selected priorities in the focus groups, however, in the online survey, “maintaining the existing transit system” was the most selected top priority. More respondents in the online survey selected “reducing emissions and pollution,” but in the comments many respondents advocated for investment in transit, pedestrian, and bicycle infrastructure to support reducing emissions, enhancing climate resiliency and promoting equity. Many reiterated the Boston region’s congestion issues but advocated for expanding bicycle network connectivity, improving access to transit stations, enhancing connectivity to jobs and services, and improving safety for all modes as ways to combat congestion. Many respondents urged the MPO to prioritize investments in areas that have been historically and currently underserved and improve transit in low-income and minority communities. They also argued for weighing more heavily the negative impacts of projects that harm low-income and minority populations and adding more criteria to address air pollution.
This memo describes the results by MPO goal areas:
Participants advocated for dramatically reducing emissions and pollution and recommended improving pedestrian and bicycle safety, increasing pedestrian and bike connectivity, and promoting equitable transportation mobility to achieve this goal. Respondents also argued for stronger assessments on air pollution and for addressing the disproportionate health effects on low-income and minority communities living near high emission roadways. They also argued for projects that reduce the number of personal vehicles on the road and for enhancing tree canopy coverage and green space. For additional Clean Air/Sustainable Communities priorities, participants advocated for smart growth, transit-oriented development, supporting active transportation, and prioritizing non-car modes.
Participants primarily focused on improving pedestrian and bike safety through expanding pedestrian and bike infrastructure, bringing sidewalks up to Americans with Disabilities Act (ADA) accessibility standards, increasing connectivity to transit, and reducing auto speeds to prevent accidents. Participants shared their support for maintaining and expanding the transit system to increase mode shift away from single-occupancy vehicles and to increase bike and pedestrian safety. Many argued for separated bike facilities to make it easier and safer for anyone to bike and not just the experienced bicyclist. They advocated for shifting of spending to focus on Vision Zero projects, improving dangerous crossings, installing light-up crosswalks, and fixing poorly timed lights and poorly painted crosswalks. They also promoted safe and convenient walkable routes to access jobs, services, and schools. Many advocated for prioritizing areas that primarily serve equity populations, fixing broken sidewalks, and reducing conflicts between pedestrians crossing the street and turning vehicles.
Participants were asked about maintaining and improving existing sidewalks, roads, and bridges. Many focused more on improving overall safety rather than on the maintenance and improvement of specific elements of the roadway. However, when asked about maintaining the existing transit system, many picked it as their top priority. Participants advocated for making the transit system reliable, functional, clean, safe, and dependable to increase ridership and reduce congestion. They advocated for transit expansion and prioritizing dedicated bus lanes. They supported investing in maintenance of the transit system and argued for equitable transportation mobility. Creating connections to jobs and services through transit options was also identified as important as was implementing more multimodal infrastructure.
Many participants advocated for creating new connections in the bike network and argued for enhanced connections to the transit system. Participants argued for more separated shared use paths to increase bike usage. They saw increased bike infrastructure as a tool to reduce emissions, reduce congestion, and promote public health by enhancing exercise and recreation options. Many respondents highlighted the idea of implementing more dedicated bus lanes as a way to increase reliability, enhance access to jobs and services, increase equity in the transit system, and reduce emissions. Participants argued that dedicated bus lanes have a high impact for less investment, and can be more flexible to meet community needs. Bus frequency and reliability can increase ridership and reduce the number of single-occupancy vehicles on the road. Bus lanes can also be combined with bike lanes, which increase mobility options for residents. To reduce congestion, participants argued for more parking at commuter rail stations, enhancing walking options to commuter rail stations, and increasing safety for walking and biking. They advocated for prioritizing person throughput rather than vehicle throughput. To reduce congestion and conflicts with pedestrians and bicyclists, participants argued for implementing curb allocation policies for trucks and delivery vehicles.
Transportation equity was one of the most selected priorities in both the online survey and focus groups. To promote more equitable transportation mobility, participants argued for many of the other priorities with a focus on directing resources to those most overburdened by transportation emissions and underserved by a lack of adequate transportation options. They argued for enhancing transportation opportunities to jobs, food, education, services, and civic engagement opportunities. They advocated for safer connections to transit options and increased transit reliability. Expanding and fixing sidewalk infrastructure was also frequently mentioned. Many argued for prioritizing projects near affordable housing, supporting transit-oriented development, and incorporating more public health criteria.
To increase economic vitality, participants argued for more transportation access to jobs, services, and small businesses with increased transit, bicycle, and pedestrian infrastructure. Expanding the transit system was frequently mentioned as well as incorporating greater consideration for affordable housing and inclusionary zoning. Participants also advocated for supporting projects that serve multiple municipalities and maximize mobility for all using the most efficient means possible. They also argued for climate resiliency and safety to enhance access to jobs and services.
Staff analyzed demographic information recorded in the online survey to better understand who was responding and to identify gaps in outreach. By mapping respondents by zip code, staff plan to do additional outreach to organizations and groups in zip codes that had low response rates as well as areas that have higher numbers of residents belonging to equity populations. The MPO defines equity populations as low-income populations, minority populations, youth, elderly, people with disabilities, and people with limited English proficiency.
After the first round of criteria outreach, staff plan to produce draft criteria to discuss at MPO meetings. Before the COVID-19 pandemic, staff planned to go back to the organizations and advocacy groups that staff worked with in the first round to share the new criteria and to hear feedback on the changes. Due to the COVID-19 pandemic, staff plan to host virtual focus groups with these organizations and additional virtual engagement opportunities open to the public. Staff also plan to release another online public survey to gauge feedback on the new draft criteria.
On August 15, 2019, the MPO board discussed revising the TIP project evaluation criteria to
Some of the feedback that the MPO had heard also included concerns that current TIP criteria favored certain investment programs, and respondents wanted to more heavily weight negative scores, add health metrics, and reduce the emphasis on auto-centric elements of transportation projects. Input also included a wish to reconsider using the equivalent property damage only (EPDO) index for safety and to use access to jobs and non-work necessities as an economic vitality measure. The MPO board agreed to move forward with a complete re-imagination of the TIP criteria, which consists of distinct criteria for each LRTP investment program, significant updates to existing criteria, and changes to scoring weights. The new TIP criteria will be implemented in the FFYs 2022–26 TIP development.
MPO staff developed an outreach plan for the first phase of the public outreach on TIP criteria. This plan included in-person focus groups and an online survey to gather feedback on priorities for MPO transportation project investments. The second round of public input will take place in the summer of 2020, when staff plan to conduct another online survey, host virtual outreach events, and return to stakeholder groups that were part of the first focus groups through virtual meetings to share the draft criteria and elicit feedback. Outreach will take place virtually due to the COVID-19 pandemic and Governor Baker’s Stay at Home Order.
For the first-phase focus groups and online survey, participants were asked to select their top priorities from a list of 15 that were created based on highlights of the current TIP criteria and priorities endorsed in the LRTP. The online survey was released on October 12, 2019, and closed December 17, 2019. In accordance with the MPO’s Language Assistance Plan, the survey was translated into the six most frequently spoken languages in the Boston region. It consisted of three questions about transportation priorities. The remaining questions asked for demographic information. The survey questions are listed in Appendix A.
The survey was provided online via SurveyMonkey and distributed through a variety of channels, including the MPOInfo and Transportation Equity email lists, the Boston Region MPO Twitter account, the MAPC Matters newsletter, the social media channels of various transportation advocacy groups, and the Metropolitan Area Planning Council’s (MAPC) subregional listservs. Staff also emailed the survey directly to stakeholder groups that have interacted with the MPO on a variety of levels, and promoted the survey at outreach events and MAPC subregional meetings.
In the focus groups, staff introduced participants to the MPO and the six investment programs that determine what kinds of projects are funded by the MPO. Not all participants of the focus groups were familiar with the Boston Region MPO, therefore, staff provided all participants with background information and context. Using this framework, participants were asked to pick their top three priorities out of the same 15 provided in the online survey, and identify them in order, by placing Post-its labeled 1, 2, and 3 on a large printed table of the 15 priorities. Participants could provide additional comments about priorities by writing directly on the printed table. A picture of the table is included in Appendix B. Not all participants used all three ranks and some chose as a group to add more top priorities.
Staff planned eight focus groups and hosted seven, two with Spanish interpreters. Staff specifically reached out to organizations that serve and/or are comprised of primarily equity populations. Focus groups meetings were between 25 and 60 minutes long and took place between September 4, 2019, and December 11, 2019. Table 2 lists all the planned focus groups and the estimated number of participants. Staff hosted a focus group with NorthShore Community Development Corporation (CDC), which had to be rescheduled due to a conflict with NorthShore CDC’s space. The rescheduled date was December 11, 2020, and there were no attendees.
Table 2
TIP Criteria Focus Groups, Fall 2019
| Meeting |
Date |
Organization |
Location |
Estimated Number of Participants |
|---|---|---|---|---|
Union Capital Boston Grove Hall Monthly Meeting |
9.4.19 |
Union Capital Boston |
ABDC Roxbury, 565 Warren Street, Boston |
15 |
Union Capital Boston Maverick Square Monthly Meeting |
9.9.19 |
Union Capital Boston |
East Boston Social Center, 68 Central Square, East Boston |
12 |
Blue Hills Regional Coordinating Council Bi-Monthly Meeting |
9.11.19 |
Blue Hills Regional Coordinating Council |
South Shore YMCA, 79 Coddington Street, Quincy |
25 |
Boston Core Regional Coordinating Council Quarterly Meeting |
9.23.19 |
Boston Core Regional Coordinating Council |
UMass Boston Institute for Community Inclusion, 150 Mount Vernon Street, Boston |
6 |
Livable Streets Alliance Advocacy Committee Meeting |
10.23.10 |
Livable Streets Alliance |
Livable Streets Alliance, 100 Sidney Street, Cambridge |
15 |
Union Capital Boston Jackson Square Monthly Meeting |
11.7.19 |
Union Capital Boston |
Union Capital Boston, 1544 Columbus Avenue, Boston |
6 |
Transit Matters Advisory Board Meeting |
12.3.19 |
Transit Matters |
Conservation Law Foundation, 62 Summer Street, Boston |
14 |
Rescheduled North Shore Community Development Corporation MPO Focus Group |
12.11.19 |
North Shore Community Development Corporation |
Espacio, 105 Congress Street, Salem |
0 |
Total |
|
|
|
93 |
Additional surveys were distributed to the Regional Transportation Advisory Council (Advisory Council), TIP contacts, and MPO members for different purposes. The Advisory Council survey was created for members to rank all 15 priorities, the TIP contact survey was designed to elicit input on the project evaluation process, and the MPO board survey elicited feedback on priorities in the same way as the public survey. The Advisory Council feedback revealed similar results as the public online survey with “improving pedestrian safety” being the most selected priority, but respondents selected “creating new connections in the bike network” at the second highest rate. Equitable transportation mobility and reducing emissions and congestion were also highly rated. MPO staff discussed MPO board members feedback at MPO meetings.
MPO Staff received 462 survey responses for the online public survey. Of the responses, 461 were in English and one in Simplified Chinese. All respondents were required to complete the first question, which asked respondents for their top five priorities for MPO transportation projects. The results of this question are shown in Table 3.
Table 3
Online Survey Results: Top Five Priorities for Transportation
| Rank |
Priority |
Number of Times Selected |
Percentage of Times Selected |
MPO Goal Area |
|---|---|---|---|---|
1 |
Improving pedestrian safety |
261 |
56.49% |
Safety |
2 |
Promoting more equitable transportation mobility |
248 |
53.68% |
Transportation Equity |
3 |
Reducing emissions and pollution |
238 |
51.52% |
Clean Air/Sustainable Communities |
4 |
Improving bicycle safety |
227 |
49.13% |
Safety |
5 |
Reducing congestion |
198 |
42.86% |
Capacity Management and Mobility |
6 |
Creating new connections in the bicycle network |
181 |
39.18% |
Capacity Management and Mobility |
7 |
Prioritizing buses with dedicated bus lanes |
178 |
38.53% |
Capacity Management and Mobility |
8 |
Maintaining the existing transit system |
175 |
37.88% |
System Preservation and Modernization |
9 |
Promoting more economic development by increasing access to jobs and services |
116 |
25.11% |
Economic Vitality |
10 |
Maintaining and improving existing roads and bridges |
112 |
24.24% |
System Preservation and Modernization |
11 |
Enhancing climate resiliency and the ability to respond to emergencies |
98 |
21.21% |
System Preservation and Modernization |
12 |
Maintaining and improving existing sidewalks |
87 |
18.83% |
System Preservation and Modernization |
13 |
Limiting the environmental impact of projects, including impacts on water quality, natural resources, and open space |
86 |
18.61% |
Clean Air/Sustainable Communities |
14 |
Improving auto safety |
34 |
7.36% |
Safety |
15 |
Improving safety and mobility for trucks |
8 |
1.73% |
Capacity Management and Mobility |
For the second question, respondents were asked an open-ended question about their top priority. Table 4 shows the number of times people selected a listed priority as their top priority and the MPO goal area related to each priority.
Table 4
Online Survey Results: Top Priority for Transportation
| Rank |
Priority |
Number of Times Selected |
Percentage of Times Selected |
MPO Goal Area |
|---|---|---|---|---|
1 |
Maintaining the existing transit system |
62 |
14.83% |
System Preservation and Modernization |
2 |
Promoting more equitable transportation mobility |
50 |
11.96% |
Transportation Equity |
3 |
Reducing emissions and pollution |
50 |
11.96% |
Clean Air/Sustainable Communities |
4 |
Reducing congestion |
50 |
11.96% |
Capacity Management and Mobility |
5 |
Improving pedestrian safety |
42 |
10.05% |
Safety |
6 |
Prioritizing buses with dedicated bus lanes |
35 |
8.37% |
Capacity Management and Mobility |
7 |
Improving bicycle safety |
33 |
7.89% |
Safety |
8 |
Creating new connections in the bicycle network |
33 |
7.89% |
Capacity Management and Mobility |
9 |
Promoting more economic development by increasing access to jobs and services |
20 |
4.78% |
Economic Vitality |
10 |
Maintaining and improving existing roads and bridges |
12 |
2.87% |
System Preservation and Modernization |
11 |
Enhancing climate resiliency and the ability to respond to emergencies |
9 |
2.15% |
System Preservation and Modernization |
12 |
Limiting the environmental impact of projects, including impacts on water quality, natural resources, and open space |
9 |
2.15% |
Clean Air/Sustainable Communities |
13 |
Maintaining and improving existing sidewalks |
4 |
0.96% |
System Preservation and Modernization |
14 |
Improving auto safety |
3 |
0.72% |
Safety |
15 |
Improving safety and mobility for trucks |
1 |
0.24% |
Capacity Management and Mobility |
16 |
Other |
5 |
1.20% |
N/A |
Total |
|
418 |
|
|
Even though “maintaining the existing transit system” was not included in the most frequently selected top five priorities, it was the most frequently selected highest priority of the 418 respondents who answered the question. Many respondents commented that they not only want maintenance but also improvements and expansion of the transit system. Many respondents also included components of other priorities in their top priority open-ended answer. Details of these are included in Section 4.
Respondents were asked about additional priorities not included in the list provided. Staff categorized the responses, which were also tied to MPO goal areas. Section 4o f this memo describes in further detail the comments provided in the additional priorities for each goal area. The full table of staff-organized additional priorities can be found in Appendix C.
The most mentioned additional priority was expanding transit service and the transit system. Improving network connections and multimodal connectivity was the second most selected priority, but the number of respondents who selected this choice were about half those that selected the top additional priority.
Staff asked general demographic information to learn more about respondents. The results are in the following tables.
Table 5
Sex of Respondents
Sex |
Percentage of Respondents |
Male |
53.2% |
Female |
42.9% |
Other |
1.1% |
Prefer not to say |
2.8% |
Two out of 462 respondents did not complete the question.
Table 6
Race and Ethnicity of Respondents
Race and Ethnicity |
Percentage of Respondents |
White |
84.7% |
Black or African American |
1.8% |
Asian |
2.9% |
American Indian or other Pacific Islander |
0.4% |
Native Hawaiian or other Pacific Islander |
0.7% |
Two or more races |
2.4% |
Preferred not to say |
8.4% |
Hispanic or Latino/a/x of any race |
2.9% |
The race and ethnicity questions were answered by 453 respondents, and nine respondents skipped the question. The minority population in the Boston region is 28.2% of the total population.
Table 7
Ages of Respondents
Age |
Percentage of Respondents |
Under 18 |
0.0% |
18-24 |
3.5% |
25-34 |
21.4% |
35-44 |
19.6% |
45-54 |
16.3% |
55-64 |
21.8% |
65 or over |
15.5% |
Prefer not to say |
2.0% |
The question on age was completed by 460 respondents. Apart from the age bracket of 18-24 years old, which only comprised 3.5 percent of respondents, there was little variance in the number of respondents in the age brackets. No respondents identified as under 18 years old.
The MPO considers a person low-income if they live in a family whose annual income is at or below 200 percent of the national poverty level, based on family size. A table depicting these thresholds and the percentages by income can be found in Appendix D. To approximate low-income status for respondents, MPO staff asked respondents for their household size and their annual household income.
The question on income was completed by 456 respondents. There were 362 respondents out of 462 for whom poverty status can be calculated. The number of respondents living at below 200 percent of their respective poverty thresholds is 13, which is 2.8 percent of the total respondents, or 3.6 percent of respondents for whom poverty status can be calculated.
Figure 2
Location of Respondents’ Home Residence by Zip Code
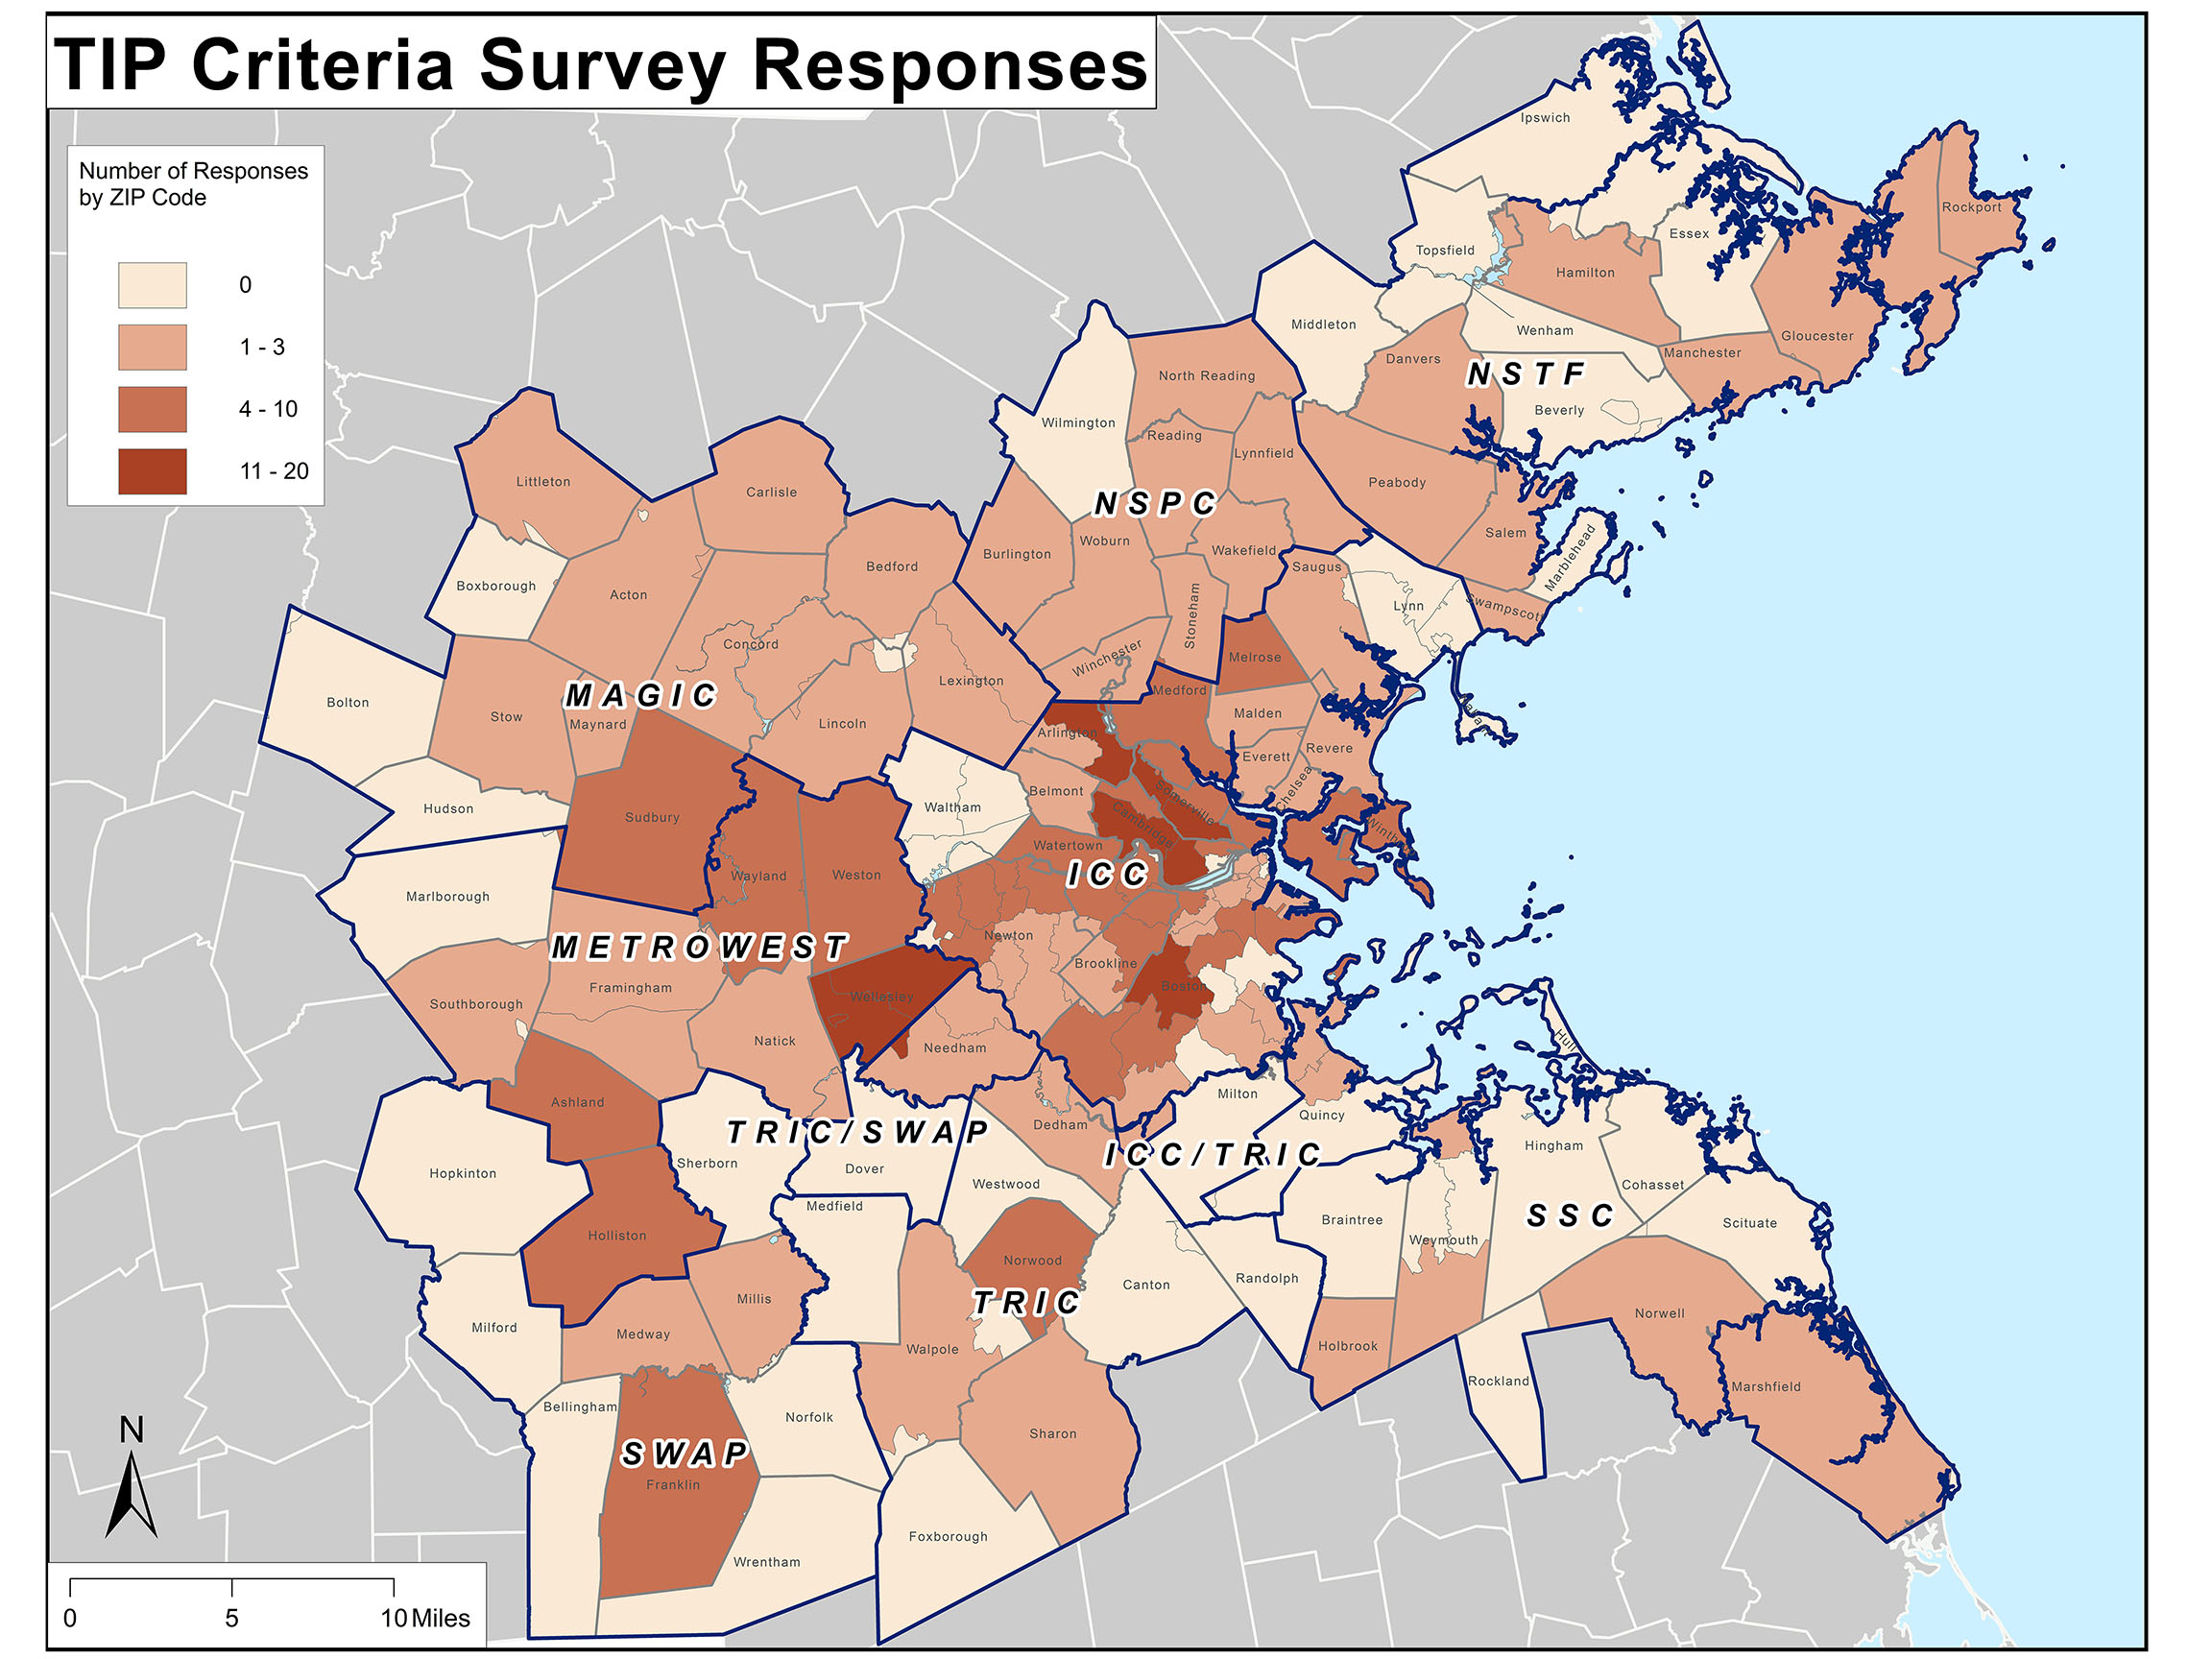
Staff asked respondents to share the zip code of their home residence. Zip codes were provided by 434 respondents. Figure 2 shows a map of the Boston region zip code areas, municipalities, and the MAPC subregions. The highest number of responses came from zip code areas in Arlington, Somerville, Cambridge, Jamaica Plain, and Wellesley. Although staff received responses from every MAPC subregion, there were several zip code areas that were not represented in this survey. Staff will conduct more intentional outreach in the areas that had low or no response rates, as well as areas that are home to a higher proportion of equity populations, when conducting the second round of TIP criteria feedback in the summer of 2020. More information on the next steps of outreach is provided in Section 5.
A primary mode of travel was reported by 462 respondents. Of these respondents, 6.9 percent also selected “Other” and explained that they used a combination of modes, so they could not pick just one. Some of these respondents also specified that they used an electric scooter or unicycle to travel. Staff analyzed the priorities by respondent mode to better understand if their mode choice might have correlated to their priorities. Table 8 describes the mode breakdowns for each of the five most selected priorities.
Table 8
Top Five Priorities by Mode
Priority |
Bicycle |
Other |
Personal Vehicle |
Public Transpor-tation |
Ride-hail |
Walk |
Improving pedestrian safety |
69 |
16 |
75 |
74 |
1 |
25 |
Promoting more equitable transportation mobility |
58 |
18 |
77 |
71 |
1 |
23 |
Reducing emissions and pollution |
57 |
15 |
94 |
56 |
1 |
14 |
Improving bicycle safety |
81 |
14 |
58 |
51 |
1 |
22 |
Reducing congestion |
21 |
14 |
117 |
37 |
0 |
8 |
Total respondents for each mode |
101 |
32 |
181 |
112 |
1 |
35 |
Total percentage of respondents by mode |
21.86% |
6.93% |
39.18% |
24.24% |
0.22% |
7.58% |
There was some variation among priorities and the respondents’ primary mode. More respondents who said their primary mode was driving selected “reducing congestion,” while those who said their primary mode was bicycle selected “improving bicycle safety.” The breakdown for mode for the top two priorities is very similar. When analyzing mode in comparison to priorities, staff recognize that mode is not the only indicator for a priority. Location, background, values, and wishes all shape respondents’ priorities. In addition, some respondents talked about how their primary mode was a car because they had no other options and could not rely on or access public transit.
The five most selected priorities identified during the focus groups were as follows:
Figure 3
Focus Groups Results: Priorities
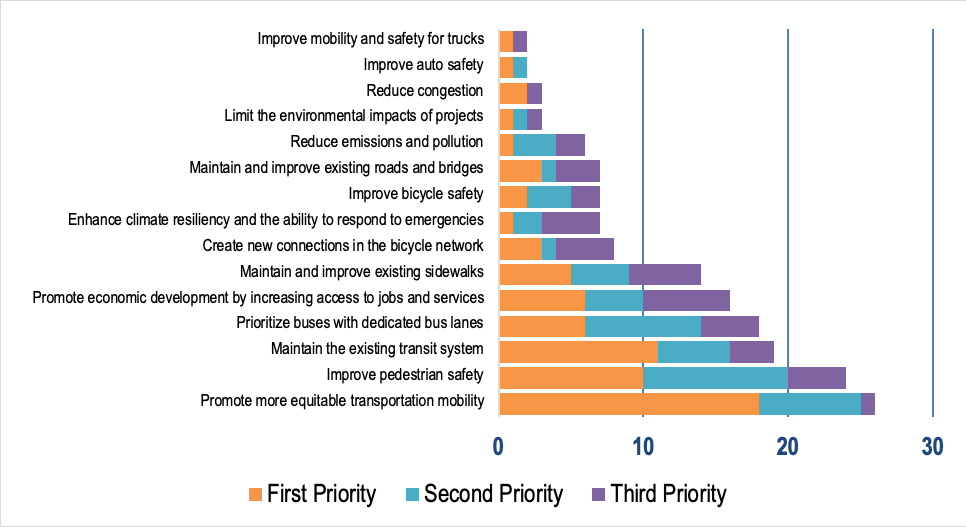
Three of the top five priorities for the focus groups were the same as for the online survey—"promote more equitable transportation mobility,” “improve pedestrian safety,” and “promote economic development by increasing access to jobs and services.” “Maintaining the existing transit system” and “prioritizing buses with dedicated bus lanes” were included in the top five for the focus groups but not for the survey respondents, and “reducing congestion” and “reducing emissions and pollution” were included by the survey respondents but far less prioritized in the focus groups.
The following sections describe in more detail the comments and feedback from the online survey and focus groups, organized by MPO goal area. Comments that did not pertain to MPO activities were not included, such as those about transit fares and state transportation funding.
Transportation projects that are candidates for TIP funding are judged based on criteria that are shaped by the MPO goal areas defined in the LRTP:
Survey and focus group priorities were organized into each relevant LRTP goal area.
The MPO’s Clean Air/Sustainable Communities goal seeks to create an environmentally friendly transportation system that achieves the following:
As part of in-person and online outreach, people frequently mentioned the need to reduce emissions and support sustainable transportation to help combat climate change and improve public and environmental health. More people focused on reducing emissions and pollutants, but some respondents also mentioned the following needs:
Many respondents discussed the gravity of the climate crisis and saw that other priorities such as improving pedestrian safety, improving bicycle safety, and maintaining as well as expanding transit service (both rail and bus) would support reducing emissions.
Two of the 15 priorities in the survey are related to the Clean Air and Sustainable Communities goal area:
Of 462 respondents, 238 (52 percent) selected “reducing emissions and pollution” as one of their top five priorities, and 50 respondents selected it as their top priority.
A sample of responses as to why this goal is important include the following
Many respondents felt that reducing emissions encompassed many other priorities. Additional ways they shared to achieve reductions of emissions and pollution included the following:
Overall, respondents would like the MPO to recognize the dire need for reducing transportation emissions and pollution in the face of climate change.
Of 462 respondents, 86 (19 percent) selected “limiting the environmental impacts of projects” as one of their top five priorities. Nine respondents selected it as their top priority. To fulfill this goal, respondents argued for the following:
The additional priorities suggested that were categorized in the Clean Air/Sustainable Communities MPO Goal area are shown in Table 9.
Table 9
Additional Priorities for Clean Air/Sustainable Communities
Additional Priority |
Number of Times Suggested |
Comments |
Prioritize non-car modes |
20 |
|
Reduce vehicle miles traveled |
5 |
|
Smart growth/transit-oriented development |
4 |
|
Sustainable energy |
3 |
|
Emission reduction to combat climate change |
13 |
|
Support active transportation |
3 |
|
Many of the comments aligned with other goal areas showing the intersection of these priorities.
Responses received during focus groups are summarized in Table 10.
Table 10
Focus Group Priorities for Clean Air/Sustainable Communities
Priority |
Percent Selected as First Priority |
Percent |
Percent Selected as Third Priority |
Reducing emissions and pollution |
1% |
6% |
5% |
Limiting the environmental impacts of projects |
1% |
2% |
2% |
As seen in the overall choices, these two priorities were not frequently selected, but priorities like transit investment and dedicated bus lanes would contribute to reducing emissions and pollution.
Additional comments heard during the focus groups included the following:
The existing criteria for Clean Air/Sustainable Communities, which are applied to all project types, provide points for projects that achieve the following:
The new criteria will be shaped for each investment program.
Many respondents placed a high priority on reducing emissions and pollution. MPO staff are proposing to keep the first three existing criteria, which address reducing emissions and limiting the environmental impact of projects. Under reducing other transportation-related pollution, staff is proposing to add the air pollutant, particulate matter (PM2.5).
The Safety goal seeks to make transportation by all modes safe by the following means:
As part of in-person and online outreach, people frequently mentioned the need to increase safety for people walking and biking to not only reduce fatalities and injuries but also help people feel safer and willing to try more active and sustainable transportation and to encourage mode shift. Respondents mentioned that creating separated bike facilities and installing more shared-use paths could increase access to jobs, services, schools, and transit stations as well reduce emissions.
Three of the 15 priorities were tied to the Safety goal area:
Feedback on improving safety and mobility for trucks is described in the Capacity Management and Mobility goal area section.
Of 462 respondents, 34 (seven percent) selected “improving auto safety” as one of their top five priorities. Three respondents selected “improving auto safety” as their top priority.
A sample of responses to why this goal is important include the following:
Of 462 respondents, 227 (49 percent) selected, “improving bicycle safety” as one of their top five goal areas. Thirty-three respondents selected it as their highest priority.
A sample of responses to why this goal is important include the following:
Many respondents felt that improving bicycle safety would encourage mode shift and support both public and environmental health. Other additional ways they shared to achieve improving bicycle safety included the following:
Overall, respondents want safer bike facilities and prioritization of pedestrian, bike, and transit infrastructure altogether to decrease the reliance on privately owned vehicles as well as reduce congestion. They also advocated for more separated bike infrastructure and more network connectivity.
Of 462 respondents, 261 (56 percent) selected “improving pedestrian safety” as one of their top five goal areas, and 42 respondents selected it as their highest priority.
A sample of responses to why this goal is important include the following:
Many respondents stated that improving pedestrian safety creates more equitable access and improves quality of life. Additional suggestions to achieve improved pedestrian safety included the following:
Overall, respondents spoke frequently about the co-benefits of investing in infrastructure to improve safety for people who walk and bike, reduce emissions and congestion, support equitable mobility, combat climate change, and promote economic vitality.
The additional priorities suggested that were categorized into the Safety goal area are shown in Table 11.
Table 11
Additional Priorities for Safety
Additional Priority |
Number of Times Selected |
Comments |
Enforcement of traffic laws |
3 |
|
Safety across the system |
18 |
|
Responses received during focus group meetings are shown in Table 12.
Table 12
Focus Group Priorities for Safety
Priority |
Percent Selected as First Priority |
Percent |
Percent Selected as Third Priority |
Improving auto safety |
1% |
2% |
0% |
Improving bicycle safety |
3% |
6% |
5% |
Improving pedestrian safety |
14% |
20% |
10% |
Improving pedestrian safety was one of the second most selected priorities in the focus groups. Focus groups participants shared additional comments, which focused on the following priorities:
The existing criteria for Safety provide points for projects that achieve the following:
Many respondents placed a high emphasis on protecting the most vulnerable road users and addressing the most serious crashes, and also recognized that many safety investments can have benefits across modes. To that end, MPO staff have proposed to retain the criteria for EPDO and crash rates, but focus these criteria more heavily on crashes that result in injuries or fatalities. MPO staff have also proposed to refine the methodology for scoring bicycle and pedestrian safety, including weighting these criteria more heavily for projects funded through the MPO's Bicycle Network and Pedestrian Connections investment program. Finally, MPO staff have proposed to focus the truck safety criterion more directly on truck-specific safety improvements and have proposed reimagining the existing railroad crossing safety criterion to be more inclusive of other safety investments for all modes, including improving traffic signals, installing traffic-calming features, and adjusting roadway geometry.
The System Preservation and Modernization goal seeks to maintain and modernize the transportation system and plan for its resiliency, which includes the following objectives:
As part of in-person and online outreach, people frequently mentioned the need to maintain the existing transit system in addition to expanding it and increasing its reliability and frequency. Respondents also advocated for maintaining and improving existing sidewalks, roads, and bridges, and enhancing climate resiliency.
As part of the online survey, four out of the 15 priorities related to the System Preservation and Modernization goal area:
Of 462 respondents, 98 (21 percent) selected “enhancing climate resiliency and the ability to respond to emergencies” as one of their top five priorities. Nine respondents selected it as their top priority.
A sample of responses as to why this goal is important include the following:
Of 462 respondents, 112 (24 percent) selected “maintaining and improving existing roads and bridges” as one of their top five goal areas, and 12 respondents selected it as their highest priority.
A sample of responses as to why this goal is important include the following:
Of 462 respondents, 87 (19 percent) selected “maintaining and improving existing sidewalks” as one of their top five goal areas, and four respondents selected it as their highest priority.
A sample response to why this goal is important was as follows:
Of 462 respondents, 175 (38 percent) selected “maintaining the existing transit system” as one of their top five goal areas, and 62 respondents selected it as their highest priority.
A sample of responses as to why this goal is important include the following:
Many respondents communicated that maintaining the existing transit system promotes more equitable mobility and could help combat climate change through the reduction of emissions and pollution. Other additional comments focused on the following priorities:
Some respondents described how maintaining and expanding the existing transit system supports the MPO goals of an equitable transportation system, limiting environmental impacts, reducing congestion, and promoting economic development. Many respondents emphasized the importance of expanding the transit system, which was the most shared additional priority.
Additional priorities suggested in the System Preservation and Modernization MPO goal area are shown in Table 13.
Table 13
Additional Priorities for System Preservation and Modernization
| Additional Priority |
Number of Times Selected |
Comments |
|---|---|---|
Expanded transit service/system |
74 |
|
Innovative ideas/designs |
17 |
|
Responses received during outreach with focus groups are shown in Table 14.
Table 14
Focus Group Priorities for System Preservation and Modernization
Priority |
Percent Selected as First Priority |
Percent Selected as Second Priority |
Percent Selected as Third Priority |
Enhancing climate resiliency |
1% |
4% |
10% |
Maintaining and improving existing roads and bridges |
4% |
2% |
7% |
Maintaining and improving existing sidewalks |
7% |
8% |
12% |
Maintaining the existing transit system |
16% |
10% |
7% |
Additional comments included the following:
The existing criteria for System Preservation and Modernization provide points for projects that achieve the following:
Staff will discuss draft changes to the System Preservation and Modernization TIP scoring criteria at the MPO meetings in July 2020.
The Capacity Management and Mobility goal seeks to use existing facility capacity more efficiently and increase transportation options that achieve the following:
The priorities in this goal area are more tangible actions rather than large-scale value-based priorities. Increasing connectivity in the bike network and prioritizing buses with dedicated bus lanes were mentioned frequently as strategies to accomplish other priorities, such as increasing equitable mobility, reducing emissions, and increasing economic access.
Four out of the 15 priorities were tied to the Capacity Management and Mobility goal area:
Of 462 respondents, 181 (40 percent) selected “creating new connections in the bicycle network” as one of their top five priorities, and 33 respondents selected it as their top priority.
A sample of responses as to why this goal is important include the following:
Additional comments included the following:
Eight out of 462 respondents (two percent) selected “improving safety and mobility for trucks” as one of their top five priorities. One respondent selected it as a top priority.
Of 462 respondents, 178 (39 percent) selected “prioritizing buses with dedicated bus lanes” as one of their top five priorities, and 35 respondents selected it as their top priority.
A sample of responses to why this goal is important include the following:
Additional comments focused on the following priorities:
Many respondents discussed the cost effectiveness and the co-benefits for prioritizing buses to reduce emissions, reduce congestion, and increase equity.
Of 462 respondents, 198 (43 percent) selected “reducing congestion” as one of their top five priorities, and 50 respondents selected it as their top priority.
A sample of responses as to why this goal is important include the following:
Additional comments focused on the following priorities:
Additional priorities suggested in the Capacity Management and Mobility MPO goal area are shown in Table 15.
Table 15
Additional Priorities for Capacity Management and Mobility
| Additional Priority |
Number of Times Selected |
Comments |
|---|---|---|
Mode Shift |
10 |
|
Network connections/ multimodal connectivity |
32 |
|
Person throughput vs. vehicle throughput |
4 |
|
Reduce cars on the road/reduce SOV trips |
16 |
|
Remove car centric roadways |
3 |
|
Increase reliability and frequency |
8 |
|
Congestion fee |
2 |
|
Responses received during outreach with focus groups are shown in Table 16.
Table 16
Focus Group Priorities for Capacity Management and Mobility
Priority |
Percent Selected as First Priority |
Percent Selected as Second Priority |
Percent Selected as Third Priority |
Creating new connections in the bicycle network |
4% |
2% |
10% |
Improving safety and mobility for trucks |
1% |
0% |
2% |
Prioritizing buses with dedicated bus lanes |
9% |
16% |
10% |
Reducing congestion |
3% |
0% |
2% |
Comments from focus groups focused on the following priorities:
The existing criteria for Capacity Management and Mobility provide points for projects that achieve the following:
Staff will discuss proposed changes to this criterion with the MPO in July 2020.
The Transportation Equity goal seeks to ensure that all people receive comparable benefits from, and are not disproportionately burdened by, MPO investments, regardless of race, color, national origin, age, income, ability, or sex by the following means:
Equity populations include people who identify as minority, have limited English proficiency, are 75 years old or older or 17 years old or younger, or have a disability; or are members of low-income households.
People frequently mentioned the need to promote equitable transportation mobility both to help right historical wrongs and to target investments to those who likely need it most. They urged the MPO to make investments towards multimodal options and help support access to jobs and services.
One of the 15 priorities is related to the Transportation Equity goal area:
Of 462 respondents, 248 (54 percent) selected “promoting more equitable transportation mobility” as one of their top five priorities, and 50 respondents selected it as their top priority.
A sample of responses to why this goal is important include the following:
Additional comments focused on the following priorities:
Additional priorities suggested in the Transportation Equity MPO goal area are shown in Table 17.
Table 17
Additional Priorities for Transportation Equity
Additional Priority |
Number of Times Selected |
Comments |
Affordable housing/multifamily zoning |
10 |
|
Public health |
7 |
|
Accessibility |
8 |
|
Equity |
24 |
|
Total |
49 |
|
“Promoting more equitable transportation mobility” was the most selected priority in the focus group meetings. The percentage of responses received during outreach with focus groups are shown in Table 18.
Table 18
Focus Group Priorities for Transportation Equity
Priority |
Percent Selected as First Priority |
Percent Selected as Second Priority |
Percent Selected as Third Priority |
Promoting more equitable transportation mobility |
25% |
14% |
2% |
Comments focused on the following priorities:
The MPO currently assesses transportation equity by determining whether a project serves Title VI/non-discrimination populations. On December 19, 2019, the MPO board began to discuss proposed changes to the Transportation Equity criteria. They agreed that the goals for the new criteria are as follows:
MPO staff are currently creating the new draft Equity criteria that will be shaped to each other goal area and involve an equity multiplier. These will be presented throughout the spring and summer MPO meetings.
The Economic Vitality goal seeks to ensure the transportation network provides a strong foundation for economic vitality by the following means:
Respondents frequently mentioned increasing access to jobs and services and also access to schools, transit stations, and affordable housing. Respondents repeatedly brought up the need to tie transportation investments to smart growth principles and transit-oriented development to be more equitable and have a large impact on reducing emissions. Respondents also asked to prioritize low-income and minority populations when assessing economic vitality.
One of the 15 priorities is tied to the Economic Vitality goal area:
Of 462 respondents, 116 (25 percent) selected “promoting economic development by increasing access to jobs and services” as one of their top five priorities and 20 respondents selected it as their top priority.
A sample of responses as to why this goal is important include the following:
Additional comments focused on the following priorites:
Additional priorities suggested in the Economic Vitality MPO goal area are shown in Table 19.
Table 19
Additional Priorities for Economic Vitality
| Additional Priority |
Number of Times Selected |
Comments |
|---|---|---|
Cost effectiveness |
7 |
|
Most people for investment |
7 |
|
Cross municipality connectedness |
2 |
|
Job/service access |
4 |
|
Responses received during outreach with focus groups are shown in Table 20.
Table 20
Focus Group Priorities for Economic Vitality
Priority |
Percent Selected as First Priority |
Percent Selected as Second Priority |
Percent Selected as Third Priority |
Promoting economic development by increasing access to jobs and services |
9% |
8% |
15% |
Comments focused on the following priorities:
The existing criteria for Economic Vitality provide points for projects that achieve the following:
MPO staff are working closely with MAPC to develop more extensive economic vitality criteria that are also in accordance with MAPC’s next long-range plan, MetroCommon. Staff will discuss proposed changes to this criterion with the MPO in June 2020.
Along with public outreach, staff have been working with the Massachusetts Department of Transportation, the MBTA, regional transit authorities, and others to draft criteria changes. In the spring and summer of 2020, staff will be presenting draft criteria for each MPO goal area to the MPO board. Staff will then share the new draft criteria and test project scores with the stakeholder groups and advocacy organizations involved in the first focus groups and elicit more public input. Due to the COVID-19 pandemic, meetings with the advocacy organizations will be conducted virtually. In addition, staff will host open virtual engagement opportunities to connect with new organizations and members of the public. Staff will also release another online survey to gather input on the new criteria changes. Staff will complete a final draft of the revised TIP criteria in September 2020, and the new criteria will be used in the next TIP cycle, FFY 2022–26, starting October 1, 2020.
Staff recognize that meeting people where they are during community meetings or events is the best way to connect with groups. Staff will be communicating calls for public input through the MPOInfo email list and the Boston Region MPO Twitter, Facebook, and Instagram social media channels.
Staff plan to expand outreach to people with limited-English proficiency as well as connect with the municipalities and areas where there were few responses. Staff will particularly focus on engaging equity populations that have historically been underserved by the regional transportation system as well as those residents who could have fewer opportunities to participate in the regional transportation planning process.
The Boston Region Metropolitan Planning Organization (MPO) operates its programs, services, and activities in compliance with federal nondiscrimination laws including Title VI of the Civil Rights Act of 1964 (Title VI), the Civil Rights Restoration Act of 1987, and related statutes and regulations. Title VI prohibits discrimination in federally assisted programs and requires that no person in the United States of America shall, on the grounds of race, color, or national origin (including limited English proficiency), be excluded from participation in, denied the benefits of, or be otherwise subjected to discrimination under any program or activity that receives federal assistance. Related federal nondiscrimination laws administered by the Federal Highway Administration, Federal Transit Administration, or both, prohibit discrimination on the basis of age, sex, and disability. The Boston Region MPO considers these protected populations in its Title VI Programs, consistent with federal interpretation and administration. In addition, the Boston Region MPO provides meaningful access to its programs, services, and activities to individuals with limited English proficiency, in compliance with U.S. Department of Transportation policy and guidance on federal Executive Order 13166. The Boston Region MPO also complies with the Massachusetts Public Accommodation Law, M.G.L. c 272 sections 92a, 98, 98a, which prohibits making any distinction, discrimination, or restriction in admission to, or treatment in a place of public accommodation based on race, color, religious creed, national origin, sex, sexual orientation, disability, or ancestry. Likewise, the Boston Region MPO complies with the Governor's Executive Order 526, section 4, which requires that all programs, activities, and services provided, performed, licensed, chartered, funded, regulated, or contracted for by the state shall be conducted without unlawful discrimination based on race, color, age, gender, ethnicity, sexual orientation, gender identity or expression, religion, creed, ancestry, national origin, disability, veteran's status (including Vietnam-era veterans), or background. A complaint form and additional information can be obtained by contacting the MPO or at http://www.bostonmpo.org/mpo_non_discrimination. To request this information in a different language or in an accessible format, please contact Title VI Specialist |