Technical Memorandum
DATE: January 21, 2021
TO: Boston MPO Board
FROM: Matthew Archer, Sandy Johnston, Blake Acton, Bradley Putnam
RE: Review of Vision Zero Strategies
Vision Zero is a policy goal, planning paradigm, and process in which a municipality or other jurisdiction aims to reduce its number of transportation-related fatalities to zero. It is a well-known paradigm for establishing traffic and roadway safety, with an emphasis on the most vulnerable roadway users. The traditional approach to roadway safety emphasizes the role of personal responsibility in preventing accidents. A Vision Zero approach differs by shifting primary responsibility to the designers of the roadway network, and recognizing that faults in design are the primary cause of grievous injury and death (Belin, Tillgren, and Vedung 2012). In addition, Vision Zero theory acknowledges that human error is unavoidable. As such, Vison Zero policies do not seek to eliminate all crashes, but to ensure that street design and operation account for human error to make all crashes survivable (Shahum 2017).
Early 2014 marked the beginning of the adoption of Vision Zero initiatives in the United States. New York City launched its Vision Zero initiative in January of 2014, and San Francisco followed with its initiative in February. Both cities pledged in their supporting action plans to eliminate traffic fatalities by 2024. New York City reported 200 traffic fatalities in 2018, a decline from 299 fatalities in 2013 (Fitzsimmons 2019). However, pedestrian fatalities increased from 107 to 114 between 2017 and 2018. Traffic fatalities in San Francisco dropped from 32 to 20 between 2016 and 2017. This number increased to 29 in 2019, a slight reduction compared to 31 fatalities in 2014 (City of San Francisco 2020).
As of 2020, 42 cities in the United States have adopted Vision Zero policies; Maryland, North Carolina, and North Dakota have adopted Vision Zero at the state level.
Committing to Vision Zero policies requires municipalities to approach roadway safety with a nontraditional mindset. The Vision Zero Network (a US nonprofit organization committed to advancing Vision Zero strategies) describes five fundamental tenets of Vision Zero, frequently cited in US Vision Zero action plans (Vision Zero Network 2017b):
This project seeks to identify the Vision Zero strategies that are most effective at reducing traffic deaths and serious injuries. This document presents global case studies and provides an overview of specific strategies and implementation factors that have led to success. Most of the case studies are from international locations that have a longer history with Vision Zero and have experienced more success. In addition to Portland, Oregon, the case study locations include Sweden; the Netherlands; Oslo, Norway; and Helsinki, Finland. Finally, the memo will provide guidance to expanding and enhancing Vision Zero policies in the Boston region.
This project also highlights the difficulty of applying Northern European models of governmental cooperation to the United States. In particular, scholars and advocates note that the Vision Zero paradigm alone is not adequate for addressing the legacy of racism in transportation planning or traffic enforcement in the United States. Mixed or disappointing outcomes can be traced to a focus on branding without the commitment to implementing physical interventions that comes from the acceptance of responsibility for success by leaders. These concerns do not undermine the overall importance of reorienting approaches to traffic safety. Instead, acknowledging the limitations of the Vision Zero framework can help municipalities in the Boston region tailor their approach to achieve local success.
The following section presents five case studies of locations that have successfully implemented Vision Zero strategies, which have resulted in improved safety for roadway users and can serve as examples for the Boston region.
The concept and term Vision Zero is believed to have originated in Sweden. In the 1990s, national transportation leaders in Sweden changed their approach to the problem of fatalities and serious injuries in the transportation system. They discarded cost-benefit analyses and focused on ethical and human values, in particular, that no one should be seriously injured or killed on a road. In October 1997, the Swedish Parliament adopted Nollvisionen (Vision Zero)as the basis for the country’s road safety work, with the goal “that [no one] shall be killed or seriously injured as a consequence of accidents in road traffic” (Belin, Tillgren, and Vedung 2012). Vision Zero represented a shift from the traditional approach to roadway safety in Sweden. While fatalities and injuries had been primarily attributed to user error, Vision Zero theory maintained that roadway design and operation, in addition to roadway users, are responsible for accidents. The Swedish parliament included an outline for traffic safety responsibility (Tingvall and Haworth 1999):
Vision Zero in Sweden does not assign blame for traffic fatalities or severe injuries. Instead, it teaches stakeholders about how they influence outcomes based on facts and data. Vision Zero in Sweden assumes that human beings make mistakes and that transportation systems should be designed to minimize the repercussions of those mistakes. This approach emphasizes the responsibility of roadway designers to create inherently safe systems.
One of the guiding principles of Vision Zero in Sweden is speed reduction. Swedish road designers believe that pedestrians and bicyclists should never share unregulated road space with cars that are traveling faster than 20 mph. Designers emphasize physical road elements, such as raised crosswalks and roundabouts, to encourage slower driving near intersections. Where slower speeds are not possible, separating people who are bicycling and people who are walking from cars is the next best option.
Another guiding principle of Vision Zero in Sweden is to focus on preventing fatal and severe injuries rather than preventing crashes. As such, Swedish transportation planners have focused on road designs that reduce the severity of crashes. For example, median barriers that separate head-on auto traffic were found to reduce fatal crashes by 80 percent. This strategy did not reduce the overall number of crashes, but it did reduce the number of crashes that resulted in severe or fatal injuries. Similarly, roundabouts could help to reduce the severity of crashes by slowing vehicles and softening the angle of crashes when they do occur.
Swedish transportation officials also found that effective Vision Zero implementation requires careful data collection. They found that crash data reported by police was not always complete, and so they supplemented the crash data with injury data reported by hospitals, leading to a better understanding of traffic-related injuries.
The national approach to traffic safety in the Netherlands, known as Sustainable Safety, is the equivalent of Vision Zero in Sweden. Sustainable Safety began as a vision of the Institute for Road Safety Research (SWOV) in the early 1990s. In 1997, the same year Sweden adopted Vision Zero, all levels of Dutch government formally adopted the Start-up Programme on Sustainable Safety document. The Start-up Programme document included 24 agreements between the central government and regional and local public authorities, resulting in the adoption of uniform guidelines, large-scale implementation of infrastructure measures, stricter enforcement, and the establishment of permanent road-user education. This foundational document has been revised twice since then, with the most recent version adopted in 2018 (SWOV 2018).
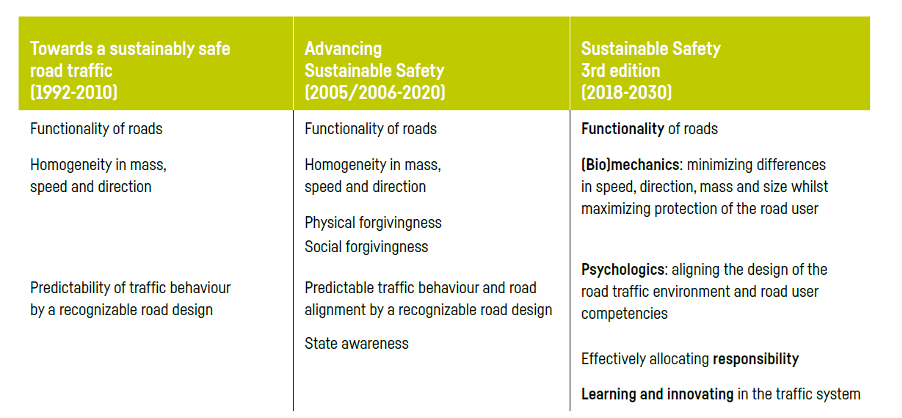
Sustainable Safety is a systems approach that applies known solutions systematically and holds the owners and managers of roads, not just their users, accountable for safety. It is a system adapted to humans, who are vulnerable and make mistakes (Furth 2015). Sustainable Safety further aligns safety-management decisions with broader transport and planning decisions that meet wider economic, human, and environmental goals, and shapes interventions to meet the long-term goal, rather than relying on traditional interventions to set the limits of any long-term targets (Weijermars and Wegman 2011). Sustainable Safety implements these overall values through five principles codified in the SWOV vision guidebook. The principles listed below have been in effect since 2018.
Design principles
Organization Principles1
Figure 1 shows the evolution of Sustainable Safety’s principles over time.
Figure 1
Evolution of Sustainable Safety Principles, 1992–2018
Source: SWOV (2018)
The Dutch approach is heavily focused on infrastructural interventions. All roadways are classified by purpose, dividing roads into three types: Flow, Distributor, and Access (Wegman et al 2006). Flow roads carry traffic at higher speeds between areas; Distributor roads link Flow roads to local areas; and Access roads serve neighborhoods and local areas, with traffic carried at low volume and low speed. Every attempt is made to segregate traffic by type so roads below the Flow level do not carry through traffic, and nonmotorized road users are not exposed to the high speeds on Flow roads (where necessary, those roads are equipped with separated pedestrian/bicycle infrastructure). On local streets, Dutch planners and engineers attempt to control speeds with physical interventions such as speed humps and chicanes. They try to protect pedestrians by only allowing protected (as opposed to permitted) left turns and attempting to ensure pedestrians never have to cross more than two lanes at a time. Local streets often carry a 30 km/h (20 mph) designation and are designed for pedestrians, cyclists, and cars to calmly share space. Roundabouts, raised crosswalks, and raised-table intersections are also quite common (Furth 2015). The national government provided a funding stream for these improvements from the very beginning, although a local match was also expected (Weijermars and Wegman 2011). The Sustainable Safety approach has also brought a renewed emphasis on traffic enforcement and more recently on education, particularly of the most vulnerable road users, such as children and the elderly.
Weijermars and Wegman (2011) estimate that Dutch traffic safety measures, primarily but not exclusively those parts of the Sustainable Safety program, prevented the loss of approximately 1,600 lives between 1998 and 2007, relative to a continuation of prior policies (Figure 2).
Figure 2
Estimation of Lives Saved by Sustainable Safety, 1998–2007
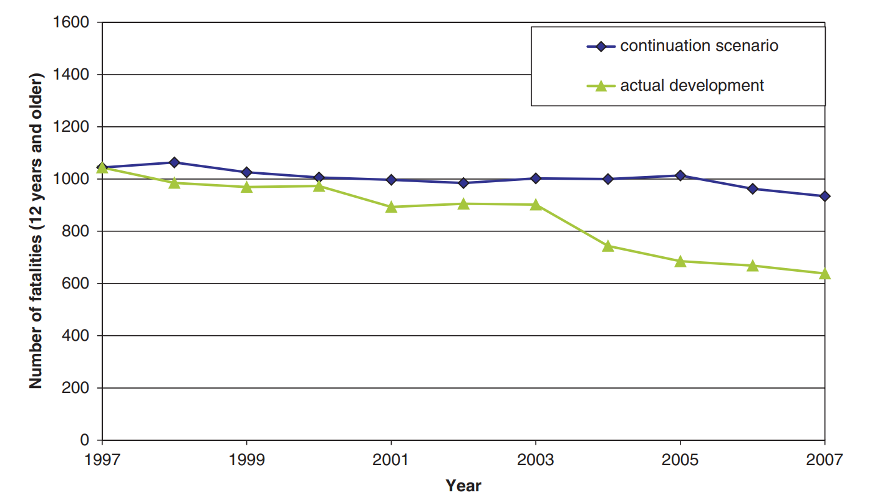
Source: Weijermars and Wegman (2011)
Progress has continued since then, with SWOV (2018) documented road fatalities continuing to fall over the next 10 years (Figure 3).
Figure 3
Road Fatalities and Serious Injuries in the Netherlands, 2007–17
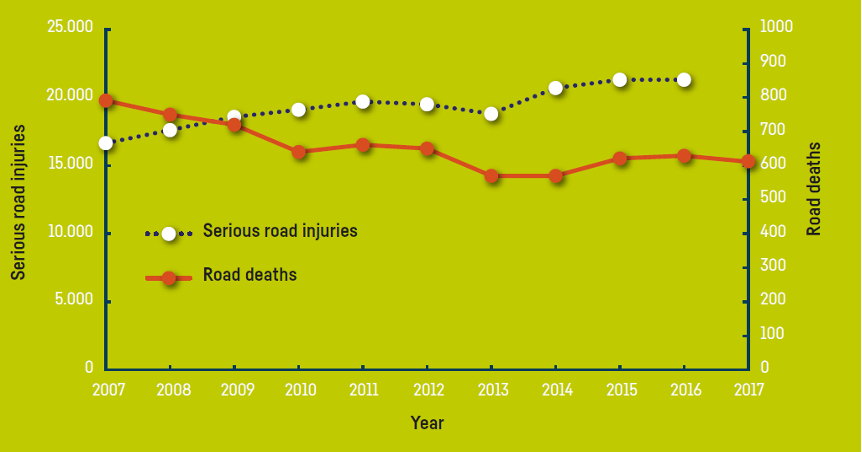
Source: SWOV (2018)
Notably, serious road injuries have slowly increased over the same time, perhaps suggesting that some crashes that would have previously led to fatalities now cause injury instead. This may be considered progress, but there is an indication that there is significant room remaining for improvement.
Norway adopted Vision Zero at a national level in 1999. Since adoption, roadway fatalities have dropped 75 percent, from 7.9 per 100,000 residents in 1998 to 2.0 in 2019 (Statistics Norway 2020a). However, nationwide fatalities have fallen consistently since the early 1970s when Norway began implementing systemic road safety improvements. This decline is evident in Figure 4, which shows a gradual decline in roadway fatalities from its historical peak in 1971 at 14.5 per 100,000. In 2012, fatality rates fell below its 1947 historic low of 3.0 per 100,000 and have since remained below 3.0 every year since 2014.
Figure 4
Persons Killed or Severely Injured in Road Traffic Accidents per 100k Residents in Norway from 1946 to 2019
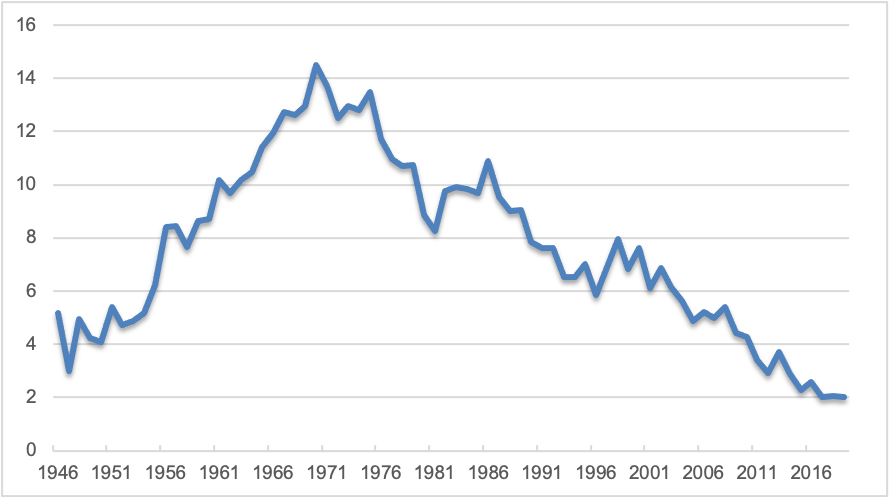
Source: Statistics Norway (2020a)
In 2019, only one traffic fatality occurred in the City of Oslo with zero pedestrian or cyclist fatalities (Statistics Norway 2020b). Although this follows the general decline of roadway fatalities in Norway, the city has been particularly proactive in reducing the interaction of vehicles, cyclists, and pedestrians. Since 2015, Oslo has worked toward the concept of Bilfritt byliv (Car-Free City Life) to reduce greenhouse gas emissions. This work coincides with strategies to achieve Vision Zero.
Beginning as a pilot in six of 13 districts in 2017, Oslo has disincentivized vehicle use while encouraging mode shift. Public parking has been largely eliminated, with the exception of parking for persons with disabilities, and replaced with bike lanes, pedestrian facilities, and public spaces. In 2018, some streets were designated as car free and speed limits were reduced (Walker 2020).
The idea of the car-free city and the strategies employed in Oslo have not been widely accepted throughout Oslo. The city found that 55 percent of the public believe that the city should have the “fewest possible vehicles” (Cathcart-Keays 2017). However, a 2015 proposal to create a car-free zone in the city center faced significant public backlash as local businesses feared they would lose non-local shoppers (Cathcart-Keays 2017). In response, the city revised its plan to reduce the number of cars rather than banning them altogether. This plan was implemented gradually over two years by reducing parking, expanding pedestrian infrastructure, and implementing roadblocks.
Helsinki, the capital city of Finland, rose to prominence among US observers when, alongside Oslo, it was reported that Helsinki had managed to eliminate pedestrian fatalities entirely in 2019 (Wilson 2020). Indeed, by May 2020 it had been two years since a pedestrian fatality occurred in Helsinki (Teivainen 2020). This is a remarkable achievement given Helsinki’s past experiences; during the 1960s the city saw about 40 pedestrians killed in traffic each year, even though car traffic was then approximately one-third of present levels (City of Helsinki 2019). Traffic crashes and fatalities reached a peak in 1965 when Helsinki recorded 84 traffic deaths. Even the 1980s and 1990s saw approximately 20 to 30 road deaths per year, so the near-elimination of fatalities is a relatively recent phenomenon (Yli-Seppälä 2020). Though Helsinki’s results are remarkable, its efforts to achieve roadway safety have seemingly gone less remarked upon in the United States, perhaps because the Finnish capital does not appear to brand its work with a single phrase comparable to “Vision Zero” in Sweden or “Sustainable Safety” in the Netherlands.
The city reports that “39 percent of journeys were made on foot in Helsinki in 2018, 29 percent by public transport, 22 percent by passenger car, nine percent by bike and one percent by other vehicles” (HSL 2019). The city considers pedestrians its first priority in transportation planning, followed by (in order of priority) cyclists, public transport, city logistics, and passenger cars (Yli-Seppälä 2020). Recognizing that speed largely determines the severity of crashes, Helsinki has consistently lowered speed limits in the urban core since 1970, as Figure 5 shows.
Figure 5
Changes in Speed Limits in Helsinki, 1973–2004
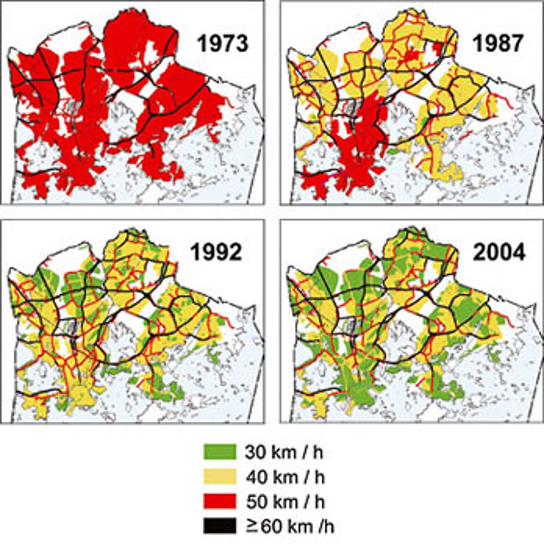
Source: City of Helsinki
https://www.hel.fi/helsinki/en/maps-and-transport/streets-traffic/safety/
Helsinki is planning the installation of 70 new traffic cameras to enforce these limits and other regulations (Yli-Seppälä 2020), but its traffic safety program is not solely about enforcement. Helsinki also embraces a wide variety of physical interventions at different levels of cost and complexity, including speed bumps; elevated crosswalks; elevated or grade-separated intersections; a preference for roundabouts over signalization; narrowing of roadways to control speeds; pedestrian islands, including bus stop islands; and, in some circumstances, mixed-use streets. Bans on through traffic are considered inefficient since they require police enforcement and, therefore, are used sparingly (City of Helsinki 2019). Helsinki is also planning to boost funding for building out a high-quality bicycle network to about €20 million per year (~ $23M), with hopes of boosting bicycle mode share from 11 to 15 percent (Yli-Seppälä 2020).
Interestingly, Helsinki does not appear to use Vision Zero branding, nor were researchers able to find any English-language materials giving any indication of a different local branding similar to Sustainable Safety in the Netherlands. Consistently improving traffic safety, integrated with other policy goals such as sustainability, is simply part of regular practice. As a Helsinki traffic engineer says, “In traffic safety, the biggest challenge is integrating these new ways of moving—e-scooters and other electric vehicles, for example—into existing traffic and city norms” (Yli-Seppälä 2020).
Portland’s City Council voted to adopt Vision Zero in 2015, with a final plan approved in 2016 (FHWA 2019). Portland has a reputation for being one of the United States’ most walkable and bikeable cities (Bersin 2018); however, much of the city remains somewhat sprawling and suburban, with many high-speed arterials. Adoption of Vision Zero was driven largely by grassroots organizing, advocacy groups, and elected officials, all of whom were alarmed by the city’s stagnation in progress on traffic fatalities over a 20-year period (FHWA 2019).
Portland’s 2016 Vision Zero Action Plan lays out three guiding principles for the city’s approach to Vision Zero: the plan will be equitable, data driven, and accountable (City of Portland 2016). As a result of these principles, Portland places heavy emphasis on its High Crash Network (HCN), an approach inspired by international examples, and noted by one of this study’s interviewees as a leading adoption of this strategy in the United States. Streets listed in the HCN “represent 8 percent of streets in Portland, yet account for a disproportionate 57 percent of deadly crashes” (FHWA 2019). As demonstrated by Figure 6, Portland planners overlay the HCN on Communities of Concern, a composite index of 10 equity indicators identified by TriMet, Portland's regional transit provider, that provides information on concentrations of vulnerable populations within the city, to enhance their equity approach to Vision Zero (City of Portland 2016).
The Portland Bureau of Transportation (PBOT) has also placed a heavy emphasis on speed as a factor in crashes, noting that most traffic deaths in the city were occurring on roadways with speed limits between 35 and 45 mph (Vision Zero Network 2018b). PBOT has worked in a variety of ways with the Oregon Department of Transportation, which retains ultimate power over speed limits throughout the state, to lower designated speeds across the city, even before infrastructural redesigns are possible. According to the Vision Zero Network, “PBOT sees value in lowering a speed limit, even if a street redesign is not imminent,” figuring that doing so changes public expectations and counters the culture of speeding (Vision Zero Network 2018). This approach appears to be proceeding more slowly than hoped; PBOT’s Two-Year Update to the Vision Zero plan notes that “although many requests are granted, this piecemeal approach does not go far enough to support Portland’s safety goals. Portland will continue to pursue authority to set speed limits locally” (City of Portland 2019).
Figure 6
Portland, Oregon High Crash Network
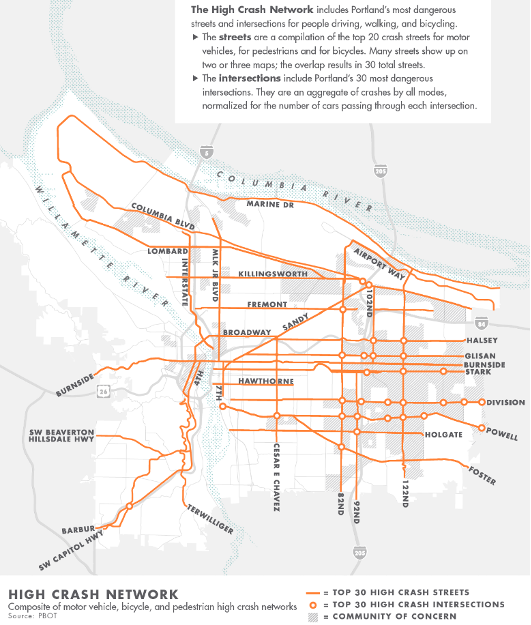
Source: PBOT 2016
Portland also sought and secured a change in state law allowing placement of speed cameras on HCN roadways. Eight cameras installed since 2016, on four of the city’s most dangerous streets, have on average “reduced speeding overall by 59%, with top end speeding (more than ten miles per hour over the speed limit) dropping by 85%” (City of Portland 2019). Perhaps, most importantly, Portland is redesigning streets for increased safety. PBOT’s stated goal is to complete concept design plans for all HCN streets by the end of 2021 (City of Portland 2019).
Portland’s approach to Vision Zero appears to focus less on infrastructural interventions than international standard-setters. Of the five primary factors laid out in the city’s initial plans (Street Design, Impairment, Speed, Education and Enforcement, and Community Engagement), only one is mostly about infrastructure. Notably, the “speed” factor discusses street design but does not focus solely on it. Portland seems to be a leader among US cities in making equity a focus of its Vision Zero efforts, and PBOT staff “identified the inclusion of multiple organizations with a focus on racial equity as a major reason why the city’s Vision Zero plan did not call for increased enforcement.” However, Portland’s Vision Zero plans rely on certain forms of enforcement, leading to ongoing concerns about equity implications (Abonour and Roberts 2018). In addition, there is some question about whether Portland’s efforts have shown much progress to date. Fatalities in the city proper have not fallen as much as hoped, leading to criticism from advocates (Chinn and Lapointe 2019). Similarly, Willamette Week reported that data collected by Metro, Portland’s regional government, showed traffic fatalities actually rising across the entire metropolitan area since the regional Vision Zero goals were approved in 2015 (Gormley 2020).
The case studies presented here offer a variety of lessons, illustrating both opportunities and challenges, for the Boston region. One of the key questions is whether responsibility for and governance of roadways can be unified or at least cooperative, or remain fragmented. The leading Vision Zero approaches in Sweden and the Netherlands stress the responsibility of the roadway owner and manager for the safety of users. The Dutch approach to road safety relies on rigorous application of principles, close coordination between different governmental entities at different levels of governance, and a continued awareness for improvement. This approach would likely be challenging to implement in the United States, where governance is highly fragmented (particularly true of the Boston region). In addition, the US transportation world has at times tended to be reactive rather than proactive on safety issues. The Dutch offer a proven track record of improvement and can be looked to as a positive example—if the responsible entities can cooperate. The Boston Region MPO stands as a potentially important coordinating body.
Among the case studies, Portland’s Vision Zero experience is the most analogous to the Boston area, as it is also a US city. Portland’s emphasis on a high-crash network and on equity in planning and implementation are regarded as among the best in the country. But fragmented governance and, in particular, the fact that the state department of transportation owns some key roadways, is a major challenge. The Boston region’s governance is also highly fragmented, with roadways owned by municipalities and several state agencies. Results of Portland’s Vision Zero campaign appear to be mediocre thus far—a warning sign for Boston. Its branding is strong, but proclamation of a campaign and branding have not led to positive results.
Somewhat in contrast to Portland, Helsinki’s experience with traffic safety has, until recently, not garnered the headlines that the Dutch or Swedish experiences have, but its lessons for the Boston region are perhaps all the more powerful for it. Rather than rallying around a prominent brand, Helsinki has simply integrated good traffic safety practices into regular practice. There appears to be a clear political directive to empower the bureaucracy to achieve real change in road design, safety, and mode share. In addition, the city has funded its policy goals, allocating money for new transit, pedestrian, and bike investments that support its stated goals. In short, Helsinki’s approach emphasizes content over branding, with very positive results.
It is possible that current conditions could provide the impetus for the change necessary for a regional Vision Zero commitment in Boston. The COVID-19 pandemic has forced many municipalities to rethink street usage and repurpose on-street parking for other uses. Oslo has shown that public parking reduction can disincentivize vehicle use, especially when providing infrastructure for people to walk and bicycle. Boston region municipalities may consider reducing on-street parking from pre-COVID levels and expanding bicycle and pedestrian access. Oslo’s history also shows that reductions in fatalities may not happen quickly, but a commitment to effective policies can produce long-term change.
This section describes various policy and design strategies for achieving Vision Zero goals, including both those targeted at motor vehicles and the reduction of speeding and those that make walking and cycling safer. Many of these strategies are already well-known in the Boston region or are an option in the standard road design process. The innovation of Vision Zero is in establishing a systemic method for identifying the correct interventions in the correct places and standardizing their application.
Vehicle speed is the primary factor in determining the survivability of a crash. Survivability drops rapidly as speed increases. A pedestrian hit by a vehicle traveling at 20 mph has an approximately 90 percent chance of survival; at 30 mph, a pedestrian has an approximately 50 percent chance of survival (Vision Zero Network 2017a). Between 30 mph and 50 mph, the risk of death increases 2.8 percent for each mile per hour increase in impact speeds (Tefft 2013). As such, managing the speed of vehicles is essential to ensure the safety of all roadway users.
Vehicle strategies generally focus on two areas: speed management through policies and enforcement and speed management through design changes. The following sections describe these two strategies in more detail. Data can be used to target specific high-risk locations for the implementation of speed reduction efforts. Cities with Vision Zero policies have found that most high-crash locations are limited to a small number of roadways (Vision Zero Network 2017b). These locations should be given a higher priority over other sections of the road network when assessing where to implement speed management strategies.
Reducing speed limits encourages slower driving. Among the international case studies presented in this memorandum, Helsinki’s gradual but continuous reduction of speed limits across several decades stands out as an effective and positive example. And the challenge in the United States is significant: in a study of 300 locations, the City of Denver found that 25 percent of drivers drove at least five miles per hour over the speed limit on roadways posted at 25 mph, while 54 percent of drivers sped at the same rate on roadways posted at 35 mph (City of Denver 2017).
The statutory speed limit for thickly settled or business districts in Massachusetts is 30 mph. As of 2016, municipalities can elect to reduce their statutory speed limit from 30 mph to 25 mph in thickly settled or business districts under Massachusetts General Law Chapter 90, Section 17C. Five municipalities have opted to reduce the statutory speed limit on certain roadways or specific sections of roadways, while 43 municipalities have reduced the statutory speed limit on the city or town-wide level.
The Cities of Boston, Cambridge, and Somerville have elected to reduce speed limits to 20 mph in some areas as part of their Vision Zero efforts. Launched in 2017, the City of Boston’s Neighborhood Slow Streets program selects candidate neighborhoods, or “zones,” for speed reduction on residential streets, emphasizing low-cost solutions including signage and speed humps. To date, 15 zones have been selected for the Neighborhood Slow Streets program (City of Boston 2018). The City of Somerville’s Safety Zones encompassed approximately 22 miles of roadways in the City by 2018. The City of Cambridge announced that most City-owned streets with posted speed limits will be designated as 20 mph streets.
Based on the Swedish and especially Dutch examples, the Vision Zero Network recommends lowering speed to fit the context of the community, with lower speeds appropriate in communities with high cyclist and pedestrian mode shares (Vision Zero Network 2017b). Suburban and rural roads primarily used by vehicles may not see a significant pedestrian and bicycle safety benefit from speed reduction. However, regardless of context, reducing the average speed of traffic will “almost always” reduce the total number of crashes and severity of injuries in crashes (Forbes et al. 2012). In some cases, as in Portland, municipalities may have to request permission to lower speed limits from state government; additionally, as in the Boston region, ownership and management of roadways is often split between multiple entities or jurisdictions, so a systematic lowering of speed limits would have to be coordinated.
Automated speed enforcement (ASE) is an effective method to reduce injury crashes—and one that is prominent in Vision Zero and other safety strategies both internationally and in the United States. All of our international case studies mention automated enforcement as a key strategy. Portland, Oregon, and Washington, DC, saw 53 percent and 70 percent decreases in fatalities, respectively, after implementing ASE. The rate of vehicles speeding 10 mph over the speed limit in Washington, DC, fell from 1 in 3 to 1 in 40 (Phillips and Monzón 2015); the presence of speed cameras in Montgomery County, Maryland, resulted in a 59 percent reduction in the likelihood for drivers to speed 10 mph over the speed limit when compared with similar roadways in two nearby Virginia counties without cameras (Hu and McCartt 2015).
Apart from toll roads, automated traffic enforcement, including speed cameras and red light cameras, is currently prohibited in the Commonwealth of Massachusetts. However, Massachusetts Senate Bill S.2553, An Act Relative to Automated Enforcement, would allow for automated enforcement of speeding and red light violations on local roads. If passed, the maximum fine imposed from traffic violations captured through automated enforcement would be $25, and the bill prohibits municipalities and private traffic enforcement companies from profiting from traffic violations. Dissemination of the location of cameras would be mandatory, as would signage in the vicinity of the location of cameras. In presenting the bill, Senator William Brownsberger used Vision Zero in reference to how the proposed legislation emphasizes safety over revenue. Since its introduction in February 2020, the bill has faced opposition from senators citing privacy concerns (Lisinski 2020). The bill eventually failed to gather enough support and was tabled for a future session (An Act Relative to Automated Enforcement 2020). Should the bill be enacted, municipalities could implement an ASE program in a relatively short amount of time. A Governors Highway Safety Association study estimates that after enacting legislation, automated traffic enforcements programs will likely require “four to six months to plan, publicize, and implement” (Hedlund, Harsha, and Hutt 2005).
In contrast to Massachusetts, the Council of the District of Columbia unanimously passed the Vision Zero Enhancement Omnibus Amendment Act of 2020 B23-0288 (Allen et al. 2020). The bill aims to reduce traffic and pedestrian fatalities in the District through a variety of reforms. Some major changes include decreasing speed limits on local streets to 20 mph, prohibiting right turns on red in select areas, and greatly expanding the city’s automated traffic enforcement program. As of 2020 there are 46 red light and stop sign cameras installed throughout the District, but by 2024 this will increase to 165, including 10 new bus lane enforcement cameras. The bill also requires the Mayor to negotiate reciprocity agreements with neighboring Maryland and Virginia since about 90 percent of outstanding violations are from out-of-state vehicles (Lazo 2020). In addition to enhancing automated enforcement, the bill expands distracted driving to include drivers using over-ear or in-ear headphones and requires new residents seeking a driver’s license to complete a new traffic safety knowledge exam that will include new questions regarding bicycle safety.
Changes to roadway design can reduce speeds without requiring legislation—and can be effective even in the absence of enforcement measures.
Speed bumps and speed humps are roadway devices that create raised areas above pavement level on a roadway with the intent of reducing vehicle speed. They are similar in purpose yet different in design and effect. Both encourage slower vehicle speeds through immediate feedback. If a vehicle travels over a raised pavement area at a high speed, it will experience a noticeable jolt, which encourages the drivers to reduce their speed. Speed bumps are typically three to six inches in height and one to three feet in length. Speed humps are typically three to four inches in height and 12 feet in length. Because of their extended length and generally reduced height, speed humps are preferable when the roadway is shared with vehicles and bicycles.
The City of Bellevue, Washington, installed speed humps in residential areas with positive results. The city measured the impact of five new speed humps all located in 25 mph residential speed limit zones. Prior to speed hump installation, 85th percentile speeds in these areas ranged from 36 to 39 mph. After installation, 85th percentile speeds declined to 24 to 27 mph, representing an approximate 26 percent speed reduction across all locations (FHWA 2006). Vehicles passing over the speed humps slower than 25 mph experienced little discomfort, while higher speeds were associated with increased discomfort. The City concluded speed humps were effective at reducing vehicle speeds and received general support from members of the public.
A single speed hump can mitigate vehicle speeds at a specific location. To effectively reduce speeds along a longer roadway segment, speed humps should be installed at intervals of 300 to 600 feet (FHWA 2006).
Among case study locations, the Netherlands and Helsinki were prominent in using speed humps as part of their Vision Zero initiatives.
Roundabouts have proven to be an effective method of reducing vehicle speed and decreasing crash rates (NCHRP, 2010). On average, traditional signalized intersections see 34 crashes per 100 million vehicles. Comparatively, roundabouts see 20 crashes per 100 million vehicles. The rate of crashes involving bicycles does not significantly differ between traditional intersections and four-armed roundabouts. As such, roundabouts should be designed to assure that people on bicycles and in cars have a sufficient buffer area. Among case study locations, the Netherlands and Helsinki were prominent in using roundabouts as part of their Vision Zero initiatives.
This strategy may be of special interest in the Boston region: MassDOT has undertaken a campaign to convert the state’s legacy rotaries into roundabouts with a more advanced design safer for all users (MassDOT 2020b). In September 2020 MassDOT released Guidelines for the Planning and Design of Roundabouts that included significant consideration for the needs of pedestrians and bicycle riders (MassDOT 2020a). MPO staff also published a memo and web tool in 2013 intended to help screen intersections for suitability of roundabout implementation (Asante and Pagitsas 2013). Since there are already many rotaries/traffic circles/roundabouts in Eastern Massachusetts, the concept is familiar to Boston-area drivers and traffic engineers.
Narrow travel lanes encourage reduced travel speeds. The cities of Amsterdam, Copenhagen, Berlin, Paris, Tokyo, and Toronto have average lane widths of 2.80 to 3.25 meters (approximately 9.1 feet to 10.6 feet) and fatal crash rates of 1.3 to 3.2 per 100,000 population. Comparatively, the cities of New Delhi, Mumbai, Knoxville, Greensboro, New York City, and São Paulo have average lane widths of 3.25 to 3.60 meters (10.6 feet to 11.8 feet) and fatal crash rates of 6.1 to 11.8 per 100,000 population (Banerjee and Welle 2016).
Among case study locations, Helsinki was prominent in using lane narrowing as part of its Vision Zero initiative.
Left turns are “generally acknowledged to be the highest-risk movements at intersections” (Rice and Datta 2009). Approximately 27 percent of intersection crashes in the United States involve left turns.
At signalized intersections, a “permissive” signal mode is one in which the driver must wait for a break in opposing traffic to complete the turn. A “protected/permissive” mode is one in which the permissive phase is followed by an exclusive, protected left turn phase. The AAA Foundation for Traffic Safety identified protected/permissive signal phasing as a low-cost safety improvement as part of its Road Improvement Demonstration Program in Michigan. Protected/permissive left turn phasing was implemented at three intersections in Detroit and Grand Rapids. Total crashes and injury crashes were reduced at all locations, and targeted left-turn head-on collisions were eliminated from two locations and reduced at the third location. Cumulatively, head-on collisions were reduced by 84 percent, injury crashes by 58.9 percent, and total crashes by 32 percent per year. The cost to implement protected/permissive signal phasing, including equipment, was $25,000 per intersection (Rice and Datta 2009).
While protecting left turn movements is an improvement for vehicles, it is important to maintain safety for bicyclists and pedestrians. Pedestrian crossing distance should not be increased to protect left turn movements, and bicycle movements should be considered when changing signal phasing or lane markings.
Among case study locations, the Netherlands was prominent in using protected left turns as part of its Vision Zero initiative.
This section discusses several key Vision Zero strategies for bicycle and pedestrian infrastructure. As the Swedish and Dutch strategies stress, the most effective way to prevent bicycle and pedestrian crashes is to physically separate cyclists and pedestrians from vehicles. As such, these strategies reduce the amount of time that cyclists and pedestrians share the road with vehicles.
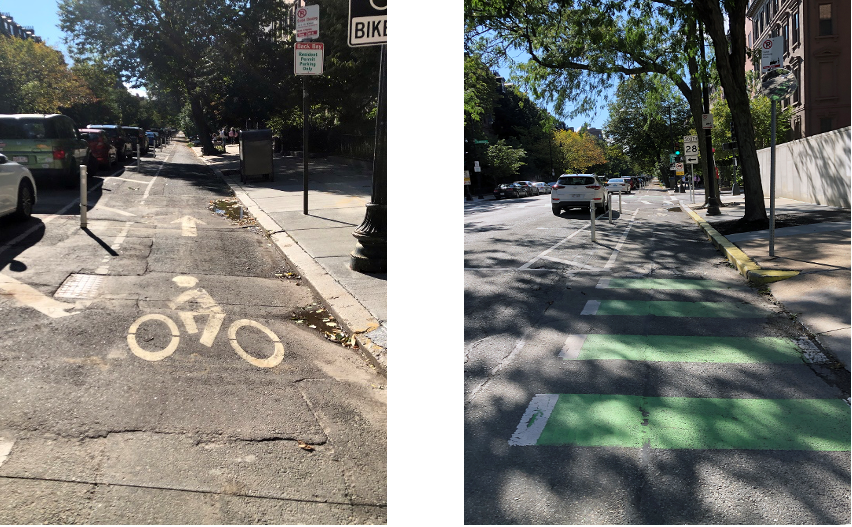
Separated bicycle lanes are roadway-adjacent facilities designed exclusively for use by people who bicycle. These lanes feature a vertical barrier that separates riders of bicycles from car traffic within the roadway. These facilities are different from bike lanes that are simply striped on the road and from lane markings, known as sharrows, which encourage cyclists and drivers to share the road.
Separating people who bicycle from car traffic results in less interaction between bikes and vehicles, thus reducing fatalities and injuries. If separated from on-street parking, they will also reduce the occurrence of “doorings” (when someone who bicycles collides with the door of a parked vehicle that has been opened into the bike lane). Dedicated facilities for cyclists can also reduce bicyclist and pedestrian interaction by discouraging bicyclists from sidewalk riding.
However, some benefits are less obvious. A 2018 University of Denver study found that cities with the highest percentage of protected and separated bicycle lanes saw 44 percent fewer roadway fatalities. This reduction in fatalities is not limited to cyclists; both pedestrians and driver fatalities are also reduced. The infrastructure required to separate people who bicycle from auto traffic also encourages safer driving, as separated bike lanes act as traffic calming devices, requiring vehicles to make wider and slower turns at intersections.
The University of Denver study found that sharrows do not give the same benefits as separated bike lanes. In some cities, sharrows were associated with an increase in roadway fatalities. In addition, networks of separated bike lanes provide a greater benefit than those limited to specific streets (Marshall, Ferenchak, and Janson, 2018).
Among case study locations, Sweden, Oslo, and the Netherlands were prominent in using separated bicycle lanes as part of their Vision Zero initiatives.
Reducing the time pedestrians spend in the roadway while crossing reduces pedestrian crash rates. The following strategies minimize interaction with vehicles and provide improved sight lines for both drivers and pedestrians.
Pedestrian crossing islands (PCI), or refuge islands, are typically installed on multilane roads, allowing pedestrians to wait for an opportunity to safely finish crossing the road. PCIs also allow pedestrians to focus on one direction of traffic when crossing the road and make pedestrians more visible to drivers. Their benefit is most apparent at multilane, uncontrolled crossing locations, though their installation should not be limited to such locations. Any location with high vehicle speeds or excessive crossing distances are potential candidates for PCIs.
PCIs can reduce pedestrian crashes by 32 percent and cost an average of $13,520 (FHWA 2018). The Pedestrian and Bicycle Information Center includes locations in 16 US cities as case studies for implementing PCIs as part of safety improvements at dangerous locations. Although the effectiveness of PCIs in these case studies is anecdotal, the general trend is positive. For example, the City of Norfolk, Virginia, installed mid-block PCIs as part of its Downtown Pedestrian Safety Program. Since the installation, no crashes have occurred in the location where several accidents, including a fatal crash, previously occurred (McGrane 2013).
Among case study locations, the Netherlands and Helsinki were prominent in using pedestrian crossing islands or narrow pedestrian crossings as part of their Vision Zero initiatives.
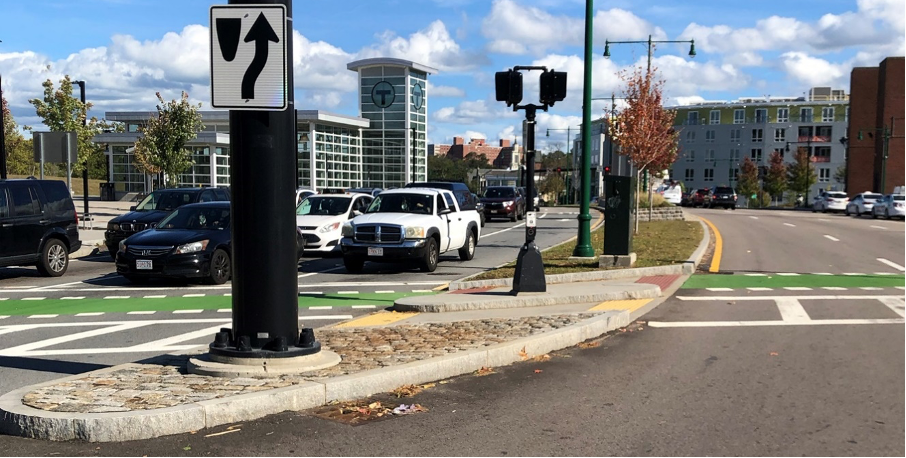
Curb extensions reduce pedestrian crossing distances by extending curb lines farther into the travel lane. Curb extensions can also act as traffic calming devices by narrowing travel lanes and reducing turning speeds; periodic curb extensions along a corridor are generally used to reduce vehicle speeds (Johnson 2005). Pedestrian visibility is increased on curb extensions, as pedestrians are brought farther into the travel lane and become more visible drivers.
Among case study locations, the Netherlands was prominent in using narrow pedestrian crossings as part of its Vision Zero initiative.
Advance stop lines and advance yield signs, particularly useful at unsignalized intersections, are typically placed 30 to 50 feet before a crosswalk. These methods have shown an increased rate of drivers yielding to pedestrians. Advance stop lines provide a benefit to pedestrians; when stopped immediately before a crosswalk, vehicles in the “near” lane obscure visibility of vehicles traveling in the same direction in the “far” lane, increasing the likelihood of conflict between pedestrians and vehicles (Johnson 2005).
Raised crosswalks bring crosswalks to the level of the sidewalk and encourage vehicles to slow and yield to pedestrians. They are typically 10 to 15 feet in width and, to stand out visually, can be painted in prominent colors and built from materials other than typical roadway pavement. Potential benefits of raised crosswalks are vehicle speed reduction, crash rate reduction (up to 45percent), better pedestrian visibility, vehicle yield compliance, and traffic volume reduction (ITE 2018).
Among case study locations, Sweden, the Netherlands, and Helsinki were prominent in using raised crosswalks as part of their Vision Zero initiatives.
This section describes various factors that influence the successful implementation of Vision Zero policies and strategies. Section 4.1 details the importance of public involvement, education, and outreach campaigns. Section 4.2 highlights data driven approaches. Section 4.3 discusses equity.
Public involvement is vital in developing Vision Zero Action Plans, especially in vulnerable communities. A Vision Zero task force, comprising a diverse range of stakeholders, should be established prior to the development of a Vision Zero action plan. This collaborative focus is demonstrated by the Vision Zero Task Force in New York City. The group is composed of 15 different local agencies and offices and is divided into four working groups, each representing different approaches to address Vison Zero (New York City 2019).
While Vision Zero emphasizes the importance of design, education and outreach efforts play an essential role in achieving zero roadway fatalities. In fact, the Vision Zero advocacy group Vision Zero Network lists “utilize impactful education strategies” as one of the initiative’s four primary actionable strategies (Vision Zero Network 2017b). However, a comprehensive Vision Zero communications strategy is much broader than a marketing slogan. An effective Vision Zero education and outreach approach uses data to target specific audiences and geographies (Vision Zero Network 2016).
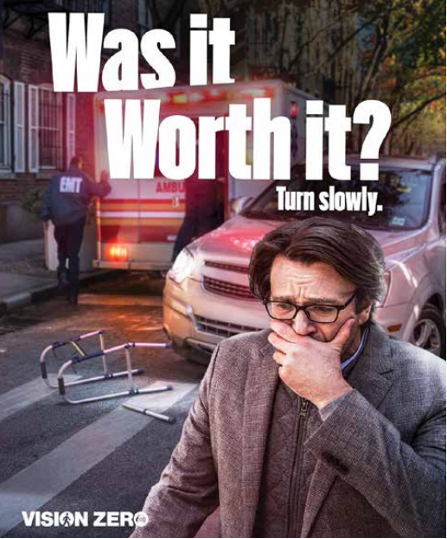
Material targeting young male drivers in New York City from the “Was it Worth it?” campaign resulting from market research.
Two early adopters of Vision Zero in the United States, New York City and San Francisco, have both adopted comprehensive communication strategies as a part of their Vision Zero campaigns (New York City 2020; Vision Zero SF 2019). In fact, the New York City approach explicitly derived components from the Click It or Ticket campaigns by combining targeted media and enforcement efforts (Vision Zero Network, 2016). New York City uses accident data to direct advertisements and social media materials at particular demographics (such as young male drivers) in high-incident neighborhoods to maximize the efficiency of its Vision Zero communication resources. Highly visible Street Teams accompany media materials who directly engage locals and distribute educational material unique to each area. Since beginning New York City’s Vision Zero campaign in 2013, Vision Zero has become well
Material from San Francisco’s “Safe Streets SF” campaign targeting moderate speeding.
San Francisco has followed many of the same targeted media and enforcement strategies as New York City, albeit on a smaller scale (Vision Zero SF 2019). However, San Francisco places a larger emphasis on addressing speeding. At the center of its “Safe Streets SF” campaign is reducing moderate speeding in 25 mph zones rather than a vague appeal to violators everywhere to “slow down.” San Francisco’s targeted appeal is based on pedestrian fatality data that indicates a vehicle impact at 30 mph is twice as likely to kill a pedestrian compared to 25 mph (Vision Zero SF 2019).
Any long-term Vision Zero intervention requires ongoing data collection, monitoring, and analysis. This effort is necessary to quickly and accurately identify crash hotspots and prioritize areas with the greatest need for Vision Zero implementation. To effectively measure the impact of Vision Zero strategies, these areas will require continuous monitoring. Crash data, with a focus on crashes, including fatalities and injuries, can be used to identify priority areas and determine which Vision Zero strategies will be most beneficial. Crash data are generally provided by police departments. These data will not account for unreported crashes. Some inroads have been made toward expanding the dataset used for identifying high-risk areas. As described in the case study of Sweden, supplementing police crash data with hospital injury data can lead to improved datasets. A 2011 study using both police data and hospital data to analyze motorcycle crashes in New Zealand showed that linking these data sets “has the potential to provide insights into motorcycle crash circumstances and outcomes not otherwise obtainable” (SJ Wilson, Begg, and Samaranayaka 2012). In developing its Vision Zero High Injury Network, the San Francisco Department of Public Health used linked police and hospital data to analyze spatial patterns of severe accidents (Vision Zero SF 2019). US Strategic Highway Safety Plan and related Highway Safety Improvement Program funding have also emphasized the connection between hospital injury data and police crash data. Although the efficacy of this methodology is not well documented because of limited usage to date, further exploration is merited. Vital crash data should not be the sole method of determining problematic locations and measuring the impact of Vision Zero implementation. Community engagement is essential in identifying unreported systemic issues, especially in areas where police and hospital data may be less reliable.
A proactive approach to identifying areas for safety improvements can extend beyond studying high-crash locations. Seattle’s Bicycle and Pedestrian Safety Analysis studied not only where crashes occur, but also which types of crashes occur, the factors involved, and the average severity of different crash types. Rather than only address issues at high-crash locations, the Bicycle and Pedestrian Safety Analysis allows the City to identify locations with factors associated with identified crash types (SDOT 2016).
Since its inception, the ethos of Vison Zero has been that “[no one] shall be killed or seriously injured as a consequence of accidents in road traffic.” Every person deserves the same benefits that Vision Zero provides, including vulnerable and historically marginalized populations. Safety improvements are frequently most needed in low-income communities. A 2012 study of the United States found that 89 percent of streets in high-income communities have sidewalks, compared to 49 percent of streets in low-income communities. This disparity also applies to lighting, traffic calming features, and striped crosswalks (Bridging the Gap 2012).
Some planners, researchers, and bicycle/pedestrian activists have publicly stated concerns that Vision Zero needs more work to apply equitably in a US context. Planner and advocate Tamika Butler argues that “Vision Zero was invented in a European country far more homogeneous than the United States...Do we look to Europe for solutions that gloss over our structural and institutional racism, or do we push ourselves out of the ‘best practice’ comfort zone to confront how transportation plays a role in our nation’s most deep-seated problems?” (Butler 2018) Adonia Lugo, a self-styled “bicycle anthropologist,” listed four concerns in 2015 with mainstream Vision Zero thinking in the United States (Lugo 2015):
In a 2018 interview, Lugo critiqued Vision Zero’s tendency to “look around the world for models for where they have made things more energy efficient or where they’ve decreased the cases of people being killed on bikes, and then bring those models to whatever city you’re talking about. That mentality unfortunately treats cities as though they are homogenous, as if the populations in them are going to relate to street design changes in the same predictable way” (Misra 2018). For example, populations with traumatic communal memories of urban renewal or freeway construction may distrust transportation investment conceived without their involvement.
Instead of focusing solely on infrastructure, Lugo suggests tying Vision Zero implementation to tangible social and safety improvements for marginalized communities, so that the members of those communities can see that they will benefit. This view of Vision Zero sees physical infrastructure as necessary but insufficient: “Street design elements such as bike lanes, paths, and signage contribute to experiences of bicycling but do not determine them, considering how much diversity there is in who is riding...Transportation choices are made in a politically charged landscape where race, gender, class, ability, and migration status limit freedom of mobility” (McCullough, Lugo, and van Stokkum 2019). Charles Brown of the Voorhees Transportation Center and the Bloustein School of Planning and Public Policy at Rutgers University writes that “too often design preferences and solutions are traffic safety-rich and personal safety-bankrupt,” which he attributes in part to “reliance on crash statistics to ascertain the safety of a particular roadway or corridor” (Noland et al. 2017). In particular, this equity-based approach to Vision Zero emphasizes the importance of understanding and ameliorating the threats to personal safety that disproportionately affect people of color as they bike and walk, including crime and racial profiling by police. Indeed, this movement has caused some Vision Zero-supportive organizations to remove “enforcement” as one of the priorities of Vision Zero (Brasuell 2020).
While the movement for a more equitable Vision Zero in the US context may catch headlines with its critique of infrastructure-based planning, it is not a movement for vehicular cycling (bike users treating the roadways as if they are a motor vehicle), but more of a movement for thinking critically about infrastructure and other elements such as social empowerment. A survey- and focus group-based research report on barriers to cycling in Black and Hispanic communities in New Jersey found that the “three biggest barriers to bicycling for all respondents are fear of a traffic collision, fear of robbery and assault, and pavement condition. Other notable barriers include fear of being stranded with a broken bicycle, and fear of being profiled by the police” (Brown 2016). Addressing that combination of barriers requires a combination of infrastructural and non-infrastructural approaches. Ultimately, making Vision Zero work in a US context may require adapting some of the principles learned from its originators to reflect the uniquely fragmented and racialized nature of transportation challenges in this country.
This memorandum summarizes research on Vision Zero strategies, with the aim of familiarizing MPO members and stakeholders with Vision Zero concepts and lessons learned from application of the paradigm around the world. The methods and lessons we document here are perhaps more important in 2020 than ever before. The COVID-19 pandemic has, in the short term, decreased traffic on US roadways, with a variety of side effects. Decreased roadway congestion has apparently led drivers to engage in riskier behavior, including speeding, failing to wear seat belts, and driving under the influence of drugs or alcohol, and a consequent increase in death rates (Shapardson 2020). In Massachusetts, an initial analysis found that by May 2020 traffic had dropped 50 percent, but roadway fatality rates had doubled (Enwemeka 2020). These numbers demonstrate how roadway design matters: empty roadways designed for high speeds invite dangerous driver behavior. On the other hand, with fewer commuters on the roads, municipalities have taken the opportunity to repurpose road space to build new facilities that could help achieve Vision Zero goals. As of fall 2020, the City of Boston is in the middle of implementing permanent protected bike lanes around the Boston Common and the Public Garden (Vaccaro 2020). Boston is also continuing its Neighborhood Slow Streets program, which allows neighborhoods to reduce the speed limit on residential streets to 20 mph (City of Boston 2018). The Massachusetts Department of Transportation (MassDOT) allocated up to $10 million for a Shared Streets and Spaces Program that supports projects in the following areas (Commonwealth of Massachusetts 2020):
While the long-term effects of the pandemic on transportation patterns remain uncertain, developments during the duration of the crisis offer both lessons and a potential opportunity to reset discussions about roadway usage and design.
Any progress from the current moment of crisis will require a clear-eyed evaluation of the barriers to adoption of Vision Zero in the United States. The basic tenets of Vision Zero are fairly well established in northern Europe and the case studies show that physical interventions and design changes are successful in reducing serious injuries and deaths. The experts interviewed for this study emphasized that the physical roadway interventions and design principles that represent a key—albeit not the only—part of Vision Zero are known and can, in theory, be applied to US roadways. However, US social and governance contexts are different, not in a way that completely impedes Vision Zero efforts, but in a way that raises additional questions.
Bicycle infrastructure—ideally protected from motor vehicles—is arguably the flagship intervention associated with Vision Zero in the United States, even if it has not been implemented anywhere at the same scale and quality as in the Netherlands. In an environment currently more dominated by cars than the case studies presented here from Northern Europe, Vision Zero implementation in the United States calls for a variety of interventions designed to make dangerous roadways safer for all users. Experts interviewed for this study identified banning of permitted left turns in favor of protected ones as one of their highest priorities for the United States and the Boston region in particular.
Other successful design changes highlighted in the case studies included making sure that pedestrians are not forced to cross more than two lanes at a time (via the introduction of crossing islands, if necessary); slowing of traffic on local (“access,” in the Dutch classification scheme) roadways via speed bumps, lane narrowing, and other physical interventions; and introducing a greater number of roundabouts at both the neighborhood and large-intersection scale. In addition, ASE is a tool that has been successful at reducing vehicle speeds in many locations. Municipalities pursuing Vision Zero policy implementation in Massachusetts would have an additional tool available if the legislature enacts Senate Bill S.2553.
The element linking this list to high-priority interventions is the need to slow traffic. This is unsurprising given the core tenets of Vision Zero (and Sustainable Safety in the Netherlands), but it is something of a radical shift from traditional patterns of traffic planning in the United States, which have emphasized throughput and speed. Swedish and Dutch transportation planning do not abandon these priorities, but rather emphasize that they should be kept in their proper place, i.e., on “flow” roads that either are not used by people walking or bicycling or are equipped with separated pedestrian and bicycle infrastructure. Where potential conflicts coexist, safety must be paramount, and the pedestrian and bike rider must come first. A commitment to this principle is necessary up and down the chain of responsibility. It is, ultimately, a question of governance.
Successful Vision Zero implementations have changed the focus of traffic safety to reducing fatalities and serious injuries instead of reducing collisions. In some cases, crashes have remained constant or even risen while fatalities have reduced (as seen in the Netherlands case study). Eliminating crashes may not be feasible, but reducing their severity through speed reduction and roadway geometry that prevents serious crashes (like head on collisions) can reduce or eliminate deaths and serious injuries.
Vision Zero in Sweden and Sustainable Safety in the Netherlands are unified programs that rely on close cooperation between all levels of government, something that is notoriously difficult to achieve in the United States. As Portland, Oregon’s experience shows, even local jurisdictions that want to commit to Vision Zero sometimes lack authority over their own roadways and must get buy-in from state departments of transportation. Our interviewees also indicated that gaining commitment from career officials has been a barrier (although a solvable one) for Vision Zero jurisdictions in the United States. While the impetus for Vision Zero in northern Europe has been largely top-down, pressure for adoption of the approach has come from a variety of different sectors in the United States, including career staff, advocates, and activist elected officials. Boston Region MPO stakeholders are well aware of the region’s own challenges relating to fragmentation of governance and responsibility.
Finally, as this memorandum documents, concerns of racial equity are paramount in the United States, especially with regard to the enforcement element of Vision Zero. Communities should ensure equitable enforcement of any Vision Zero policy through education and training and data collection and analysis.
Given all of these differences from the international context, it is perhaps not surprising that, as this memorandum indicates, outcomes from Vision Zero efforts in the United States have been mixed at best. Jurisdictions such as New York City, San Francisco, and Portland have had difficulty meeting the goals defined in their action plans. While the Vision Zero branding has spread somewhat widely within the United States, actual implementation of the physical and design principles seems to lag somewhat, perhaps leading to mixed or disappointing outcomes. While branding can be important in successful jurisdictions—see Vision Zero in Sweden or Sustainable Safety in the Netherlands—in those places it has fed directly into an institutional culture of cooperation and commitment to the cause of safety. In Helsinki, the systematic traffic safety initiative is not branded—it is simply what is done.
Perhaps as much as the specifics of roundabouts or protected left turns or raised crosswalks, then, the most important (and original) message of Vision Zero is that the owners and managers of the system are responsible for the safety of all users. Supporting this idea, a recent ruling in the Turturro v. City of New York case held that the City of New York was largely responsible for a crash that caused a serious injury to a person riding a bicycle because it had not redesigned the street to make it safer (Aaron 2017). Successful implementation of technical measures flows from acceptance of this responsibility by managers. Pedestrian and bicycle safety advocates, including the Vision Zero Network, have fought in recent years for media and roadway managers, including police departments, to adopt the language of “crash, not accident,” transferring onus for the incident from user to manager (Vision Zero Network 2018a). It is that commitment that represents the core practice of Vision Zero, parallel to the implementation of physical interventions.
Aaron, Brad. 2017. “State’s Highest Court Holds NYC Liable for Injuries on Street Without Traffic Calming.” STreetsBlogNYC. https://nyc.streetsblog.org/2017/01/05/states-highest-court-holds-nyc-liable-for-injuries-on-streets-without-traffic-calming/
Abonour, Rabi, and Jessica Roberts. 2018. “Vision Zero’s Enforcement Problem - Using Community Engagement to Craft Equitable Traffic Safety Strategies.” Alta Planning + Design. https://altago.com/wp-content/uploads/Vision_Zero_Report_v5.pdf.
Allen, Charles, Anita Bonds, Robert White, Kenyan McDuffie, Brianne Nadeau, David Grosso, Elissa Silverman, et al. 2020. Vision Zero Enhancement Omnibus Amendment Act of 2020. https://lims.dccouncil.us/Legislation/B23-0288.
An Act Relative to Automated Enforcement. 2020. S.2553. https://malegislature.gov/Bills/191/S2553/BillHistory.
Asante, Seth, and Efi Pagitsas. 2013. “Roundabout Installation Screening Tool.” Boston Region Metropolitan Planning Organization. https://www.ctps.org/roundabout_tool.
Banerjee, Subha Ranjan, and Ben Welle. 2016. “Bigger Isn’t Always Better: Narrow Traffic Lanes Make Cities Safer.” World Resources Institute (WRI). https://www.wri.org/blog/2016/12/bigger-isnt-always-better-narrow-traffic-lanes-make-cities-safer.
Belin, Matts-Åke, Per Tillgren, and Evert Vedung. 2012. “Vision Zero—a Road Safety Policy Innovation.” International Journal of Injury Control and Safety Promotion 19 (2): 171–79. https://doi.org/10.1080/17457300.2011.635213.
Bersin, Angela. 2018. “Top 10 Most Bike-Friendly Cities.” Bikabout.com, July 11, 2018. http://www.bikabout.com/blog/top-10-most-bike-friendly-cities
Brasuell, James. 2020. “Vision Zero...Without the Enforcement.” Planetizen, June 11, 2020. https://www.planetizen.com/news/2020/06/109591-vision-zerowithout-enforcement.
Bridging the Gap. 2012. “Income Disparities in Street Features That Encourage Walking.” Bridging the Gap Research Program. http://www.bridgingthegapresearch.org/_asset/02fpi3/btg_street_walkability_FINAL_03-09-12.pdf.
Brown, Charles. 2016. “Fear: A Silent Barrier to Bicycling in Black and Hispanic Communities.” Institute of Transportation Engineers (ITE). https://nacto.org/wp-content/uploads/2017/03/2016_Brown_Fear-A-Silent-Barrier-to-Bicycling-in-Black-and-Hispanic-Communities.pdf.
Butler, Tamika. 2018. “Safe Roads for All?” Medium.com. April 2018. https://medium.com/@connectwithtamika/safe-roads-for-all-7e15c215b372.
Cathcart-Keays, Athlyn. 2017. “Oslo’s Car Ban Sounded Simple Enough. Then the Backlash Began.” The Guardian, June 13, 2017. http://www.theguardian.com/cities/2017/jun/13/oslo-ban-cars-backlash-parking.
Chinn, Hannah, and Wesley Lapointe. 2019. “Blindsided - Portland Spends Millions to Stop Cars from Killing People. It’s Not Working.” Willamette Week, 2019. https://www.wweek.com/blindsided/.
City of Boston. 2018. “Neighborhood Slow Streets - Information for Communities Interested in Applying.” City of Boston. https://www.boston.gov/sites/default/files/imce-uploads/2018-06/2018_neighborhood_slow_streets_slide_deck_-_dark.pdf.
City of Denver. 2017. “Denver Vision Zero Action Plan.” City of Denver. https://www.denvergov.org/content/dam/denvergov/Portals/705/documents/visionzero/Denver-Vision-Zero-Action-Plan.pdf
City of Helsinki. 2019. “Traffic Safety.” City of Helsinki. https://www.hel.fi/helsinki/en/maps-and-transport/streets-traffic/safety/.
City of Portland. 2016. “Vision Zero Action Plan - Saving Lives with Safe Streets.” City of Portland. https://www.portland.gov/sites/default/files/2020-04/vision-zero-action-plan.pdf.
———. 2019. “Saving Lives with Safe Streets - Portland Vision Zero 2-Year Update.” City of Portland. https://www.portland.gov/sites/default/files/2020-05/portland-vision-zero-2-year-update.pdf.
City of San Francisco. 2020. “Traffic Fatalities.” City of San Francisco. https://sfgov.org/scorecards/transportation/traffic-fatalities.
Commonwealth of Massachusetts. 2020. “MassDOT Announces Over $1 Million in Final Grant Round of Shared Streets & Spaces Program.” Commonwealth of Massachusetts. https://www.mass.gov/news/massdot-announces-over-1-million-in-final-grant-round-of-shared-streets-spaces-program.
Enwemeka, Zeninjor. 2020. “Amid Pandemic, Traffic Fell 50% But Roadway Death Rate Doubled.” WBUR, May 4, 2020. https://www.wbur.org/bostonomix/2020/05/04/massachusetts-roadway-deaths-coronavirus.
FHWA. 2006. “University Course on Bicycle and Pedestrian Transportation - Lesson 20: Traffic Calming.” FHWA-HRT-05-133. Federal Highway Administration (FHWA). https://www.fhwa.dot.gov/publications/research/safety/pedbike/05085/pdf/lesson20lo.pdf.
———. 2018. “Pedestrian Refuge Island: Safe Transportation for Every Pedestrian Countermeasure Tech Sheet.” FHWA-SA-18-062. Federal Highway Administration (FHWA). https://safety.fhwa.dot.gov/ped_bike/step/docs/techSheet_PedRefugeIsland2018.pdf.
———. 2019. “Vision Zero in Portland.” FHWA-SA-19-008. US Department of Transportation - Federal Highway Administration (FHWA). https://safety.fhwa.dot.gov/zerodeaths/vz_portland/fhwasa19008.pdf.
Fitzsimmons, Emma G. 2019. “Traffic Deaths in New York City Drop to 200, a Record Low.” The New York Times, January 1, 2019. https://www.nytimes.com/2019/01/01/nyregion/traffic-deaths-decrease-nyc.html.
Forbes, Gerald J., Teresa Gardner, Hugh McGee, and Raghavan Srinivasan. 2012. “Methods and Practices for Setting Speed Limits: An Informational Report.” FHWA-SA-12-004. Federal Highway Administration. https://safety.fhwa.dot.gov/speedmgt/ref_mats/fhwasa12004/fhwasa12004.pdf.
Furth, Peter G. 2015. “The Dutch ‘Vision Zero’ Program for Traffic Safety: What Has It Meant There? How Would It Apply in Boston?” Presented at the Vision Zero Boston Task Force, Boston City Hall. http://www.northeastern.edu/peter.furth/wp-content/uploads/2015/06/Sustainable-Safety-for-Boston.pdf.
Gormley, Shannon. 2020. “In a New Report, Metro Acknowledges That a Multi-Million Dollar Vision Zero Plan Isn’t Working.” Willamette Week, March 7, 2020. https://www.wweek.com/news/2020/03/07/in-a-new-report-metro-acknowledges-that-its-multi-million-dollar-vision-zero-plan-isnt-working/.
Hedlund, James H., Barbara Harsha, and Katherine R. Hutt. 2005. “Countermeasures That Work: A Highway Safety Countermeasure Guide For State Highway Safety Offices.” Governors Highway Safety Association. https://www.ems.gov/pdf/GHSA-Countermeasures.pdf.
HSL. 2019. “Liikkumistottumukset Helsingin Seudulla 2018 (Mobility Habits in the Helsinki Region 2018).” Helsingin seudun liikenne, HSL (Helsinki Regional Transport Authority). https://www.hsl.fi/sites/default/files/hsl_julkaisu_9_2019_netti.pdf.
Hu, Wen, and Anne T. McCartt. 2015. “Effects of Automated Speed Enforcement in Montgomery County, Maryland, on Vehicle Speeds, Public Opinion, and Crashes.” Insurance Institute for Highway Safety (IIHS). https://nacto.org/wp-content/uploads/2016/04/4-2_Hu-McCartt-Effects-of-Automated-Speed-Enforcement-in-Montgomery-County-Maryland-on-Vehicle-Speeds-Public-Opinion-and-Crashes_2015.pdf.
ITE. 2018. “Traffic Calming Fact Sheets: Speed Table/Raised Crosswalks.” Institute of Transportation Engineers (ITE). https://www.ite.org/pub/?id=2c8edbfb%2D0c48%2Db1f3%2Dc506%2D9e8e72dd3992.
Johnson, Randal S. 2005. “Pedestrian Safety Impacts of Curb Extensions: A Case Study.” SPR 304-321. Oregon State University. https://nacto.org/wp-content/uploads/2015/04/pedestrian_safety_impacts_of_curb_extensions_randal.pdf.
Lazo, Luz. 2020. “D.C. Council Unanimously Approves Vision Zero Bill Aimed at Reducing Traffic Fatalities.” The Washington Post, September 22, 2020. https://www.washingtonpost.com/local/trafficandcommuting/dc-council-to-vote-on-vision-zero-bill-aimed-at-reducing-traffic-fatalities/2020/09/21/312ffa94-fa65-11ea-be57-d00bb9bc632d_story.html.
Lisinski, Chris. 2020. “State Senators Throw up Caution Flag on Red Light Bill.” Dorchester Reporter, March 5, 2020, State House News Service edition. https://www.dotnews.com/2020/state-senators-throw-caution-flag-red-light-bill.
Lugo, Adonia. 2015. “Unsolicited Advice for Vision Zero.” Urbanadonia. September 30, 2015. http://www.urbanadonia.com/2015/09/unsolicited-advice-for-vision-zero.html.
Marshall, Wesley E., Nick Ferenchak, and Bruce Janson. 2018. “Why Are Bike-Friendly Cities Safer for All Road Users?” MPC 18-351. Mountain-Plains Consortium. https://www.ugpti.org/resources/reports/downloads/mpc18-351.pdf.
MassDOT. 2020a. “Guidelines for the Planning and Design of Roundabouts.” Massachusetts Department of Transportation (MassDOT). https://www.mass.gov/doc/massdot-guidelines-for-the-planning-and-design-of-roundabouts/download.
———. 2020b. “Rotary Retrofits White Paper.” Massachusetts Department of Transportation (MassDOT). https://www.mass.gov/doc/massdot-rotary-retrofits-white-paper/download.
McCullough, Sarah R., Adonia Lugo, and Rebecca van Stokkum. 2019. “Making Bicycling Equitable: Lessons from Sociocultural Research.” qt37s8b56q. Institute of Transportation Studies, UC Davis. https://ideas.repec.org/p/cdl/itsdav/qt37s8b56q.html.
McGrane, Ann. 2013. “Pedestrian Safety Initiatives.” (PEDSAFE) FHWA-SA-04-003. University of North Carolina Highway Safety Research Center. http://pedbikesafe.org/PEDSAFE/casestudies_detail.cfm?CM_NUM=47&CS_NUM=104.
Misra, Tanvi. 2018. “Bike Advocacy’s Blind Spot.” Bloomberg News, July 19, 2018. https://www.bloomberg.com/news/articles/2018-07-19/for-bike-equity-look-past-infrastructure.
NCHRP. 2010. “NCHRP Report 672 – Roundabouts: An Informational Guide, Second Edition.” 672. National Cooperative Highway Research Program - Federal Highway Administration (NCHRP). https://nacto.org/docs/usdg/nchrprpt672.pdf.
New York City. 2015. “Vision Zero One Year Report.” New York City. https://www1.nyc.gov/assets/visionzero/downloads/pdf/vision-zero-1-year-report.pdf.
———. 2019. “Vision Zero Task Force | About.” NYC.gov. 2019. https://www1.nyc.gov/content/visionzero/pages/vision-zero-task-force.
———. 2020. “Vision Zero Year 6 Report.” New York City. https://www1.nyc.gov/assets/visionzero/downloads/pdf/vision-zero-year-6-report.pdf.
Noland, Robert B., James A. Sinclair, Nicholas J. Klein, and Charles Brown. 2017. “How Good Is Pedestrian Fatality Data?” Journal of Transport & Health 7 (December): 3–9. https://doi.org/10.1016/j.jth.2017.04.006.
Phillips, Claire, and Corina Monzón. 2015. “Automated Speed Enforcement Implementation: Survey Findings and Lessons Learned From Around the Country.” City and County of San Francisco. https://sfcontroller.org/sites/default/files/FileCenter/Documents/6928-Automated%20Speed%20Enforcement%20Implementation%20-%20Survey%20Findings%20and%20Lessons%20Learned%20From%20Around%20the%20Country.pdf.
Rice, Ed, and Tapan K. Datta. 2009. “Permissive/Protected Left-Turn Phasing: Intersection Safety Case Study.” FHWA-SA-09-015. Federal Highway Administration (FHWA). https://safety.fhwa.dot.gov/intersection/conventional/signalized/case_studies/fhwasa09015/#:~:text=Left%2Dturning%20movements%20are%20generally,at%20signalized%20intersections%5B1%5D.
SDOT. 2016. “City of Seattle Bicycle and Pedestrian Safety Analysis.” Seattle Department of Transportation (SDOT).
Shahum, Leah. 2017. “Safe Streets: Insights on Vision Zero Policies from European Cities.” 27. German Marshall Fund of the United States (GMF). https://www.jstor.org/stable/pdf/resrep18873.pdf.
Shepardson, David. 2020. “U.S. Traffic Deaths Fell after Coronavirus Lockdown, but Drivers Got Riskier.” Reuters, October 1, 2020. https://www.reuters.com/article/us-health-coronavirus-usa-traffic-exclus-idUSKBN26M6KR.
Statistics Norway. 2020a. “Personer Drept Eller Hardt Skadd I Veitrafikkulykker [Persons Killed or Severely Injured in Road Traffic Accidents] 1946 - 2019.” 12043. Statistisk sentralbyrå (SSB) [Statistics Norway]. https://www.ssb.no/statbank/table/12043/tableViewLayout1/.
———. 2020b. “Trafikkulykker Med Personskade - Oslo Fylke [Traffic Accidents with Personal Injury - Oslo County].” 09006. Statistisk sentralbyrå (SSB) [Statistics Norway]. https://www.ssb.no/statbank/table/09006/tableViewLayout1/
SWOV. 2018. “Sustainable Safety 3rd Edition – The Advanced Vision for 2018-2030; Principles for Design and Organization of a Casualty-Free Road Traffic System.” 17085. SWOV Institute for Road Safety Research. https://www.swov.nl/en/file/17226/download?token=oVpYyW94.
Tefft, Brian C. 2013. “Impact Speed and a Pedestrian’s Risk of Severe Injury or Death.” Accident; Analysis and Prevention 50 (January): 871–78. https://doi.org/10.1016/j.aap.2012.07.022.
Teivainen, Aleksi. 2020. “Two Years Has Now Passed since a Pedestrian Last Died in Road Accident in Helsinki.” Helsinki Times, May 5, 2020. https://www.helsinkitimes.fi/finland/finland-news/domestic/17627-two-years-has-passed-now-since-a-pedestrian-last-died-in-road-accident-in-helsinki.html.
Tingvall, Claes, and Narelle Haworth. 1999. “Vision Zero - An Ethical Approach to Safety and Mobility.” In 6th ITE International Conference Road Safety & Traffic Enforcement: Beyond 2000. eprints.qut.edu.au. https://eprints.qut.edu.au/134991/3/134991.pdf.
Tison, Julie, Allan F. Williams, and Preusser Research Group, Inc. 2010. “Analyzing the First Years of the Click It or Ticket Mobilizations.” DOT HS 811 232. United States. Department of Transportation. National Highway Traffic Safety Administration. https://rosap.ntl.bts.gov/view/dot/1896.
Vaccaro, Adam. 2020. “Boston to Make New Downtown Bike Network Permanent.” The Boston Globe, September 14, 2020. https://www.bostonglobe.com/2020/09/15/metro/boston-make-new-downtown-bike-network-permanent/.
Vasudevan, Vinod, Shashi S. Nambisan, Ashok K. Singh, and Traci Pearl. 2009. “Effectiveness of Media and Enforcement Campaigns in Increasing Seat Belt Usage Rates in a State with a Secondary Seat Belt Law.” Traffic Injury Prevention 10 (4): 330–39. https://doi.org/10.1080/15389580902995190.
Vision Zero Network. 2016. “Communications Strategies to Advance Vision Zero.” Vision Zero Network. https://visionzeronetwork.org/wp-content/uploads/2016/07/vzn-case-study-communications-strategies.pdf.
———. 2017a. “Moving from Vision to Action: Fundamental Principles, Policies & Practices to Advance Vision Zero in the U.S.” Vision Zero Network. http://visionzeronetwork.org/wp-content/uploads/2017/01/MinimumElements_Final.pdf.
———. 2017b. “Vision, Strategies, Action: Guidelines for an Effective Vision Zero Action Plan.” Vision Zero Network. https://visionzeronetwork.org/wp-content/uploads/2017/12/VZN_ActionPlan_FINAL.pdf.
———. 2018a. “#CrashNotAccident - Commit to Crash Not Accident.” Visionzeronetwork. 2018. https://visionzeronetwork.org/about/pledge/.
———. 2018b. “Taming Speed for Safety - A Defining Approach and Leadership from Portland, Oregon.” Vision Zero Network. https://visionzeronetwork.org/wp-content/uploads/2018/03/0314_CaseStudy_Speed_FINAL.pdf.
Vision Zero SF. 2019. “Vision Zero Action Strategy: Eliminating Traffic Deaths in San Francisco.” Vision Zero SF. https://www.visionzerosf.org/wp-content/uploads/2019/04/VZAS_040419_web.pdf.
Walker, Alissa. 2020. “Oslo Has Virtually Eliminated Pedestrian and Cyclist Deaths.” Curbed. January 3, 2020. https://archive.curbed.com/2020/1/3/21048066/oslo-vision-zero-pedestrian-cyclist-deaths.
Walker, Alissa. 2020. “This Spring, We All Drove Much Less. Yet Traffic Deaths Went Up. Why?”. Curbed. October 15, 2020. https://www.curbed.com/2020/10/covid-traffic-deaths-up-speeding.html.
Wegman, Fred, Atze Dijkstra, Govert Schermers, and Pieter van Vliet. 2006. “Sustainable Safety in the Netherlands: Evaluation of National Road Safety Program.” Transportation Research Record Journal of the Transportation Research Board 1969 (1): 72–78. https://doi.org/10.3141/1969-12.
Weijermars, Wendy, and Fred Wegman. 2011. “Ten Years of Sustainable Safety in the Netherlands: An Assessment.” Transportation Research Record 2213 (1): 1–8. https://doi.org/10.3141/2213-01.
Wilson, Kea. 2020. “Another City Eliminated Non-Driver Deaths In 2019.” StreetsBlog USA, February 11, 2020. https://usa.streetsblog.org/2020/02/11/another-city-eliminated-non-driver-deaths-in-2019/.
Wilson, Suzanne J., Dorothy J. Begg, and Ari Samaranayaka. 2012. “Validity of Using Linked Hospital and Police Traffic Crash Records to Analyse Motorcycle Injury Crash Characteristics.” Accident; Analysis and Prevention 49 (November): 30–35. https://doi.org/10.1016/j.aap.2011.03.007.
Yli-Seppälä, Jussi. 2020. “City Snapshot: Prioritising Safety in Helsinki’s Transport Strategies.” Intelligent Transport, March 2020. https://www.intelligenttransport.com/transport-articles/97463/city-snapshot-prioritising-safety-in-helsinkis-transport-strategies/.
The Boston Region Metropolitan Planning Organization (MPO) operates its programs, services, and activities in compliance with federal nondiscrimination laws including Title VI of the Civil Rights Act of 1964 (Title VI), the Civil Rights Restoration Act of 1987, and related statutes and regulations. Title VI prohibits discrimination in federally assisted programs and requires that no person in the United States of America shall, on the grounds of race, color, or national origin (including limited English proficiency), be excluded from participation in, denied the benefits of, or be otherwise subjected to discrimination under any program or activity that receives federal assistance. Related federal nondiscrimination laws administered by the Federal Highway Administration, Federal Transit Administration, or both, prohibit discrimination on the basis of age, sex, and disability. The Boston Region MPO considers these protected populations in its Title VI Programs, consistent with federal interpretation and administration. In addition, the Boston Region MPO provides meaningful access to its programs, services, and activities to individuals with limited English proficiency, in compliance with U.S. Department of Transportation policy and guidance on federal Executive Order 13166. The Boston Region MPO also complies with the Massachusetts Public Accommodation Law, M.G.L. c 272 sections 92a, 98, 98a, which prohibits making any distinction, discrimination, or restriction in admission to, or treatment in a place of public accommodation based on race, color, religious creed, national origin, sex, sexual orientation, disability, or ancestry. Likewise, the Boston Region MPO complies with the Governor's Executive Order 526, section 4, which requires that all programs, activities, and services provided, performed, licensed, chartered, funded, regulated, or contracted for by the state shall be conducted without unlawful discrimination based on race, color, age, gender, ethnicity, sexual orientation, gender identity or expression, religion, creed, ancestry, national origin, disability, veteran's status (including Vietnam-era veterans), or background. A complaint form and additional information can be obtained by contacting the MPO or at http://www.bostonmpo.org/mpo_non_discrimination. To request this information in a different language or in an accessible format, please contact Title VI Specialist |
1 There were initially three principles; two more were introduced more recently.