![]()
Appendix A: Project Prioritization and Scoring
Appendix B: Greenhouse Gas Monitoring and Evaluationn
Appendix C: Public Engagement and Comments
Appendix D: Geographic Distribution of TIP Funding
Appendix E: Regulatory and Policy Framework
Appendix F: Boston Region Metropolitan Planning Organization Membership
Appendix G: Operations and Maintenance Summary
As described in Chapter 2, the Transportation Improvement Program (TIP) development and project prioritization and funding process consists of numerous phases and is supported by several different funding sources. This appendix includes information about transportation projects that the Boston Region Metropolitan Planning Organization (MPO) considered for funding through the Highway Discretionary (Regional Target) Program in the federal fiscal years (FFYs) 2024–28 TIP.
To be considered for funding by the MPO, a project must fulfill certain basic criteria. Projects evaluated through the MPO’s Bicycle Network and Pedestrian Connections, Complete Streets, Intersection Improvements, and Major Infrastructure investment programs must meet these criteria:
For projects evaluated through the MPO’s Community Connections Program, the following criteria apply:
If a project meets the above criteria, it is presented to the MPO board in the Universe of Projects (Table A-1) to be considered for funding. This project list is presented to the MPO board in November and provides a snapshot of information available on projects at that stage in the TIP development. Some projects that get evaluated for funding may not appear in the Universe, as more project information may become available following the compilation of the Universe. In addition, some projects that appear on the Universe list may not be evaluated each year if these projects are not actively being advanced by municipal or state planners or if they are not at the minimum required level of design for evaluation. Community Connections projects are not typically included in the Universe because proponents of those projects apply for funding through a discrete application process, the submission deadline for which is after the presentation of the Universe to the MPO board.
Once a proponent provides sufficient design documentation for a project in the Universe and the municipality or state is actively prioritizing the project for funding, the project can be evaluated by MPO staff. The evaluation criteria used to score projects are based on the MPO’s goals and objectives. After the projects are evaluated, the scores are shared with project proponents, posted on the MPO’s website, and presented to the MPO board for review and discussion. The scores for projects evaluated during development of the FFYs 2024–28 TIP for programming in the MPO’s Bicycle Network and Pedestrian Connections, Complete Streets, and Intersection Improvements programs are summarized in Table A-3. No projects were evaluated for inclusion in the Major Infrastructure investment program during the development of the FFY 2024-28 TIP. Scores for projects that applied for funding through the MPO’s Community Connections Program during the FFYs 2024–28 TIP cycle are summarized in Table A-4.
The MPO board approved a suite of changes to the TIP project selection criteria in October 2020. One of the central goals was to create distinct criteria for each investment program to allow for evaluations to be conducted in ways that better reflect the nuances of different types of transportation projects. For this reason, the project selection criteria for each investment program are shown in separate tables in this appendix as follows: Bicycle Network and Pedestrian Connections (Table A-5); Community Connections (Table A-6); Complete Streets (Table A-7); Intersection Improvements (Table A-8); and Major Infrastructure (Table A-9). Archived project evaluation criteria for all investment programs, which were discontinued in October 2020 after the FFYs 2021–25 TIP cycle, are shown in Tables A-10 and A-11.
In addition to project scores, several other factors are taken into consideration by the MPO when selecting projects for funding. Table A-2 describes many of these elements, including the relationships between the MPO’s FFYs 2024–28 Regional Target projects and the MPO’s Long-Range Transportation Plan (LRTP), studies and technical assistance conducted by MPO staff through the Unified Planning Work Program (UPWP), the federally required performance measures discussed in Chapter 4, and Massachusetts’ modal plans. These projects are listed by MPO investment program. More details about each of these projects are available in the funding tables and project descriptions included in Chapter 3. Performance-related information for the FFYs 2024–28 Regional Target projects is included in Chapter 4, and information about greenhouse gas (GHG) emissions for these projects is available in Appendix B.
Table A-1
FFYs 2024–28 TIP Universe of Projects
| Projects grouped by MAPC subregion and by MPO Investment Program | |||||||||
| This table contains unprogrammed projects in the Boston region that may be considered for evaluation in the FFYs 2024-28 TIP cycle. Not all projects listed in this table will be evaluated for funding in the FFYs 2024-8 TIP, as projects must be PRC approved and submit sufficient project documentation prior to scoring. The MPO has also established a policy to prioritize projects that have reached the 25% design submission stage for funding. This list is subject to change as more project information is received. | |||||||||
| Key | |||||||||
| Evaluated for FFYs 2023-27 TIP | |||||||||
| New project in TIP universe for FFYs 2024-28 TIP | |||||||||
| In 2023-27 universe, not evaluated | |||||||||
| Municipality | Project Proponent | Project Name | PROJIS | Design Status (as of 10/6/21) | Year Added to Universe | Cost Estimate | Highway District | Notes | Previous Evaluation Score |
| Inner Core | |||||||||
| Complete Streets | |||||||||
| Boston | Boston | Reconstruction of Albany Street | N/A | Pre-PRC | 2021 | N/A | 6 | Pursuing 2022 PRC approval. | N/A |
| Boston | MassDOT | Reconstruction on Gallivan Boulevard (Route 203), from Neponset Circle to East of Morton Street Intersection | 606896 | PRC approved (2012) | 2018 | $11,500,000 | 6 | Resulted from FFY 2012 Addressing Priority Corridors MPO Study | N/A |
| Boston | MassDOT | Improvements on Morton Street (Route 203), from West of Gallivan Boulevard to Shea Circle | 606897 | PRC approved (2012) | 2018 | $11,500,000 | 6 | Resulted from FFY 2012 Addressing Priority Corridors MPO Study | N/A |
| Boston | Boston | Roadway Improvements along Commonwealth Avenue (Route 30), from Alcorn Street to Warren/Kelton Streets (Phase 3 & Phase 4) | 608449 | 25% submitted (9/28/2017) |
2017 or earlier | $31,036,006 | 6 | Last scored for FFYs 2020-24 TIP. | 56 |
| Boston | MassDOT | Intersection & Signal Improvements at VFW Parkway and Spring Street | 607759 | 25% Package Received - R1 (3/09/2022) | 2022 | $4,526,907 | 6 | N/A | |
| Boston | MassDOT | Gallivan Boulevard (Route 203) Safety Improvements, from Washington Street to Granite Avenue | 610650 | PRC approved (2019) | 2019 | $5,750,000 | 6 | Priority for District 6. Road safety audit being initiated. | N/A |
| Brookline | Brookline | Boylston Street (High Street to Brington Road) Complete Streets Improvements | N/A | Pre-PRC | 2022 | $3,500,000 | 6 | Ped crossings, bike lanes, street trees. Design through Toole with some facilitation from MassDOT. Three options were pushed through and endorsed by the Select Board. Town met with District 6 to run through this. Should be in PRC soon. | N/A |
| Brookline | Brookline | Davis Street Path Restoration and Reconstruction of the Davis Street Path Bridge over MBTA | N/A | Pre-PRC | 2022 | $12,000,000 | 6 | Conceptual stage. Brookline is investigating avenues to use federal discretionary grant funding to advance this project. Potential for bundling with Boylston Street work above. | N/A |
| Chelsea | Chelsea | Reconstruction of Spruce Street, from Everett Avenue to Williams Street | 610675 | PRC approved (2019) | 2019 | $5,408,475 | 6 | N/A | |
| Chelsea | Chelsea | Reconstruction of Everett Avenue and 3rd Street, from Broadway to Ash Street | N/A | Pre-PRC | 2020 | N/A | 6 | N/A | |
| Chelsea | Chelsea | Reconstruction of Marginal Street | N/A | Pre-PRC | 2019 | N/A | 6 | N/A | |
| Lynn, Salem | MassDOT | Reconstruction of Route 107 | 608927 | PRC approved (2017) | 2020 | $38,155,000 | 4 | N/A | |
| Malden | Malden | Broadway Corridor Reconstruction | N/A | Pre-PRC | 2022 | N/A | 4 | Malden is currently holding community meetings to discuss this project, with the most recent one being held 10.25.2022. | N/A |
| Melrose | Melrose | Reconstruction of Lebanon Street, from Lynde Street to Malden City Line | 612534 | PRC approved (2/10/2022) | 2020 | $3,742,432 | 4 | N/A | |
| Newton | Newton | Reconstruction of Washington Street, from Church Street to Chestnut Street | N/A | Pre-PRC | 2020 | N/A | 6 | N/A | |
| Revere | Revere | Reconstruction of Ocean Ave, Revere Street, and Revere Beach Boulevard | N/A | Pre-PRC | 2020 | N/A | 4 | Project at conceptual stage with schematics, needs full design - investigating roundabout. Key East/West connection. | N/A |
| Winthrop | Winthrop | Reconstruction & Improvements on Route 145 | N/A | PRC approved (2019) | 2019 | $7,565,512 | 6 | N/A | |
| Intersection Improvements | |||||||||
| Boston, Brookline | Boston, Brookline | Mountfort St. & Commonwealth Ave. Connection | 608956 | PRC approved (2017) | 2018 | $916,883 | 6 | Preliminary design. | N/A |
| Medford | Medford | Intersection Improvements at Main Street and South Street | 611974 | PRC approved (2021) | 2019 | $8,498,000 | 4 | Project location studied by CTPS. Priority for municipality. Design is in progress, and eventually the City will work with MassDOT to fund construction. | N/A |
| Newton | MassDOT | Route 16 at Quinobequin Road | 612613 | PRC approved (2/10/2022) | 2022 | $4,350,000 | 6 | Reconfiguration of the interchange may result in consideration of this project for the LRTP. | |
| Quincy | MassDOT | Intersection Improvements at Route 3A (Southern Artery) and Broad Street | 608569 | PRC approved (2016) | 2020 | $2,900,000 | 6 | Priority for District 6. | N/A |
| Quincy | Quincy | Intersection Improvements at Willard Street and Ricciuti Drive | 610823 | 25% Package Received (9/28/2022) | 2020 | $1,544,650 | 6 | 25% design complete. PM is Kathy Dougherty. | N/A |
| Quincy | Quincy | Merrymount Parkway Phase II | N/A | Pre-PRC | 2022 | N/A | 6 | December PRC. | N/A |
| Bicycle and Pedestrian | |||||||||
| Boston | Boston | Fenway Multi-Use Path Phase III | N/A | Pre-PRC | 2021 | N/A | 6 | Project at conceptual stage. | N/A |
| Brookline | Brookline | Beacon Street Bridle Pathway | N/A | Pre-PRC | 2022 | N/A | 6 | Project in conceptual design through Toole, receipt of a MassTrails grant in 2020 for feasibility study. Limits would be Audubon Circle to Cleveland Circle. | N/A |
| Everett, Somerville | DCR | Mystic River Bicycle and Pedestrian Crossing | 612004 | PRC approved (2021) | 2021 | $38,218,334 | 4 | N/A | |
| Lynn, Nahant | Lynn, Nahant | Northern Strand Extension | 610919 | DPH (11/17/2021) | 2020 | $9,363,750 | 4 | N/A | |
| Medford | Medford | Wellington Phase 4 Shared Use Path | 613082 | Pre-PRC | 2022 | $1,195,000 | 4 | ID # is not yet in PINFO. Initiated on 11/3/2022. Includes an earmark and Gaming Commission money. | N/A |
| Medford | Medford | MacDonald Park Pedestrian Bridge | N/A | Pre-PRC | 2022 | $800,000 | 4 | In DCR park, City is requesting expansion of bridge to 10-12feet in width to coordinate with shared use pathway. | N/A |
| Major Infrastructure | |||||||||
| Boston, Chelsea | Boston | Bridge Rehabilitation and Fender Pier Replacement, Meridian Street Over Chelsea Creek (Andrew P. McArdle Bridge) | 600637 | PRC Approved (2/10/2022) | 2021 | $97,538,787 | 6 | N/A | |
| Cambridge | DCR | Intersection Improvements at Fresh Pond Parkway/Gerry's Landing Road, from Brattle Street to Memorial Drive | 609290 | PRC approved (2018) | 2019 | $7,000,000 | 6 | Short-term improvements being initiated. | N/A |
| Revere, Malden | MassDOT | Improvements on Route 1 (NB) Add-A-Lane | 610543 | PRC approved (2019) | 2019 | $7,210,000 | 4 | Project is not programmed in Destination 2040. It is located on a regionally significant roadway. If this work includes capacity-adding elements, and it is programmed in the TIP, it will need to be included in Destination 2050. | N/A |
| Newton | MassDOT | Traffic Signal and Safety Improvements at Interchange 127 (Newton Corner) | 609288 | PRC approved (2018) | 2019 | $14,000,000 | 6 | N/A | |
| Medford | Medford | Roosevelt Circle Interchange Reconfiguration | N/A | Pre-PRC | 2022 | TBD | 4 | As discussed on 11.4.2022 with the City of Medford, the City is looking to reconfigure the ramps and adjacent local roadways to improve traffic safety following the results of a RSA along this corridor. Includes improvements for bicycle, pedestrian, and transit access. Given the state of repair on the bridges, this may be coordinated with bridge rehabilitation work for these structures over I-93. | N/A |
| Boston | Boston | Cambridge Street Bridge Replacement - Charlestown | N/A | Pre-PRC | 2022 | N/A | 6 | City wants this programmed to advertise this before Rutherford Avenue enters construction. This is a difficult bridge under I-93 and next to Sullivan Square. | N/A |
| Revere | Revere | Route 1A Improvement and Reconfiguration | N/A | Pre-PRC | 2022 | $9-12,000,000 | 4 | Project is in conceptual design stage. The priority is to reconfigure the loop ramps at the General Edwards Bridge to facilitate redevelopment of the area, for which there are already parcel developments planned. The reconfiguration will entail construction of a new roundabout and improved pedestrian crossings to improve access to the riverfront and Point of Pines area along Revere. Per the City, this reconfiguration is intended to work with the Lynnway Multimodal Corridor improvements, but will also not impact construction for the General Edwards Bridge replacement. | N/A |
| Revere, Saugus | Revere, Saugus | Roadway Widening on Route 1 North (Phase 2) | 611999 | PRC approved (2021) | 2021 | $2,397,600 | 4 | Project is not programmed in Destination 2040. It Is on a regionally-significant roadway and would add roadway capacity. If programmed in the TIP, this project will also need to be included in Destination 2050. Robins Road to Route 99 interchange are the limits. |
N/A |
| Minuteman Advisory Group on Interlocal Coordination | |||||||||
| Complete Streets | |||||||||
| Bedford | Bedford | Roadway Reconstruction of Route 4/225 (The Great Road) | 612739 | PRC approved (5/12/2022) | 2022 | $10,899,448 | 4 | Limits appear to go from North Road to match line near Loomis Street. SRTS project completed in the area under 608000. | N/A |
| Intersection Improvements | |||||||||
| Littleton | Littleton | Intersection Improvements at Route 119/Beaver Brook Road | 610702 | PRC approved (2020) | 2020 | $3,120,110 | 3 | MassDOT agreed to fund design after 25% design approved. As of October 2022, the project remains in preliminary design. | N/A |
| Bicycle and Pedestrian | |||||||||
| Bedford | Bedford | Minuteman Bikeway Extension, From Loomis Street to Concord Road (Route 62) | 607738 | 47 | 2022 | $11,218,186 | 4 | Local concerns about permitting. Previously programmed in FY23-27, dropped due to public opposition. Failed to achieve 2/3rds majority in town meeting on 11.14.2022. | N/A |
| Concord | Concord | Assabet River Multi-Use Trail and Bridge Construction | 612870 | PRC approved (8/29/2022) | 2020 | $8,280,000 | 4 | Project was originally a new Pedestrian Bridge with a $2-3.6M price range. Scope has increased to include improvements for a multi-use trail alongside the bridge. Cost has increased accordingly, and is now in preliminary design. Project location runs between the West Concord MBTA Station and the Concord Meadows Corporate Center with a hookup to the Southern Terminus of the Bruce Freeman. |
N/A |
| Major Infrastructure | |||||||||
| Acton | MassDOT | Intersection Improvements at Route 2 and Route 27 Ramps | 610553 | PRC approved (2019) | 2020 | $3,480,000 | 3 | Project not programmed in LRTP (meets MPO roadway classification requirement). Priority for District 3 and Town of Acton. Project has had surveying and MSA design contracts opened for it. MassDOT appears to be tracking as a Traffic Safety improvement. |
N/A |
| Concord | Concord | Reconstruction & Widening on Route 2, from Sandy Pond Road to Bridge over MBTA/B&M Railroad | 608015 | PRC approved (2014) | 2019 | $8,000,000 | 4 | Project is not programmed in Destination 2040. It is on a regionally significant roadway and includes roadway widening elements. If programmed in the TIP, this project should also be included in Destination 2050. | N/A |
| Lexington | Lexington | Route 4/225 (Bedford Street) and Hartwell Avenue | N/A | Pre-PRC | 2019 | $30,557,000 | 4 | Project is programmed in Destination 2040 (FFYs 2030-34). The project is expected to include work on the I-95 Interchange with Route 4/225. If this work includes capacity-adding elements, it will need to be included in Destination 2050. | N/A |
| MetroWest Regional Collaborative | |||||||||
| Complete Streets | |||||||||
| Wellesley | Wellesley | Route 135 Reconstruction (Natick Town Line to Weston Road) | N/A | Pre-PRC | N/A | TBD | 6 | N/A | |
| Holliston | Holliston | Reconstruction of Concord Street (Route 126) | N/A | Pre-PRC | 2021 | N/A | 3 | Added through subregional outreach. Project is municipal priority, as it's tied to necessary below-grade sewer work. 10/12/22: MaPIT is showing that a project was initiated back on 7.14.2020 for this stretch for resurfacing and related work, assuming $600K in total cost (likely lowball). |
N/A |
| Intersection Improvements | |||||||||
| Framingham | MassDOT | Roundabout Construction at Salem End Road, Badger Road and Gates Street | 609280 | PRC approved (2018) | 2019 | $2,520,000 | 3 | N/A | |
| Weston | Weston | Intersection Improvements - Signalization of Route 20 at Highland Street | N/A | Pre-PRC | 2021 | N/A | 6 | Added through subregional outreach. | N/A |
| Bicycle and Pedestrian | |||||||||
| Weston | MassDOT | Weston - Shared Use Path Construction on Route 30 | 612602 | PRC Approved (2/10/2022) | 2022 | $1,050,000 | 6 | Meant to connect into Project 608954. District 6 priority to ensure that the shared-use-path there ties in to the rest of the bicycle network and concludes at a logical terminus. | N/A |
| Natick | Natick | Cochituate Rail Trail Extension, from MBTA Station to Mechanic Street | 610691 | PRC approved (4/30/2020) | 2020 | $5,778,069 | 3 | Final section of Cochituate Rail Trail Extension. Imminent 25% design submittal. |
N/A |
| Major Infrastructure | |||||||||
| Framingham | Framingham | Intersection Improvements at Route 126/135/MBTA and CSX Railroad | 606109 | PRC approved (2010) | 2019 | $115,000,000 | 3 | Project is programmed in Destination 2040 (FFYs 2030-34). May need to be pushed back with LRTP rewrite. Consultant said that depressing Route 135 may be the solution. |
N/A |
| North Suburban Planning Council | |||||||||
| Complete Streets | |||||||||
| Burlington | Burlington | Town Center Complete Streets Improvements | N/A | Pre-PRC | 2021 | N/A | 4 | Complete Streets upgrades along Route 3A from Bedford Street to Arthur Woods Avenue. The scope of work would be additive to existing resurfacing planned under 610704, and would focus mostly on paint. There is potential for widening if the town's design includes a multimodal path while maintaining the current number and width of vehicle lanes. | N/A |
| Lynnfield | Lynnfield | Reconstruction of Summer Street | 609381 | PRC approved (2019) | 2019 | $21,521,921 | 4 | N/A | |
| Reading | Reading | Reading Downtown Improvement Project | N/A | Pre-PRC | 2020 | $7-$8 million | 4 | Project at conceptual stage. | N/A |
| Stoneham | Stoneham | Reconstruction of South Main Street, from Town Center to South Street | N/A | Pre-PRC | 2021 | N/A | 4 | N/A | |
| Wakefield | Wakefield | Main Street Reconstruction (Water St. to Salem St.) | 610545 | 25% Design Complete | 2020 | $26,382,000 | 4 | Main St (Nahant to Water) and Water Street (Main to Cyrus) removed from project and bundled in 607329. 25% design incorporates some retention of angled parking in order to appease older public, but focus is on bike parking. Strong public input from youth during town meetings led to approval. |
41.8 |
| Winchester | Winchester | Town Center Complete Streets Improvements | N/A | Pre-PRC | 2021 | N/A | 4 | N/A | |
| Intersection Improvements | |||||||||
| Stoneham | Stoneham | Intersection Improvements at Main Street (Route 28), Franklin Street, and Central Street | N/A | Pre-PRC | 2020 | N/A | 4 | Project at conceptual stage. | N/A |
| Bicycle and Pedestrian | |||||||||
| Stoneham, Wakefield | Stoneham, Wakefield | Mystic Highlands Greenway Project | N/A | Pre-PRC | 2021 | N/A | 4 | N/A | |
| Community Connections | |||||||||
| North Reading | North Reading | ||||||||
| North Shore Task Force | |||||||||
| Complete Streets | |||||||||
| Beverly, Manchester-by-the-Sea | MassDOT | Resurfacing and Related Work on Route 127 | 607707 | PRC approved (2013) | 2018 | $2,300,000 | 4 | Still in preliminary design. | N/A |
| Danvers | Danvers | Reconstruction on Collins Street, from Sylvan Street to Centre and Holten Streets | 602310 | 75% submitted (3/5/2010) | 2017 or earlier | $5,183,121 | 4 | Updated 75% design submission needed for project to move forward. Last scored for FFYs 2020-24 TIP. | 46 |
| Ipswich | Ipswich | Reconstruction of County Road, from South Main Street to East Street | 611975 | PRC approved (2021) | 2020 | $5,653,500 | 4 | On 10/7/2022, Ipswich DPW mentioned that a bridge within the project limits has had a lane closed by MassDOT. Structure IDs are I01005, main concern is Ipswich - 2PN which is an 1861-built historic stone arch mill bridge. | 45.4 |
| Ipswich | Ipswich | Argilla Roadway Reconstruction and Adaptation | 612738 | PRC Approved (5/12/2022) | 2021 | $4,628,419 | 4 | Municipal priority for funding. | N/A |
| Marblehead | Marblehead | Bridge Replacement, M-04-001, Village Street over Marblehead Rail Trail (Harold B. Breare Bridge) | 612947 | PRC approved (9/15/2022) | 2019 | N/A | 4 | Per 10.11 email with C Quigley, the project received a PRC and a PROJIS ID in September 2022 after a PNF was submitted 8/2022. |
N/A |
| Manchester-by-the-Sea | Manchester-by-the-Sea | Pine Street - Central Street (Route 127) to Rockwood Heights Road | N/A | Pre-PRC; PNF submitted (12/27/16) | 2017 or earlier | N/A | 4 | N/A | |
| Manchester-by-the-Sea | Manchester-by-the-Sea | Bridge Replacement, M-02-001 (8AM), Central Street (route 127) over Saw Mill Brook | 610671 | PRC approved (2019) | 2019 | $4,350,000 | 4 | 34.8 | |
| Salem | MassDOT | Reconstruction of Bridge Street, from Flint Street to Washington Street | 5399 | 25% submitted (8/20/2004) | 2017 or earlier | $24,810,211 | 4 | Project is not programmed in Destination 2040. It is on a regionally significant roadway and would add roadway capacity. If it is programmed in the TIP, it will need to be programmed in Destination 2050. | N/A |
| Wenham | Wenham | Safety Improvements on Route 1A | 609388 | 25% Approved (9/10/2021) | 2019 | $3,629,036 | 4 | N/A | |
| Wenham | Wenham | Roadway Reconstruction on Larch Row and Dodges Row | N/A | Pre-PRC | 2019 | $800,000 | 4 | Project at conceptual stage. | N/A |
| Intersection Improvements | |||||||||
| Essex | Essex | Targeted Safety Improvements on Route 133 (John Wise Avenue) | 609315 | PRC approved (2019) | 2019 | $2,135,440 | 4 | N/A | |
| Bicycle and Pedestrian | |||||||||
| Peabody, Salem | Peabody, Salem | Riverwalk Project | N/A | Pre-PRC | 2021 | N/A | 4 | MVP grant issued for project design. | N/A |
| Marblehead | Marblehead | B2B Bikeway Design - Marblehead | N/A | Pre-PRC | 2022 | $140,000 | 4 | Earmark. May be added via amendment. | |
| Peabody, Salem | Peabody, Salem | B2B Bikeway Design - Peabody/Salem | N/A | Pre-PRC | 2022 | $600,000 | 4 | Earmark. May be added via amendment. | |
| Major Infrastructure | |||||||||
| Beverly | Beverly | Interchange Reconstruction at Route 128/Exit 19 at Brimbal Avenue (Phase II) | 607727 | PRC Approved (2014) | 2021 | N/A | 4 | Project is not programmed in Destination 2040. Is on a regionally-significant roadway, and would expand the interchange. If this project is programmed in the TIP and adds roadway capacity, this project will need to be included in Destination 2050. | N/A |
| South Shore Coalition | |||||||||
| Complete Streets | |||||||||
| Holbrook | Holbrook | Corridor Improvements and Related Work on South Franklin Street (Route 37) from Snell Street to King Road | 608543 | PRC approved (2017) | 2018 | $4,000,200 | 5 | N/A | |
| Rockland | Rockland | Corridor Improvements on VFW Drive/Weymouth Street | 612605 | PRC approved (2/10/2022) | 2021 | $13,047,281 | 5 | PNF entered in Jan 2022 | N/A |
| Weymouth | MassDOT | Reconstruction on Route 3A, Including Pedestrian and Traffic Signal Improvements | 608231 | PRC approved (2016) | 2017 or earlier | $10,780,100 | 6 | Pre-25% package submitted in July 2021. | N/A |
| Weymouth | MassDOT | Resurfacing and Related Work on Route 3A | 608483 | PRC approved (2016) | 2018 | $2,400,000 | 6 | N/A | |
| Intersection Improvements | |||||||||
| Cohasset | Cohasset | Intersection Improvements at Route 3A and King Street | N/A | Pre-PRC | 2021 | N/A | 5 | Added through subregional outreach. | N/A |
| Hull | Hull | Intersection Improvements at George Washington Boulevard and Barnstable Road/ Logan Avenue | N/A | Pre-PRC | 2021 | N/A | 5 | Added through subregional outreach. | N/A |
| South West Advisory Planning Committee | |||||||||
| Complete Streets | |||||||||
| Bellingham | Bellingham | South Main Street (Route 126) - Elm Street to Douglas Drive Reconstruction | N/A | Pre-PRC; PNF submitted (3/13/17) | 2017 or earlier | N/A | 3 | Project would dovetail ongoing project 608887, rehab on Route 126 from Douglas Drive to Route 140. | N/A |
| Franklin | MassDOT | Resurfacing and Intersection Improvements on Route 140, from Beaver Street to I-495 Ramps | 607774 | PRC approved (2014) | 2018 | $4,025,000 | 3 | N/A | |
| Medway | Medway | Improvements on Route 109 West of Highland Street | N/A | Pre-PRC | 2021 | N/A | 3 | Project at conceptual stage. | N/A |
| Milford | MassDOT | Resurfacing and Related Work on Route 16 | 612091 | PRC approved (2021) | 2021 | $4,192,500 | 3 | N/A | |
| Millis | Millis | Town Center Improvements | N/A | Pre-PRC | 2020 | N/A | 3 | Project at conceptual stage. | N/A |
| Wrentham | Wrentham | Resurfacing and Related Work on Route 1 | 608497 | PRC approved (2016) | 2020 | N/A | 5 | 25% design anticipated July 2022. | N/A |
| Intersection Improvements | |||||||||
| Medway | Medway | Traffic Signalization at Trotter Drive and Route 109 | N/A | Pre-PRC | 2021 | N/A | 3 | Project at conceptual stage. | N/A |
| Sherborn | Sherborn | Intersection Improvements at Route 16 and Maple Street | N/A | Pre-PRC | 2021 | N/A | 3 | Project at conceptual stage. | N/A |
| Wrentham | Wrentham | Intersection Improvements on Route 1A at North and Winter Street | 610676 | PRC Approved (12/19/2019) | 2020 | $2,649,000 | 5 | N/A | |
| Wrentham | Wrentham | Intersection Improvements at Randall Road and Route 1A | N/A | Pre-PRC | 2020 | $2,649,000 | 5 | Project at conceptual stage. | N/A |
| Wrentham | Wrentham | Intersection Improvements at Route 1A and Route 140 | N/A | Pre-PRC | 2020 | N/A | 5 | Project at conceptual stage. | N/A |
| Bicycle and Pedestrian | |||||||||
| Franklin | Franklin | Southern New England Trunk Trail (SNETT) Extension, from Grove Street to Franklin Town Center | N/A | Pre-PRC | 2021 | N/A | 3 | Project at conceptual stage. | |
| Hopkinton | Hopkinton | Campus Trail Connector, Shared Use Trail Construction | 611932 | PRC approved (2020) | 2020 | $1,750,700 | 3 | N/A | |
| Norfolk, Walpole, and Wrentham | Norfolk | Metacomet Greenway | N/A | Pre-PRC | 2021 | N/A | 5 | Project at conceptual stage. | N/A |
| Sherborn | Sherborn | Upper Charles River Trail Extension to Framingham City Line | N/A | Pre-PRC | 2021 | N/A | 3 | Project at conceptual stage. | N/A |
| Major Infrastructure | |||||||||
| Bellingham | MassDOT | Ramp Construction & Relocation, I-495 at Route 126 (Hartford Avenue) | 604862 | PRC approved (2006) | 2017 or earlier | $13,543,400 | 3 | High priority for District 3 | N/A |
| Three Rivers Interlocal Council | |||||||||
| Complete Streets | |||||||||
| Canton, Milton | MassDOT | Roadway Improvements on Route 138 | 608484 | PRC approved (2016) | 2020 | $18,467,500 | 6 | Milton also in ICC subregion. Project a high priority for the TRIC subregion. District is working to refine scope. . |
N/A |
| Medfield | Medfield | Reconstruction of Route 109 | N/A | Pre-PRC | 2021 | N/A | 3 | Added through subregional outreach. | N/A |
| Milton | MassDOT | Reconstruction on Granite Avenue, from Neponset River to Squantum Street | 608406 | 25% submitted (2/10/2017) | 2017 or earlier | $3,665,146 | 6 | Milton also in ICC subregion. | N/A |
| Milton | Milton | Adams Street Improvements, from Randolph Avenue to Eliot Street | 610820 | PRC approved (4/30/2020) | 2020 | $1,799,330 | 6 | Milton also in ICC subregion. | N/A |
| Needham | Needham | Reconstruction of Highland Avenue, from Webster Street to Great Plains Avenue | 612536 | PRC approved (10/21/2021) | 2021 | $10,402,402 | 6 | Needham also in ICC subregion. | N/A |
| Dover, Needham | Dover, Needham | Centre Street Bridge Replacement | N/A | Pre-PRC | 2022 | N/A | 6 | Historic-eligible, needs replacement as it is 1850's era. | N/A |
| Westwood | Westwood | Reconstruction of Canton Street | 608158 | 25% Package Received (2/18/2022) | 2017 or earlier | $19,047,306 | 6 | Priority for municipality. MassDOT expresses concerns regarding project readiness due to scope fluctuations. New shapefile is in development for MapIT, there is not one available right now. |
N/A |
| Intersection Improvements | |||||||||
| Foxborough | Foxborough | Intersection Signalization at Route 140/Walnut Street and Route 140/I-95 (SB Ramp) | 612740 | PRC Approved (5/12/2022) | 2021 | $11,902,600 | 5 | Added through subregional outreach. Town has advanced design outside of TIP process. District supports project. Budget has increased from original $5M estimate in 2021. | N/A |
| Medfield | Medfield | Intersection Improvements at Route 27 and West Street | 612807 | PRC Approved (5/12/2022) | 2021 | $3,987,500 | 3 | Added through subregional outreach. | N/A |
| Bicycle and Pedestrian | |||||||||
| Canton | Canton | Warner Trail Extension, from Sharon to Blue Hills Reservation | N/A | Pre-PRC | 2021 | N/A | 6 | Added through subregional outreach. Feasibility study currently underway. | N/A |
| Major Infrastructure | |||||||||
| Canton, Westwood | MassDOT | Interchange Improvements at I-95 / I-93 / University Avenue / I-95 Widening | 87790 | 25% submitted (7/25/14) | 2017 or earlier | $202,205,994 | 6 | Project not programmed in Destination 2040. IIt is on a regionally-significant roadway and adds roadway capacity. If programmed in the TIP, this project would also need to be included in Destination 2050. Last scored for FFYs 2020-24 TIP. Regional priority, potential discretionary grant project via MassDOT for State Highway funding. |
47 |
Table A-2
FFYs 2024–28 Regional Target Projects and Their Relationships to Plans and Performance Measures
[COMING SOON]
Table A-3
FFYs 2024–28 TIP Project Evaluation Results: Multiple MPO Investment Programs
| Bicycle Network and Pedestrian Connections Program | ||||||||||||||||||
| Proponent | Project Number | Project Name | MAPC Subregion | Project Status | Project Cost | Cost / Road Mile | Total Score | Total Base Score | Total Scaled Equity Score | Safety | Safety Equity Score | System Preservation and Modernization | System Preservation Equity Score | Capacity Management and Mobility | Capacity Management Equity Score | Clean Air and Sustainable Communities | Clean Air Equity Score | Economic Vitality |
| Malden | 613088 | Spot Pond Brook Greenway | ICC | PRC-Approved (12/20/2022) | $3,250,000 | $8,362,573 | 73 | 61 | 12 | 16.5 | 3.6 | 10 | 2.4 | 18 | 5.4 | 5 | 0.6 | 11.5 |
| Natick | 610691 | Cochituate Rail Trail Extension | MWRC | 25% Received (11/21/2022) | $6,690,043 | $79,289,399 | 67 | 59 | 8 | 12 | 2 | 11 | 2.2 | 18 | 3.6 | 5 | 0.2 | 13 |
| Possible Points | 100 | 80 | 20 | 20 | 5.6 | 14 | 4.8 | 18 | 7.2 | 14 | 2.4 | 14 | ||||||
| Complete Streets Program | ||||||||||||||||||
| Proponent | Project Number | Project Name | MAPC Subregion | Project Status | Project Cost | Cost / Road Mile | Total Score | Total Base Score | Total Equity Score | Safety | Safety Equity Score | System Preservation and Modernization | System Preservation Equity Score | Capacity Management and Mobility | Capacity Management Equity Score | Clean Air and Sustainable Communities | Clean Air Equity Score | Economic Vitality |
| Bellingham | 612963 | Roadway Rehabilitation of Route 126 (Hartford Road) from 800 feet North of the I-495 NB off ramp to Medway T/L (including Bridge B-06-017). | SWAP | PRC-Approved (9/15/2022) | $10,950,000 | $22,383,275 | 51.8 | 46.5 | 5.3 | 13 | 1.55 | 15 | 2.1 | 7.5 | 1.4 | 5 | 0.25 | 6 |
| Boston | 612989 | Bridge Preservation, B-16-066 (38D), Cambridge Street Over MBTA | ICC | PRC -Approved (12/21/2022) | $15,400,000 | $0 | 53.1 | 47.25 | 5.9 | 5 | 0.77 | 15 | 1.8 | 12.5 | 2.56 | 4.5 | 0.77 | 10.25 |
| Ipswich | 612738 | Argilla Roadway Reconstruction and Adaptation (Crane Estate to Crane Beach) | NSTF | PRC-Approved (5/12/2022) | $5,500,000 | $33,689,095 | 37.1 | 34 | 3.1 | 6 | 0.5 | 14 | 1.3 | 4 | 1 | 5 | 0.3 | 5 |
| Wakefield | 610545 | Envision Wakefield - Main Street Complete Streets Improvements | NSPC | PRC-Approved (12/19/2019) | $16,581,200 | $43,691,354 | 61.8 | 53 | 8.8 | 13 | 2.6 | 13 | 2.7 | 10 | 3.1 | 6 | 0.4 | 11 |
| Westwood | 608158 | Reconstruction of Canton Street (East Street Rotary and University Avenue) Including Bridge N25032 | TRIC | 25% Received (2/18/2022) | $19,047,306 | $29,106,536 | 53.3 | 48.25 | 5 | 12 | 1.54 | 14.5 | 1.67 | 9 | 1.54 | 3.75 | 0.25 | 9 |
| Possible Points | 100 | 80 | 20 | 18 | 4.6 | 20 | 5.6 | 18 | 7.2 | 12 | 2.6 | 12 | ||||||
| Intersection Improvements Program | ||||||||||||||||||
| Proponent | Project Number | Project Name | MAPC Subregion | Project Status | Project Cost | Cost / Road Mile | Total Score | Total Base Score | Total Equity Score | Safety | Safety Equity Score | System Preservation and Modernization | System Preservation Equity Score | Capacity Management and Mobility | Capacity Management Equity Score | Clean Air and Sustainable Communities | Clean Air Equity Score | Economic Vitality |
| Canton** | N/A | Randolph and York Street Intersection Signalization | TRIC | Pre-PRC | $500,000 | $25,882,353 | N/A* | N/A | N/A | N/A | N/A | N/A | N/A | N/A | N/A | N/A | N/A | N/A |
| Possible Points | 100 | 80 | 20 | 21 | 5.4 | 17 | 5.4 | 18 | 6.8 | 12 | 2.4 | 12 | ||||||
| *This project was not recommended for moving forward at TIP Readiness Days until the project is formally intiated through MassDOT's system and goes through the Project Review Committee. Staff are actively working with the project proponent and MassDOT District 6 to initiate this project. | ||||||||||||||||||
| Abbreviations | ||||||||||||||||||
| MWRTA = MetroWest Regional Transit Authority. N/A = not applicable. PRC = MassDOT's Project Review Committee. | ||||||||||||||||||
| Metropolitan Area Planning Council (MAPC) Subregions: ICC = Inner Core Committee. MAGIC = Minuteman Advisory Group on Interlocal Coordination. MWRC = MetroWest Regional Collaborative. NSPC = North Suburban Planning Council. NSTF = North Shore Task Force. SSC = South Shore Coalition. SWAP = SouthWest Advisory Planning Committee. TRIC = Three Rivers Interlocal Council. | ||||||||||||||||||
Table A-4
FFYs 2024–28 TIP Project Evaluation Results: Community Connections Program
| Community Connections Program | |||||||||||||||
| Proponent | Project Name | MAPC Subregion | Project Cost | Cost/Monthly Passenger Trip | Cost/Point | Total Score | Connectivity | Coordination | Plan Implementation | Transportation Equity | Mode Shift and Demand Projection | Fiscal Sustainability | |||
| Concord | Concord Workforce Shuttle* | MAGIC | $369,911 | $155 | $5,210 | 71 | 13 | 15 | 6 | 6 | 21 | 10 | |||
| MWRTA | CatchConnect Microtransit Expansion Phase 2* | MWRC | $402,500 | $93 | $4,472 | 90 | 17 | 15 | 15 | 9 | 24 | 10 | |||
| North Reading | North Reading Demand Response Shuttle Pilot Program* | NSPC | $77,637 | $348 | $1,005 | 77.25 | 16.25 | 15 | 9 | 9 | 18 | 10 | |||
| Revere | Revere On Demand Shuttle Service* | ICC | $980,976 | $30 | $17,210 | 57 | 17 | 0 | 3 | 12 | 15 | 10 | |||
| Boston | Boston Electric BlueBikes Adoption | ICC | $1,020,000 | $21 | $12,143 | 84 | 17 | 15 | 6 | 12 | 24 | 10 | |||
| Cambridge | Cambridge Electric BlueBikes Adoption | ICC | $352,575 | $13 | $4,353 | 81 | 17 | 15 | 6 | 9 | 24 | 10 | |||
| Canton | Canton Center Bicycle Racks | TRIC | $10,000 | $12 | $139 | 72 | 14 | 9 | 12 | 6 | 21 | 10 | |||
| Canton | Canton Public Schools Bike Program | TRIC | $22,500 | $4 | $592 | 38 | 13 | 0 | 6 | 6 | 3 | 10 | |||
| Lynn | Broad Street Corridor TSP | ICC | $297,800 | $2 | $3,384 | 88 | 17.5 | 12 | 13.5 | 12 | 23 | 10 | |||
| Medford | Medford Bicycle Parking - Tier 1 | ICC | $29,600 | $12 | $352 | 84 | 17 | 12 | 12 | 9 | 24 | 10 | |||
| Medford | Medford Bluebikes Expansion | ICC | $118,643 | $53 | $1,521 | 78 | 17 | 15 | 3 | 9 | 24 | 10 | |||
| Possible Points | Possible Points | 100 | 18 | 15 | 15 | 18 | 24 | 10 | |||||||
| *These shuttle projects requested funding for FFY24 and additional years. Concord requested $139,749 in FFY24, $122,165 in FFY25, and $107,997 in FFY26. The MWRTA requested $140,000 in FFY24, $132,500 in FFY 25, and $107,977 in FFY 26. $130,000 in FFY 26. North Reading requested $41,787 in FFY 24 and $35,850 in FFY 25. Revere requested $356,825 in FFY 24, $338,521 in FFY 25, and $285,630 in FFY 26. The Cost/Monthly Passenger Trip for these projects only shows the cost/monthly user for the first year of funding. | |||||||||||||||
| Abbreviations | |||||||||||||||
| MWRTA = MetroWest Regional Transit Authority. N/A = not applicable. PRC = MassDOT's Project Review Committee. | |||||||||||||||
| Metropolitan Area Planning Council (MAPC) Subregions: ICC = Inner Core Committee. MAGIC = Minuteman Advisory Group on Interlocal Coordination. MWRC = MetroWest Regional Collaborative. NSPC = North Suburban Planning Council. NSTF = North Shore Task Force. SSC = South Shore Coalition. SWAP = SouthWest Advisory Planning Committee. TRIC = Three Rivers Interlocal Council. | |||||||||||||||
Table A-5
FFYs 2024–28 TIP Evaluation Criteria: Bicycle Network and Pedestrian Connections Program
| MPO Goal Area | Safety: Transportation by all modes will be safe. (Up to 20 points) | |||
| Criterion | Project improves bicycle safety (up to 5 points) +5 High total effectiveness of bicycle safety improvements +3 Medium total effectiveness of bicycle safety improvements +1 Low total effectiveness of bicycle safety improvements +0 Project does not implement bicycle safety improvements |
Project improves pedestrian safety (up to 5 points) +5 High total effectiveness of pedestrian safety improvements +3 Medium total effectiveness of pedestrian safety improvements +1 Low total effectiveness of pedestrian safety improvements +0 Project does not implement pedestrian safety improvements |
Project improves safety for all users (up to 3 points) +3 Project includes three or more eligible multimodal safety improvements +2 Project includes two eligible multimodal safety improvements +1 Project includes one eligible multimodal safety improvement +0 Project does not include any eligible multimodal safety improvements |
|
| Bonus/Penalty (if applicable) | Bonus (up to 2 points) +2 Improves bicycle safety at bicycle HSIP cluster |
Bonus (up to 2 points) +2 Improves pedestrian safety at pedestrian HSIP cluster |
Bonus (up to 3 points) +3 Addresses safety at multiple all-mode HSIP clusters OR a top-200 crash location +2 Addresses safety at one all-mode HSIP cluster |
|
| Equity Multiplier? | Yes | Yes | No | |
| MPO Goal Area | System Preservation: Maintain and modernize the transportation system and plan for its resiliency. (Up to 14 points) | |||
| Criterion | Project incorporates resiliency elements into its design (up to 5 points) +1 Project implements recommendation(s) as identified in a Hazard Mitigation Plan, Municipal Vulnerability Plan, or climate adaptation plan ------------------------------------------------------------------ +1 Project improves stormwater infrastructure ------------------------------------------------------------------ +1 Project implements innovative resiliency solutions ------------------------------------------------------------------ +1 Project designed to meet a range of future climate projections ------------------------------------------------------------------ +1 Project demonstrates regional coordination on resiliency |
Project improves connectivity to critical facilities (up to 2 points) +2 Project improves access to critical facilities |
Project improves existing pedestrian facilities (up to 5 points) +5 Existing pedestrian facilities are in poor condition and improvements are included in the project +3 Existing pedestrian facilities are in fair condition and improvements are included in the project +1 Existing pedestrian facilities are in good condition and improvements are included in the project +0 Project does not improve existing pedestrian facilities |
Project improves other existing assets (up to 2 points) +2 Project improves three or more other assets +1 Project improves one or two other assets +0 Project does not meet or address criteria |
| Bonus/Penalty (if applicable) | Penalty -1 Project is located in an existing or projected flood zone and doesn't specify how the project will address future flooding |
N/A | N/A | N/A |
| Equity Multiplier? | Yes | Yes | Yes | No |
| MPO Goal Area | Capacity Management/Mobility: Use existing facility capacity more efficiently and increase healthy transportation options. (Up to 18 points) | |||
| Criterion | Project improves pedestrian network and ADA accessibility (up to 5 points) +5 Project adds new shared-use path +3 Project adds new high-quality sidewalks +1 Project adds new standard sidewalks +0 Project does not improve pedestrian network |
Project improves bicycle network (up to 5 points) +5 Project adds new separated bicycle facility (including shared-use paths) +3 Project adds new buffered bicycle facility +1 Project adds new standard bicycle facility +0 Project does not improve bicycle network |
||
| Bonus/Penalty (if applicable) | Bonus (up to 4 points) +4 Project closes a gap in the pedestrian network +3 Project improves ADA accessibility beyond minimum required standards +2 Project creates or improves a pedestrian connection to transit +1 Project extends existing pedestrian network |
Bonus (up to 4 points) +4 Project closes a gap in the bicycle network +2 Project creates or improves a bicycle connection to transit +2 Project extends existing bicycle network +1 Project makes accommodations for bicycle parking or a bicycle share station |
||
| Equity Multiplier? | Yes | Yes | ||
| MPO Goal Area | Clean Air/Sustainable Communities: Create an environmentally friendly transportation system. (Up to 14 points) | |||
| Criterion | Project reduces CO2 (up to 4 points) +4 300 or more annual tons of CO2 reduced +3 100–299 annual tons of CO2 reduced +2 50–99 annual tons of CO2 reduced +1 Less than 50 annual tons of CO2 reduced 0 No expected impact -1 Less than 50 annual tons of CO2 increased -4 50 or more annual tons of CO2 increased |
Project reduces other transportation-related emissions (up to 4 points) +4 1,500 or more total annual kilograms of other emissions reduced +3 750–1499 total annual kilograms of other emissions reduced +2 250–749 total annual kilograms of other emissions reduced +1 Less than 250 total annual kilograms of other emissions reduced 0 No impact -1 Less than 250 total annual kilograms of other emissions increased -4 250 or more total annual kilograms of other emissions increased |
Enhances Natural Environment (up to 4 points) +1 Project improves water quality ------------------------------------------------------------------ +1 Project selects a design alternative that avoids impacts to sensitive natural areas ------------------------------------------------------------------ +1 Project reduces urban heat island effect ------------------------------------------------------------------ +1 Project increases access to parks, open space, or other natural assets |
|
| Bonus/Penalty (if applicable) | N/A | Bonus/Penalty (up to 2 points) +2 Project reduces NOx emissions in area in top 20% of regional NOx levels -2 Project increases NOx emissions in area in top 20% of regional NOx levels |
Penalty -1 Project is anticipated to lead to negative environmental outcomes |
|
| Equity Multiplier? | No | Yes | No | |
| MPO Goal Area | Economic Vitality: Ensure our transportation network provides a strong foundation for economic vitality. (Up to 14 points) | |||
| Criterion | Project serves sites targeted for future development (up to 4 points) +2 Project improves bicycle access to or within a site ------------------------------------------------------------------ +2 Project improves pedestrian access to or within a site |
Project serves existing employment and population centers (up to 4 points) +4 Project mostly serves an existing area of concentrated development +2 Project partly serves an existing area of concentrated development +0 Project does not serve an existing area of concentrated development |
Project demonstrates proponent investment (up to 2 points) +2 20 percent or more of the project cost is provided +1 Less than 20 percent of the project cost is provided +0 No non-TIP funding is provided by the project proponent |
Project promotes access to affordable housing opportunities (up to 3 points) +3 10.4% or more of housing units are affordable in project area +2 6.6-10.3% of housing units are affordable in project area +1 1-6.5% of housing units are affordable in project area +0 Less than 1% of housing units are affordable in project area |
| Bonus/Penalty (if applicable) | N/A | N/A | Bonus (up to 1 point) +1 Project proponent supports design process through pilot project OR robust community outreach process |
N/A |
| Equity Multiplier? | No | No | No | No |
| Total Base Points Possible | 80 | |||
| Total Equity Points Possible | 20 | |||
| Total Possible Points | 100 | |||
Table A-6
Evaluation Criteria for FFYs 2024 Community Connections Program
[COMING SOON]
Table A-7
FFYs 2024–28 TIP Evaluation Criteria: Complete Streets Program
| MPO Goal Area | Safety: Transportation by all modes will be safe. (Up to 18 points) | |||||||
| Criterion | Project addresses severe-crash location (up to 3 points) +3 EPDO value of 1000 or more +2 EPDO value of 250 to 999 +1 EPDO value of less than 250 +0 No EPDO value |
Project addresses high-crash location (up to 3 points) +3 Crash rate of 6.45 or greater +2 Crash rate between 4.25 and 6.45 +1 Crash rate between 2.05 and 4.25 +0 Crash rate below 2.05 |
Project addresses truck-related safety issue (up to 2 points) +2 High total effectiveness of truck safety improvements +1 Medium total effectiveness of truck safety improvements +0 Low total effectiveness or no implementation of truck safety improvements |
Project improves bicycle safety (up to 2 points) +2 High total effectiveness of bicycle safety improvements +1 Medium total effectiveness of bicycle safety improvements +0 Low total effectiveness or no inclusion of bicycle safety improvements |
Project improves pedestrian safety (up to 2 points) +2 High total effectiveness of pedestrian safety improvements +1 Medium total effectiveness of pedestrian safety improvements +0 Low total effectiveness or no inclusion of pedestrian safety improvements |
Project improves safety for all users (up to 2 points) +2 Project includes three or more eligible multimodal safety improvements +1 Project includes one or two eligible multimodal safety improvements +0 Project does not include any eligible multimodal safety improvements |
||
| Bonus/Penalty (if applicable) | N/A | N/A | N/A | Bonus (up to 1 point) +1 Improves bicycle safety at bicycle HSIP cluster |
Bonus (up to 1 point) +1 Improves pedestrian safety at pedestrian HSIP cluster |
Bonus (up to 2 points) +2 Addresses safety at multiple all-mode HSIP clusters OR a top-200 crash location +1 Addresses safety at one all-mode HSIP cluster |
||
| Equity Multiplier? | Yes | No | No | Yes | Yes | No | ||
| MPO Goal Area | System Preservation: Maintain and modernize the transportation system and plan for its resiliency. (Up to 20 points) | |||||||
| Criterion | Project incorporates resiliency elements into its design (up to 5 points) +1 Project implements recommendation(s) as identified in a Hazard Mitigation Plan, Municipal Vulnerability Plan, or climate adaptation plan ------------------------------------------------------------------ +1 Project improves stormwater infrastructure ------------------------------------------------------------------ +1 Project implements innovative resiliency solutions ------------------------------------------------------------------ +1 Project designed to meet a range of future climate projections ------------------------------------------------------------------ +1 Project demonstrates regional coordination on resiliency |
Improves evacuation route (up to 1 point) +1 Project improves an evacuation route, diversion route, or alternate diversion route |
Improves connectivity to critical facilities (up to 1 point) +1 Project improves access to critical facilities |
Project improves existing transit assets (up to 2 points) +2 Project makes significant improvements to existing transit assets +1 Project makes moderate improvements to existing transit assets +0 Project does not modernize or improve the condition of existing transit assets |
Project improves existing pedestrian facilities (up to 3 points) +3 Existing pedestrian facilities are in poor condition and improvements are included in the project +2 Existing pedestrian facilities are in fair condition and improvements are included in the project +1 Existing pedestrian facilities are in good condition and improvements are included in the project +0 Project does not improve existing pedestrian facilities |
Project improves existing bridges (up to 2 points) +2 Project improves existing bridge(s) from poor to good condition through rehabilitation or replacement +1 Project improves existing bridge(s) from fair to good condition through rehabilitation or replacement 0 Project does not include bridge improvements |
Project improves existing pavement condition (up to 2 points) +2 Current roadway condition is poor and pavement improvements are included in the project +1 Current roadway condition is fair and pavement improvements are included in the project +0 Current roadway condition is good |
Project improves other existing assets (up to 2 points) +2 Project improves three or more other assets +1 Project improves one or two other assets +0 Project does not meet or address criteria |
| Bonus/Penalty (if applicable) | Penalty -1 Project is located in an existing or projected flood zone and doesn't specify how the project will address future flooding |
N/A | N/A | N/A | Bonus (up to 1 point) +1 Project reduces or removes vehicle weight/height restrictions OR improves bridge on a key roadway |
Bonus (up to 1 point) +1 Project improves pavement on a key corridor OR improves roadway substructure |
N/A | |
| Equity Multiplier? | Yes | No | Yes | Yes | Yes | No | No | No |
| MPO Goal Area | Capacity Management/Mobility: Use existing facility capacity more efficiently and increase healthy transportation options. (Up to 18 points) | |||||||
| Criterion | Project reduces transit passenger delay (up to 3 points) +3 Project results in significant passenger delay reductions +2 Project results in moderate passenger delay reductions +1 Project results in limited passenger delay reductions +0 Project does not make meaningful reductions in passenger delay |
Project invests in New Transit Assets (up to 2 points) +2 Project makes significant investments in new transit assets +1 Project makes moderate investments in new transit assets +0 Project does not invest in new transit assets |
Project improves pedestrian network and ADA accessibility (up to 3 points) +3 Project adds new sidewalks on high-utility link +2 Project adds new sidewalks on medium-utility link +1 Project adds new sidewalks on low-utility link +0 Project does not improve pedestrian network |
Project improves bicycle network (up to 3 points) +3 Project adds new separated bicycle facility (including shared-use paths) +2 Project adds new buffered bicycle facility +1 Project adds new standard bicycle facility +0 Project does not improve bicycle network |
Project improves truck movement (up to 2 points) +2 Project significantly improves truck movement +1 Project somewhat improves truck movement +0 Project makes minimal improvements to truck movement or does not address criteria |
Project addresses unreliable corridor (up to 1 point) +1 Project addresses a corridor with a level of travel time reliability above 1.25 +0 Project does not meet or address criteria |
||
| Bonus/Penalty (if applicable) | Bonus/Penalty (+/- up to 1 point) +1 Project invests in bus-priority infrastructure on MPO-identified priority corridor -1 Project increases transit vehicle delays or negatively impacts transit vehicle movement |
N/A | Bonus (up to 1 point) +1 Project closes a gap in the pedestrian network +1 Project enhances ADA accessibility beyond minimum required standards +1 Project creates or improves pedestrian connection to transit |
Bonus (up to 1 point) +1 Project closes a gap in the bicycle network +1 Project creates or improves a bicycle connection to transit +1 Project makes accommodations for bicycle parking or bicycle share station +1 Project is on a high-utility link |
Bonus (up to 1 point) +1 Project addresses key freight corridor or makes accommodations for freight deliveries |
N/A | ||
| Equity Multiplier? | Yes | Yes | Yes | Yes | No | No | ||
| MPO Goal Area | Clean Air/Sustainable Communities: Create an environmentally friendly transportation system. (Up to 12 points) | |||||||
| Criterion | Project reduces CO2 (up to 3 points) +3 750 or more annual tons of CO2 reduced +2 250-749 annual tons of CO2 reduced +1 Less than 250 annual tons of CO2 reduced 0 No impact -1 Less than 250 annual tons of CO2 increased -3 250 or more annual tons of CO2 increased |
Project reduces other transportation-related emissions (up to 3 points) +3 1,000 or more total kilograms of VOC, NOx, CO reduced +2 250-999 total kilograms of VOC, NOx, CO reduced +1 Less than 250 total kilograms of VOC, NOx, CO reduced 0 No impact -1 Less than 250 total kilograms of VOC, NOx, CO increased -3 250 or more total kilograms of VOC, NOx, CO increased |
Enhances Natural Environment (up to 4 points) +1 Project improves water quality ------------------------------------------------------------------ +1 Project selects a design alternative that avoids impacts to sensitive natural areas ------------------------------------------------------------------ +1 Project reduces urban heat island effect ------------------------------------------------------------------ +1 Project increases access to parks, open space, or other natural assets |
|||||
| Bonus/Penalty (if applicable) | N/A | Bonus/Penalty (up to 2 points) +2 Project reduces NOx emissions in area in top 20% of regional NOx levels -2 Project increases NOx emissions in area in top 20% of regional NOx levels |
Penalty -1 Project is anticipated to lead to negative environmental outcomes |
|||||
| Equity Multiplier? | No | Yes | No | |||||
| MPO Goal Area | Economic Vitality: Ensure our transportation network provides a strong foundation for economic vitality. (Up to 12 points) | |||||||
| Criterion | Project serves sites targeted for future development (up to 3 points) +1 Project improves bicycle access to or within a site ------------------------------------------------------------------ +1 Project improves pedestrian access to or within a site ------------------------------------------------------------------ +1 Project improves transit access to or within a site |
Project serves existing employment and population centers (up to 3 points) +3 Project mostly serves an existing area of concentrated development +1 Project partly serves an existing area of concentrated development +0 Project does not serve an existing area of concentrated development |
Project demonstrates proponent investment (up to 2 points) +2 20 percent or more of the project cost is provided +1 Less than 20 percent of the project cost is provided +0 No non-TIP funding is provided by the project proponent |
Project promotes access to affordable housing opportunities (up to 3 points) +3 10.4% or more of housing units are affordable in project area +2 6.6-10.3% of housing units are affordable in project area +1 1-6.5% of housing units are affordable in project area +0 Less than 1% of housing units are affordable in project area |
||||
| Bonus/Penalty (if applicable) | N/A | N/A | Bonus (up to 1 point) +1 Project proponent supports design process through pilot project OR robust community outreach process |
N/A | ||||
| Equity Multiplier? | No | No | No | No | ||||
| Total Base Points Possible | 80 | |||||||
| Total Equity Points Possible | 20 | |||||||
| Total Possible Points | 100 | |||||||
Table A-8
FFYs 2024–28 TIP Evaluation Criteria: Intersection Improvements Program
| MPO Goal Area | Safety: Transportation by all modes will be safe. (Up to 21 points) | ||||||
| Criterion | Project addresses severe-crash location (up to 3 points) +3 EPDO value of 300 or more +2 EPDO value of 100 to 299 +1 EPDO value of less than 100 +0 No EPDO value |
Project addresses high-crash location (up to 3 points) Signalized Intersection: +3 Crash rate of 1.69 or greater +2 Crash rate between 1.02 and 1.69 +1 Crash rate between 0.35 and 1.02 +0 Crash rate below 0.35 Unsignalized Intersection: +3 Crash rate of 1.36 or greater +2 Crash rate between 0.78 and 1.36 +1 Crash rate between 0.20 and 0.78 +0 Crash rate below 0.20 |
Project addresses truck-related safety issue (up to 2 points) +2 High total effectiveness of truck safety improvements +1 Medium total effectiveness of truck safety improvements +0 Low total effectiveness or no implementation of truck safety improvements |
Project improves bicycle safety (up to 3 points) +3 High total effectiveness of bicycle safety improvements +2 Medium total effectiveness of bicycle safety improvements +1 Low total effectiveness of bicycle safety improvements +0 Project does not include bicycle safety improvements |
Project improves pedestrian safety (up to 3 points) +3 High total effectiveness of pedestrian safety improvements +2 Medium total effectiveness of pedestrian safety improvements +1 Low total effectiveness of pedestrian safety improvements +0 Project does not include pedestrian safety improvements |
Project improves safety for all users (up to 3 points) +3 Project includes three or more eligible multimodal safety improvements +2 Project includes two eligible multimodal safety improvements +1 Project includes one eligible multimodal safety improvement +0 Project does not include any eligible multimodal safety improvements |
|
| Bonus/Penalty (if applicable) | N/A | N/A | N/A | Bonus (up to 1 point) +1 Improves bicycle safety at bicycle HSIP cluster |
Bonus (up to 1 point) +1 Improves pedestrian safety at pedestrian HSIP cluster |
Bonus (up to 2 points) +2 Addresses safety at multiple all-mode HSIP clusters OR a top-200 crash location +1 Addresses safety at one all-mode HSIP cluster |
|
| Equity Multiplier? | Yes | No | No | Yes | Yes | No | |
| MPO Goal Area | System Preservation: Maintain and modernize the transportation system and plan for its resiliency. (Up to 17 points) | ||||||
| Criterion | Project incorporates resiliency elements into its design (up to 5 points) +1 Project implements recommendation(s) as identified in a Hazard Mitigation Plan, Municipal Vulnerability Plan, or climate adaptation plan ------------------------------------------------------------------ +1 Project improves stormwater infrastructure ------------------------------------------------------------------ +1 Project implements innovative resiliency solutions ------------------------------------------------------------------ +1 Project designed to meet a range of future climate projections ------------------------------------------------------------------ +1 Project demonstrates regional coordination on resiliency |
Improves evacuation route (up to 1 point) +1 Project improves an evacuation route, diversion route, or alternate diversion route |
Improves connectivity to critical facilities (up to 1 point) +1 Project improves access to critical facilities |
Project improves existing transit assets (up to 2 points) +2 Project makes significant improvements to existing transit assets +1 Project makes moderate improvements to existing transit assets +0 Project does not modernize or improve the condition of existing transit assets |
Project improves existing pedestrian facilities (up to 3 points) +3 Existing pedestrian facilities are in poor condition and improvements are included in the project +2 Existing pedestrian facilities are in fair condition and improvements are included in the project +1 Existing pedestrian facilities are in good condition and improvements are included in the project +0 Project does not improve existing pedestrian facilities |
Project improves existing pavement condition (up to 2 points) +2 Current roadway condition is poor and pavement improvements are included in the project +1 Current roadway condition is fair and pavement improvements are included in the project +0 Current roadway condition is good |
Project improves other existing assets (up to 2 points) +2 Project improves three or more other assets +1 Project improves one or two other assets +0 Project does not meet or address criteria |
| Bonus/Penalty (if applicable) | Penalty -1 Project is located in an existing or projected flood zone and doesn't specify how the project will address future flooding |
N/A | N/A | N/A | Bonus (up to 1 point) +1 Project improves pavement on a key corridor OR improves roadway substructure |
N/A | |
| Equity Multiplier? | Yes | No | Yes | Yes | Yes | No | No |
| MPO Goal Area | Capacity Management/Mobility: Use existing facility capacity more efficiently and increase healthy transportation options. (Up to 18 points) | ||||||
| Criterion | Project reduces transit passenger delay (up to 3 points) +3 Project results in significant passenger delay reductions +2 Project results in moderate passenger delay reductions +1 Project results in limited passenger delay reductions +0 Project does not make meaningful reductions in passenger delay |
Project invests in New Transit Assets (up to 2 points) +2 Project makes significant investments in new transit assets +1 Project makes moderate investments in new transit assets +0 Project does not invest in new transit assets |
Project improves pedestrian network and ADA accessibility (up to 3 points) +3 Project adds new sidewalks on high-utility link +2 Project adds new sidewalks on medium-utility link +1 Project adds new sidewalks on low-utility link +0 Project does not improve pedestrian network |
Project improves bicycle network (up to 3 points) +3 Project adds new separated bicycle facility (including shared-use paths) +2 Project adds new buffered bicycle facility +1 Project adds new standard bicycle facility +0 Project does not improve bicycle network |
Project improves truck movement (up to 2 points) +2 Project significantly improves truck movement +1 Project somewhat improves truck movement +0 Project makes minimal improvements to truck movement or does not address criteria |
Project addresses unreliable corridor (up to 1 point) +1 Project addresses a corridor with a level of travel time reliability above 1.25 +0 Project does not meet or address criteria |
|
| Bonus/Penalty (if applicable) | Bonus/Penalty (+/- up to 1 point) +1 Project invests in bus-priority infrastructure on MPO-identified priority corridor -1 Project increases transit vehicle delays or negatively impacts transit vehicle movement |
N/A | Bonus (up to 1 point) +1 Project closes a gap in the pedestrian network +1 Project enhances ADA accessibility beyond minimum required standards +1 Project creates or improves pedestrian connection to transit |
Bonus (up to 1 point) +1 Project closes a gap in the bicycle network +1 Project creates or improves a bicycle connection to transit +1 Project makes accommodations for bicycle parking or bicycle share station +1 Project is on a high-utility link |
Bonus (up to 1 point) +1 Project addresses key freight corridor or makes accommodations for freight deliveries |
N/A | |
| Equity Multiplier? | Yes | Yes | Yes | Yes | No | No | |
| MPO Goal Area | Clean Air/Sustainable Communities: Create an environmentally friendly transportation system. (Up to 12 points) | ||||||
| Criterion | Project reduces CO2 (up to 3 points) +3 750 or more annual tons of CO2 reduced +2 250-749 annual tons of CO2 reduced +1 Less than 250 annual tons of CO2 reduced 0 No impact -1 Less than 250 annual tons of CO2 increased -3 250 or more annual tons of CO2 increased |
Project reduces other transportation-related emissions (up to 3 points) +3 1,000 or more total kilograms of VOC, NOx, CO reduced +2 250-999 total kilograms of VOC, NOx, CO reduced +1 Less than 250 total kilograms of VOC, NOx, CO reduced 0 No impact -1 Less than 250 total kilograms of VOC, NOx, CO increased -3 250 or more total kilograms of VOC, NOx, CO increased |
Enhances Natural Environment (up to 4 points) +1 Project improves water quality ------------------------------------------------------------------ +1 Project selects a design alternative that avoids impacts to sensitive natural areas ------------------------------------------------------------------ +1 Project reduces urban heat island effect ------------------------------------------------------------------ +1 Project increases access to parks, open space, or other natural assets |
||||
| Bonus/Penalty (if applicable) | N/A | Bonus/Penalty (up to 2 points) +2 Project reduces NOx emissions in area in top 20% of regional NOx levels -2 Project increases NOx emissions in area in top 20% of regional NOx levels |
Penalty -1 Project is anticipated to lead to negative environmental outcomes |
||||
| Equity Multiplier? | No | Yes | No | ||||
| MPO Goal Area | Economic Vitality: Ensure our transportation network provides a strong foundation for economic vitality. (Up to 12 points) | ||||||
| Criterion | Project serves sites targeted for future development (up to 3 points) +1 Project improves bicycle access to or within a site ------------------------------------------------------------------ +1 Project improves pedestrian access to or within a site ------------------------------------------------------------------ +1 Project improves transit access to or within a site |
Project serves existing employment and population centers (up to 3 points) +3 Project mostly serves an existing area of concentrated development +1 Project partly serves an existing area of concentrated development +0 Project does not serve an existing area of concentrated development |
Project demonstrates proponent investment (up to 2 points) +2 20 percent or more of the project cost is provided +1 Less than 20 percent of the project cost is provided +0 No non-TIP funding is provided by the project proponent |
Project promotes access to affordable housing opportunities (up to 3 points) +3 10.4% or more of housing units are affordable in project area +2 6.6-10.3% of housing units are affordable in project area +1 1-6.5% of housing units are affordable in project area +0 Less than 1% of housing units are affordable in project area |
|||
| Bonus/Penalty (if applicable) | N/A | N/A | Bonus (up to 1 point) +1 Project proponent supports design process through pilot project OR robust community outreach process |
N/A | |||
| Equity Multiplier? | No | No | No | No | |||
| Total Base Points Possible | 80 | ||||||
| Total Equity Points Possible | 20 | ||||||
| Total Possible Points | 100 | ||||||
Table A-9
FFYs 2024–28 TIP Evaluation Criteria: Major Infrastructure Program
| MPO Goal Area | Safety: Transportation by all modes will be safe. (Up to 18 points) | |||||||
| Criterion | Project addresses severe-crash location (up to 3 points) +3 EPDO value of 1000 or more +2 EPDO value of 250 to 999 +1 EPDO value of less than 250 +0 No EPDO value |
Project addresses high-crash location (up to 3 points) For corridor projects: +3 Crash rate of 6.45 or greater +2 Crash rate between 4.25 and 6.45 +1 Crash rate between 2.05 and 4.25 +0 Crash rate below 2.05 ------------------------------------------------------------------ For intersection and interchange projects: Signalized Intersection: +3 Crash rate of 1.69 or greater +2 Crash rate between 1.02 and 1.69 +1 Crash rate between 0.35 and 1.02 +0 Crash rate below 0.35 Unsignalized Intersection: +3 Crash rate of 1.36 or greater +2 Crash rate between 0.78 and 1.36 +1 Crash rate between 0.20 and 0.78 +0 Crash rate below 0.20 |
Project addresses truck-related safety issue (up to 2 points) +2 High total effectiveness of truck safety improvements +1 Medium total effectiveness of truck safety improvements +0 Low total effectiveness or no implementation of truck safety improvements |
Project improves bicycle safety (up to 2 points) +2 High total effectiveness of bicycle safety improvements +1 Medium total effectiveness of bicycle safety improvements +0 Low total effectiveness or no inclusion of bicycle safety improvements |
Project improves pedestrian safety (up to 2 points) +2 High total effectiveness of pedestrian safety improvements +1 Medium total effectiveness of pedestrian safety improvements +0 Low total effectiveness or no inclusion of pedestrian safety improvements |
Project improves safety for all users (up to 2 points) +2 Project includes three or more eligible multimodal safety improvements +1 Project includes one or two eligible multimodal safety improvements +0 Project does not include any eligible multimodal safety improvements |
||
| Bonus/Penalty (if applicable) | N/A | N/A | N/A | Bonus (up to 1 point) +1 Improves bicycle safety at bicycle HSIP cluster |
Bonus (up to 1 point) +1 Improves pedestrian safety at pedestrian HSIP cluster |
Bonus (up to 2 points) +2 Addresses safety at multiple all-mode HSIP clusters OR a top-200 crash location +1 Addresses safety at one all-mode HSIP cluster |
||
| Equity Multiplier? | Yes | No | No | Yes | Yes | No | ||
| MPO Goal Area | System Preservation: Maintain and modernize the transportation system and plan for its resiliency. (Up to 20 points) | |||||||
| Criterion | Project incorporates resiliency elements into its design (up to 5 points) +1 Project implements recommendation(s) as identified in a Hazard Mitigation Plan, Municipal Vulnerability Plan, or climate adaptation plan ------------------------------------------------------------------ +1 Project improves stormwater infrastructure ------------------------------------------------------------------ +1 Project implements innovative resiliency solutions ------------------------------------------------------------------ +1 Project designed to meet a range of future climate projections ------------------------------------------------------------------ +1 Project demonstrates regional coordination on resiliency |
Improves evacuation route (up to 1 point) +1 Project improves an evacuation route, diversion route, or alternate diversion route |
Improves connectivity to critical facilities (up to 1 point) +1 Project improves access to critical facilities |
Project improves existing transit assets (up to 2 points) +2 Project makes significant improvements to existing transit assets +1 Project makes moderate improvements to existing transit assets +0 Project does not modernize or improve the condition of existing transit assets |
Project improves existing pedestrian facilities (up to 3 points) +3 Existing pedestrian facilities are in poor condition and improvements are included in the project +2 Existing pedestrian facilities are in fair condition and improvements are included in the project +1 Existing pedestrian facilities are in good condition and improvements are included in the project +0 Project does not improve existing pedestrian facilities |
Project improves existing bridges (up to 2 points) +2 Project improves existing bridge(s) from poor to good condition through rehabilitation or replacement +1 Project improves existing bridge(s) from fair to good condition through rehabilitation or replacement 0 Project does not include bridge improvements |
Project improves existing pavement condition (up to 2 points) +2 Current roadway condition is poor and pavement improvements are included in the project +1 Current roadway condition is fair and pavement improvements are included in the project +0 Current roadway condition is good |
Project improves other existing assets (up to 2 points) +2 Project improves three or more other assets +1 Project improves one or two other assets +0 Project does not meet or address criteria |
| Bonus/Penalty (if applicable) | Penalty -1 Project is located in an existing or projected flood zone and doesn't specify how the project will address future flooding |
N/A | N/A | N/A | Bonus (up to 1 point) +1 Project reduces or removes vehicle weight/height restrictions OR improves bridge on a key roadway |
Bonus (up to 1 point) +1 Project improves pavement on a key corridor OR improves roadway substructure |
N/A | |
| Equity Multiplier? | Yes | No | Yes | Yes | Yes | No | No | No |
| MPO Goal Area | Capacity Management/Mobility: Use existing facility capacity more efficiently and increase healthy transportation options. (Up to 18 points) | |||||||
| Criterion | Project reduces transit passenger delay (up to 3 points) +3 Project results in significant passenger delay reductions +2 Project results in moderate passenger delay reductions +1 Project results in limited passenger delay reductions +0 Project does not make meaningful reductions in passenger delay |
Project invests in New Transit Assets (up to 2 points) +2 Project makes significant investments in new transit assets +1 Project makes moderate investments in new transit assets +0 Project does not invest in new transit assets |
Project improves pedestrian network and ADA accessibility (up to 3 points) +3 Project adds new sidewalks on high-utility link +2 Project adds new sidewalks on medium-utility link +1 Project adds new sidewalks on low-utility link +0 Project does not improve pedestrian network |
Project improves bicycle network (up to 3 points) +3 Project adds new separated bicycle facility (including shared-use paths) +2 Project adds new buffered bicycle facility +1 Project adds new standard bicycle facility +0 Project does not improve bicycle network |
Project improves truck movement (up to 2 points) +2 Project significantly improves truck movement +1 Project somewhat improves truck movement +0 Project makes minimal improvements to truck movement or does not address criteria |
Project addresses unreliable corridor (up to 1 point) +1 Project addresses a corridor with a level of travel time reliability above 1.25 +0 Project does not meet or address criteria |
||
| Bonus/Penalty (if applicable) | Bonus/Penalty (+/- up to 1 point) +1 Project invests in bus-priority infrastructure on MPO-identified priority corridor -1 Project increases transit vehicle delays or negatively impacts transit vehicle movement |
N/A | Bonus (up to 1 point) +1 Project closes a gap in the pedestrian network +1 Project enhances ADA accessibility beyond minimum required standards +1 Project creates or improves pedestrian connection to transit |
Bonus (up to 1 point) +1 Project closes a gap in the bicycle network +1 Project creates or improves a bicycle connection to transit +1 Project makes accommodations for bicycle parking or bicycle share station +1 Project is on a high-utility link |
Bonus (up to 1 point) +1 Project addresses key freight corridor or makes accommodations for freight deliveries |
N/A | ||
| Equity Multiplier? | Yes | Yes | Yes | Yes | No | No | ||
| MPO Goal Area | Clean Air/Sustainable Communities: Create an environmentally friendly transportation system. (Up to 12 points) | |||||||
| Criterion | Project reduces CO2 (up to 3 points) +3 750 or more annual tons of CO2 reduced +2 250-749 annual tons of CO2 reduced +1 Less than 250 annual tons of CO2 reduced 0 No impact -1 Less than 250 annual tons of CO2 increased -3 250 or more annual tons of CO2 increased |
Project reduces other transportation-related emissions (up to 3 points) +3 1,000 or more total kilograms of VOC, NOx, CO reduced +2 250-999 total kilograms of VOC, NOx, CO reduced +1 Less than 250 total kilograms of VOC, NOx, CO reduced 0 No impact -1 Less than 250 total kilograms of VOC, NOx, CO increased -3 250 or more total kilograms of VOC, NOx, CO increased |
Enhances Natural Environment (up to 4 points) +1 Project improves water quality ------------------------------------------------------------------ +1 Project selects a design alternative that avoids impacts to sensitive natural areas ------------------------------------------------------------------ +1 Project reduces urban heat island effect ------------------------------------------------------------------ +1 Project increases access to parks, open space, or other natural assets |
|||||
| Bonus/Penalty (if applicable) | N/A | Bonus/Penalty (up to 2 points) +2 Project reduces NOx emissions in area in top 20% of regional NOx levels -2 Project increases NOx emissions in area in top 20% of regional NOx levels |
Penalty -1 Project is anticipated to lead to negative environmental outcomes |
|||||
| Equity Multiplier? | No | Yes | No | |||||
| MPO Goal Area | Economic Vitality: Ensure our transportation network provides a strong foundation for economic vitality. (Up to 12 points) | |||||||
| Criterion | Project serves sites targeted for future development (up to 3 points) +1 Project improves bicycle access to or within a site ------------------------------------------------------------------ +1 Project improves pedestrian access to or within a site ------------------------------------------------------------------ +1 Project improves transit access to or within a site |
Project serves existing employment and population centers (up to 3 points) +3 Project mostly serves an existing area of concentrated development +1 Project partly serves an existing area of concentrated development +0 Project does not serve an existing area of concentrated development |
Project demonstrates proponent investment (up to 2 points) +2 20 percent or more of the project cost is provided +1 Less than 20 percent of the project cost is provided +0 No non-TIP funding is provided by the project proponent |
Project promotes access to affordable housing opportunities (up to 3 points) +3 10.4% or more of housing units are affordable in project area +2 6.6-10.3% of housing units are affordable in project area +1 1-6.5% of housing units are affordable in project area +0 Less than 1% of housing units are affordable in project area |
||||
| Bonus/Penalty (if applicable) | N/A | N/A | Bonus (up to 1 point) +1 Project proponent supports design process through pilot project OR robust community outreach process |
N/A | ||||
| Equity Multiplier? | No | No | No | No | ||||
| Total Base Points Possible | 80 | |||||||
| Total Equity Points Possible | 20 | |||||||
| Total Possible Points | 100 | |||||||
Table A-10
Evaluation Criteria for FFYs 2021-25 TIP and Prior TIP Cycles (Archived)
| OBJECTIVES | CRITERIA | SUBCRITERIA/SCORING |
| SAFETY: Transportation by all modes will be safe. | ||
| Reduce the number and severity of crashes and safety incidents for all modes Reduce serious injuries and fatalities from transportation Make investments and support initiatives that help protect transportation customers, employees, and the public from safety and security threats |
Crash severity value: EPDO index (0–5 points) |
+5 EPDO value of 300 or more +4 EPDO value between 200 and 299 +3 EPDO value between 100 and 199 +2 EPDO value between 50 and 99 +1 EPDO value less than 50 +0 No EPDO value |
| Crash rate (intersections and corridors) (0–5 points) |
Intersection Evaluation Score Signalized Unsignalized +5 ≥ 1.69 ≥ 1.36 +4 1.31–1.69 1.03–1.36 +3 0.93–1.31 0.70–1.03 +2 0.55–0.93 0.37–0.70 +1 0.36–0.55 0.21–0.37 +0 < 0.36 < 0.21 |
|
| Corridor Interstate Principal Arterials or Other Evaluation Other Freeways Minor Arterials Score Expressways Major–Minor Collectors +5 ≥ 1.81 ≥ 6.45 +4 1.40–1.81 5.35–6.45 +3 1.00–1.40 4.25–5.35 +2 0.59–1.00 3.15– 4.25 +1 0.40–0.59 2.05–3.15 +0 < 0.40 < 2.05 |
||
| Improves truck-related safety issue (0–5 points) |
+3 High total effectiveness of truck safety countermeasures +2 Medium total effectiveness of truck safety countermeasures +1 Low total effectiveness of truck safety countermeasures +0 Does not implement truck safety countermeasures |
|
| If project scores points above, then it is eligible for additional points below: +2 Improves truck safety at HSIP Cluster |
||
| Improves bicycle safety (0–5 points) |
+3 High total effectiveness of bicycle safety countermeasures +2 Medium total effectiveness of bicycle safety countermeasures +1 Low total effectiveness of bicycle safety countermeasures +0 Does not implement bicycle safety countermeasures |
|
| If project scores points above, then it is eligible for additional points below: +2 Improves bicycle safety at HSIP Bicycle Cluster +1 Improves bicycle safety at HSIP Cluster |
||
| Improves pedestrian safety (0–5 points) |
+3 High total effectiveness of pedestrian safety countermeasures +2 Medium total effectiveness of pedestrian safety countermeasures +1 Low total effectiveness of pedestrian safety countermeasures +0 Does not implement pedestrian safety countermeasures |
|
| If project scores points above, then it is eligible for additional points below: +2 Improves pedestrian safety at HSIP Pedestrian Cluster +1 Improves pedestrian safety at HSIP Cluster |
||
| Improves safety or removes an at-grade railroad crossing (0–5 points) |
+5 Removes an at-grade railroad crossing +3 Significantly improves safety at an at-grade railroad crossing +1 Improves safety at an at-grade railroad crossing +0 Does not include a railroad crossing |
|
| SAFETY (30 possible points) | ||
| SYSTEM PRESERVATION AND MODERNIZATION: Maintain and modernize the transportation system and plan for its resiliency. | ||
| Maintain the transportation system, including roadway, transit, and active transportation infrastructure, in a state of good repair Modernize transportation infrastructure across all modes Prioritize projects that support planned response capability to existing or future extreme conditions (sea level rise, flooding, and other natural and security-related man-made impacts) |
Improves substandard roadway bridge(s) (0–3 points) |
+3 Condition is structurally deficient and improvements are included in the project +1 Condition is functionally obsolete and improvements are included in the project +0 Does not improve substandard bridge or does not include a bridge |
| Improves substandard pavement (0–6 points) |
+6 IRI rating greater than 320: Poor condition and pavement improvements are included in the project +4 IRI rating between 320 and 191: Fair condition and pavement improvements are included in the project +0 IRI rating less than 190: Good or better condition |
|
| Improves substandard traffic signal equipment (0–6 points) |
+6 Poor condition and improvements are included in the project +4 Fair condition and improvements are included in the project +0 Does not meet or address criteria |
|
| Improves transit asset(s) (0–3 points) |
+2 Brings transit asset into state of good repair +1 Meets an identified-need in an asset management plan +0 Does not meet or address criteria |
|
| Improves substandard sidewalk(s) (0–3 points) |
+3 Poor condition and sidewalk improvements are included in the project +2 Fair condition and sidewalk improvements are included in the project +0 Sidewalk condition is good or better |
|
| Improves emergency response (0–2 points) |
+1 Project improves an evacuation route, diversion route, or alternate diversion route |
|
| +1 Project improves an access route to or in proximity to an emergency support location |
||
| Improves ability to respond to extreme conditions (0–6 points) |
+2 Addresses flooding problem and/or sea level rise and enables facility to function in such a condition |
|
| +1 Brings facility up to current seismic design standards | ||
| +1 Addresses critical transportation infrastructure |
||
| +1 Protects freight network elements |
||
| +1 Implements hazard mitigation or climate adaptation plans | ||
| SYSTEM PRESERVATION AND MODERNIZATION (29 possible points) | ||
| CAPACITY MANAGEMENT AND MOBILITY: Use existing facility capacity more efficiently and increase transportation options. | ||
| Improve access to and accessibility of all modes, especially transit and active transportation Support roadway management and operations strategies to improve travel reliability, mitigate congestion, and support non-single-occupant-vehicle travel Emphasize capacity management through low-cost investments; prioritize projects that focus on lower-cost operations/ management-type improvements such as intersection improvements, transit priority, and Complete Streets solutions Improve reliability of transit Increase percentage of population and employment within one-quarter mile of transit stations and stops Support community-based and private-initiative services to meet first- and last-mile, reverse commute, and other non-traditional transportation needs, including those of people 75 years old or older and people with disabilities Support strategies to better manage automobile and bicycle parking capacity and usage at transit stations Fund improvements to bicycle and pedestrian networks aimed at creating a connected network of bicycle and accessible sidewalk facilities by expanding existing facilities and closing gaps Increase percentage of population and places of employment with access to facilities on the bicycle network Eliminate bottlenecks on the freight network, improve freight reliability, and enhance freight intermodal connections |
Reduces transit vehicle delay (0–4 points) |
+3 5 hours or more of daily transit vehicle delay reduced +2 1–5 hours of daily transit vehicle delay reduced +1 Less than one hour of daily transit vehicle delay reduced +0 Does not reduce transit delay |
| If project scores points above, then it is eligible for additional points below: |
||
| Improves pedestrian network and ADA accessibility (0–5 points) |
+2 Adds new sidewalk(s) (including shared-use paths) | |
| +2 Improves ADA accessibility |
||
| +1 Closes a gap in the pedestrian network |
||
| +0 Does not improve pedestrian network | ||
| Improves bicycle network (0–4 points) |
+3 Adds new physically separated bicycle facility (including shared-use paths) +2 Adds new buffered bicycle facility +1 Adds new standard bicycle facility |
|
| +1 Closes a gap in the bicycle network +0 Does not improve bicycle network |
||
| Improves intermodal accommodations/ connections to transit (0–6 points) |
+6 Meets or addresses criteria to a high degree +4 Meets or addresses criteria to a medium degree +2 Meets or addresses criteria to a low degree +0 Does not meet or address criteria |
|
| Improves truck movement (0–4 points) |
+3 Meets or addresses criteria to a high degree +2 Meets or addresses criteria to a medium degree +1 Meets or addresses criteria to a low degree +0 Does not meet or address criteria |
|
| If project scores points above, then it is eligible for additional points below: +1 Addresses MPO-identified bottleneck location |
||
| Reduces vehicle congestion (0–6 points) |
+6 400 hours or more of daily vehicle delay reduced +4 100–400 hours of daily vehicle delay reduced +2 Less than 100 hours of daily vehicle delay reduced +0 Does not meet or address criteria |
|
| CAPACITY MANAGEMENT AND MOBILITY (29 possible points) | ||
| CLEAN AIR/SUSTAINABLE COMMUNITIES: Create an environmentally friendly transportation system. | ||
| Reduce greenhouse gases generated in the Boston region by all transportation modes Reduce other transportation-related pollutants Minimize negative environmental impacts of the transportation system Support land use policies consistent with smart, healthy, and resilient growth |
Reduces CO2 (-5–5 points) |
+5 1,000 or more annual tons of CO2 reduced +4 500–999 annual tons of CO2 reduced +3 250–499 annual tons of CO2 reduced +2 100–249 annual tons of CO2 reduced +1 Less than 100 annual tons of CO2 reduced 0 No impact -1 Less than 100 annual tons of CO2 increased -3 250–499 annual tons of CO2 increased -4 500–999 annual tons of CO2 increased -5 1,000 or more annual tons of CO2 increased |
| Reduces other transportation-related emissions (VOC, NOx, CO) (-5–5 points) |
+5 2,000 or more total kilograms of VOC, NOx, CO reduced +4 1,000–1999 total kilograms of VOC, NOx, CO reduced +3 500–999 total kilograms of VOC, NOx, CO reduced +2 250–499 total kilograms of VOC, NOx, CO reduced +1 Less than 250 total kilograms of VOC, NOx, CO reduced 0 No impact -1 Less than 250 total kilograms of VOC, NOx, CO increased -2 250–499 total kilograms of VOC, NOx, CO increased -3 500–999 total kilograms of VOC, NOx, CO increased -4 1,000–1999 total kilograms of VOC, NOx, CO increased -5 2,000 or more total kilograms of VOC, NOx, CO increased |
|
| Addresses environmental impacts (0–4 points) |
+1 Addresses water quality | |
| +1 Addresses cultural resources/open space |
||
| +1 Addresses wetlands/resource areas |
||
| +1 Addresses wildlife preservation/protected habitats |
||
| +0 Does not meet or address criteria | ||
| Is in an EOEEA-certified "Green Community" (0–2 points) |
+2 Project is located in a “Green Community” +0 Project is not located in a "Green Community" |
|
| CLEAN AIR/SUSTAINABLE COMMUNITIES (16 possible points) | ||
| TRANSPORTATION EQUITY: Ensure that all people receive comparable benefits from, and are not disproportionately burdened by, MPO investments, regardless of race, color, national origin, age, income, ability, or sex. | ||
| Prioritize MPO investments that benefit equity populations Minimize potential harmful environmental, health, and safety effects of MPO funded projects for all equity populations Promote investments that support transportation for all ages (age-friendly communities) Promote investments that are accessible to all people regardless of ability |
Serves Title VI/non-discrimination populations (-10–12 points) |
+2 Serves minority (high concentration) population (>2,000 people) +1 Serves minority (low concentration) population (≤ 2,000 people) |
| +2 Serves low-income (high concentration) population (>2,000 people) +1 Serves low-income (low concentration) population (≤ 2,000 people) |
||
| +2 Serves limited-English proficiency (high concentration) population (>1,000 people) +1 Serves limited-English proficiency (low concentration) population (≤ 1,000 people) |
||
| +2 Serves elderly (high concentration) population (>2,000 people) +1 Serves elderly (low concentration) population (≤ 2,000 people) |
||
| +2 Serves zero vehicle households (high concentration) population (>1,000 people) +1 Serves zero vehicle households (low concentration) population (≤ 1,000 people) |
||
| +2 Serves persons with disabilities (high concentration) population (>1,000 people) +1 Serves persons with disabilities (low concentration) population (≤ 1,000 people) |
||
| +0 Does not serve Title VI or non-discrimination populations -10 Creates a burden for Title VI/non -discrimination populations |
||
| TRANSPORTATION EQUITY (12 possible points) | ||
| ECONOMIC VITALITY: Ensure our transportation network provides a strong foundation for economic vitality. | ||
| Respond to mobility needs of the workforce population Minimize the burden of housing and transportation costs for residents in the region Prioritize transportation investments that serve residential, commercial, and logistics targeted development sites and "Priority Places" identified in the MBTA's Focus 40 plan Prioritize transportation investments consistent with compact-growth strategies of the regional transportation plan |
Serves targeted development site (0–6 points) |
+2 Provides new transit access to or within site +1 Improves transit access to or within site +1 Provides for bicycle access to or within site +1 Provides for pedestrian access to or within site +1 Provides for improved road access to or within site +0 Does not provide any of the above measures |
| Provides for development consistent with the compact growth strategies of MetroFuture (0–5 points) |
+2 Mostly serves an existing area of concentrated development +1 Partly serves an existing area of concentrated development +1 Supports local zoning or other regulations that are supportive of smart growth development +2 Complements other local financial or regulatory support that fosters economic revitalization in a manner consistent with smart growth development principles +0 Does not provide any of the above measures |
|
| Provides multimodal access to an activity center (0–4 points) |
+1 Provides transit access (within a quarter mile) to an activity center | |
| +1 Provides truck access to an activity center |
||
| +1 Provides bicycle access to an activity center |
||
| +1 Provides pedestrian access to an activity center |
||
| +0 Does not provide multimodal access |
||
| Leverages other investments (non-TIP funding) (0–3 points) |
+3 Meets or addresses criteria to a high degree (>30 percent of the project cost) +2 Meets or addresses criteria to a medium degree (10–30 percent of the project cost) +1 Meets or addresses criteria to a low degree (< 10 percent of the project cost) +0 Does not meet or address criteria |
|
| ECONOMIC VITALITY (18 possible points) | ||
| TOTAL SCORE (134 possible points) | ||
Table A-11
Evaluation Criteria for FFY 2021 Community Connections Program (Archived)
| Key | ||
| Blue = Criteria that apply to all projects | ||
| Green = Criteria for capital projects | ||
| Red/Pink = Criteria for operating projects | ||
| OBJECTIVE | CRITERIA | FACTORS |
| PROJECT ELIGIBILITY VERIFICATION | ||
| Each project funded through this program must show an air quality benefit when analyzed through the MPO’s air quality analysis process. Projects must be ready to begin construction or operation by October 2020. Project sponsors or proponents must demonstrate that they have gained support from stakeholders and have the institutional capacity to carry out the project within the MPO timeframe. |
Air Quality Analysis | Projects must pass a spreadsheet-based air quality benefit test based on a variety of data inputs customized to the type of project. |
| Proponent's Project Management Capacity |
Names, experience, and time commitment of project management staff, as provided by the proponent. | |
| GENERAL SCORING CRITERIA (30 possible points) | ||
| Network or connectivity value (6 points) | ||
| The primary purpose of the Community Connections Program is to close gaps in the transportation network, especially those in the first or last mile between transit and a destination. Projects will be awarded points based on how effectively a proposed project closes different types of gaps and makes travel easier or more efficient. |
Connection to existing activity hubs and residential developments (2 points) |
Proximity of the project or service to employment, residential, and civic activity hubs, such as dense areas of employment or housing. |
| Connection to existing transit hubs (2 points) |
Proximity of the project to transit service, with added incentive for connecting to frequent or high-quality service. | |
| Connection to other transportation infrastructure (2 points) | Proximity of the project to sidewalk or protected or off-road bicycle infrastructure. | |
| Coordination or cooperation between multiple entities (5 points) | ||
| The MPO prioritizes collaboration among different entities in the transportation planning process. Cooperative project planning and execution is particularly important for first-mile and last-mile connections of the type that the Community Connections Program is intended to facilitate. The cooperation can involve actors from both the public and private sectors. |
Number of collaborating entities (5 points) |
Number and variety (judged by sector of origin) of entities collaborating to support the project. |
| Inclusion in and consistency with local and regional plans (5 points) | ||
| A comprehensive planning process is important to ensure that projects occur in an environment of collaboration and careful consideration rather than independently. This criterion proposes to award points based on the extent to which a proposed project has been included in prior plans at both the local and regional levels, and whether it meets the goals of those plans. | Inclusion in local plans (2 points) |
Whether the project is included as a need or priority in a local comprehensive plan. |
| Inclusion in MPO plans (2 points) |
Whether the project is identified as a need in the LRTP Needs Assessment or recommended in an MPO or MAPC study. | |
| Inclusion in statewide plans (1 point) |
Whether the project is included as a need or priority in a MassDOT or other statewide study. | |
| Transportation equity (5 points) | ||
| The MPO seeks to target investments to areas that benefit a high percentage of low-income and minority populations; minimize any burdens associated with MPO-funded projects in low-income and minority areas; and break down barriers to participation in MPO-decision making. | Serves a demographic of transportation equity concern, as identified by the MPO (5 points) | The extent to which the project serves equity populations. |
| Generation of mode shift (4 points) | ||
| Another primary purpose of the Community Connection Program is to enable modal shift from SOV to transit or other modes. This criterion would award points based on the project’s effectiveness at creating mode shift and/or enabling trips that were previously impossible by non-SOV modes. |
Allow new trips that would not be otherwise possible without a car (4 points) |
Whether the project adds to overall non-automotive mobility by creating new connections or making trips possible that were not previously, without detracting from or competing with existing transit options. |
| Demand projection (4 points) | ||
| Gaining an understanding of how many transportation network users a project will reach is crucial for understanding its cost-effectiveness. | Overall demand estimate (2 points) | Presence of demand/usage estimates and quality of analysis used to support them in the application materials. |
| Staff evaluation of demand estimate (2 points) | Whether staff judge the demand/usage projections realistic. | |
| TYPE-SPECIFIC EVALUATION CRITERIA: CAPITAL PROJECTS (30 points) | ||
| SAFETY BENEFITS (12 points) | ||
| Bicycle safety (6 points) | ||
| Improving safety on the regional transportation network is one of the MPO’s key goals. This criterion would award points to projects that improve safety for the most vulnerable users of the network – people walking and people riding bicycles. An overall score of the effectiveness of bicycle safety countermeasures will be made through professional judgement comparing existing facilities, safety issues, use, and desired/anticipated use to the proposed bicycle safety countermeasures planned to be implemented as part of the project. | Total effectiveness of bicycle safety countermeasures (6 points) | Existing and potential bicyclist usage of the infrastructure and effectiveness of the expected safety improvements. |
| Pedestrian safety (6 points) | ||
| An overall score of the effectiveness of pedestrian safety countermeasures will be made through professional judgement comparing existing facilities, safety issues, use, and desired/anticipated use to the proposed pedestrian safety countermeasures planned to be implemented as part of the project. | Total effectiveness of pedestrian safety countermeasures (6 points) | Existing and potential pedestrian usage of the infrastructure and effectiveness of the expected safety improvements. |
| Lifecycle cost-effectiveness (10 points) | ||
| In addition to the initial construction costs, the MPO is concerned that projects funded through the Community Connection Program remain fiscally sustainable after MPO-awarded funding runs out. Projects proposed to the program should be cost-effective compared to potential alternatives, and proponents should demonstrate that local maintenance budgets will be able to accommodate the increased costs of maintaining the project. | Lifecycle Alternatives Analysis (5 Points) | Presence of a cost-effectiveness analysis in the application and whether the analysis is qualitative or quantitative. |
| Maintenance budget and plan (5 Points) | Identification of a maintenance plan for the project, including the entity responsible for it and a source of funds. | |
| Resilience to weather and environmental hazards (8 points) | ||
| Resilience in the face of increasingly destructive storms and weather hazards is a growing concern in the Boston region, and is codified in the MPO’s System Preservation goal. Project proponents should demonstrate that their project will not cause damage to a sensitive ecosystem and that it will be able to resist damage from extreme weather events. | Impact on areas of environmental concern (6 points) | Magnitude of the project's environmental impact, positive or negative. |
| Relationship to resilience plans (2 points) | Whether the project is included in local resilience plans. | |
| TYPE-SPECIFIC CRITERIA: OPERATIONAL PROJECTS | ||
| Long-Term Financial Plan (12 points) | ||
| Annual operating costs (2 points) | Whether the estimate of operating costs is present and realistic. | |
| Annual maintenance costs (1 point) | Whether the estimate of maintenance costs is present and realistic. | |
| All other costs (1 point) | Whether the estimate of other costs is present and realistic. | |
| Fare structure (2 points) | Presence of a detailed description of the proposed fare structure and explanation thereof. | |
| Plan for fiscal sustainability (6 points) | Whether the application identifies full funding for the project (reflecting a local match to MPO funds) for 0, 1, 2, 3 or more years. | |
| Service Plan (10 points) | ||
| Service Plan (4 points) | Presence of details on: • Plans for ADA compliance • Frequency and routing of service • How the service plans meet the need of projected riders |
|
| Operational/contracting plan (4 points) | Presence of details on administrative and/or contracting plans and the background of the operator. | |
| Marketing plan (2 points) | Presence of a detailed description of a marketing plan. | |
| Performance Monitoring Plan (8 points) | ||
| Data management plan (3 points) | Inclusion of plans for data collection, analysis for monitoring service, and sharing the data with the MPO. | |
| Passenger survey (2 points) | Whether the application describes plans for a ridership survey and the frequency with which it will be administered. | |
| Trip-level boarding counts (1 point) | Presence of plans for trip-level data collection. | |
| Stop-level data collection (1 point) | Presence of plans for stop-level data collection. | |
| Marketing evaluation (1 point) | Presence of plans for an evaluation of the marketing effort. | |
| ADA = Americans with Disabilities Act. CMAQ = Congestion Mitigation and Air Quality Improvement Program. CTPS = Central Transportation Planning Staff. FFY = federal fiscal year. GIS = geographic information systems. GTFS = general transit feed specification. LRTP = Long-Range Transportation Plan. MAPC = Metropolitan Area Planning Council. MassDOT = Massachusetts Department of Transportation. MBTA = Massachusetts Bay Transportation Authority. MPO = Metropolitan Planning Organization. MVP = Municipal Vulnerability Program. SOV = single occupancy vehicle. TAD = Traffic and Design. TAZ = transportation analysis zone. TIP = Transportation Improvement Program. | ||
The Global Warming Solutions Act of 2008 (GWSA) required statewide reductions in greenhouse gas (GHG) emissions of 25 percent below 1990 levels by the year 2020, and 80 percent below 1990 levels by 2050. As part of the GWSA, the Executive Office of Energy and Environmental Affairs developed the Massachusetts Clean Energy and Climate Plan (CECP), which outlined programs to attain the 25 percent reduction by 2020—including a 7.6 percent reduction attributed to the transportation sector.
The Commonwealth’s 13 metropolitan planning organizations (MPOs) are integrally involved in helping to achieve GHG emissions reductions mandated under the GWSA. The MPOs work closely with the Massachusetts Department of Transportation (MassDOT) and other involved agencies to develop common transportation goals, policies, and projects that will help to reduce GHG emissions levels statewide, and meet the specific requirements of the GWSA regulation, Global Warming Solutions Act Requirements for the Transportation Sector and the Massachusetts Department of Transportation (310 CMR 60.05). The purpose of this regulation is to assist the Commonwealth in achieving its adopted GHG emissions reduction goals by requiring the following:
The Commonwealth’s MPOs are meeting the requirements of this regulation through the transportation goals and policies contained in their LRTPs, the major projects planned in their LRTPs, and the mix of new transportation projects that are programmed and implemented through their TIPs.
The GHG tracking and evaluation processes enable the MPOs and MassDOT to identify the anticipated GHG impacts of the planned and programmed projects, and to use GHG impacts as criteria to prioritize transportation projects. This approach is consistent with the GHG emissions reduction policies that promote healthy transportation modes through prioritizing and programming an appropriate balance of roadway, transit, bicycle, and pedestrian investments, as well as policies that support smart growth development patterns by creating a balanced multimodal transportation system.
MassDOT coordinated with MPOs and regional planning agencies to implement GHG tracking and to evaluate projects during the development of the LRTPs that were adopted in September 2011. This collaboration continued during the development of the LRTPs and amendments adopted in 2016, and for the TIPs produced for federal fiscal years (FFYs) 2016–19, 2017–21, 2018–22, 2019–23, 2020–24, 2021–25, and 2022–26. Working together, MassDOT and the MPOs have attained the following milestones:
In addition to monitoring the GHG impacts of projects in the LRTP that will add capacity to the transportation system, it also is important to monitor and evaluate the GHG impacts of all transportation projects that are programmed in the TIP. The TIP includes both the larger, capacity-adding projects from the LRTP and smaller projects, which are not included in the LRTP but that may affect GHG emissions. The principal objective of this tracking is to enable the MPOs to evaluate the expected GHG impacts of different projects and to use this information as criteria to prioritize and program projects in future TIPs.
In order to monitor and evaluate the GHG impacts of TIP projects, MassDOT and the MPOs have developed approaches for identifying anticipated GHG emissions impacts of different types of projects. Since carbon dioxide (CO2 ) is the largest component of GHG emissions overall and is the focus of regulation 310 CMR 60.05, CO2 has been used to measure the GHG emissions impacts of transportation projects in the TIP and LRTP.
All TIP projects have been sorted into two categories for analysis: 1) projects with quantified CO2 impacts, and 2) projects with assumed CO2 impacts. Projects with quantified impacts consist of capacity-adding projects from the LRTP and projects from the TIP that underwent a Congestion Mitigation and Air Quality Improvement (CMAQ) program spreadsheet analysis. Projects with assumed impacts are those that would be expected to produce a minor decrease or increase in emissions, and those that would be assumed to have no CO2 impact.
Projects with quantified impacts include capacity-adding projects in the LRTP that were analyzed using the Boston Region MPO’s travel demand model set. No independent calculations were done for these projects during the development of the TIP.
MassDOT’s Office of Transportation Planning provided spreadsheets that are used to determine projects’ eligibility for funding through the CMAQ program. Typically, MPO staff uses data from projects’ functional design reports, which are prepared at the 25-percent design phase, to conduct these calculations. Staff used these spreadsheets to calculate estimated projections of CO2 for each project, in compliance with GWSA regulations. These estimates are shown in Tables B-1 and B-2. A note of “to be determined” is shown for those projects for which a functional design report was not yet available.
As part of the development of the FFYs 2024–28 TIP, analyses were done for the types of projects described below. A summary of steps performed in the analyses is provided.
For an intersection reconstruction or signalization project that typically reduces delay and, therefore, idling, the following steps are taken:
For a shared-use path that would enable more walking and biking trips and reduce automobile trips, the following steps are taken:
For a program that replaces old buses with new buses that reduce emissions or run on cleaner fuel, the following steps are taken:
Calculations may be performed on the project types listed below:
Projects with assumed CO2 impacts are those that could produce a minor decrease or increase in emissions, but the change in emissions cannot be calculated with any precision. Examples include a bicycle rack installation, Safe Routes to School project, or transit marketing or customer service improvement. These projects are categorized as producing an assumed nominal increase or decrease in emissions.
Projects that do not change the capacity or use of a facility—for example, a resurfacing project that restores a roadway to its previous condition, or a bridge rehabilitation or replacement that restores the bridge to its previous condition—are assumed to have no CO2 impact. More details about these projects are discussed in Chapter 3. The following tables display the GHG impact analyses of projects funded in the FFYs 2023–27 Highway Program (Table B-1) and Transit Program (Table B-2). Table B-3 summarizes the GHG impact analyses of highway projects completed before FFY 2024. Table B-4 summarizes the GHG impact analyses of transit projects completed before FFY 2024. A project is considered completed when the construction contract has been awarded or the transit vehicles have been purchased.
| Table B-1 | ||||
| Greenhouse Gas Regional Highway Project Tracking: FFYs 2024-28 Programmed Projects | ||||
| Project ID Number | Project Name | GHG Analysis Type | GHG CO2 Impact (kg/yr) | GHG Impact Description |
| Federal Fiscal Year 2024 | ||||
| 110980 | NEWTON- WESTON- BRIDGE REHABILITATION, N-12-010=W-29-005, COMMONWEALTH AVENUE (ROUTE 30) OVER THE CHARLES RIVER | Qualitative | 0 | No assumed impact/negligible impact on emissions |
| 603739 | WRENTHAM- CONSTRUCTION OF ROUTE I-495/ROUTE 1A RAMPS | Quantified | 1,233,486 | Quantified Decrease in Emissions from Traffic Operational Improvement |
| 605313 | NATICK- BRIDGE REPLACEMENT, N-03-020, ROUTE 27 (NORTH MAIN STREET) OVER ROUTE 9 (WORCESTER STREET) AND INTERCHANGE IMPROVEMENTS | Not Applicable | 0 | No assumed impact/negligible impact on emissions |
| 606496 | BOSTON- BRIDGE REHABILITATION, B-16-052, BOWKER OVERPASS OVER MASS PIKE, MBTA/CSX, & IPSWICH STREET AND RAMPS (BINS 4FD, 4FG, 4FE, 4FF & 4FJ) | Qualitative | 0 | No assumed impact/negligible impact on emissions |
| 606901 | BOSTON- BRIDGE REPLACEMENT, B-16-109, RIVER STREET BRIDGE OVER MBTA/AMTRAK | Qualitative | 0 | No assumed impact/negligible impact on emissions |
| 606902 | BOSTON- BRIDGE REPLACEMENT, B-16-181, WEST ROXBURY PARKWAY OVER MBTA | Qualitative | 0 | No assumed impact/negligible impact on emissions |
| 607342 | MILTON- INTERSECTION IMPROVEMENTS AT ROUTE 28 (RANDOLPH AVENUE) & CHICKATAWBUT ROAD | Quantified | 1,148,459 | Quantified Decrease in Emissions from Traffic Operational Improvement |
| 607777 | WATERTOWN- REHABILITATION OF MOUNT AUBURN STREET (ROUTE 16) | Quantified | 536,769 | Quantified Decrease in Emissions from Complete Streets Project |
| 607977 | HOPKINTON- WESTBOROUGH- RECONSTRUCTION OF I-90/I-495 INTERCHANGE | Quantified | 0 | RTP project included in the statewide model |
| 608007 | COHASSET- SCITUATE- CORRIDOR IMPROVEMENTS AND RELATED WORK ON JUSTICE CUSHING HIGHWAY (ROUTE 3A), FROM BEECHWOOD STREET TO HENRY TURNER BAILEY ROAD | Quantified | 5,849 | Quantified Decrease in Emissions from Complete Streets Project |
| 608522 | MIDDLETON- BRIDGE REPLACEMENT, M-20-003, ROUTE 62 (MAPLE STREET) OVER IPSWICH RIVER | Qualitative | 0 | No assumed impact/negligible impact on emissions |
| 608562 | SOMERVILLE- SIGNAL AND INTERSECTION IMPROVEMENT ON I-93 AT MYSTIC AVENUE AND MCGRATH HIGHWAY (TOP 200 CRASH LOCATION) | Qualitative | 0 | Qualitative Decrease in Emissions |
| 609054 | LITTLETON- RECONSTRUCTION OF FOSTER STREET | Quantified | 1,140 | Quantified Decrease in Emissions from Complete Streets Project |
| 609211 | PEABODY- INDEPENDENCE GREENWAY EXTENSION | Quantified | 36,612 | Quantified Decrease in Emissions from Bicycle and Pedestrian Infrastructure |
| 609438 | CANTON- BRIDGE REPLACEMENT, C-02-042, REVERE COURT OVER WEST BRANCH OF THE NEPONSET RIVER | Qualitative | 0 | No assumed impact/negligible impact on emissions |
| 612034 | WOBURN- INTERSTATE PAVEMENT PRESERVATION AND RELATED WORK ON I-95 | Qualitative | 0 | Qualitative Decrease in Emissions |
| 612048 | WALTHAM- INTERSTATE MAINTENANCE AND RELATED WORK ON I-95 | Qualitative | 0 | Qualitative Decrease in Emissions |
| 613196 | BURLINGTON- LYNNFIELD- WAKEFIELD- WOBURN- BRIDGE PRESERVATION OF 10 BRIDGES CARRYING I-95 | Qualitative | 0 | No assumed impact/negligible impact on emissions |
| 613209 | BOSTON- BRIDGE PRESERVATION, B-16-236 (39M, 39P, 39U, 39W, 39Y), 5 BRIDGES CARRYING STATE ROUTE 1A (EAST BOSTON EXPRESSWAY NB/SB) AND RAMPS | Qualitative | 0 | No assumed impact/negligible impact on emissions |
| 613211 | MEDFORD- BRIDGE PRESERVATION OF 10 BRIDGES CARRYING I-93 | Qualitative | 0 | No assumed impact/negligible impact on emissions |
| S12114 | ROYALL STREET SHUTTLE | Quantified | 409,583 | Quantified Decrease in Emissions from New/Additional Transit Service |
| S12694 | NEWMO MICROTRANSIT SERVICE EXPANSION | Quantified | 91,800 | Quantified Decrease in Emissions from New/Additional Transit Service |
| S12697 | PLEASANT STREET SHUTTLE SERVICE EXPANSION | Quantified | 183,575 | Quantified Decrease in Emissions from New/Additional Transit Service |
| S12699 | STONEHAM SHUTTLE SERVICE | Quantified | 41,707 | Quantified Decrease in Emissions from New/Additional Transit Service |
| S12700 | CATA ON DEMAND MICROTRANSIT SERVICE EXPANSION | Quantified | 33,400 | Quantified Decrease in Emissions from New/Additional Transit Service |
| S12701 | MWRTA CATCHCONNECT MICROTRANSIT SERVICE EXPANSION | Quantified | 11,936 | Quantified Decrease in Emissions from New/Additional Transit Service |
| S12703 | MONTACHUSETT RTA MICROTRANSIT SERVICE | Quantified | 24,602 | Quantified Decrease in Emissions from New/Additional Transit Service |
| S12705 | LYNN STATION IMPROVEMENTS PHASE II | Qualitative | 0 | Qualitative Decrease in Emissions |
| S12802 | LYNN - BROAD STREET CORRIDOR TRANSIT SIGNAL PRIORITY | Quantified | 1,328,755 | Quantified Decrease in Emissions from Traffic Operational Improvement |
| S12803 | MEDFORD - BICYCLE PARKING (TIER 1) | Qualitative | 0 | Qualitative Decrease in Emissions |
| S12804 | MEDFORD - BLUEBIKES EXPANSION | Quantified | 4,561 | Quantified Decrease in Emissions from Bicycle and Pedestrian Infrastructure |
| S12805 | CANTON PUBLIC SCHOOLS BIKE PROGRAM | Qualitative | 0 | Qualitative Decrease in Emissions |
| S12806 | CANTON CENTER BICYCLE RACKS | Qualitative | 0 | Qualitative Decrease in Emissions |
| S12807 | MWRTA CATCHCONNECT MICROTRANSIT EXPANSION PHASE 2 | Quantified | 102,845 | Quantified Decrease in Emissions from New/Additional Transit Service |
| S12818 | ACTON PARKING MANAGEMENT SYSTEM | Qualitative | 0 | Quantified Decrease in Emissions from Park and Ride Lot |
| S12819 | JACKSON SQUARE STATION ACCESSIBILITY IMPROVEMENTS | Qualitative | 0 | Qualitative Decrease in Emissions |
| S12821 | RAIL TRANSFORMATION - EARLY ACTION ITEMS - READING STATION AND WILBUR INTERLOCKING | Qualitative | 0 | Qualitative Decrease in Emissions |
| S12822 | COLUMBUS AVENUE BUS LANES PHASE 2 | Qualitative | 0 | Qualitative Decrease in Emissions |
| S12823 | BOSTON - ELECTRIC BLUEBIKES ADOPTION | Quantified | 160,925 | Quantified Decrease in Emissions from Bicycle and Pedestrian Infrastructure |
| S12824 | CAMBRIDGE - ELECTRIC BLUEBIKES ADOPTION | Quantified | 66,559 | Quantified Decrease in Emissions from Bicycle and Pedestrian Infrastructure |
| Federal Fiscal Year 2025 | ||||
| 604564 | MAYNARD- BRIDGE REPLACEMENT, M-10-004, ROUTE 62 (MAIN STREET) OVER THE ASSABET RIVER | Qualitative | 0 | No assumed impact/negligible impact on emissions |
| 605168 | HINGHAM- IMPROVEMENTS ON ROUTE 3A FROM OTIS STREET/COLE ROAD INCLUDING SUMMER STREET AND ROTARY; ROCKLAND STREET TO GEORGE WASHINGTON BOULEVARD. | Quantified | 284,736 | Quantified Decrease in Emissions from Complete Streets Project |
| 606453 | BOSTON- IMPROVEMENTS ON BOYLSTON STREET, FROM INTERSECTION OF BROOKLINE AVENUE & PARK DRIVE TO IPSWICH STREET | Quantified | 1,920,790 | Quantified Decrease in Emissions from Complete Streets Project |
| 607684 | BRAINTREE- BRIDGE REPLACEMENT, B-21-017, WASHINGTON STREET (ST 37) OVER MBTA/CSX RAILROAD | Qualitative | 0 | No assumed impact/negligible impact on emissions |
| 607977 | HOPKINTON- WESTBOROUGH- RECONSTRUCTION OF I-90/I-495 INTERCHANGE | Quantified | 0 | RTP project included in the statewide model |
| 608051 | WILMINGTON- RECONSTRUCTION ON ROUTE 38 (MAIN STREET), FROM ROUTE 62 TO THE WOBURN C.L. | Quantified | 492,167 | Quantified Decrease in Emissions from Complete Streets Project |
| 608067 | WOBURN- INTERSECTION RECONSTRUCTION AT ROUTE 3 (CAMBRIDGE ROAD) & BEDFORD ROAD AND SOUTH BEDFORD STREET | Quantified | 168,263 | Quantified Decrease in Emissions from Traffic Operational Improvement |
| 608197 | BOSTON- BRIDGE REHABILITATION, B-16-107, CANTERBURY STREET OVER AMTRAK RAILROAD | Qualitative | 0 | No assumed impact/negligible impact on emissions |
| 608436 | ASHLAND- REHABILITATION AND RAIL CROSSING IMPROVEMENTS ON CHERRY STREET | Qualitative | 0 | No assumed impact/negligible impact on emissions |
| 608498 | QUINCY- WEYMOUTH- BRAINTREE- RESURFACING AND RELATED WORK ON ROUTE 53 | Qualitative | 0 | Qualitative Decrease in Emissions |
| 608703 | WILMINGTON- BRIDGE REPLACEMENT, W-38-029 (2KV), ST 129 LOWELL STREET OVER I 93 | Qualitative | 0 | No assumed impact/negligible impact on emissions |
| 608952 | CHELSEA- BRIDGE SUPERSTRUCTURE REPLACMENT C-09-013, WASHINGTON AVENUE, CARTER STREET & COUNTY ROAD/ROUTE 1 | Qualitative | 0 | No assumed impact/negligible impact on emissions |
| 609252 | LYNN- REHABILITATION OF ESSEX STREET | Quantified | 411,006 | Quantified Decrease in Emissions from Complete Streets Project |
| 609257 | EVERETT- RECONSTRUCTION OF BEACHAM STREET | Quantified | 4,038 | Quantified Decrease in Emissions from Complete Streets Project |
| 609399 | RANDOLPH- RESURFACING AND RELATED WORK ON ROUTE 28 | Qualitative | 0 | Qualitative Decrease in Emissions |
| 609467 | HAMILTON- IPSWICH- SUPERSTRUCTURE REPLACEMENT, H-03-002=I-01-006, WINTHROP STREET OVER IPSWICH RIVER | Qualitative | 0 | No assumed impact/negligible impact on emissions |
| 609516 | BURLINGTON- IMPROVEMENTS AT I-95 (ROUTE 128)/ROUTE 3 INTERCHANGE | Qualitative | 0 | No assumed impact/negligible impact on emissions |
| 609531 | ARLINGTON- STRATTON SCHOOL IMPROVEMENTS (SRTS) | Qualitative | 0 | Qualitative Decrease in Emissions |
| 609532 | CHELSEA- TARGETED SAFETY IMPROVEMENTS AND RELATED WORK ON BROADWAY, FROM WILLIAMS STREET TO CITY HALL AVENUE | Qualitative | 0 | Qualitative Decrease in Emissions |
| 610544 | PEABODY- MULTI-USE PATH CONSTRUCTION OF INDEPENDENCE GREENWAY AT I-95 AND ROUTE 1 | Quantified | 24,423 | Quantified Decrease in Emissions from Bicycle and Pedestrian Infrastructure |
| 610680 | NATICK- LAKE COCHITUATE PATH | Quantified | 2,844 | Quantified Decrease in Emissions from Bicycle and Pedestrian Infrastructure |
| 610722 | ACTON- BOXBOROUGH- LITTLETON- PAVEMENT PRESERVATION ROUTE 2 | Qualitative | 0 | Qualitative Decrease in Emissions |
| 610776 | CAMBRIDGE- SUPERSTRUCTURE REPLACEMENT, C-01-031, US ROUTE 3/ROUTE 16/ROUTE 2 OVER MBTA REDLINE | Qualitative | 0 | No assumed impact/negligible impact on emissions |
| 610782 | DANVERS- MIDDLETON- BRIDGE REPLACEMENT, D-03-009=M-20-005, ANDOVER STREET (SR 114) OVER IPSWICH RIVER | Qualitative | 0 | No assumed impact/negligible impact on emissions |
| 611982 | MEDFORD- SHARED USE PATH CONNECTION AT THE ROUTE 28/WELLINGTON UNDERPASS | Quantified | 4,309 | Quantified Decrease in Emissions from Bicycle and Pedestrian Infrastructure |
| 611997 | NEWTON- HORACE MANN ELEMENTARY SCHOOL IMPROVEMENTS (SRTS) | Qualitative | 0 | Qualitative Decrease in Emissions |
| 612001 | MEDFORD- MILTON FULLER ROBERTS ELEMENTARY SCHOOL (SRTS) | Qualitative | 0 | Qualitative Decrease in Emissions |
| 612028 | STONEHAM- DECK REPLACEMENT & SUPERSTRUCTURE REPAIRS, S-27-006 (2L2), (ST 28) FELLSWAY WEST OVER I-93 | Qualitative | 0 | No assumed impact/negligible impact on emissions |
| 612100 | REVERE- IMPROVEMENTS AT BEACHMONT VETERANS ELEMENTARY (SRTS) | Qualitative | 0 | Qualitative Decrease in Emissions |
| 612173 | BELLINGHAM- BRIDGE REPLACEMENT, B-06-022, MAPLE STREET OVER I-495 | Qualitative | 0 | No assumed impact/negligible impact on emissions |
| 612178 | NATICK- BRIDGE REPLACEMENT, N-03-010, SPEEN STREET OVER RR MBTA/CSX | Qualitative | 0 | No assumed impact/negligible impact on emissions |
| 612182 | NEWTON- BRIDGE REPLACEMENT, N-12-040, BOYLSTON STREET OVER GREEN LINE D | Qualitative | 0 | No assumed impact/negligible impact on emissions |
| 612184 | REVERE- BRIDGE REPLACEMENT, R-05-015, REVERE BEACH PARKWAY OVER BROADWAY | Qualitative | 0 | No assumed impact/negligible impact on emissions |
| 612196 | BRAINTREE- BRIDGE REPLACEMENT, B-21-067, JW MAHER HIGHWAY OVER MONATIQUOT RIVER | Qualitative | 0 | No assumed impact/negligible impact on emissions |
| S12113 | TRANSIT MODERNIZATION PROGRAM | Qualitative | 0 | No assumed impact/negligible impact on emissions |
| S12124 | COMMUNITY CONNECTIONS PROGRAM | Qualitative | 0 | No assumed impact/negligible impact on emissions |
| S12694 | NEWMO MICROTRANSIT SERVICE EXPANSION | Quantified | 91,800 | Quantified Decrease in Emissions from New/Additional Transit Service |
| S12697 | PLEASANT STREET SHUTTLE SERVICE EXPANSION | Quantified | 183,575 | Quantified Decrease in Emissions from New/Additional Transit Service |
| S12699 | STONEHAM SHUTTLE SERVICE | Quantified | 41,707 | Quantified Decrease in Emissions from New/Additional Transit Service |
| S12700 | CATA ON DEMAND MICROTRANSIT SERVICE EXPANSION | Quantified | 33,400 | Quantified Decrease in Emissions from New/Additional Transit Service |
| S12701 | MWRTA CATCHCONNECT MICROTRANSIT SERVICE EXPANSION | Quantified | 11,936 | Quantified Decrease in Emissions from New/Additional Transit Service |
| S12703 | MONTACHUSETT RTA MICROTRANSIT SERVICE | Quantified | 24,602 | Quantified Decrease in Emissions from New/Additional Transit Service |
| S12807 | MWRTA CATCHCONNECT MICROTRANSIT EXPANSION PHASE 2 | Quantified | 102,845 | Quantified Decrease in Emissions from New/Additional Transit Service |
| S12819 | JACKSON SQUARE STATION ACCESSIBILITY IMPROVEMENTS | Qualitative | 0 | Qualitative Decrease in Emissions |
| S12820 | BIKESHARE SUPPORT SET ASIDE | Not Applicable | 0 | No assumed impact/negligible impact on emissions |
| S12825 | BOSTON MPO REGION - FFY2025 PROJECT DESIGN PILOT | Not Applicable | 0 | No assumed impact/negligible impact on emissions |
| Federal Fiscal Year 2026 | ||||
| 605321 | NORWOOD- BRIDGE PRESERVATION, N-25-026, PROVIDENCE HIGHWAY (STATE ROUTE 1) OVER THE NEPONSET RIVER | Qualitative | 0 | No assumed impact/negligible impact on emissions |
| 605743 | IPSWICH- RESURFACING & RELATED WORK ON CENTRAL & SOUTH MAIN STREETS | Quantified | 4,356 | Quantified Decrease in Emissions from Complete Streets Project |
| 605857 | NORWOOD- INTERSECTION IMPROVEMENTS @ ROUTE 1 & UNIVERSITY AVENUE/EVERETT STREET | Quantified | 1,092,131 | Quantified Decrease in Emissions from Traffic Operational Improvement |
| 606449 | CAMBRIDGE- BRIDGE REPLACEMENT, C-01-008, FIRST STREET BRIDGE & C-01-040, LAND BOULEVARD/BROAD CANAL BRIDGE | Qualitative | 0 | No assumed impact/negligible impact on emissions |
| 607977 | HOPKINTON- WESTBOROUGH- RECONSTRUCTION OF I-90/I-495 INTERCHANGE | Quantified | 0 | RTP project included in the statewide model |
| 608045 | MILFORD- REHABILITATION ON ROUTE 16, FROM ROUTE 109 TO BEAVER STREET | Quantified | -38,500 | Quantified Increase in Emissions |
| 608564 | WATERTOWN- INTERSECTION IMPROVEMENTS AT ROUTE 16 AND GALEN STREET | Qualitative | 0 | Qualitative Decrease in Emissions |
| 608940 | WESTON- INTERSECTION IMPROVEMENTS BOSTON POST ROAD (ROUTE 20) AT WELLESLEY STREET | Quantified | 102,453 | Quantified Decrease in Emissions from Traffic Operational Improvement |
| 608954 | WESTON- RECONSTRUCTION ON ROUTE 30 | Quantified | 357,681 | Quantified Decrease in Emissions from Complete Streets Project |
| 609204 | BELMONT- COMMUNITY PATH, BELMONT COMPONENT OF THE MCRT (PHASE I) | Quantified | 26,347 | Quantified Decrease in Emissions from Bicycle and Pedestrian Infrastructure |
| 609437 | SALEM- PEABODY- BOSTON STREET IMPROVEMENTS | Quantified | 58,773 | Quantified Decrease in Emissions from Complete Streets Project |
| 610537 | BOSTON- ELLIS ELEMENTARY TRAFFIC CALMING (SRTS) | Qualitative | 0 | Qualitative Decrease in Emissions |
| 610662 | WOBURN- ROADWAY AND INTERSECTION IMPROVEMENTS AT WOBURN COMMON, ROUTE 38 (MAIN STREET), WINN STREET, PLEASANT STREET AND MONTVALE AVENUE | Quantified | 736,275 | Quantified Decrease in Emissions from Traffic Operational Improvement |
| 610665 | STONEHAM- INTERSECTION IMPROVEMENTS AT ROUTE 28 (MAIN STREET), NORTH BORDER ROAD AND SOUTH STREET | Qualitative | 0 | Qualitative Decrease in Emissions |
| 610675 | CHELSEA- RECONSTRUCTION OF SPRUCE STREET, FROM EVERETT AVENUE TO WILLIAMS STREET | 0 | No assumed impact/negligible impact on emissions | |
| 611954 | BOSTON- GUIDE AND TRAFFIC SIGN REPLACEMENT ON I-90/I-93 WITHIN CENTRAL ARTERY/TUNNEL SYSTEM | Qualitative | 0 | No assumed impact/negligible impact on emissions |
| 611974 | MEDFORD- INTERSECTION IMPROVEMENTS AT MAIN STREET/SOUTH STREET, MAIN STREET/MYSTIC VALLEY PARKWAY RAMPS, AND MAIN STREET/MYSTIC AVENUE | Qualitative | 0 | No assumed impact/negligible impact on emissions |
| 612049 | RANDOLPH- RESURFACING AND RELATED WORK ON ROUTE 24 | Qualitative | 0 | Qualitative Decrease in Emissions |
| 612050 | BRAINTREE- WEYMOUTH- RESURFACING AND RELATED WORK ON ROUTE 3 | Qualitative | 0 | Qualitative Decrease in Emissions |
| 612051 | CANTON- MILTON- RANDOLPH- INTERSTATE MAINTENANCE AND RELATED WORK ON I-93 | Qualitative | 0 | Qualitative Decrease in Emissions |
| 612075 | SALEM- BRIDGE REPLACEMENT, S-01-024, JEFFERSON AVENUE OVER PARALLEL STREET | Qualitative | 0 | No assumed impact/negligible impact on emissions |
| 612076 | TOPSFIELD- BRIDGE REPLACEMENT, T-06-013, PERKINS ROW OVER MILE BROOK | Qualitative | 0 | No assumed impact/negligible impact on emissions |
| 612099 | ASHLAND- BRIDGE REPLACEMENT, A-14-006, CORDAVILLE ROAD OVER SUDBURY RIVER | Qualitative | 0 | No assumed impact/negligible impact on emissions |
| 612496 | SOMERVILLE- BRIDGE PRESERVATION, S-17-031, I-93 (NB & SB) FROM ROUTE 28 TO TEMPLE STREET (PHASE 2) | Qualitative | 0 | No assumed impact/negligible impact on emissions |
| 612523 | REVERE- STATE ROAD BEACHMONT CONNECTOR | Qualitative | 0 | Qualitative Decrease in Emissions |
| 612599 | LYNN- TARGETED SAFETY AND MULTIMODAL IMPROVEMENTS (PLAYBOOK PRIORITY CORRIDORS) | Qualitative | 0 | Qualitative Decrease in Emissions |
| 612804 | DEDHAM- IMPROVEMENTS AT AVERY ELEMENTARY (SRTS) | Qualitative | 0 | Qualitative Decrease in Emissions |
| 612816 | BROOKLINE- IMPROVEMENTS AT WILLIAM H. LINCOLN SCHOOL (SRTS) | Qualitative | 0 | Qualitative Decrease in Emissions |
| 612884 | CHELSEA- IMPROVEMENTS AT MARY C. BURKE ELEMENTARY (SRTS) | Qualitative | 0 | Qualitative Decrease in Emissions |
| 612889 | SHARON- COTTAGE STREET SCHOOL IMPROVEMENTS (SRTS) | Qualitative | 0 | Qualitative Decrease in Emissions |
| 612894 | FRAMINGHAM- IMPROVEMENTS AT HARMONY GROVE ELEMENTARY SCHOOL (SRTS) | Qualitative | 0 | Qualitative Decrease in Emissions |
| 612989 | BOSTON- BRIDGE PRESERVATION, B-16-066 (38D), CAMBRIDGE STREET OVER MBTA | Quantified | 5,400 | Quantified Decrease in Emissions from Traffic Operational Improvement |
| S12113 | TRANSIT MODERNIZATION PROGRAM | Qualitative | 0 | No assumed impact/negligible impact on emissions |
| S12124 | COMMUNITY CONNECTIONS PROGRAM | Qualitative | 0 | No assumed impact/negligible impact on emissions |
| S12807 | MWRTA CATCHCONNECT MICROTRANSIT EXPANSION PHASE 2 | Quantified | 102,845 | Quantified Decrease in Emissions from New/Additional Transit Service |
| S12820 | BIKESHARE SUPPORT SET ASIDE | Not Applicable | 0 | No assumed impact/negligible impact on emissions |
| Federal Fiscal Year 2027 | ||||
| 605276 | BEVERLY- SALEM- DRAWBRIDGE REPLACEMENT/REHABILITATION OF B-11-005=S-01-013, KERNWOOD AVENUE OVER DANVERS RIVER | Qualitative | 0 | No assumed impact/negligible impact on emissions |
| 605743 | IPSWICH- RESURFACING & RELATED WORK ON CENTRAL & SOUTH MAIN STREETS | Quantified | 4356 | Quantified Decrease in Emissions from Complete Streets Project |
| 605857 | NORWOOD- INTERSECTION IMPROVEMENTS @ ROUTE 1 & UNIVERSITY AVENUE/EVERETT STREET | Quantified | 1092131 | Quantified Decrease in Emissions from Traffic Operational Improvement |
| 606226 | BOSTON- RECONSTRUCTION OF RUTHERFORD AVENUE, FROM CITY SQUARE TO SULLIVAN SQUARE | Qualitative | 0 | RTP project included in the statewide model |
| 606728 | BOSTON- BRIDGE REPLACEMENT B-16-365, STORROW DRIVE OVER BOWKER RAMPS | Qualitative | 0 | No assumed impact/negligible impact on emissions |
| 607329 | WAKEFIELD- LYNNFIELD- RAIL TRAIL EXTENSION, FROM THE GALVIN MIDDLE SCHOOL TO LYNNFIELD/PEABODY T.L. | Qualitative | 0 | No assumed impact/negligible impact on emissions |
| 607420 | NATICK- SUPERSTRUCTURE REPLACEMENT, N-03-012, BODEN LANE OVER CSX/MBTA | Qualitative | 0 | No assumed impact/negligible impact on emissions |
| 607977 | HOPKINTON- WESTBOROUGH- RECONSTRUCTION OF I-90/I-495 INTERCHANGE | Quantified | 0 | RTP project included in the statewide model |
| 607981 | SOMERVILLE- MCGRATH BOULEVARD CONSTRUCTION | Quantified | 136345 | Quantified Decrease in Emissions from Complete Streets Project |
| 608514 | BEVERLY- BRIDGE REPLACEMENT, B-11-001, BRIDGE STREET OVER BASS RIVER (HALL-WHITAKER DRAWBRIDGE) | Qualitative | 0 | No assumed impact/negligible impact on emissions |
| 609246 | LYNN- REHABILITATION OF WESTERN AVENUE (ROUTE 107) | Quantified | 902708 | Quantified Decrease in Emissions from Complete Streets Project |
| 610650 | BOSTON- GALLIVAN BOULEVARD (ROUTE 203) SAFETY IMPROVEMENTS, FROM WASHINGTON STREET TO GRANITE AVENUE | Qualitative | 0 | Qualitative Decrease in Emissions |
| 610660 | SUDBURY- WAYLAND- MASS CENTRAL RAIL TRAIL (MCRT) | Qualitative | 0 | No assumed impact/negligible impact on emissions |
| 610932 | BROOKLINE- REHABILITATION OF WASHINGTON STREET | Quantified | 36431 | Quantified Decrease in Emissions from Complete Streets Project |
| 611983 | CHELSEA- PARK STREET & PEARL STREET RECONSTRUCTION | Quantified | 10214 | Quantified Decrease in Emissions from Complete Streets Project |
| 611987 | CAMBRIDGE- BRIDGE REPLACEMENT, C-01-026, MEMORIAL DRIVE OVER BROOKLINE STREET | Qualitative | 0 | No assumed impact/negligible impact on emissions |
| 612499 | MEDFORD- SOUTH MEDFORD CONNECTOR BIKE PATH | Qualitative | 0 | Qualitative Decrease in Emissions |
| 612519 | BOSTON- BRIDGE REPLACEMENT, B-16-165, BLUE HILL AVENUE OVER RAILROAD | Qualitative | 0 | No assumed impact/negligible impact on emissions |
| 612613 | NEWTON- INTERSECTION IMPROVEMENTS AT ROUTE 16 AND QUINOBEQUIN ROAD | Qualitative | 0 | Qualitative Decrease in Emissions |
| 612615 | CANTON- MILTON- ROADWAY RECONSTRUCTION ON ROUTE 138, FROM ROYALL STREET TO DOLLAR LANE | Qualitative | 0 | Qualitative Decrease in Emissions |
| 612616 | MILTON- INTERSECTION IMPROVEMENTS AT ROUTE 138 AND BRADLEE ROAD | Qualitative | 0 | Qualitative Decrease in Emissions |
| 613088 | MALDEN- SPOT POND BROOK GREENWAY | Quantified | 77012 | Quantified Decrease in Emissions from Bicycle and Pedestrian Infrastructure |
| 613121 | EVERETT- TARGETED MULTI-MODAL AND SAFETY IMPROVEMENTS ON ROUTE 16 (DESIGN ONLY) | Qualitative | 0 | Qualitative Decrease in Emissions |
| S12113 | TRANSIT MODERNIZATION PROGRAM | Qualitative | 0 | No assumed impact/negligible impact on emissions |
| S12124 | COMMUNITY CONNECTIONS PROGRAM | Qualitative | 0 | No assumed impact/negligible impact on emissions |
| S12820 | BIKESHARE SUPPORT SET ASIDE | Not Applicable | 0 | No assumed impact/negligible impact on emissions |
| Table B-2 | ||||
| Greenhouse Gas Regional Transit Project Tracking: FFYs 2024-28 Programmed Projects | ||||
| Regional Transit Authority | Project Name | GHG Analysis Type | GHG CO2 Impact (kg/yr) | GHG Impact Description |
| Federal Fiscal Year 2024 | ||||
| Cape Ann Transportation Authority | ||||
| RTD0010579 | CATA - -Preventive Maintenance | Qualitative | 0 | No assumed impact/negligible impact on emissions |
| RTD0010583 | CATA - -buy misc small capital | Qualitative | 0 | No assumed impact/negligible impact on emissions |
| RTD0010584 | CATA - -acquire shop equip/small capital | Qualitative | 0 | No assumed impact/negligible impact on emissions |
| RTD0010587 | CATA - -repave admin/ops facility parking lot | Qualitative | 0 | No assumed impact/negligible impact on emissions |
| T00073 | CATA-Rehab/Renovation Administration & Operations Facility | Qualitative | 0 | No assumed impact/negligible impact on emissions |
| MetroWest Regional Transit Authority | ||||
| RTD0011103 | MetroWest RTA - Operating Assistance - Non Fixed Route ADA Paratransit Service | Qualitative | 0 | No assumed impact/negligible impact on emissions |
| RTD0011104 | MetroWest RTA - Acquisition of Bus Support / Facilities Equipment | Qualitative | 0 | No assumed impact/negligible impact on emissions |
| RTD0011105 | MetroWest RTA - Technology Support/Capital Outreach | Qualitative | 0 | No assumed impact/negligible impact on emissions |
| RTD0011106 | MetroWest RTA - Blandin Intermodal | Qualitative | 0 | No assumed impact/negligible impact on emissions |
| RTD0011107 | MetroWest RTA - FCRS Intermodal - Framingham Commuter Rail Station (FCRS) | Qualitative | 0 | No assumed impact/negligible impact on emissions |
| RTD0011114 | MetroWest RTA - 5339 STATEWIDE - Vehicle Replacements (16 cutaways) | Quantified | 0 | Quantified Decrease in Emissions from Bus Replacement |
| RTD0011123 | MetroWest RTA - 5339 STATEWIDE - 2024 EV (Electric Vehicle) Migration | Qualitative | 0 | Qualitative Decrease in Emissions |
| RTD0011130 | MetroWest RTA - 5339 DISCRETIONARY - Blandin Hub Projects | Qualitative | 0 | No assumed impact/negligible impact on emissions |
| T00037 | MetroWest RTA - CNG Dispensers (2) at the Compressed Natural Gas Fueling Facility | Qualitative | 0 | No assumed impact/negligible impact on emissions |
| T00038 | MetroWest RTA - Electronic Sign Board | Qualitative | 0 | No assumed impact/negligible impact on emissions |
| Federal Fiscal Year 2025 | ||||
| Cape Ann Transportation Authority | ||||
| RTD0010579 | CATA - -Preventive Maintenance | Qualitative | 0 | No assumed impact/negligible impact on emissions |
| RTD0010583 | CATA - -buy misc small capital | Qualitative | 0 | No assumed impact/negligible impact on emissions |
| RTD0010584 | CATA - -acquire shop equip/small capital | Qualitative | 0 | No assumed impact/negligible impact on emissions |
| RTD0010591 | CATA - -Revenue Vehicle Replacement. |
Quantified | 0 | Quantified Decrease in Emissions from Bus Replacement |
| T00073 | CATA-Rehab/Renovation Administration & Operations Facility | Qualitative | 0 | No assumed impact/negligible impact on emissions |
| MetroWest Regional Transit Authority | ||||
| RTD0011109 | MetroWest RTA - ACQUISITION OF BUS SUPPORT EQUIP/FACILITIES | Qualitative | 0 | No assumed impact/negligible impact on emissions |
| RTD0011110 | MetroWest RTA - TECHNOLOGY SUPPORT/CAPITAL OUTREACH | Qualitative | 0 | No assumed impact/negligible impact on emissions |
| RTD0011111 | MetroWest RTA - TERMINAL, INTERMODAL (TRANSIT) - BLANDIN | Qualitative | 0 | No assumed impact/negligible impact on emissions |
| RTD0011112 | MetroWest RTA - OPERATING ASSISTANCE NON FIXED ROUTE ADA PARA SERV | Qualitative | 0 | No assumed impact/negligible impact on emissions |
| RTD0011115 | MetroWest RTA - 5339 COMPETITIVE REVENUE VEHICLE REPLACEMENT - DISCRETIONARY | Quantified | 0 | Quantified Decrease in Emissions from Bus Replacement |
| RTD0011121 | MetroWest RTA - TERMINAL, INTERMODAL (TRANSIT) - Framingham Commuter Rail Station (FCRS) | Qualitative | 0 | No assumed impact/negligible impact on emissions |
| RTD0011124 | MetroWest RTA - 5339 COMPETITIVE 2025 ELECTRIC VEHICLE (EV) ADDTL ELECTRIFICATION COSTS - DISCRETIONARY | Qualitative | 0 | No assumed impact/negligible impact on emissions |
| RTD0011133 | MetroWest RTA - AFC TRANSITION - MOBILE FARE COLL EQUIP | Qualitative | 0 | No assumed impact/negligible impact on emissions |
| RTD0011134 | MetroWest RTA - PUBLIC RESTROOMS AT BLANDIN & FCRS HUBS - DISCRETIONARY | Qualitative | 0 | No assumed impact/negligible impact on emissions |
| RTD0011137 | MetroWest RTA - VEHICLE REPLACEMENT - CUTAWAYS (8) #2 of 2 | Quantified | 0 | Quantified Decrease in Emissions from Bus Replacement |
| Federal Fiscal Year 2026 | ||||
| Cape Ann Transportation Authority | ||||
| RTD0010579 | CATA - -Preventive Maintenance | Qualitative | 0 | No assumed impact/negligible impact on emissions |
| RTD0010583 | CATA - -buy misc small capital | Qualitative | 0 | No assumed impact/negligible impact on emissions |
| RTD0010584 | CATA - -acquire shop equip/small capital | Qualitative | 0 | No assumed impact/negligible impact on emissions |
| RTD0010591 | CATA - -Revenue Vehicle Replacement. |
Quantified | 0 | Quantified Decrease in Emissions from Bus Replacement |
| T00073 | CATA-Rehab/Renovation Administration & Operations Facility | Qualitative | 0 | No assumed impact/negligible impact on emissions |
| MetroWest Regional Transit Authority | ||||
| RTD0011116 | MetroWest RTA - OPERATING ASSISTANCE NON FIXED ROUTE ADA PARA SERV | Qualitative | 0 | No assumed impact/negligible impact on emissions |
| RTD0011117 | MetroWest RTA - TERMINAL, INTERMODAL (TRANSIT) - BLANDIN | Qualitative | 0 | No assumed impact/negligible impact on emissions |
| RTD0011118 | MetroWest RTA - TECHNOLOGY SUPPORT/CAPITAL OUTREACH | Qualitative | 0 | No assumed impact/negligible impact on emissions |
| RTD0011119 | MetroWest RTA - ACQUISITION OF BUS SUPPORT EQUIP/FACILITIES | Qualitative | 0 | No assumed impact/negligible impact on emissions |
| RTD0011120 | MetroWest RTA - TERMINAL, INTERMODAL (TRANSIT) - Framingham Commuter Rail Station | Qualitative | 0 | No assumed impact/negligible impact on emissions |
| RTD0011125 | MetroWest RTA - 2026 ELECTRIC VEHICLE (EV) ADDTL ELECTRIFICATION COSTS | Qualitative | 0 | No assumed impact/negligible impact on emissions |
| RTD0011126 | MetroWest RTA - 5339 COMPETITIVE REVENUE VEHICLE REPLACEMENT - DISCRETIONARY | Quantified | 0 | Quantified Decrease in Emissions from Bus Replacement |
| RTD0011138 | MetroWest RTA - VEHICLE REPLACEMENT - CUTAWAYS (8) #2 of 2 | Quantified | 0 | Quantified Decrease in Emissions from Bus Replacement |
| Federal Fiscal Year 2027 | ||||
| Cape Ann Transportation Authority | ||||
| RTD0010579 | CATA - -Preventive Maintenance | Qualitative | 0 | No assumed impact/negligible impact on emissions |
| RTD0010583 | CATA - -buy misc small capital | Qualitative | 0 | No assumed impact/negligible impact on emissions |
| RTD0010584 | CATA - -acquire shop equip/small capital | Qualitative | 0 | No assumed impact/negligible impact on emissions |
| T00073 | CATA-Rehab/Renovation Administration & Operations Facility | Qualitative | 0 | No assumed impact/negligible impact on emissions |
| MetroWest Regional Transit Authority | ||||
| RTD0011195 | MetroWest RTA - OPERATING ASSISTANCE NON FIXED ROUTE ADA PARA SERV | Qualitative | 0 | No assumed impact/negligible impact on emissions |
| RTD0011196 | MetroWest RTA - TERMINAL, INTERMODAL (TRANSIT) - BLANDIN | Qualitative | 0 | No assumed impact/negligible impact on emissions |
| RTD0011197 | MetroWest RTA - TECHNOLOGY SUPPORT/CAPITAL OUTREACH | Qualitative | 0 | No assumed impact/negligible impact on emissions |
| RTD0011198 | MetroWest RTA - ACQUISITION OF BUS SUPPORT EQUIP/FACILITIES | Qualitative | 0 | No assumed impact/negligible impact on emissions |
| RTD0011199 | MetroWest RTA - TERMINAL, INTERMODAL (TRANSIT) - Framingham Commuter Rail Station | Qualitative | 0 | No assumed impact/negligible impact on emissions |
| RTD0011200 | MetroWest RTA - 5339 COMPETITIVE REVENUE VEHICLE REPLACEMENT - DISCRETIONARY | Quantified | 0 | Quantified Decrease in Emissions from Bus Replacement |
| RTD0011201 | MetroWest Regional Transit Authority - ELECTRIC VEHICLE (EV) ADDTL ELECTRIFICATION COSTS | Qualitative | 0 | No assumed impact/negligible impact on emissions |
| RTD0011202 | MetroWest RTA - VEHICLE REPLACEMENT - Cutaways #2 of 2 | Quantified | 0 | Quantified Decrease in Emissions from Bus Replacement |
| RTD0011267 | MetroWest RTA - EV - Additional Electrification for Vehicles | Qualitative | 0 | No assumed impact/negligible impact on emissions |
| Federal Fiscal Year 2028 | ||||
| Cape Ann Transportation Authority | ||||
| RTD0010579 | CATA - -Preventive Maintenance | Qualitative | 0 | No assumed impact/negligible impact on emissions |
| RTD0010583 | CATA - -buy misc small capital | Qualitative | 0 | No assumed impact/negligible impact on emissions |
| RTD0010584 | CATA - -acquire shop equip/small capital | Qualitative | 0 | No assumed impact/negligible impact on emissions |
| T00073 | CATA-Rehab/Renovation Administration & Operations Facility | Qualitative | 0 | No assumed impact/negligible impact on emissions |
| MetroWest Regional Transit Authority | ||||
| RTD0011195 | MetroWest RTA - OPERATING ASSISTANCE NON FIXED ROUTE ADA PARA SERV | Qualitative | 0 | No assumed impact/negligible impact on emissions |
| RTD0011196 | MetroWest RTA - TERMINAL, INTERMODAL (TRANSIT) - BLANDIN | Qualitative | 0 | No assumed impact/negligible impact on emissions |
| RTD0011197 | MetroWest RTA - TECHNOLOGY SUPPORT/CAPITAL OUTREACH | Qualitative | 0 | No assumed impact/negligible impact on emissions |
| RTD0011198 | MetroWest RTA - ACQUISITION OF BUS SUPPORT EQUIP/FACILITIES | Qualitative | 0 | No assumed impact/negligible impact on emissions |
| RTD0011199 | MetroWest RTA - TERMINAL, INTERMODAL (TRANSIT) - Framingham Commuter Rail Station | Qualitative | 0 | No assumed impact/negligible impact on emissions |
| RTD0011200 | MetroWest RTA - 5339 COMPETITIVE REVENUE VEHICLE REPLACEMENT - DISCRETIONARY | Quantified | 0 | Quantified Decrease in Emissions from Bus Replacement |
| RTD0011201 | MetroWest Regional Transit Authority - ELECTRIC VEHICLE (EV) ADDTL ELECTRIFICATION COSTS | Qualitative | 0 | No assumed impact/negligible impact on emissions |
| RTD0011202 | MetroWest RTA - VEHICLE REPLACEMENT - Cutaways #2 of 2 | Quantified | 0 | Quantified Decrease in Emissions from Bus Replacement |
| RTD0011267 | MetroWest RTA - EV - Additional Electrification for Vehicles | Qualitative | 0 | No assumed impact/negligible impact on emissions |
| Table B-3 | |||||
| Greenhouse Gas Regional Highway Project Tracking: Completed Projects | |||||
| Project ID Number | Project Name | GHG Analysis Type | GHG CO2 Impact (kg/yr) | GHG Impact Description | FFY of Contract Award |
| Federal Fiscal Year 2023 | |||||
| 603722 | LEXINGTON- BRIDGE REPLACEMENT, L-10-010, ROUTE 2A (MARRETT ROAD) OVER I-95/ROUTE 128 | Qualitative | 0 | No assumed impact/negligible impact on emissions | |
| 606130 | NORWOOD- INTERSECTION IMPROVEMENTS AT ROUTE 1A & UPLAND ROAD/WASHINGTON STREET & PROSPECT STREET/FULTON STREET | Quantified | 131,840 | Quantified Decrease in Emissions from Traffic Operational Improvement | |
| 606476 | BOSTON- ROADWAY, CEILING, ARCH & WALL RECONSTRUCTION AND OTHER CONTROL SYSTEMS IN SUMNER TUNNEL | Qualitative | 0 | No assumed impact/negligible impact on emissions | |
| 607244 | WINTHROP- RECONSTRUCTION & RELATED WORK ALONG WINTHROP STREET & REVERE STREET CORRIDOR | Quantified | 252,816 | Quantified Decrease in Emissions from Complete Streets Project | |
| 607327 | WILMINGTON- BRIDGE REPLACEMENT, W-38-002, ROUTE 38 (MAIN STREET) OVER THE B&M RAILROAD | Qualitative | 0 | No assumed impact/negligible impact on emissions | |
| 607342 | MILTON- INTERSECTION IMPROVEMENTS AT ROUTE 28 (RANDOLPH AVENUE) & CHICKATAWBUT ROAD | Qualitative | 0 | Qualitative Decrease in Emissions | |
| 607777 | WATERTOWN- REHABILITATION OF MOUNT AUBURN STREET (ROUTE 16) | Quantified | 536,769 | Quantified Decrease in Emissions from Complete Streets Project | |
| 607899 | DEDHAM- PEDESTRIAN IMPROVEMENTS ALONG BUSSEY STREET, INCLUDING SUPERSTRUCTURE REPLACEMENT, D-05-010, BUSSEY STREET OVER MOTHER BROOK | Quantified | 3,331 | Quantified Decrease in Emissions from Complete Streets Project | |
| 607977 | HOPKINTON- WESTBOROUGH- RECONSTRUCTION OF I-90/I-495 INTERCHANGE | Quantified | 0 | RTP project included in the statewide model | |
| 608009 | BOXBOROUGH- BRIDGE REPLACEMENT, B-18-002, ROUTE 111 OVER I-495 | Qualitative | 0 | No assumed impact/negligible impact on emissions | |
| 608208 | QUINCY- MILTON- BOSTON- INTERSTATE MAINTENANCE & RELATED WORK ON I-93 | Qualitative | 0 | No assumed impact/negligible impact on emissions | |
| 608255 | STOW- BRIDGE REPLACEMENT, S-29-011, BOX MILL ROAD OVER ELIZABETH BROOK | Qualitative | 0 | No assumed impact/negligible impact on emissions | |
| 608348 | BEVERLY- RECONSTRUCTION OF BRIDGE STREET | Quantified | 387,153 | Quantified Decrease in Emissions from Complete Streets Project | |
| 608480 | FOXBOROUGH- RESURFACING AND RELATED WORK ON ROUTE 1 | Qualitative | 0 | No assumed impact/negligible impact on emissions | |
| 608609 | BOSTON- WESTWOOD- STEEL SUPERSTRUCTURE CLEANING (FULL REMOVAL) AND PAINTING OF 2 BRIDGES: B-16-118 & W-31-006 | Qualitative | 0 | No assumed impact/negligible impact on emissions | |
| 608707 | QUINCY- RECONSTRUCTION OF SEA STREET | Quantified | -30,437 | Quantified Increase in Emissions | |
| 608818 | DANVERS- MIDDLETON- RESURFACING AND RELATED WORK ON ROUTE 114 | Qualitative | 0 | No assumed impact/negligible impact on emissions | |
| 608889 | FRAMINGHAM- TRAFFIC SIGNAL INSTALLATION AT EDGELL ROAD AT CENTRAL STREET | Quantified | 232,860 | Quantified Decrease in Emissions from Complete Streets Project | |
| 608929 | WILMINGTON- BRIDGE REPLACEMENT, W-38-003, BUTTERS ROW OVER MBTA | Qualitative | 0 | No assumed impact/negligible impact on emissions | |
| 608933 | PEABODY- REHABILITATION OF CENTRAL STREET | Quantified | 150,913 | Quantified Decrease in Emissions from Complete Streets Project | |
| 609053 | CANTON- DEDHAM- NORWOOD- HIGHWAY LIGHTING IMPROVEMENTS AT I-93 & I-95/128 | Qualitative | 0 | No assumed impact/negligible impact on emissions | |
| 609253 | WILMINGTON- INTERSECTION IMPROVEMENTS AT LOWELL STREET (ROUTE 129) AND WOBURN STREET | Quantified | 494,211 | Quantified Decrease in Emissions from Traffic Operational Improvement | |
| 609254 | LYNN- INTERSECTION IMPROVEMENTS AT TWO INTERSECTIONS ON BROADWAY | Quantified | 73,291 | Quantified Decrease in Emissions from Traffic Operational Improvement | |
| 610552 | MARLBOROUGH- HUDSON- RAMP IMPROVEMENTS AND RELATED WORK AT I-495 (SB) TO I-290 (WB) | 0 | No assumed impact/negligible impact on emissions | ||
| 610674 | NEWTON- RECONSTRUCTION OF COMMONWEALTH AVENUE (ROUTE 30), FROM EAST OF AUBURN STREET TO ASH STREET | Quantified | 16,846 | Quantified Decrease in Emissions from Complete Streets Project | |
| 610726 | MEDFORD- READING- SOMERVILLE- STONEHAM- WINCHESTER- WOBURN- INTERSTATE PAVEMENT PRESERVATION ON I-93 | Qualitative | 0 | No assumed impact/negligible impact on emissions | |
| 610919 | LYNN- NAHANT- NORTHERN STRAND EXTENSION | Qualitative | 0 | Qualitative Decrease in Emissions | |
| 612662 | BOSTON- BRIDGE PRESERVATION, B-16-235 (39T & 3A0), ROUTE 1A OVER CHELSEA STREET/BREMEN STREET & RAILROAD | Qualitative | 0 | No assumed impact/negligible impact on emissions | |
| 612663 | BOSTON- BRIDGE PRESERVATION, B-16-053 (4T3), BROOKLINE AVENUE OVER I-90 & RAILROAD | Qualitative | 0 | No assumed impact/negligible impact on emissions | |
| 612664 | BOSTON- BRIDGE PRESERVATION, B-16-179, AUSTIN STREET OVER I-93 AND B-16-281, I-93 UPPER/LOWER DECK | Qualitative | 0 | No assumed impact/negligible impact on emissions | |
| S12114 | ROYALL STREET SHUTTLE | Quantified | 409,583 | Quantified Decrease in Emissions from New/Additional Transit Service | |
| S12125 | NEWTON MICROTRANSIT SERVICE | Quantified | 33,103 | Quantified Decrease in Emissions from New/Additional Transit Service | |
| S12694 | NEWMO MICROTRANSIT SERVICE EXPANSION | Quantified | 91,800 | Quantified Decrease in Emissions from New/Additional Transit Service | |
| S12695 | BLUEBIKES STATION REPLACEMENT AND SYSTEM EXPANSION | Quantified | 20,484 | Quantified Decrease in Emissions from Bicycle and Pedestrian Infrastructure | |
| S12696 | BLUEBIKES SYSTEM EXPANSION | Quantified | 2,637 | Quantified Decrease in Emissions from Bicycle and Pedestrian Infrastructure | |
| S12697 | PLEASANT STREET SHUTTLE SERVICE EXPANSION | Quantified | 183,575 | Quantified Decrease in Emissions from New/Additional Transit Service | |
| S12698 | BLUEBIKES SYSTEM EXPANSION | Quantified | 460 | Quantified Decrease in Emissions from Bicycle and Pedestrian Infrastructure | |
| S12699 | STONEHAM SHUTTLE SERVICE | Quantified | 41,707 | Quantified Decrease in Emissions from New/Additional Transit Service | |
| S12700 | CATA ON DEMAND MICROTRANSIT SERVICE EXPANSION | Quantified | 33,400 | Quantified Decrease in Emissions from New/Additional Transit Service | |
| S12701 | MWRTA CATCHCONNECT MICROTRANSIT SERVICE EXPANSION | Quantified | 11,936 | Quantified Decrease in Emissions from New/Additional Transit Service | |
| S12702 | BICYCLE PARKING ALONG THE BRUCE FREEMAN RAIL TRAIL | Quantified | 1,024 | Quantified Decrease in Emissions from Bicycle and Pedestrian Infrastructure | |
| S12703 | MONTACHUSETT RTA MICROTRANSIT SERVICE | Quantified | 24,602 | Quantified Decrease in Emissions from New/Additional Transit Service | |
| S12704 | CHENERY MIDDLE SCHOOL BICYCLE PARKING | Quantified | 771 | Quantified Decrease in Emissions from Bicycle and Pedestrian Infrastructure | |
| S12705 | LYNN STATION IMPROVEMENTS PHASE II | Qualitative | 0 | Qualitative Decrease in Emissions | |
| S12749 | STOW - ASSABET RIVER RAIL TRAIL EXTENSION ENGINEERING AND DESIGN | Qualitative | 0 | No assumed impact/negligible impact on emissions | |
| S12752 | DOVER-NEEDHAM - CENTRE STREET / CENTRAL AVENUE BRIDGE ENGINEERING AND DESIGN | 0 | No assumed impact/negligible impact on emissions | ||
| Table B-4 | ||||||
| Greenhouse Gas Regional Transit Project Tracking: Completed Projects | ||||||
| Regional Transit Authority | Project ID Number | Project Name | GHG Analysis Type | GHG CO2 Impact (kg/yr) | GHG Impact Description | FFY of Contract Award |
| Federal Fiscal Year 2023 | ||||||
| Cape Ann Transportation Authority | ||||||
| RTD0010578 | CATA - -Preventive Maintenance | 0 | No assumed impact/negligible impact on emissions | |||
| RTD0010582 | CATA - -buy misc small capital | 0 | No assumed impact/negligible impact on emissions | |||
| RTD0010585 | CATA - -acquire shop equip/small capital | 0 | No assumed impact/negligible impact on emissions | |||
| RTD0010589 | CATA - -Revenue Vehicle Replacement | 0 | No assumed impact/negligible impact on emissions | |||
| T00072 | Replacement of two replica trolleys that have reached the end of their useful life in 2011 (VIN 1C9S2HFS81W535239) and 2013 (1C9S2HSS52W535268). | 0 | No assumed impact/negligible impact on emissions | |||
| T00221 | CATA - Van transportation to dialysis and medical appointments (5310) | 0 | No assumed impact/negligible impact on emissions | |||
| MetroWest Regional Transit Authority | ||||||
| RTD0011099 | MWRTA - OPERATING ASSISTANCE NON FIXED ROUTE ADA PARA SERV | 0 | No assumed impact/negligible impact on emissions | |||
| RTD0011100 | MetroWest RTA - ACQUISITION OF BUS SUPPORT EQUIP/FACILITIES | 0 | No assumed impact/negligible impact on emissions | |||
| RTD0011101 | MetroWest RTA - TECHNOLOGY SUPPORT/CAPITAL OUTREACH | 0 | No assumed impact/negligible impact on emissions | |||
| RTD0011102 | MetroWest RTA - TERMINAL, INTERMODAL (TRANSIT) - BLANDIN | 0 | No assumed impact/negligible impact on emissions | |||
| RTD0011108 | MetroWest RTA - TERMINAL, INTERMODAL (TRANSIT) - Framingham Commuter Rail Station (FCRS) | 0 | No assumed impact/negligible impact on emissions | |||
| RTD0011113 | MetroWest Regional Transit Authority - 5339 COMPETITIVE REVENUE VEHICLE REPLACEMENT - DISCRETIONARY | 0 | No assumed impact/negligible impact on emissions | |||
| RTD0011122 | MetroWest RTA - 2023 ELECTRIC VEHICLE (EV) MIGRATION | 0 | No assumed impact/negligible impact on emissions | |||
| RTD0011127 | MetroWest Regional Transit Authority - Back Entrance Project - DISCRETIONARY | 0 | No assumed impact/negligible impact on emissions | |||
| RTD0011128 | MetroWest RTA - Electronic Sign Board | 0 | No assumed impact/negligible impact on emissions | |||
| RTD0011129 | MetroWest Regional Transit Authority - CRT North Framingham Bike/Pedestrian Connectivity - Cochituate Rail Trail North Framingham Feasibility Study - DISCRETIONARY | 0 | No assumed impact/negligible impact on emissions | |||
| RTD0011135 | MetroWest RTA - VEHICLE REPLACEMENTs - CUTAWAYS (4 x E2s) | 0 | No assumed impact/negligible impact on emissions | |||
| T00216 | MWRTA - Continued funding for MWRTA TOP (5310) | 0 | No assumed impact/negligible impact on emissions | |||
| Massachusetts Bay Transportation Authority | ||||||
| MBTA002 | Revenue Vehicle Program 5307 | 0 | No assumed impact/negligible impact on emissions | |||
| MBTA003 | Signals/Systems Upgrade Program 5307 | 0 | No assumed impact/negligible impact on emissions | |||
| MBTA004 | Stations and Facilities Program 5307 | 0 | No assumed impact/negligible impact on emissions | |||
| MBTA005 | Bridge & Tunnel Program 5337 | 0 | No assumed impact/negligible impact on emissions | |||
| MBTA006 | Revenue Vehicle Program 5337 | 0 | No assumed impact/negligible impact on emissions | |||
| MBTA007 | Signals/Systems Upgrade Program 5337 | 0 | No assumed impact/negligible impact on emissions | |||
| MBTA008 | Stations and Facilities Program 5337 | 0 | No assumed impact/negligible impact on emissions | |||
| MBTA009 | Bus Program | 0 | No assumed impact/negligible impact on emissions | |||
| MBTA011 | RRIF/TIFIA Financing Program | 0 | No assumed impact/negligible impact on emissions | |||
| MBTA012 | Lynnway Multimodal Corridor (RAISE) |
0 | No assumed impact/negligible impact on emissions | |||
| T00013 | North Wilmington Station - CARSI | 0 | No assumed impact/negligible impact on emissions | |||
| T00020 | Quincy Bus Facility Modernization (FTA) |
0 | No assumed impact/negligible impact on emissions | |||
| T00021 | Chelsea & Everett Route Planning (FTA) |
0 | No assumed impact/negligible impact on emissions | |||
| T00022 | Battery Electric Buses - Low-No (FTA) |
0 | No assumed impact/negligible impact on emissions | |||
| T00023 | South Elm Street Bridge Haverhill (FRA) |
0 | No assumed impact/negligible impact on emissions | |||
| T00024 | South Salem Comm. Rail Stop Study (FTA) |
0 | No assumed impact/negligible impact on emissions | |||
| T00025 | MBTA Suicide Trespass Prevention (FRA) |
0 | No assumed impact/negligible impact on emissions | |||
| T00027 | Bridge & Tunnel Program 5307 | 0 | No assumed impact/negligible impact on emissions | |||
| T00028 | Blue Hill Ave. Corridor Project (RAISE) |
0 | No assumed impact/negligible impact on emissions | |||
| T00032 | Alewife Wayfinding Impr. (CMAQ) |
0 | No assumed impact/negligible impact on emissions | |||
| T00033 | MBTA Systemwide Bike Racks (CMAQ) |
0 | No assumed impact/negligible impact on emissions | |||
| T00034 | Columbus Ave. Bus Lane Ph. II (CMAQ) |
0 | No assumed impact/negligible impact on emissions | |||
| T00035 | Lynn Station Improvements (STP) |
0 | No assumed impact/negligible impact on emissions | |||
| T00215 | Greater Lynn Senior Services - Move Safe and Mobility Links Program (5310) | 0 | No assumed impact/negligible impact on emissions | |||
| T00217 | Mystic Valley Elder Services - Continued funding for Connect a Ride Alliance Program (5310) | 0 | No assumed impact/negligible impact on emissions | |||
| T00218 | SCM Community Transportation - Funding for a scheduling software (5310) | 0 | No assumed impact/negligible impact on emissions | |||
| T00222 | City of Newton - NewMo Operating Funds (5310) | 0 | No assumed impact/negligible impact on emissions | |||
| T00234 | Town of Acton - Funding for drivers/dispatch salary at CrossTown Connect (5310) | 0 | No assumed impact/negligible impact on emissions | |||
[COMING SOON]
Appendix D provides information about the geographic distribution of federal highway funding in the Boston region in the federal fiscal years (FFYs) 2024–28 Transportation Improvement Program, as well as for all years since 2011. It includes the distribution of the Boston Region MPO’s Regional Target Program funding (the MPO’s discretionary funding) and funding for projects and programs prioritized by the Massachusetts Department of Transportation. Funding amounts shown include the state’s matching funds that leverage the available federal funds.
Figures D-1 through D-4 summarize the distribution of the MPO’s Regional Target Program funding and all federal highway funding by subregion. Funding is shown for the time period covered by this TIP (FFYs 2024–28) and over a longer time horizon (FFYs 2011–28). Table D-1 shows the breakdown of this data for each municipality in the Boston region for FFYs 2024–28.
The analysis presented here provides details about how the MPO has allocated its federal transportation highway dollars across its geographic region by showing which municipalities and areas of the Boston region have received highway funding for the construction of transportation projects. This data was first compiled for FFYs 2008-13 in response to the Boston Region MPO’s 2014 Certification Review by the Federal Highway Administration and Federal Transit Administration.
Figure D-1
Distribution of Regional Target Funding by Subregion (FFYs 2024–28)
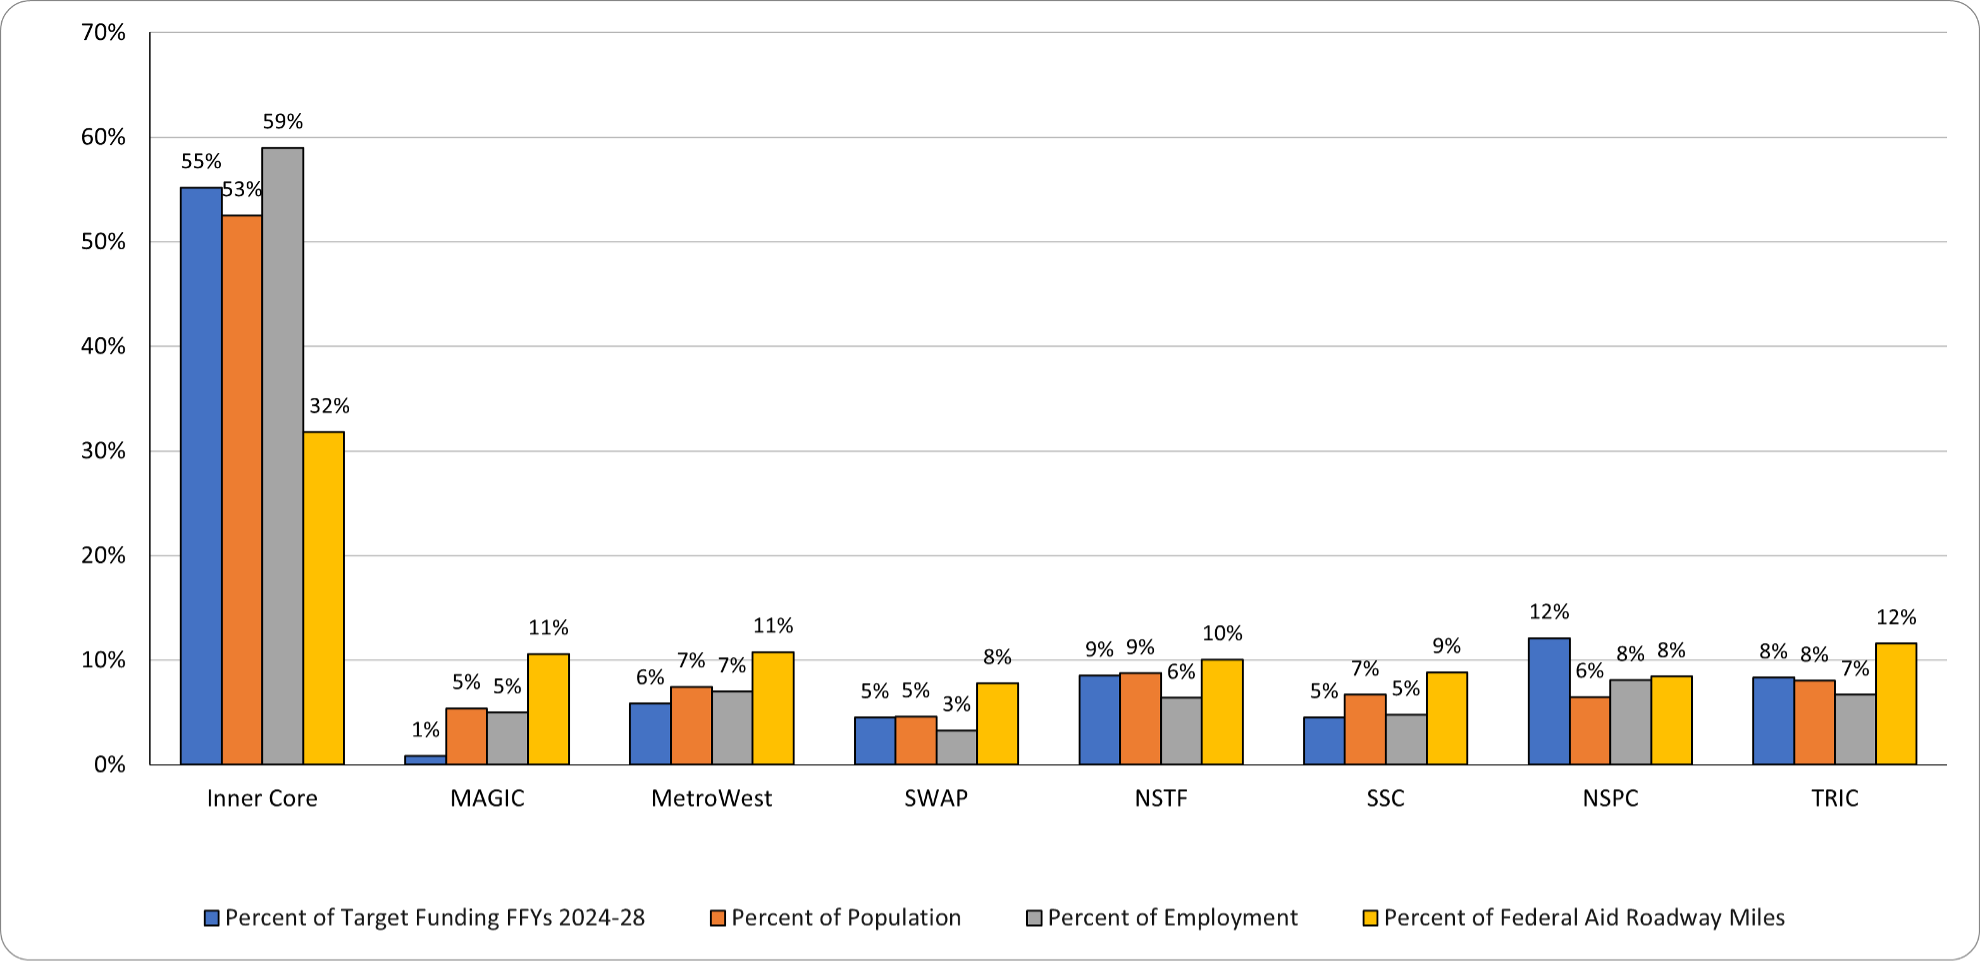
Subregions: ICC = Inner Core Committee. MAGIC = Minuteman Advisory Group on Interlocal Coordination. MWRC = MetroWest Regional Collaborative. NSPC = North Suburban Planning Council. NSTF = North Shore Task Force. SSC = South Shore Coalition. SWAP = SouthWest Advisory Planning Committee. TRIC = Three Rivers Interlocal Council.
Source: Boston Region MPO.
Figure D-2
Distribution of All Federal Highway Funding in the Boston Region by Subregion (FFYs 2024–28)
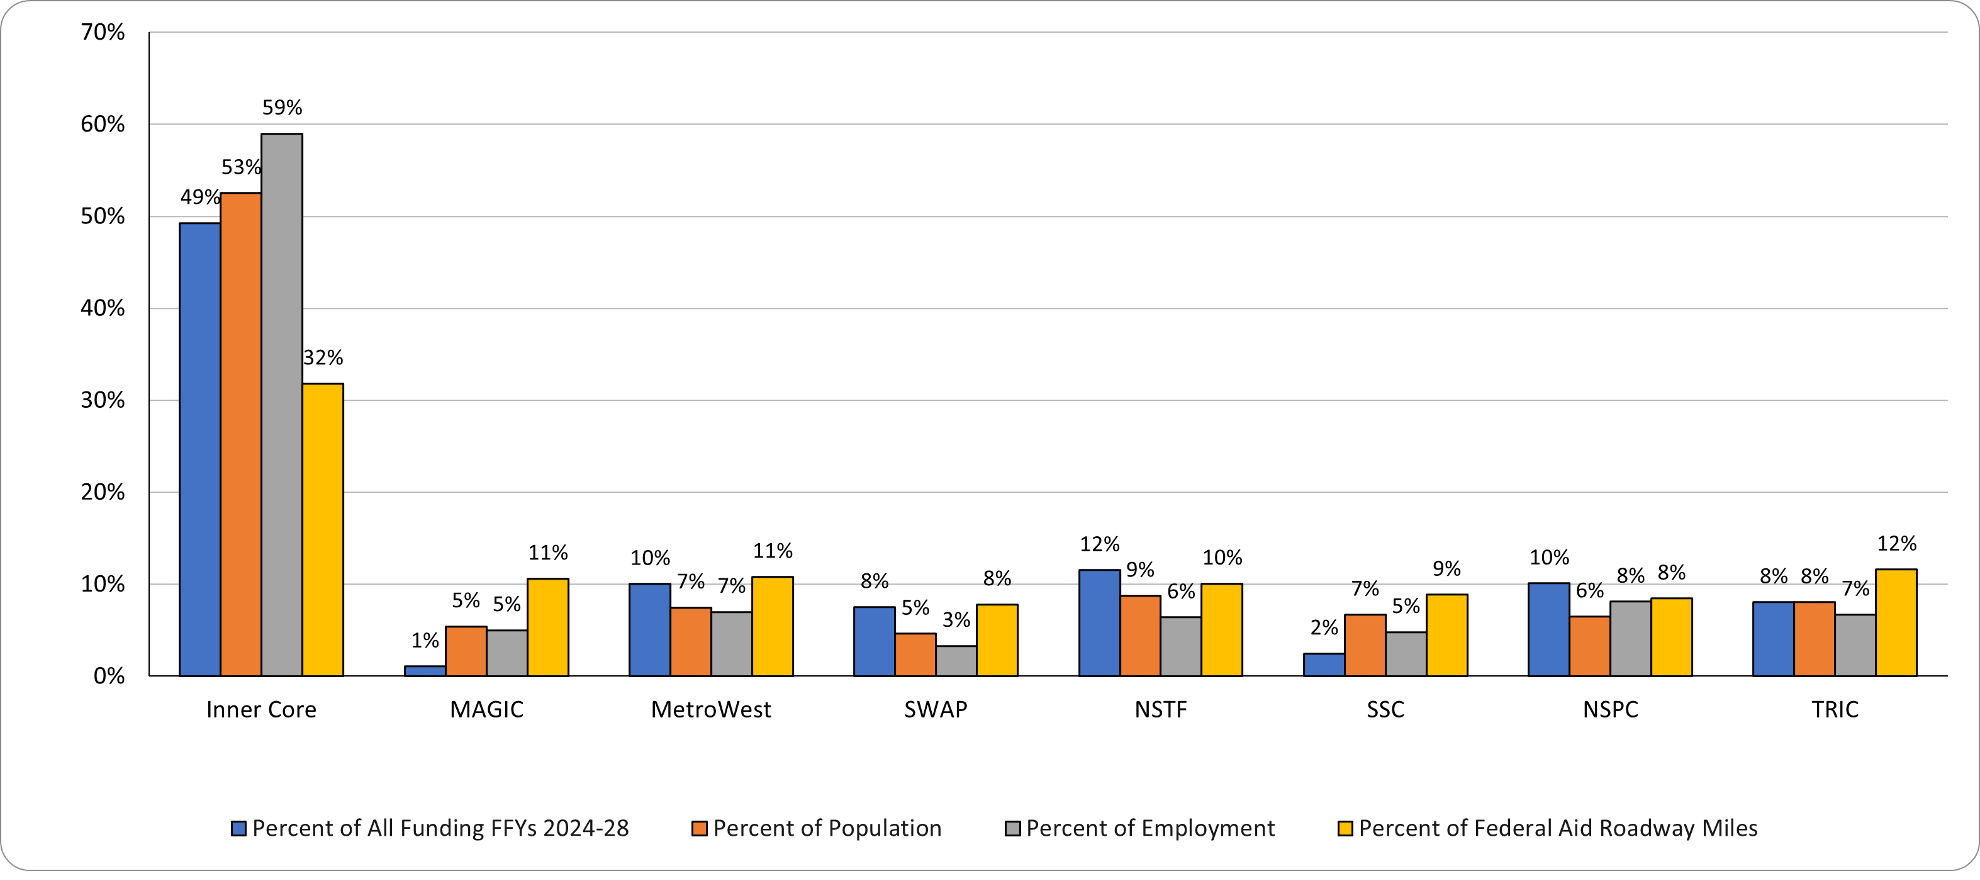
FFY = Federal Fiscal Year.
Subregions: ICC = Inner Core Committee. MAGIC = Minuteman Advisory Group on Interlocal Coordination. MWRC = MetroWest Regional Collaborative. NSPC = North Suburban Planning Council. NSTF = North Shore Task Force. SSC = South Shore Coalition. SWAP = SouthWest Advisory Planning Committee. TRIC = Three Rivers Interlocal Council.
Source: Boston Region MPO.
Figure D-3
Distribution of Regional Target Funding by Subregion (FFYs 2011–28)
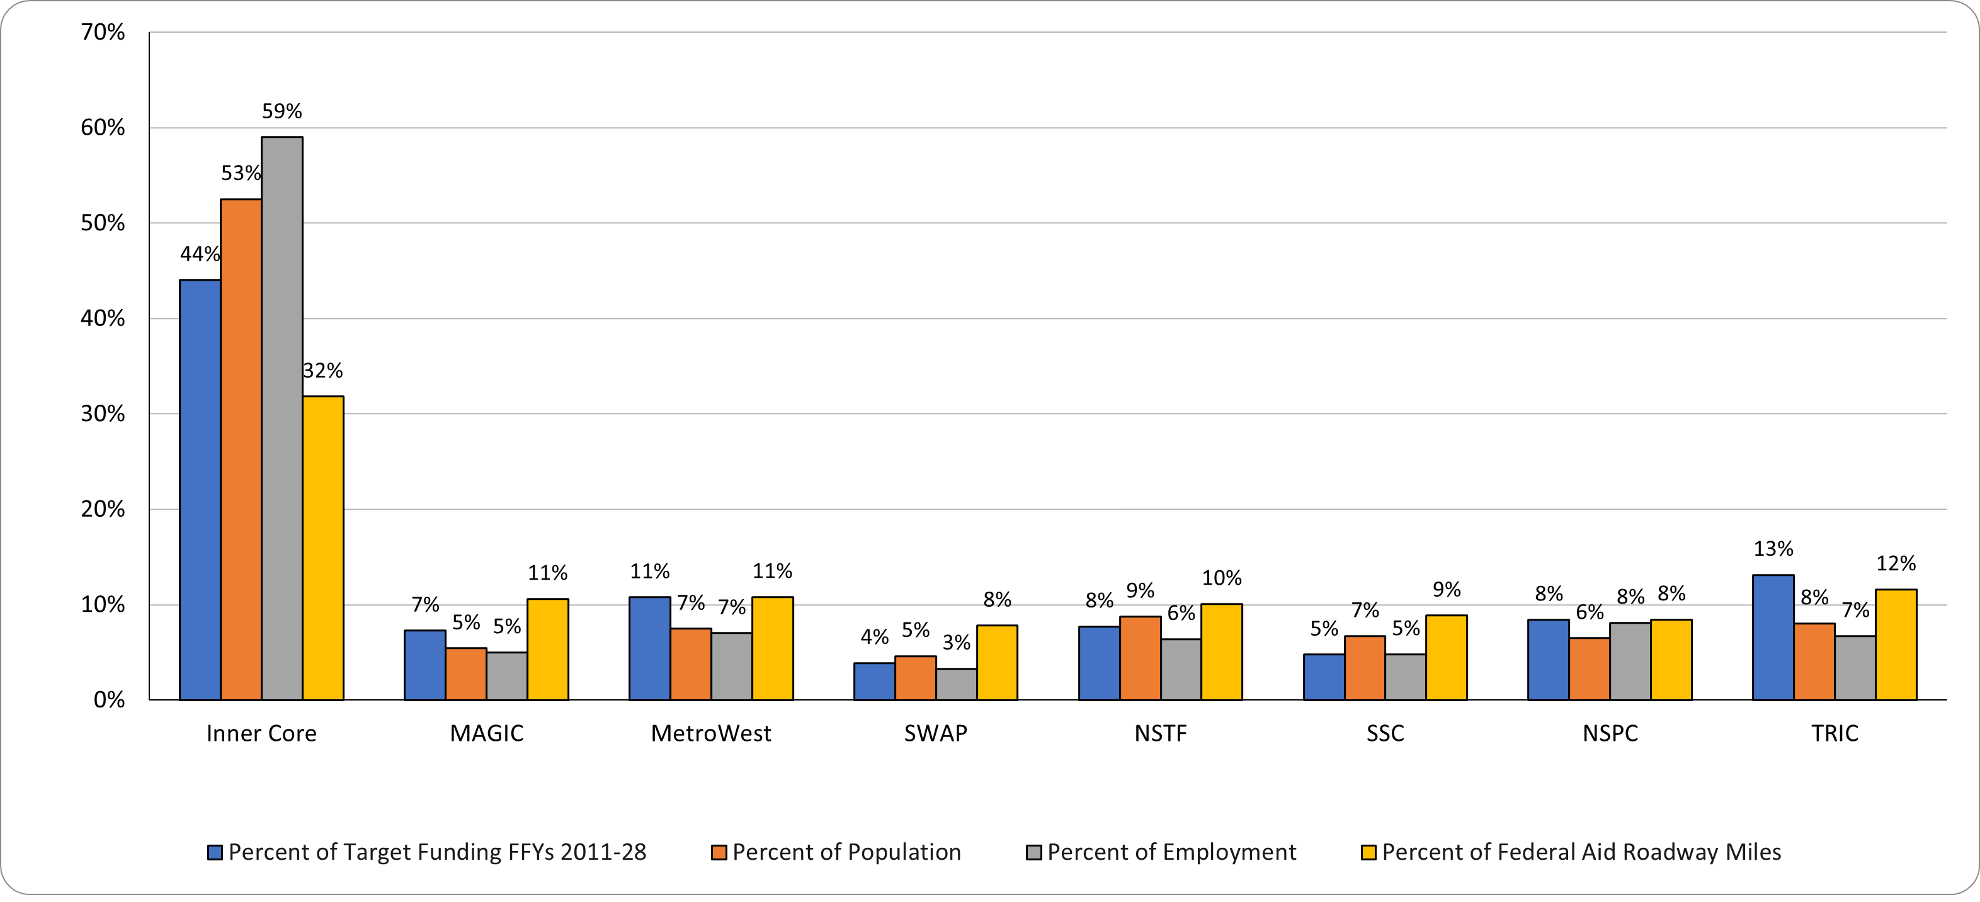
FFY = Federal Fiscal Year.
Subregions: ICC = Inner Core Committee. MAGIC = Minuteman Advisory Group on Interlocal Coordination. MWRC = MetroWest Regional Collaborative. NSPC = North Suburban Planning Council. NSTF = North Shore Task Force. SSC = South Shore Coalition. SWAP = SouthWest Advisory Planning Committee. TRIC = Three Rivers Interlocal Council.
Source: Boston Region MPO.
Figure D-4
Distribution of All Federal Highway Funding in the Boston Region by Subregion (FFYs 2011–28)
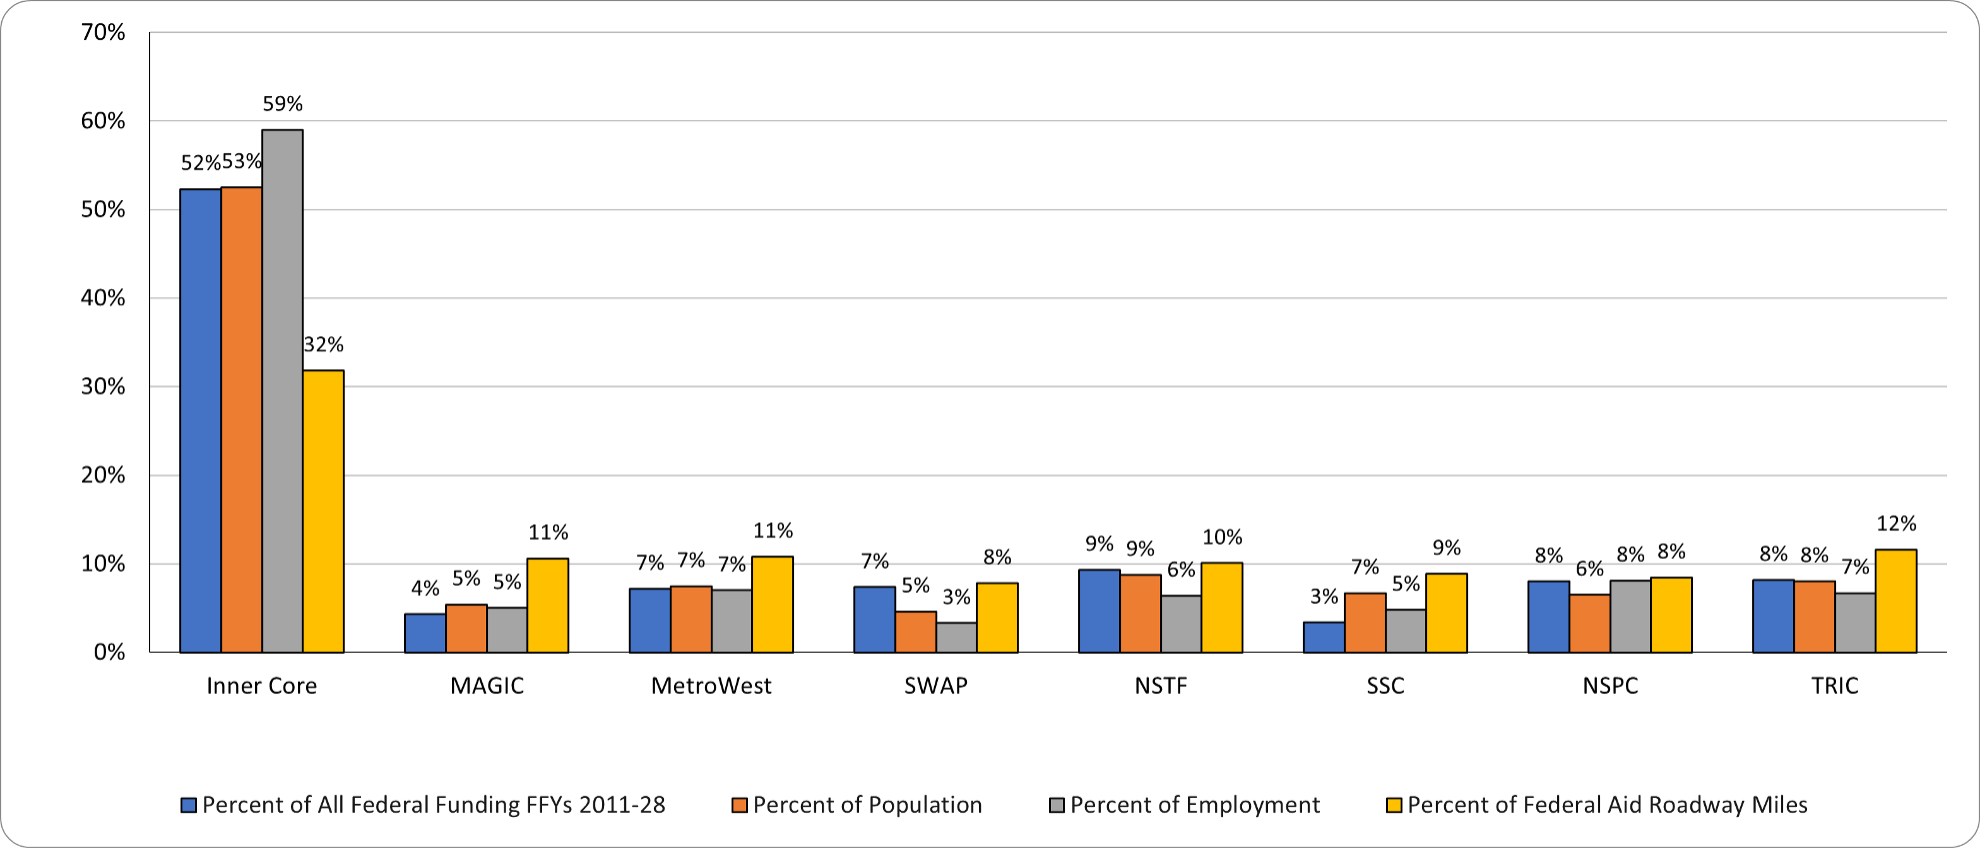
FFY = Federal Fiscal Year.
Subregions: ICC = Inner Core Committee. MAGIC = Minuteman Advisory Group on Interlocal Coordination. MWRC = MetroWest Regional Collaborative. NSPC = North Suburban Planning Council. NSTF = North Shore Task Force. SSC = South Shore Coalition. SWAP = SouthWest Advisory Planning Committee. TRIC = Three Rivers Interlocal Council.
Source: Boston Region MPO.
Table D-1
Federal Highway Programming for Municipalities in the Boston Region (FFYs 2024–28)
| MPO Municipality | Subregion | Community Type | Pct Pop. | Pct Empl. | Percent Federal Aid Roadway Miles (2016) | Regionally Prioritized Target Funding (FFY 2024-28) | Percent Regionally Prioritized Target Funding | State Prioritized Funding | Percent State Prioritized Funding | Total Funding (Regionally Prioritized and State Prioritized) | Percent Total Funding (Regionally Prioritized and State Prioritized) |
| Boston | Inner Core | Inner Core | 20.1% | 33.3% | 11.1% | $98,817,052 | 16.2% | $134,778,189 | 12.1% | $233,595,241 | 13.6% |
| Somerville | Inner Core | Inner Core | 2.4% | 1.5% | 1.2% | $65,000,000 | 10.6% | $202,274,151 | 18.2% | $267,274,151 | 15.5% |
| Hopkinton | SWAP | Developing Suburb | 0.6% | 0.5% | 1.0% | $0 | 0.0% | $101,577,402 | 9.2% | $101,577,402 | 5.9% |
| Beverly | NSTF | Regional Urban Center | 1.3% | 1.2% | 1.2% | $0 | 0.0% | $0 | 0.0% | $0 | 0.0% |
| Natick | MetroWest | Maturing Suburb | 1.1% | 1.0% | 1.2% | $7,760,451 | 1.3% | $103,438,387 | 9.3% | $111,198,838 | 6.5% |
| Cambridge | Inner Core | Inner Core | 3.5% | 7.1% | 1.8% | $352,575 | 0.1% | $20,968,208 | 1.9% | $21,320,783 | 1.2% |
| Wilmington | NSPC | Maturing Suburb | 0.7% | 1.1% | 1.3% | $23,731,429 | 3.9% | $16,592,888 | 1.5% | $40,324,317 | 2.3% |
| Salem | NSTF | Regional Urban Center | 1.3% | 0.9% | 0.7% | $13,464,225 | 2.2% | $50,815,078 | 4.6% | $64,279,303 | 3.7% |
| Lynn | Inner Core | Regional Urban Center | 3.0% | 1.3% | 1.3% | $68,596,440 | 11.2% | $35,414,262 | 3.2% | $104,010,702 | 6.0% |
| Norwood | TRIC | Regional Urban Center | 0.9% | 1.1% | 1.0% | $28,699,272 | 4.7% | $5,187,841 | 0.5% | $33,887,113 | 2.0% |
| Milton | TRIC | Maturing Suburb | 0.9% | 0.1% | 1.3% | $0 | 0.0% | $27,390,255 | 2.5% | $27,390,255 | 1.6% |
| Peabody | NSTF | Regional Urban Center | 1.6% | 1.1% | 1.4% | $24,009,979 | 3.9% | $5,145,271 | 0.5% | $29,155,250 | 1.7% |
| Chelsea | Inner Core | Inner Core | 1.2% | 0.8% | 0.6% | $18,020,721 | 2.9% | $1,617,667 | 0.1% | $19,638,388 | 1.1% |
| Framingham | MetroWest | Regional Urban Center | 2.2% | 2.1% | 2.5% | $0 | 0.0% | $25,702,748 | 2.3% | $25,702,748 | 1.5% |
| Brookline | Inner Core | Inner Core | 1.9% | 0.9% | 1.3% | $28,995,267 | 4.7% | $886,526 | 0.1% | $29,881,793 | 1.7% |
| Watertown | Inner Core | Inner Core | 1.1% | 1.0% | 0.6% | $4,058,622 | 0.7% | $3,449,261 | 0.3% | $7,507,883 | 0.4% |
| Medford | Inner Core | Inner Core | 1.8% | 1.1% | 1.5% | $148,243 | 0.0% | $24,408,900 | 2.2% | $24,557,143 | 1.4% |
| Revere | Inner Core | Inner Core | 1.9% | 0.5% | 1.3% | $0 | 0.0% | $42,633,696 | 3.8% | $42,633,696 | 2.5% |
| Woburn | NSPC | Regional Urban Center | 1.2% | 2.1% | 1.5% | $22,360,680 | 3.7% | $7,849,699 | 0.7% | $30,210,379 | 1.8% |
| Everett | Inner Core | Inner Core | 1.5% | 0.8% | 0.6% | $15,795,848 | 2.6% | $17,748,000 | 1.6% | $33,543,848 | 1.9% |
| Braintree | SSC | Maturing Suburb | 1.2% | 1.3% | 1.4% | $0 | 0.0% | $7,171,476 | 0.6% | $7,171,476 | 0.4% |
| Randolph | TRIC | Maturing Suburb | 1.0% | 0.4% | 1.0% | $0 | 0.0% | $24,688,177 | 2.2% | $24,688,177 | 1.4% |
| Quincy | Inner Core | Regional Urban Center | 3.0% | 2.4% | 2.1% | $0 | 0.0% | $331,753 | 0.0% | $331,753 | 0.0% |
| Canton | TRIC | Maturing Suburb | 0.7% | 1.1% | 1.1% | $181,042 | 0.0% | $18,866,619 | 1.7% | $19,047,661 | 1.1% |
| Newton | Inner Core | Inner Core | 2.6% | 2.6% | 2.6% | $11,403,784 | 1.9% | $5,733,237 | 0.5% | $17,137,021 | 1.0% |
| Belmont | Inner Core | Inner Core | 0.8% | 0.4% | 0.6% | $21,288,202 | 3.5% | $0 | 0.0% | $21,288,202 | 1.2% |
| Lexington | MAGIC | Maturing Suburb | 1.0% | 1.1% | 1.9% | $0 | 0.0% | $0 | 0.0% | $0 | 0.0% |
| Weston | MetroWest | Maturing Suburb | 0.4% | 0.3% | 1.3% | $27,345,994 | 4.5% | $0 | 0.0% | $27,345,994 | 1.6% |
| Reading | NSPC | Maturing Suburb | 0.8% | 0.4% | 0.8% | $11,000,000 | 1.8% | $34,753,600 | 3.1% | $45,753,600 | 2.7% |
| Stoneham | NSPC | Maturing Suburb | 0.7% | 0.3% | 0.8% | $466,628 | 0.1% | $4,698,001 | 0.4% | $5,164,629 | 0.3% |
| Waltham | Inner Core | Inner Core | 1.9% | 3.2% | 1.6% | $0 | 0.0% | $16,039,175 | 1.4% | $16,039,175 | 0.9% |
| Burlington | NSPC | Maturing Suburb | 0.8% | 2.4% | 1.3% | $0 | 0.0% | $7,498,160 | 0.7% | $7,498,160 | 0.4% |
| Hingham | SSC | Maturing Suburb | 0.7% | 0.8% | 1.3% | $15,018,900 | 2.5% | $0 | 0.0% | $15,018,900 | 0.9% |
| Wrentham | SWAP | Developing Suburb | 0.4% | 0.3% | 1.0% | $17,994,890 | 2.9% | $0 | 0.0% | $17,994,890 | 1.0% |
| Boxborough | MAGIC | Developing Suburb | 0.2% | 0.2% | 0.4% | $0 | 0.0% | $393,365 | 0.0% | $393,365 | 0.0% |
| Bellingham | SWAP | Developing Suburb | 0.5% | 0.3% | 0.9% | $0 | 0.0% | $0 | 0.0% | $0 | 0.0% |
| Cohasset | SSC | Developing Suburb | 0.2% | 0.1% | 0.5% | $11,258,807 | 1.8% | $0 | 0.0% | $11,258,807 | 0.7% |
| Milford | SWAP | Regional Urban Center | 0.9% | 0.9% | 1.2% | $9,758,201 | 1.6% | $0 | 0.0% | $9,758,201 | 0.6% |
| Dedham | TRIC | Maturing Suburb | 0.8% | 0.8% | 1.1% | $0 | 0.0% | $4,245,643 | 0.4% | $4,245,643 | 0.2% |
| Weymouth | SSC | Maturing Suburb | 1.7% | 1.0% | 1.5% | $0 | 0.0% | $7,376,252 | 0.7% | $7,376,252 | 0.4% |
| Swampscott | NSTF | Maturing Suburb | 0.5% | 0.2% | 0.3% | $8,932,000 | 1.5% | $0 | 0.0% | $8,932,000 | 0.5% |
| Middleton | NSTF | Developing Suburb | 0.3% | 0.2% | 0.5% | $0 | 0.0% | $6,487,646 | 0.6% | $6,487,646 | 0.4% |
| Danvers | NSTF | Maturing Suburb | 0.8% | 1.3% | 1.5% | $0 | 0.0% | $6,257,736 | 0.6% | $6,257,736 | 0.4% |
| Winchester | NSPC | Maturing Suburb | 0.7% | 0.4% | 0.6% | $0 | 0.0% | $0 | 0.0% | $0 | 0.0% |
| Ipswich | NSTF | Developing Suburb | 0.4% | 0.3% | 0.7% | $5,702,076 | 0.9% | $7,719,915 | 0.7% | $13,421,991 | 0.8% |
| Foxborough | TRIC | Developing Suburb | 0.6% | 0.6% | 1.3% | $0 | 0.0% | $0 | 0.0% | $0 | 0.0% |
| Acton | MAGIC | Maturing Suburb | 0.7% | 0.5% | 1.1% | $15,000 | 0.0% | $8,709,343 | 0.8% | $8,724,343 | 0.5% |
| Winthrop | Inner Core | Inner Core | 0.6% | 0.1% | 0.3% | $0 | 0.0% | $0 | 0.0% | $0 | 0.0% |
| Littleton | MAGIC | Developing Suburb | 0.3% | 0.4% | 1.0% | $5,164,375 | 0.8% | $3,146,920 | 0.3% | $8,311,295 | 0.5% |
| Lynnfield | NSPC | Maturing Suburb | 0.4% | 0.3% | 0.6% | $0 | 0.0% | $17,419,717 | 1.6% | $17,419,717 | 1.0% |
| Wakefield | NSPC | Maturing Suburb | 0.8% | 0.7% | 0.9% | $16,581,200 | 2.7% | $10,553,510 | 1.0% | $27,134,710 | 1.6% |
| Ashland | MetroWest | Maturing Suburb | 0.6% | 0.2% | 0.5% | $742,315 | 0.1% | $4,303,848 | 0.4% | $5,046,163 | 0.3% |
| Nahant | Inner Core | Maturing Suburb | 0.1% | 0.0% | 0.2% | $0 | 0.0% | $0 | 0.0% | $0 | 0.0% |
| Malden | Inner Core | Inner Core | 2.0% | 0.7% | 1.0% | $4,858,127 | 0.8% | $2,766,588 | 0.2% | $7,624,715 | 0.4% |
| Stow | MAGIC | Developing Suburb | 0.2% | 0.1% | 0.6% | $0 | 0.0% | $0 | 0.0% | $0 | 0.0% |
| Topsfield | NSTF | Developing Suburb | 0.2% | 0.1% | 0.6% | $0 | 0.0% | $3,141,758 | 0.3% | $3,141,758 | 0.2% |
| Hudson | MAGIC | Developing Suburb | 0.6% | 0.5% | 0.7% | $0 | 0.0% | $0 | 0.0% | $0 | 0.0% |
| Marlborough | MetroWest | Regional Urban Center | 1.2% | 1.6% | 2.0% | $0 | 0.0% | $0 | 0.0% | $0 | 0.0% |
| Medway | SWAP | Developing Suburb | 0.4% | 0.2% | 0.6% | $0 | 0.0% | $0 | 0.0% | $0 | 0.0% |
| Sudbury | MAGIC | Maturing Suburb | 0.6% | 0.3% | 1.0% | $0 | 0.0% | $812,283 | 0.1% | $812,283 | 0.0% |
| Wayland | MetroWest | Maturing Suburb | 0.4% | 0.2% | 0.7% | $0 | 0.0% | $3,249,130 | 0.3% | $3,249,130 | 0.2% |
| Hamilton | NSTF | Developing Suburb | 0.2% | 0.1% | 0.4% | $0 | 0.0% | $1,693,293 | 0.2% | $1,693,293 | 0.1% |
| Maynard | MAGIC | Maturing Suburb | 0.3% | 0.2% | 0.3% | $0 | 0.0% | $0 | 0.0% | $0 | 0.0% |
| Sharon | TRIC | Maturing Suburb | 0.6% | 0.2% | 1.1% | $0 | 0.0% | $1,497,906 | 0.1% | $1,497,906 | 0.1% |
| Arlington | Inner Core | Inner Core | 1.4% | 0.5% | 0.8% | $0 | 0.0% | $1,302,209 | 0.1% | $1,302,209 | 0.1% |
| Scituate | SSC | Maturing Suburb | 0.6% | 0.2% | 1.0% | $1,549,696 | 0.3% | $0 | 0.0% | $1,549,696 | 0.1% |
| Westwood | TRIC | Maturing Suburb | 0.5% | 0.6% | 0.7% | $22,094,875 | 3.6% | $5,675,170 | 0.5% | $27,770,045 | 1.6% |
| Bedford | MAGIC | Maturing Suburb | 0.4% | 0.9% | 0.8% | $0 | 0.0% | $0 | 0.0% | $0 | 0.0% |
| Bolton | MAGIC | Developing Suburb | 0.2% | 0.1% | 0.7% | $0 | 0.0% | $0 | 0.0% | $0 | 0.0% |
| Carlisle | MAGIC | Developing Suburb | 0.2% | 0.0% | 0.4% | $0 | 0.0% | $0 | 0.0% | $0 | 0.0% |
| Concord | MAGIC | Maturing Suburb | 0.6% | 0.6% | 1.1% | $0 | 0.0% | $0 | 0.0% | $0 | 0.0% |
| Dover | SWAP | Developing Suburb | 0.2% | 0.0% | 0.5% | $0 | 0.0% | $0 | 0.0% | $0 | 0.0% |
| Essex | NSTF | Developing Suburb | 0.1% | 0.1% | 0.2% | $0 | 0.0% | $0 | 0.0% | $0 | 0.0% |
| Franklin | SWAP | Developing Suburb | 1.0% | 0.8% | 1.2% | $0 | 0.0% | $0 | 0.0% | $0 | 0.0% |
| Gloucester | NSTF | Regional Urban Center | 0.9% | 0.5% | 1.0% | $0 | 0.0% | $64,960,000 | 5.9% | $64,960,000 | 3.8% |
| Holbrook | SSC | Maturing Suburb | 0.3% | 0.1% | 0.3% | $0 | 0.0% | $0 | 0.0% | $0 | 0.0% |
| Holliston | MetroWest | Developing Suburb | 0.4% | 0.3% | 0.5% | $0 | 0.0% | $0 | 0.0% | $0 | 0.0% |
| Hull | SSC | Maturing Suburb | 0.3% | 0.1% | 0.4% | $0 | 0.0% | $0 | 0.0% | $0 | 0.0% |
| Lincoln | MAGIC | Maturing Suburb | 0.2% | 0.1% | 0.6% | $0 | 0.0% | $0 | 0.0% | $0 | 0.0% |
| Manchester | NSTF | Developing Suburb | 0.2% | 0.1% | 0.4% | $0 | 0.0% | $0 | 0.0% | $0 | 0.0% |
| Marblehead | NSTF | Maturing Suburb | 0.6% | 0.2% | 0.5% | $0 | 0.0% | $0 | 0.0% | $0 | 0.0% |
| Marshfield | SSC | Maturing Suburb | 0.8% | 0.3% | 1.0% | $0 | 0.0% | $0 | 0.0% | $0 | 0.0% |
| Medfield | TRIC | Maturing Suburb | 0.4% | 0.2% | 0.5% | $0 | 0.0% | $0 | 0.0% | $0 | 0.0% |
| Melrose | Inner Core | Inner Core | 0.9% | 0.3% | 0.4% | $0 | 0.0% | $0 | 0.0% | $0 | 0.0% |
| Millis | SWAP | Developing Suburb | 0.3% | 0.1% | 0.4% | $0 | 0.0% | $0 | 0.0% | $0 | 0.0% |
| Needham | TRIC | Maturing Suburb | 1.0% | 1.1% | 1.2% | $0 | 0.0% | $0 | 0.0% | $0 | 0.0% |
| Norfolk | SWAP | Developing Suburb | 0.3% | 0.2% | 0.5% | $0 | 0.0% | $0 | 0.0% | $0 | 0.0% |
| North Reading | NSPC | Maturing Suburb | 0.5% | 0.4% | 0.6% | $0 | 0.0% | $0 | 0.0% | $0 | 0.0% |
| Norwell | SSC | Developing Suburb | 0.3% | 0.5% | 0.8% | $0 | 0.0% | $0 | 0.0% | $0 | 0.0% |
| Rockland | SSC | Developing Suburb | 0.5% | 0.4% | 0.6% | $0 | 0.0% | $0 | 0.0% | $0 | 0.0% |
| Rockport | NSTF | Developing Suburb | 0.2% | 0.0% | 0.2% | $0 | 0.0% | $0 | 0.0% | $0 | 0.0% |
| Saugus | Inner Core | Maturing Suburb | 0.9% | 0.5% | 0.8% | $0 | 0.0% | $0 | 0.0% | $0 | 0.0% |
| Sherborn | SWAP | Developing Suburb | 0.1% | 0.0% | 0.4% | $0 | 0.0% | $0 | 0.0% | $0 | 0.0% |
| Southborough | MetroWest | Maturing Suburb | 0.3% | 0.4% | 1.2% | $0 | 0.0% | $0 | 0.0% | $0 | 0.0% |
| Walpole | TRIC | Developing Suburb | 0.8% | 0.5% | 1.2% | $0 | 0.0% | $0 | 0.0% | $0 | 0.0% |
| Wellesley | MetroWest | Maturing Suburb | 0.9% | 0.9% | 0.9% | $0 | 0.0% | $0 | 0.0% | $0 | 0.0% |
| Wenham | NSTF | Developing Suburb | 0.1% | 0.1% | 0.4% | $0 | 0.0% | $0 | 0.0% | $0 | 0.0% |
FFY = Federal Fiscal Year.
Subregions: ICC = Inner Core Committee. MAGIC = Minuteman Advisory Group on Interlocal Coordination. MWRC = MetroWest Regional Collaborative. NSPC = North Suburban Planning Council. NSTF = North Shore Task Force. SSC = South Shore Coalition. SWAP = SouthWest Advisory Planning Committee. TRIC = Three Rivers Interlocal Council.
Source: Boston Region MPO.
This appendix contains detailed background on the regulatory documents, legislation, and guidance that shape the Boston Region Metropolitan Planning Organization’s (MPO) transportation planning process.
The Boston Region MPO is charged with executing its planning activities in line with federal and state regulatory guidance. Maintaining compliance with these regulations allows the MPO to directly support the work of these critical partners and ensures its continued role in helping the region move closer to achieving federal, state, and regional transportation goals. This appendix describes all of the regulations, policies, and guidance taken into consideration by the MPO during development of the certification documents and other core work the MPO will undertake during federal fiscal year (FFY) 2024.
The MPO’s planning processes are guided by provisions in federal transportation authorization bills, which are codified in federal statutes and supported by guidance from federal agencies. The Bipartisan Infrastructure Law (BIL), signed into law on November 15, 2021, replaced the Fixing America’s Surface Transportation (FAST) Act as the nation’s five-year surface transportation bill, and covers FFYs 2022–26. This section describes new provisions established in the BIL as well as items established under previous bills, such as the FAST Act.
The purpose of the national transportation goals, outlined in Title 23, section 150, of the United States Code (23 USC § 150), is to increase the accountability and transparency of the Federal-Aid Highway Program and to improve decision-making through performance-based planning and programming. The national transportation goals include the following:
The Boston Region MPO has incorporated these national goals, where practicable, into its vision, goals, and objectives, which provide a framework for the MPO’s planning processes. More information about the MPO’s vision, goals, and objectives is included in Chapter 1.
The MPO gives specific consideration to the federal planning factors, described in Title 23, section 134, of the US Code (23 USC § 134), when developing all documents that program federal transportation funds. In accordance with the legislation, studies and strategies undertaken by the MPO shall
The Boston Region MPO has also incorporated these federal planning factors into its vision, goals, and objectives. Table E-1 shows the relationships between FFY 2023 MPO studies and activities and these federal planning factors.
Table E-1
FFY 2024 3C-Funded UPWP Studies and Programs—Relationship to Federal Planning Factors
[COMING SOON]
* For ongoing FFY 2023 3C-funded studies, see FFY 2023 UPWP
** Includes Support to the MPO and its Committees, Public Participation Process, and Regional Transportation Advisory Council Support
FFY = Federal Fiscal Year. UPWP = Unified Planning Work Program.
The United States Department of Transportation (USDOT), in consultation with states, MPOs, and other stakeholders, established performance measures relevant to the national goals established in the FAST Act. These performance topic areas include roadway safety, transit system safety, National Highway System (NHS) bridge and pavement condition, transit asset condition, NHS reliability for both passenger and freight travel, traffic congestion, and on-road mobile source emissions. The FAST Act and related federal rulemakings require states, MPOs, and public transportation operators to follow performance-based planning and programming practices—such as setting targets—to ensure that transportation investments support progress towards these goals. See Chapter 3 for more information about how the MPO has and will continue to conduct performance-based planning and programming.
On December 30, 2021, the Federal Highway Administration and Federal Transit Administration jointly issued updated planning emphasis areas for use in MPOs’ transportation planning process, following the enactment of the BIL. Those planning emphasis areas include the following:
The Clean Air Act, most recently amended in 1990, forms the basis of the United States’ air pollution control policy. The act identifies air quality standards, and the US Environmental Protection Agency (EPA) designates geographic areas as attainment (in compliance) or nonattainment (not in compliance) areas with respect to these standards. If air quality in a nonattainment area improves such that it meets EPA standards, the EPA may redesignate that area as being a maintenance area for a 20-year period to ensure that the standard is maintained in that area.
The conformity provisions of the Clean Air Act “require that those areas that have poor air quality, or had it in the past, should examine the long-term air quality impacts of their transportation system and ensure its compatibility with the area’s clean air goals.” Agencies responsible for Clean Air Act requirements for nonattainment and maintenance areas must conduct air quality conformity determinations, which are demonstrations that transportation plans, programs, and projects addressing that area are consistent with a State Implementation Plan (SIP) for attaining air quality standards.
Air quality conformity determinations must be performed for capital improvement projects that receive federal funding and for those that are considered regionally significant, regardless of the funding source. These determinations must show that projects in the MPO’s Long-Range Transportation Plan (LRTP) and Transportation Improvement Program (TIP) will not cause or contribute to any new air quality violations; will not increase the frequency or severity of any existing air quality violations in any area; and will not delay the timely attainment of air quality standards in any area. The policy, criteria, and procedures for demonstrating air quality conformity in the Boston region were established in Title 40, parts 51 and 53, of the Code of Federal Regulations (40. C.F.R. 51, 40 C.F.R. 53).
On April 1, 1996, the EPA classified the cities of Boston, Cambridge, Chelsea, Everett, Malden, Medford, Quincy, Revere, and Somerville as in attainment for carbon monoxide (CO) emissions. Subsequently, the Commonwealth established a CO maintenance plan through the Massachusetts SIP process to ensure that emission levels did not increase. While the maintenance plan was in effect, past TIPs and LRTPs included an air quality conformity analysis for these communities. As of April 1, 2016, the 20-year maintenance period for this maintenance area expired and transportation conformity is no longer required for carbon monoxide in these communities. This ruling is documented in a letter from the EPA dated May 12, 2016.
On April 22, 2002, the EPA classified the City of Waltham as being in attainment for CO emissions with an EPA-approved limited-maintenance plan. In areas that have approved limited-maintenance plans, federal actions requiring conformity determinations under the EPA’s transportation conformity rule are considered to satisfy the conformity test. The MPO is not required to perform a modeling analysis for a conformity determination for carbon monoxide, but it has been required to provide a status report on the timely implementation of projects and programs that will reduce emissions from transportation sources—so-called transportation control measures—which are included in the Massachusetts SIP. In April 2022, the EPA issued a letter explaining that the carbon monoxide limited maintenance area in Waltham has expired. Therefore, the MPO is no longer required to demonstrate transportation conformity for this area, but the rest of the maintenance plan requirements, however, continue to apply, in accordance with the SIP.
On February 16, 2018, the US Court of Appeals for the DC Circuit issued a decision in South Coast Air Quality Management District v. EPA, which struck down portions of the 2008 Ozone National Ambient Air Quality Standards (NAAQS) SIP Requirements Rule concerning the ozone NAAQS. Those portions of the SIP Requirements Rule included transportation conformity requirements associated with the EPA’s revocation of the 1997 ozone NAAQS. Massachusetts was designated as an attainment area in accord with the 2008 ozone NAAQS but as a nonattainment or maintenance area as relates to the 1997 ozone NAAQS. As a result of this court ruling, MPOs in Massachusetts must once again demonstrate conformity for ozone when developing LRTPs and TIPs.
MPOs must also perform conformity determinations if transportation control measures (TCM) are in effect in the region. TCMs are strategies that reduce transportation-related air pollution and fuel use by reducing vehicle-miles traveled and improving roadway operations. The Massachusetts SIP identifies TCMs in the Boston region. SIP-identified TCMs are federally enforceable and projects that address the identified air quality issues must be given first priority when federal transportation dollars are spent. Examples of TCMs that were programmed in previous TIPs include rapid-transit and commuter-rail extension programs (such as the Green Line Extension in Cambridge, Medford, and Somerville, and the Fairmount Line improvements in Boston), parking-freeze programs in Boston and Cambridge, statewide rideshare programs, park-and-ride facilities, residential parking-sticker programs, and the operation of high-occupancy-vehicle (HOV) lanes.
In addition to reporting on the pollutants identified in the 1990 Clean Air Act Amendments, the MPOs in Massachusetts are also required to perform air quality analyses for carbon dioxide as part of the state’s Global Warming Solutions Act (GWSA) (see below).
The Boston Region MPO complies with Title VI of the Civil Rights Act of 1964, the American with Disabilities Act of 1990 (ADA), Executive Order 12898—Federal Actions to Address Environmental Justice in Minority Populations and Low-income Populations (EJ EO), and other federal and state nondiscrimination statutes and regulations in all programs and activities it conducts. Per federal and state law, the MPO does not discriminate on the basis of race, color, national origin (including limited-English proficiency), religion, creed, gender, ancestry, ethnicity, disability, age, sex, sexual orientation, gender identity or expression, veteran’s status, or background. The MPO strives to provide meaningful opportunities for participation of all persons in the region, including those protected by Title VI, the ADA, the EJ EO, and other nondiscrimination mandates.
The MPO also assesses the likely benefits and adverse effects of transportation projects on equity populations (populations covered by federal regulations, as identified in the MPO’s Transportation Equity program) when deciding which projects to fund. This is done through the MPO’s project selection criteria. MPO staff also evaluate the projects that are selected for funding, in the aggregate, to determine their overall impacts and whether they improve transportation outcomes for equity populations. The major federal requirements pertaining to nondiscrimination are discussed below.
Title VI of the Civil Rights Act of 1964 requires that no person be excluded from participation in, be denied the benefits of, or be subjected to discrimination on the basis of race, color, or national origin, under any program or activity provided by an agency receiving federal financial assistance. Executive Order 13166—Improving Access to Services for Persons with Limited English Proficiency, dated August 11, 2000, extends Title VI protections to people who, as a result of their nationality, have limited English proficiency. Specifically, it calls for improved access to federally assisted programs and activities, and it requires MPOs to develop and implement a system through which people with limited English proficiency can meaningfully participate in the transportation planning process. This requirement includes the development of a Language Assistance Plan that documents the organization’s process for providing meaningful language access to people with limited English proficiency who access their services and programs.
Executive Order 12898, dated February 11, 1994, requires each federal agency to advance environmental justice by identifying and addressing any disproportionately high and adverse human health or environmental effects, including interrelated social and economic effects, of its programs, policies, and activities on minority and low-income populations.
On April 15, 1997, the USDOT issued its Final Order to Address Environmental Justice in Minority Populations and Low-Income Populations. Among other provisions, this order requires programming and planning activities to
The 1997 Final Order was updated in 2012 with USDOT Order 5610.2(a), which provided clarification while maintaining the original framework and procedures.
Title III of the ADA “prohibits states, MPOs, and other public entities from discriminating on the basis of disability in the entities’ services, programs, or activities,” and requires all transportation projects, plans, and programs to be accessible to people with disabilities. Therefore, MPOs must consider the mobility needs of people with disabilities when programming federal funding for studies and capital projects. MPO-sponsored meetings must also be held in accessible venues and be conducted in a manner that provides for accessibility. Also, MPO materials must be made available in accessible formats.
The Age Discrimination Act of 1975 prohibits discrimination on the basis of age in programs or activities that receive federal financial assistance. In addition, the Rehabilitation Act of 1975, and Title 23, section 324, of the US Code (23 USC § 324) prohibit discrimination based on sex.
Much of the MPO’s work focuses on encouraging mode shift and diminishing GHG emissions through improving transit service, enhancing bicycle and pedestrian networks, and studying emerging transportation technologies. All of this work helps the Boston region contribute to statewide progress towards the priorities discussed in this section.
Beyond Mobility, the Massachusetts 2050 Transportation Plan, is a planning process that will result in a blueprint for guiding transportation decision-making and investments in Massachusetts in a way that advances MassDOT’s goals and maximizes the equity and resiliency of the transportation system. MPO staff continue to coordinate with MassDOT staff so that Destination 2050, the MPO’s next Long-Range Transportation Plan, is aligned with the Beyond Mobility plan.
The Commission on the Future of Transportation in the Commonwealth—established by Massachusetts Governor Charlie Baker’s Executive Order 579—published Choices for Stewardship in 2019. This report makes 18 recommendations across the following five thematic categories to adapt the transportation system in the Commonwealth to emerging needs:
Beyond Mobility will build upon the Commission report’s recommendations. The Boston Region MPO supports these statewide goals by conducting planning work and making investment decisions that complement MassDOT’s efforts and reflect the evolving needs of the transportation system in the region.
The Massachusetts 2023 Strategic Highway Safety Plan (SHSP) identifies the state’s key safety needs and guides investment decisions to achieve significant reductions in highway fatalities and serious injuries on all public roads. The SHSP establishes statewide safety goals and objectives and key safety emphasis areas, and it draws on the strengths of all highway safety partners in the Commonwealth to align and leverage resources to address the state’s safety challenges collectively. The Boston Region MPO considers SHSP goals, emphasis areas, and strategies when developing its plans, programs, and activities.
The Massachusetts Transportation Asset Management Plan (TAMP) is a risk-based asset management plan for the bridges and pavement that are in the NHS inventory. The plan describes the condition of these assets, identifies assets that are particularly vulnerable following declared emergencies such as extreme weather, and discusses MassDOT’s financial plan and risk management strategy for these assets. The Boston Region MPO considers MassDOT TAMP goals, targets, and strategies when developing its plans, programs, and activities.
In 2017, MassDOT finalized the Massachusetts Freight Plan, which defines the short- and long-term vision for the Commonwealth’s freight transportation system. In 2018, MassDOT released the related Commonwealth of Massachusetts State Rail Plan, which outlines short- and long-term investment strategies for Massachusetts’ freight and passenger rail systems (excluding the commuter rail system). In 2019, MassDOT released the Massachusetts Bicycle Transportation Plan and the Massachusetts Pedestrian Transportation Plan, both of which define roadmaps, initiatives, and action plans to improve bicycle and pedestrian transportation in the Commonwealth. These plans were updated in 2021 to reflect new investments in bicycle and pedestrian projects made by MassDOT since their release. The MPO considers the findings and strategies of MassDOT’s modal plans when conducting its planning, including through its Freight Planning Support and Bicycle/Pedestrian Support Activities programs.
The GWSA makes Massachusetts a leader in setting aggressive and enforceable GHG reduction targets and implementing policies and initiatives to achieve these targets. In keeping with this law, the Massachusetts Executive Office of Energy and Environmental Affairs (EEA), in consultation with other state agencies and the public, developed the Massachusetts Clean Energy and Climate Plan for 2020. This implementation plan, released on December 29, 2010 (and updated in 2015), establishes the following targets for overall statewide GHG emission reductions:
In 2018, EEA published its GWSA 10-year Progress Report and the GHG Inventory estimated that 2018 GHG emissions were 22 percent below the 1990 baseline level.
MassDOT fulfills its responsibilities, defined in the Massachusetts Clean Energy and Climate Plan for 2020, through a policy directive that sets three principal objectives:
In January 2015, the Massachusetts Department of Environmental Protection amended Title 310, section 7.00, of the Code of Massachusetts Regulations (310 CMR 60.05), Global Warming Solutions Act Requirements for the Transportation Sector and the Massachusetts Department of Transportation, which was subsequently amended in August 2017. This regulation places a range of obligations on MassDOT and MPOs to support achievement of the Commonwealth’s climate change goals through the programming of transportation funds. For example, MPOs must use GHG impact as a selection criterion when they review projects to be programmed in their TIPs, and they must evaluate and report the GHG emissions impacts of transportation projects in LRTPs and TIPs.
The Commonwealth’s 10 MPOs (and three non-metropolitan planning regions) are integrally involved in supporting the GHG reductions mandated under the GWSA. The MPOs seek to realize these objectives by prioritizing projects in the LRTP and TIP that will help reduce emissions from the transportation sector. The Boston Region MPO uses its TIP project evaluation criteria to score projects based on their GHG emissions impacts, multimodal Complete Streets accommodations, and ability to support smart growth development. Tracking and evaluating GHG emissions by project will enable the MPOs to anticipate GHG impacts of planned and programmed projects. See Chapter 3 for more details related to how the MPO conducts GHG monitoring and evaluation.
On September 9, 2013, MassDOT passed the Healthy Transportation Policy Directive to formalize its commitment to implementing and maintaining transportation networks that allow for various mode choices. This directive will ensure that all MassDOT projects are designed and implemented in ways that provide all customers with access to safe and comfortable walking, bicycling, and transit options.
In November 2015, MassDOT released the Separated Bike Lane Planning & Design Guide. This guide represents the next—but not the last—step in MassDOT’s continuing commitment to Complete Streets, sustainable transportation, and the creation of more safe and convenient transportation options for Massachusetts’ residents. This guide may be used by project planners and designers as a resource for considering, evaluating, and designing separated bike lanes as part of a Complete Streets approach.
In the current LRTP, Destination 2040, the Boston Region MPO has continued to use investment programs—particularly its Complete Streets and Bicycle Network and Pedestrian Connections programs—that support the implementation of Complete Streets projects. The next LRTP, Destination 2050, is being developed in tandem with the FFY 2024–28 TIP and will continue to provide similar support. In the Unified Planning Work Program, the MPO budgets to support these projects, such as the MPO’s Bicycle and Pedestrian Support Activities program, corridor studies undertaken by MPO staff to make conceptual recommendations for Complete Streets treatments, and various discrete studies aimed at improving pedestrian and bicycle accommodations.
MassDOT developed the Congestion in the Commonwealth 2019 report to identify specific causes of and impacts from traffic congestion on the NHS. The report also made recommendations for reducing congestion, including addressing local and regional bottlenecks, redesigning bus networks within the systems operated by the Massachusetts Bay Transportation Authority (MBTA) and the other regional transit authorities, increasing MBTA capacity, and investigating congestion pricing mechanisms such as managed lanes. These recommendations guide multiple new efforts within MassDOT and the MBTA and are actively considered by the Boston Region MPO when making planning and investment decisions.
On March 18, 2019, MassDOT and the MBTA released Focus40, the MBTA’s Program for Mass Transportation, which is the 25-year investment plan that aims to position the MBTA to meet the transit needs of the Greater Boston region through 2040. Complemented by the MBTA’s Strategic Plan and other internal and external policy and planning initiatives, Focus40 serves as a comprehensive plan guiding all capital planning initiatives at the MBTA. These initiatives include the Rail Vision plan, which will inform the vision for the future of the MBTA’s commuter rail system; the Bus Network Redesign (formerly the Better Bus Project), the plan to re-envision and improve the MBTA’s bus network; and other plans. The Boston Region MPO continues to monitor the status of Focus40 and related MBTA modal plans to inform its decision-making about transit capital investments, which are incorporated to the TIP and LRTP.
MetroCommon 2050, which was developed by the Metropolitan Area Planning Council (MAPC) and adopted in 2021, is Greater Boston’s regional land use and policy plan. MetroCommon 2050 builds off of MAPC’s previous plan, MetroFuture (adopted in 2008), and includes an updated set of strategies for achieving sustainable growth and equitable prosperity in the region. The MPO considers MetroCommon 2050’s goals, objectives, and strategies in its planning and activities. See Chapter 7 for more information about MetroCommon 2050 development activities.
MetroCommon 2050 will serve as the foundation for land use projections in the MPO’s next LRTP, Destination 2050. The MPO’s next LRTP is currently in development and is anticipated to be adopted by the MPO board in the summer of 2023
The purpose of the Congestion Management Process (CMP) is to monitor and analyze the mobility of people using transportation facilities and services, develop strategies for managing congestion based on the results of traffic monitoring, and move those strategies into the implementation stage by providing decision-makers in the region with information and recommendations for improving the transportation system’s performance. The CMP monitors roadways, transit, and park-and-ride facilities in the Boston region for safety, congestion, and mobility, and identifies problem locations. See Chapter 3 for more information about the MPO’s CMP.
Every four years, the Boston Region MPO completes a Coordinated Public Transit-Human Services Transportation Plan (CPT-HST), in coordination with the development of the LRTP. The CPT-HST supports improved coordination of transportation for seniors and people with disabilities in the Boston region. This plan also guides transportation providers in the Boston region who are developing proposals to request funding from the Federal Transit Administration’s Section 5310 Program. To be eligible for funding, a proposal must meet a need identified in the CPT-HST. The CPT-HST contains information about
The MPO adopted its current CPT-HST in 2019 and is currently developing its next CPT-HST, which is expected to be adopted in 2023.
MBTA and Regional Transit Authority Transit (RTA) Asset Management Plans
The MBTA and the region’s RTAs—the Cape Ann Transportation Authority (CATA) and the MetroWest Regional Transit Authority (MWRTA)—are responsible for producing transit asset management plans that describe their asset inventories and the condition of these assets, strategies, and priorities for improving the state of good repair of these assets. The Boston Region MPO considers goals and priorities established in these plans when developing its plans, programs, and activities.
MBTA and RTA Public Transit Agency Safety Plans
The MBTA, CATA, and MWRTA are required to create and annually update Public Transit Agency Safety Plans that describe their approaches for implementing Safety Management Systems on their transit systems. The Boston Region MPO considers goals, targets, and priorities established in these plans when developing its plans, programs, and activities.
The COVID-19 pandemic has radically shifted the way many people in the Boston region interact with the regional transportation system. The pandemic’s effect on everyday life has had short-term impacts on the system and how people travel, and it may have lasting effects. State and regional partners have advanced immediate changes in the transportation network in response to the situation brought about by the pandemic. Some of the changes may become permanent, such as the expansion of bicycle, bus, sidewalk, and plaza networks, and a reduced emphasis on traditional work trips. As the region recovers from the impacts of the COVID-19 pandemic and the long-term effects become apparent, state and regional partners’ guidance and priorities are likely to be adjusted.
The Boston Region Metropolitan Planning Organization (MPO) includes both permanent members and municipal members who are elected for three-year terms. Details about the MPO’s members are listed below.
The Massachusetts Department of Transportation (MassDOT) was established under Chapter 25 (An Act Modernizing the Transportation Systems of the Commonwealth of Massachusetts) of the Acts of 2009. MassDOT has four divisions: Highway, Rail and Transit, Aeronautics, and the Registry of Motor Vehicles. The MassDOT Board of Directors, composed of 11 members appointed by the governor, oversees all four divisions and MassDOT operations and works closely with the Massachusetts Bay Transportation Authority (MBTA) Board of Directors. The MassDOT Board of Directors was expanded to 11 members by the Legislature in 2015, a group of transportation leaders assembled to review structural problems with the MBTA and deliver recommendations for improvements. MassDOT has three seats on the MPO board, including seats for the Highway Division.
The MassDOT Highway Division has jurisdiction over the roadways, bridges, and tunnels that were overseen by the former Massachusetts Highway Department and Massachusetts Turnpike Authority. The Highway Division also has jurisdiction over many bridges and parkways that previously were under the authority of the Department of Conservation and Recreation. The Highway Division is responsible for the design, construction, and maintenance of the Commonwealth’s state highways and bridges. It is also responsible for overseeing traffic safety and engineering activities for the state highway system. These activities include operating the Highway Operations Control Center to ensure safe road and travel conditions.
The MBTA, created in 1964, is a body politic and corporate, and a political subdivision of the Commonwealth. Under the provisions of Chapter 161A of the Massachusetts General Laws, it has the statutory responsibility within its district of operating the public transportation system in the Boston region, preparing the engineering and architectural designs for transit development projects, and constructing and operating transit development projects. The MBTA district comprises 175 communities, including all of the 97 cities and towns of the Boston Region MPO area.
In April 2015, as a result of a plan of action to improve the MBTA, a five-member Fiscal and Management Control Board (FMCB) was created. The FMCB was created to oversee and improve the finances, management, and operations of the MBTA. The FMCB’s authorizing statute called for an initial three-year term, with the option for the board to request that the governor approve a single two-year extension. In 2017, the FMCB’s initial mandate, which would have expired in June 2018, was extended for two years, through June 30, 2020. In 2020, the FMCB’s mandate was extended a second time for an additional period of one year, through June 30, 2021.
Following the expiration of the FMCB’s extended mandate, the MBTA Board of Directors was formed as a permanent replacement to provide oversight for the agency. By statute, the board consists of seven members, including the Secretary of Transportation as an ex-officio member. The MBTA Advisory Board appoints one member who has municipal government experience in the MBTA’s service area and experience in transportation operations, transportation planning, housing policy, urban planning, or public or private finance. The Governor appoints the remaining five board members, which include an MBTA rider and member of an environmental justice population, and a person recommended by the President of the American Federation of Labor and Congress of Industrial Organizations.
The MBTA Advisory Board was created by the Massachusetts Legislature in 1964 through the same legislation that created the MBTA. The Advisory Board consists of representatives of the 175 cities and towns that compose the MBTA’s service area. Cities are represented by either the city manager or mayor, and towns are represented by the chairperson of the board of selectmen. Specific responsibilities of the Advisory Board include reviewing and commenting on the MBTA’s long-range plan, the Program for Mass Transportation; proposed fare increases; the annual MBTA Capital Investment Program; the MBTA’s documentation of net operating investment per passenger; and the MBTA’s operating budget. The MBTA Advisory Board advocates for the transit needs of its member communities and the riding public.
The Massachusetts Port Authority (Massport) has the statutory responsibility under Chapter 465 of the Acts of 1956, as amended, for planning, constructing, owning, and operating such transportation and related facilities as may be necessary for developing and improving commerce in Boston and the surrounding metropolitan area. Massport owns and operates Boston Logan International Airport, the Port of Boston’s Conley Terminal, Flynn Cruiseport Boston, Hanscom Field, Worcester Regional Airport, and various maritime and waterfront properties, including parks in the Boston neighborhoods of East Boston, South Boston, and Charlestown.
The Metropolitan Area Planning Council (MAPC) is the regional planning agency for the Boston region. It is composed of the chief executive officer (or a designee) of each of the cities and towns in the MAPC’s planning region, 21 gubernatorial appointees, and 12 ex-officio members. It has statutory responsibility for comprehensive regional planning in its region under Chapter 40B of the Massachusetts General Laws. It is the Boston Metropolitan Clearinghouse under Section 204 of the Demonstration Cities and Metropolitan Development Act of 1966 and Title VI of the Intergovernmental Cooperation Act of 1968. Also, its region has been designated an economic development district under Title IV of the Public Works and Economic Development Act of 1965, as amended. MAPC’s responsibilities for comprehensive planning encompass the areas of technical assistance to communities, transportation planning, and development of zoning, land use, demographic, and environmental studies. MAPC activities that are funded with federal metropolitan transportation planning dollars are documented in the Boston Region MPO’s Unified Planning Work Program.
The City of Boston, six elected cities (currently Beverly, Everett, Framingham, Newton, Somerville, and Burlington), and six elected towns (currently Acton, Arlington, Brookline, Hull, Medway, and Norwood,) represent the 97 municipalities in the Boston Region MPO area. The City of Boston is a permanent MPO member and has two seats. There is one elected municipal seat for each of the eight MAPC subregions and four seats for at-large elected municipalities (two cities and two towns). The elected at-large municipalities serve staggered three-year terms, as do the eight municipalities representing the MAPC subregions.
The Regional Transportation Advisory Council, the MPO’s citizen advisory group, provides the opportunity for transportation-related organizations, non-MPO member agencies, and municipal representatives to become actively involved in the decision-making processes of the MPO as it develops plans and prioritizes the implementation of transportation projects in the region. The Advisory Council reviews, comments on, and makes recommendations regarding certification documents. It also serves as a forum for providing information on transportation topics in the region, identifying issues, advocating for ways to address the region’s transportation needs, and generating interest among members of the general public in the work of the MPO.
The Federal Highway Administration (FHWA) and Federal Transit Administration (FTA) participate in the Boston Region MPO in an advisory (nonvoting) capacity, reviewing the Long-Range Transportation Plan, Transportation Improvement Program, and Unified Planning Work Program, and other facets of the MPO’s planning process to ensure compliance with federal planning and programming requirements. These two agencies oversee the highway and transit programs, respectively, of the United States Department of Transportation under pertinent legislation and the provisions of the Bipartisan Infrastructure Law (BIL).
[COMING SOON]