Technical Memorandum
DATE: September 14, 2023
TO: Massachusetts Department of Transportation
FROM: Sophie Fox and Rosemary McCarron, Central Transportation Planning Staff
RE: Lab and Municipal Parking Study (Phase I): Research on parking supply and demand at lab and life sciences developments in the region
This memorandum presents and summarizes the results of the Federal Fiscal Year (FFY) 2023 Unified Planning Work Program (UPWP) study #13806, the Lab and Municipal Parking Study. The work scope for this study was approved by the Boston Region Metropolitan Planning Organization (MPO) board on February 16, 2023.
The Boston region is experiencing a boom in laboratory and life sciences development. This development has spread from established research centers such as Kendall Square in Cambridge to a diverse range of areas across the region. The Metropolitan Area Planning Council (MAPC) and Central Transportation Planning Staff (CTPS) have heard from numerous stakeholders, especially municipal planners, across the region that there is a need for rigorous research to determine parameters for parking regulation for such developments.
To better understand the factors influencing parking provision at lab and life science facilities, CTPS and MAPC collaborated on a research study to assess regional parking demand and use at these developments. In the first phase of this study, CTPS and MAPC conducted market research on the lab and life sciences industry in the Boston region, reviewed the parking policies of several municipalities in the region, interviewed stakeholders and industry experts, and developed a methodology for future collection and analysis of parking utilization data at lab and life sciences facilities. The FFY 2024 UPWP includes funding for a second phase of this research that will include this data collection and analysis.
This work has led to a few key findings that will help inform Phase II. The market research showed that the life sciences industry in the Boston region has experienced immense change in the last few years, ranging from periods of incredible growth to times of more economic uncertainty, and the industry is expanding both in size and geographically. Each municipality treats lab and life science facilities differently when creating zoning ordinances, resulting in a wide range of parking requirements that are dependent on the characteristics of the buildings themselves, the accessibility of non-driving modes of transportation in the surrounding areas, the time at which the ordinances were written, and more.
The interviews with stakeholders illustrated that in addition to these parking policies, market conditions and lenders also play a large role in the final determination of how much parking developers provide at a site.
The interviewees also highlighted many strategies to use existing parking space more efficiently and discourage the reliance on single occupancy vehicle (SOV) trips, such as repurposing unused parking spaces, moving towards more shared or mixed-use parking, and promoting transportation demand management (TDM) ordinances that encourage non-driving commutes. These findings have been incorporated into data collection materials that will be used in Phase II.
To establish a foundational level of understanding about the current and projected state of the life sciences industry in the Boston region, we analyzed sources such as the MassBio 2022 Industry Snapshot, real estate market reports from 2022 and 2023, and news articles. These documents provide valuable information about both the current state of the industry and how it is projected to evolve in the coming years. We also conducted research on zoning ordinances and parking policies for lab and life sciences facilities across the Boston region to develop a better understanding about use codes and parking policies that apply to these types of buildings. Finally, we expanded the scope of our research to include other life sciences hubs in the United States, looking specifically in the Bay Area and San Diego, California. We examined the state of their life sciences industries as well as the parking policies they have in place.
The findings from this research are presented in Section 3.
We conducted interviews with numerous stakeholders to gain more insight into parking at lab and life sciences facilities throughout the Boston region. To incorporate multiple perspectives on the issue, we spoke to representatives from municipalities who determine the parking policies for labs, developers who have to develop marketable properties while abiding by these guidelines, and other stakeholders who have a good sense of usage patterns and the efficacy of these policies. The following is a comprehensive list of interviewees:
Municipalities
Property Developers
Other Stakeholders
Our findings from these interviews are detailed in Section 4.
Using the MAPC Perfect Fit Study1 as a guide, CTPS developed a series of data collection materials. These materials include a list of lab locations, identified through MassBuilds, CoStar, and the stakeholder interviews. In Phase II, CTPS will select sites from this database of lab locations to conduct parking utilization studies. Staff created data collection sheets to be used for in-person parking counts. Previous CTPS projects that involved data collection were also used as a guide when developing the materials for this study. Finally, CTPS adapted the Property Owner/Manager Survey created for the Perfect Fit Study to create an online survey tailored for property managers at labs throughout the Boston region. This survey will be distributed broadly before data collectors are sent out to the field. The survey will expand data collection to reach more properties than would be possible with in-person parking counts.
These materials are detailed further in Section 5 and can be found in their entirety in Appendices 1 and 2.
The life sciences industry is growing rapidly in Massachusetts. Since the Massachusetts Life Sciences Initiative was passed in 2008, employment in the biopharma industry has grown by 96.5 percent and most of this workforce is in research and development.2 Massachusetts has one of the fastest growing research and development and bio-manufacturing industries in the country. In 2021, Massachusetts organizations received the most funding per capita of all the states from the National Institute of Health (NIH), representing nine percent of the total NIH funding despite only making up two percent of the nationwide population.3
Not only is the life sciences industry in Massachusetts growing in terms of its workforce, but it is also geographically expanding from its traditional hotspots. As of 2022, there were 55.9 million square feet (sf) of lab and Good Manufacturing Practice (GMP) space in the state. It is projected that Massachusetts will add an additional 26 million to 59 million sf by the end of 2025. In 2022, Middlesex County led all Massachusetts counties in existing biopharma inventory with over 38 million sf. Cambridge, and in particular East Cambridge, has been the center of the life sciences industry in Massachusetts. Investment has recently expanded outside of this core area to more far-reaching cities and suburbs. In 2022, 57 percent of the venture capital funding went to companies located outside of Cambridge, an increase from 42 percent in 2021.4
The life sciences industry might not continue to grow unchecked. Despite a few years of incredible growth, it has faced obstacles over the last year. Demand for biotech tenants in the Boston region grew substantially during the earlier days of the COVID 19 pandemic. At the same time, the supply of lab space increased greatly. When demand returned to pre-pandemic levels, there was suddenly more available lab space than the market could absorb. The real estate brokerage Newmark is predicting that “of the 40 million sf of life science lab space that has been proposed but not yet started construction in Greater Boston, some 80 percent — 32 million sf — could be ‘curtailed’ and put on hold.”5 Some developers are backing out of projects, while others are rethinking decisions to expand farther out into the more suburban parts of the region, choosing to instead play it safe and stay in the well-tested area of Cambridge.6
Despite an increase in vacancies and layoffs in the industry, “given the metro area’s preeminence as a global technology and life science hub, Greater Boston’s long-term outlook for recovery is encouraging and only expected to strengthen”, according to the Newmark Q4 2022 report.7 In Quarter 1 of 2023, companies signed leases for 850,000 sf of life science space, which is more than was leased in the previous quarter and more than the 2017–20 quarterly average.8 Industry experts seem to expect the life sciences industry to overcome the short-term challenges and persevere and grow in the long term.
Another trend that has emerged in the past few years has been a shift in how biotech workers are commuting to and from work. According to a recent survey, only one third of life sciences employees are in the office every weekday.9 Between 2019 and 2022, the percentage of employees who drive alone to work has increased from 44 to 57 percent, while the percentage of employees who use the bus, subway, or commuter rail has decreased from 41 to 25 percent.10 Reasons cited for this change in commuting behavior include the need for faster commute times, unreliable transit service, lack of availability of transit service where they work or live, and transit schedules that do not match up with their work schedules. The COVID 19 pandemic also played a large role in this shift.11
Overall, a lack of robust, consistent, and reliable public transit around life sciences facilities and the increase of employees working from home has a profound impact on the commuting patterns of their employees. The continued expansion of the life sciences industry to more remote and disconnected areas of the region will only increase the complexity of the issue, making it ever more important to study these facilities and determine the best way to provide parking and transit services to the workforce. With reports from stakeholders that the space being used for parking is not being allocated efficiently, there seems to be a disconnect between what is needed at these sites and what zoning guidelines and regulations dictate should be built.
The amount of parking provided at a lab site is often driven by the parking requirements specified in a municipality’s zoning ordinance. Each development is assigned a use (e.g., residential, office, commercial, or laboratory) and each use has guidance regarding parking provision. However, not all of the municipalities in the Boston region classify life science buildings in the same way. Some zoning ordinances have a “Research and Development” use that applies to life science labs. Others have a “Laboratory” use, which is intended more for clinical laboratories that can be quite different from life science labs. Some zoning ordinances overlook life sciences entirely and classify these facilities as office, commercial, or industrial use, even though the facilities often have specific and unique characteristics that sets them apart from these other uses.12
Compared to other types of commercial buildings, employees at life science labs are more likely to work with hazardous materials or animals. These labs might also require more venting for fume hoods, which in turn requires more mechanical equipment and taller ceilings or buildings to accommodate those venting needs.13 If the use designations applied to these buildings do not account for these differences, then the parking ratios for that use might not correctly fit the needs of life science facilities.
Another difference between labs and offices that greatly impacts parking needs is worker density. Compared to office buildings, labs usually have fewer people per square foot, resulting in fewer vehicle trips to these sites. If a zoning ordinance equates lab and office uses and assigns them the same parking ratio based on square footage, labs may be required to provide more parking than is needed.14 On the other hand, while the COVID 19 pandemic has led to fewer office employees working in person, we heard from stakeholders that those employed in life sciences are more likely to require access to the laboratory facilities to complete their work. As a result, parking utilization decreased less at labs than at office developments in the wake of the pandemic.
In most of the Boston region municipalities we spoke with, life sciences lab developments are rarely approved by-right, meaning that special plan approvals and permits are required before they can be built. If a development can move forward by-right, the project will be approved without a discretionary process if it meets the requirements specified in the zoning code. If a discretionary process is invoked, the municipality may work with the developer to determine the appropriate amount of parking to provide.
Table 1
Parking Ratios Across Municipalities
Municipality |
Zoning Use Designation |
Minimum or Maximum |
Requirement |
Requirement (spaces per 1000 sf)
|
Source |
Other Information |
Boston |
Office/Private Lab |
Maximum |
0.3-1.25 spaces per 1000 sf of gross floor area
|
0.3 - 1.25 |
Boston Ratio Mapa |
Separate requirements for institutional research and development/ laboratory uses |
Cambridge |
Office and Laboratory |
Maximum |
0.8 spaces per 1,000 sf of gross floor area |
0.8 |
Cambridge Zoning Ordinanceb |
This ratio is for Planned Unit Development Districts
|
Somerville |
Research and Development or Laboratory |
Minimum/ Maximum |
1 space per 1,000 gross leasable sf |
1 |
Somerville Zoning Ordinancec |
Buildings in a transit area are subject to a 1/1000 sf parking maximum. Outside of a transit area the same parking ratio serves as a minimum.
|
Framingham |
Research and Development (R&D) establishment, manufacturing, industrial services, or extractive industry
|
Minimum |
1 space per 800 sf of gross floor area or 1 space per employee, whichever is greater
|
1.25 or 1 per employee |
Zoning Bylaws of Framinghamd |
|
Chelsea |
Industrial, manufacturing, warehouse storage, laboratories, or similar uses
|
Minimum |
1 space for 1,000 sf of floor area + 1 space for each 3 employees on the largest shift |
1 + 1 per 3 employees
|
Chelsea Code of Ordinancese |
|
Watertown |
Research and Development
|
Minimum |
1 space per 600 sf of gross floor area
|
1.67 |
Watertown Zoning Codef |
|
Lexington |
Manufacturing and Research Laboratory Uses
|
Minimum |
1 space per 500 sf of net floor area
|
2 |
Town of Lexington Zoning Bylawg |
|
Woburn |
Office or professional building, except medical |
Minimum |
1 space per 350 sf of net floor area |
2.86 |
Woburn Zoning Codeh |
In the Life Sciences and Business Overlay District, the parking requirement is 2 spaces per 1,000 sf
|
Notes:
a: “Ratio Map and Table,” City of Boston https://www.boston.gov/sites/default/files/file/2021/09/Ratio%20Map%20and%20Table%2011%20x%2017.pdf
b: Cambridge, MA, Zoning Ordinance, art. 6, 13 (2021) https://library.municode.com/ma/cambridge/codes/zoning_ordinance?nodeId=ZONING_ORDINANCE_ART13.000PLUNDEDI
c: Somerville, MA, Zoning Ordinance, §§ 4.1.15, 4.2.15, 4.3.15, 4.4.16, 5.1.17, 6.1.13, 6.2.15, 6.3.13, 6.4.14, https://www.somervillezoning.com/wp-content/uploads/sites/2/2022/01/2021-21-31-Somerville-Zoning-Ordinance.pdf
d: Zoning Bylaws of Framingham, https://www.framingham.com/townhall/zbf/sect4.htm
e: Chelsea, MA, Code or Ordinances, art. 12, Sec. 34-283. - Table of required off-street parking spaces. https://library.municode.com/ma/chelsea/codes/code_of_ordinances?nodeId=PTIICOOR_CH34ZO_ARTXIITAREOREPASP
f: Watertown, MA. City Code, § 6.01 Required off-street parking spaces, https://ecode360.com/37103247
g: Lexington, MA, City Code, § 5.1.4, https://ecode360.com/27629834
h: Woburn, MA, “SECTION 8 OFF STREET PARKING AND LOADING FACILITIES REGULATIONS”, https://www.woburnma.gov/wp-content/uploads/2017/06/Section-8-Off-Street-Parking-and-Loading-Facilities-Regulations-1.pdf
Table 1 lists the vehicle parking requirements for lab and life sciences facilities in the municipalities that participated in this study. Some municipalities have a specific use code that corresponds to laboratories or research facilities while others apply use codes for office or industrial uses to life science facilities. Boston and Cambridge limit the amount of parking that developers can provide through parking maximums. Other municipalities’ zoning ordinances provide minimum parking requirements that developers must meet and can exceed. Somerville has a maximum or a minimum depending on whether the property is in a transit area. The amount of parking allowed or required for these facilities tends to increase with distance from the inner core of the region.
The Boston Transportation Department (BTD) developed parking maximum ratios guidelines for developments larger than 50,000 sf that are required to submit a transportation access plan agreement. These maximum ratios are based on mobility scores, which are calculated on a parcel-by-parcel basis using a variety of metrics, such as proximity to rapid transit, bikeshare, rideshare, bus routes, commuter rail, grocery stores, and walkable amenities.15 Depending on the location of the development, the maximum parking ratio for the Office/Private Lab use category can range from 0.3 spaces per 1,000 sf in areas with high mobility scores to 1.25 spaces per 1,000 sf in the lowest scoring areas.16 Cambridge is another municipality that employs a parking maximum rather than a minimum. The City has implemented a ratio of 0.8 spaces per 1,000 sf. Previously the ratio was one space per 1,000 sf; the ratio was decreased when the City’s annual data collection, which took place through its TDM process, showed that utilization was low.
While the parking provision requirements have the most direct impact on transportation decisions, other municipal policies can influence parking utilization at these developments. Most municipalities we studied have transportation demand management ordinances that require developments to encourage non-single occupancy vehicle (non-SOV) trips to the site. In some municipalities, these TDM ordinances apply to all developments of a specified square footage. Others have overlay districts or other zoning carve outs that influence transportation regulations in specific areas. For example, Lexington requires that developments located in Transportation Management Overlay Districts submit a Transportation Plan that specifies how the developers will mitigate impacts to the transportation system and implement TDM to reduce the number of vehicle trips generated by the facility.17
The Boston Planning & Development Agency recently released a draft of “Life Science Building Design Guidelines” to “inform property owners, business owners, developers, and the public about the desired form and character of life science development in the City of Boston.”18 The guidelines would encourage life sciences buildings 50,000 sf or smaller to follow the BTD’s maximum parking ratio guidelines that apply to larger developments. It would also encourage building designs that are sensitive to the neighborhood context and avoid large blocks to maintain “permeability” for pedestrians and bicyclists.19
While the Boston region is one of the fastest growing areas in the United States for the life sciences industry, there are other major pockets of life sciences activity that were explored. The Bay Area and San Diego are both particularly large hubs. These areas together directly employ life sciences workers in the hundreds of thousands, contributing to hundreds of billions of dollars in economic impact.20
In 2019, San Francisco eliminated parking minimums for all uses citywide, instead instituting maximums that vary for different uses. We have seen the same happen in the large, activity dense cities of Boston, Cambridge, and Somerville. However, unlike these cities in the Boston region, San Francisco does not have specific parking maximums for lab facilities. While the City acknowledges that laboratories and life sciences facilities have unique characteristics that sets them apart from office or manufacturing uses, there are no specific parking requirements for those facilities.21 The City requires a maximum of 0.75 spaces per 1,000 sf for industrial uses and three spaces per 1,000 sf for office uses, and for uses where there is no specified requirement, the maximum parking permitted is 0.5 spaces per 1,000 sf.22
According to the San Diego Municipal Code, updated in 2023, parking minimums for research and development properties outside of the industrial service (IS) zone are different based on whether the properties are in a Transit Area (2.1 spaces per 1000 sf), a Parking Standards Transit Priority Area (0 spaces), or neither (2.5 spaces).23 Somerville is an example of a municipality with a similar approach to implementing parking, in which the ratio for a property is dependent on whether it is in a designated transit accessible zone. In San Diego, there is also a maximum requirement of four spaces per 1,000 square feet for these types of developments.24 Having both a parking maximum and minimum in place sets San Diego apart from many municipalities in the Boston region that only have one or the other.
Representatives of each municipality expressed some challenges with their current system for determining parking requirements. Municipalities with zoning ordinances that have not been updated in recent years tend to require more parking, conflate lab uses with other uses, and do not differentiate between transit accessible areas and more car dependent areas. Outdated zoning ordinances also can miss changes in the transit system that have occurred over time, resulting in parking requirements that do not factor in current non-driving modes that are accessible to commuters.
Those with more data-driven approaches to parking provisions cited challenges using data with discrete geographic boundaries that sometimes make adjacent areas look quite different in the analysis. They also cited challenges keeping the analysis up to date. Some municipalities highlighted that conversions of office sites into lab facilities increase the excess of parking that already exists at these sites, as labs typically have lower employee densities. The representatives from the communities interviewed welcome the opportunity to receive guidance on how to use space more efficiently and create better commuting conditions for the life sciences workforce.
In addition to the parking regulations put in place by municipalities, property developers also play a large role in determining the amount of parking provided for a project. Providing parking is expensive, and developers can save money on construction costs by building less of it. However, developers typically want to provide abundant parking because they fear that they will have trouble securing financing and tenants if the property is deemed to have insufficient parking. We spoke to several developers in the Boston region who highlighted the sometimes-conflicting interests of municipalities, financers, brokerages, and the developers themselves when it comes to parking provision.
Developers use municipality zoning requirements as a baseline, but the amount of parking space they actually build is often market-driven. They can experience pushback from lending agencies if the amount of parking proposed does not match the lender's assessment of how much parking is needed to make the space attractive to prospective tenants. In the developers’ view, in order to lower the amount of parking being built, the minds of the tenants and the lending agencies need to be changed. Some developers have avoided this pushback by making sure that the parking they provide is comparable to their competitors. Developers who finance their own projects have more flexibility to ignore this way of thinking and have more freedom to determine the amount of parking at their sites, though they still have to abide by municipality requirements.
One developer highlighted that the variable number of people working in a building at a given time gets overlooked in parking determinations, especially for larger buildings. If five percent of employees are absent on a given day, a site with 100 employees could expect an additional five unoccupied parking spaces. On a site with 1,000 employees, the same percentage of absent employees could result in 50 unoccupied spaces. Parking requirements are typically calculated linearly by square footage and do not account for how the scale of an employment center influences parking needs.
While developers do not want to provide substantially more parking than is needed, they can feel limited by municipalities where there are parking maximums instead of minimums. Developers in these situations believe that they need to build more parking to compete in the market but are prevented from doing so by these requirements, and as a result can feel like they are not providing enough at their sites. They believe that in order to best help the neighborhoods their properties are in, the developers and municipalities need to be on the same page and collaborate on establishing parking guidelines.
Some municipalities and developers have collaborated on strategies to ensure sufficient parking can be made available without building unnecessary parking. For example, at the 1050 Waltham Street property in Lexington, Greatland designated the top floor of the parking garage as recreational space that could be converted into parking spots if needed. According to Greatland, parking utilization is low enough that the space is still being used as recreational space and is covered in solar panels. The City of Watertown allows projects subject to a special permit to develop open space where parking could be built if the need arises. This open space, called shadow parking, can account for up to 20 percent of the building’s parking requirement.25
Boston Properties has funded its own parking utilization studies at life science developments to demonstrate that a lower parking ratio can be sufficient. Built parking can be converted to other uses depending on the utilization. For example, IQHQ controls a parking garage across the street from its Alewife property. The City of Cambridge asked the developer to monitor parking usage for five years, and if it is determined that the garage is being underutilized, parking spaces will be made available for residential use. Every development is unique, and continual monitoring of parking usage is a good way to determine whether the amount of parking required and built is actually appropriate for each site. If the results determine that some amount of parking is unnecessary, that space can be converted to better, more beneficial uses.
Another way to reduce excess parking space is to create more mixed-use locations. Many life science projects are approximately 60 percent lab space and 40 percent office space. Some municipalities calculate parking requirements by using the square footage dedicated to each use. However, one developer remarked that the market tends to treat the whole property as lab space. Since the parking ratios for labs are lower than offices, that can lead to less parking space for the development than if the uses were viewed independently.
When office buildings are converted to labs, developers can sometimes reallocate parking spaces in excess of the lab parking requirement for other uses. If the amount of parking is not changed, the labs are often overparked. Creating more mixed-use sites provides other opportunities to more efficiently use parking space. Mixed-use developments often feature staggered peak parking demand periods which limit the maximum amount of parking required at a given time.
Other examples of shared parking include sharing space with residential buildings and the public or taking advantage of off-site parking. In Watertown, developers can apply for shared or off-site parking. The City has also been trying to get agreements to use garages in new developments as public parking at night to serve nearby residential neighborhoods. This is in addition to the special permit which allows up to a 25 percent reduction in the number of parking spaces required at sites that demonstrate that the peak parking demand of all uses is lower than the requirement.26 In Somerville, while shared parking based on peak times has not yet resulted in reduced parking, the City has implemented a rule that requires developments in denser and multiuse districts to open parking to the public.
Not all attempts to create mixed-use or off-site parking have been successful. IQHQ has been pushing to allow public parking at its sites on weekends and during snow emergencies, as well as parking for Red Sox games at its Fenway neighborhood sites. So far, the company has not been able to come to an agreement with the City of Boston about how to get that done.
Representatives of Boston Properties said that they need to ensure that they are providing parking at a rate that is comparable to their competitors, and if they do not, they need to give a reason why. They identified transit accessibility as a reason they might use to provide less parking. When a lab site is accessible by transit fewer people choose to drive, and an argument can be made to build less parking. More transit-connected areas such as Boston, Somerville, and Cambridge take advantage of available transit to lower their parking requirements and/or use maximums instead of minimums.
As mentioned previously, transit accessibility factors into Boston’s Mobility Score which is used to determine the maximum parking ratio for developments over 50,000 sf. The City of Somerville’s Zoning Ordinance defines Transit Areas, which determine if a development is subject to a minimum or maximum parking ratio. Transit Area parking maximums apply to commercial developments within one-quarter mile of a rapid transit station and residential developments within a one-half mile of a rapid transit station. The City of Chelsea has also seen some success in using accessibility as an argument for granting parking relief as the Silver Line terminus, which is within a half-mile of most activity, did not exist when the zoning ordinance was written.
Other municipalities are not as accessible by transit, making it difficult to argue for less parking. Framingham has many labs off of Route 9, which are convenient for drivers to get to and from the sites, but employees cannot run errands, get coffee, or go out to lunch without getting back in their vehicle. Proximity to transit does not always equal accessibility. In Lexington, although the commercial district does have transit service, connections to rapid transit can take over an hour and are sometimes unreliable.
In some municipalities, there have been efforts to encourage other types of travel to and from lab sites. In Lexington, the overlay district includes the Minuteman Bikeway, so the Town has a plan to promote biking, which includes requirements for on-site showers and bike parking. Watertown is also including requirements for amenities to improve the bike and pedestrian network around lab sites. If these modes become viable alternatives to using single passenger vehicles for enough employees, the findings can be used to argue for less parking.
Transportation demand management plans can greatly improve the availability and utilization of non-driving modes of commuting to and from labs. Almost all of the municipalities we spoke to have a TDM plan in place. These plans can include requirements for reserved spaces for electric vehicles, carpool, transit passes or subsidies, bikeshare passes, bike trails and lanes, shuttle service, or pedestrian way contributions. In some municipalities, the minimum parking requirements can be reduced if certain TDM requirements are met.
Many of the TDM plans either require or incentivize developments to join a transportation management association (TMA), such as the 128 Business Council. We spoke to a representative of the 128 Business Council to learn more about their work and perspective. The 128 Business Council runs 10 shuttle routes in the Boston region with 16 vehicles in total. In places that have been more aggressive in their actions to limit single-occupancy trips, such as Lexington and Waltham, shuttles are seen more as an essential utility. Without strong support from municipalities, it is harder to get developers to fully embrace partnerships with 128 Business Council and other TMAs, especially if they believe they need to provide more parking to secure funding.
According to the 128 Business Council, shuttles have affected on-site parking utilization at lab and life science facilities. Life sciences sites have some of the highest ridership, and people are using the shuttles at all times during the day. During the early days of COVID 19, when shuttle service was temporarily suspended, a few lab and life sciences sites along the 128 Business Council’s routes experienced parking demand beyond their capacity for the first time. Though the shuttles are effective, some life sciences employees work non-traditional shifts that do not align well with the shuttle schedules. This means that they would either have to contort their work hours to match up with the shuttle schedule or choose a different mode of transportation, most likely driving. Greater investments into shuttle service and partnerships with TMAs could make public transit a better option for more life sciences employees, lessening their dependence on driving and the amount of parking space needed.
Additionally, we spoke with JLL, which manages many properties in the Boston region, including much of Greatland’s portfolio. Regarding TDM, the representative we spoke with remarked that the strategies that tend to have larger impacts are financial subsidies. It is important that there is a process in place to monitor TDM strategies such as shuttle service or subsidies to assess whether these plans are working. Cambridge has a robust TDM monitoring process, which is being used as a model for Somerville’s efforts to collect data about their TDM strategies. None of the other municipalities we talked to have reporting or monitoring requirements that are being enforced.
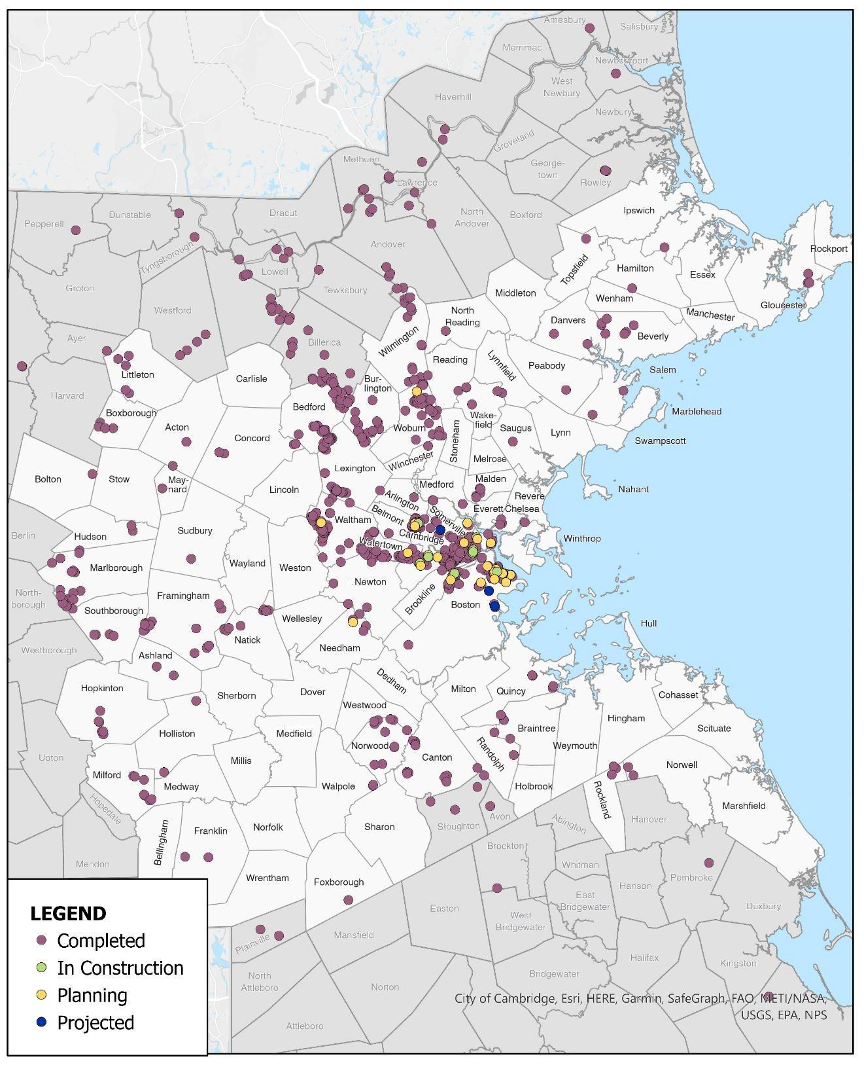
Through our conversations with stakeholders, as well as outside research, we compiled a list of sites at which we would like to perform data collection. Future data collection will sample sites that are of varying size, in a wide range of locations, and with varying access to public transportation. The two main sources from which we received the site locations are MassBuilds and CoStar. MassBuilds, MAPC’s inventory of real estate development projects, had a list of 53 research and development sites in the Boston region that had either the words “lab” or “life” in the descriptions.27 These include sites that are completed, in construction, in the planning phase, or projected. They are shown below in Figure 1. The other completed projects in the map are from the CoStar dataset, which includes completed buildings in the Boston region that have some lab space.28 The sites chosen for in-person data collection will come from this list and will be decided in Phase II of this study.
Figure 1
Lab and Life Sciences Sites in the Boston Region
Prior to collecting on-site parking utilization data, CTPS will survey property managers at locations throughout the Boston region. With this survey, we will be able to reach many more properties than if we only conducted in-person data collection. We have incorporated the methods found in the Perfect Fit Parking Study in our survey and data collection materials, and plan to collaborate with the MAPC data services team before we finalize our data collection and analysis processes. The survey includes questions about the characteristics of the building and its tenants, the type of parking available at the site, the parking utilization patterns that they have observed, and TDM strategies that have been implemented at the site. The full Qualtrics survey can be found in Appendix 1.
We have created materials to guide the future data collection. These materials include a comprehensive set of instructions for data collection shifts and a sheet for data collectors to record parking usage at the sites. When counting the number of vehicles parked at a site, the data collectors will record the different types of parking spots and different types of vehicles present. They will count personal vehicles, commercial vehicles, bikes, and more, and record whether they are parked in surface lots, garages, bike racks, or other locations. To be most efficient with the data collectors’ limited time and to get data from as many sites as possible, they will be scheduled to visit multiple sites per shift. The sites assigned to each shift will ideally be close together so that data collectors can easily travel between them. They will conduct counts at each site twice, once towards the beginning of their shift and once towards the end, to try to capture movement patterns in and out of these facilities throughout the day. The data collection sheet can both be found in Appendix 2.
Loading zones frequently came up during the study interviews and are included in both the property manager survey and data collection materials. Loading is imperative to lab operations, as this industry often requires frequent shipping and receiving of materials. As a result, lab buildings and their parking facilities are often designed around loading docks. Our conversations with stakeholders also highlighted the desire for more electric vehicle and bicycle parking spots at these locations. Future data collection will capture these parking uses as well.
The next steps of this project, leading into Phase II, begin with conducting pilot data collection at a few sites where we already have connections through the developers, property managers, and municipalities interviewed through this project. Based on the pilot results and feedback from the data collectors, we will refine the methodology. Then, we will distribute the property manager survey and conduct additional in-person data collection.
With the data collected we plan to analyze the relationship between parking supply and utilization and to identify which characteristics of lab and life sciences facilities most closely predict parking demand. If the utilization rate plateaus as supply increases, then that is an argument against increasing supply. Additionally, if we can statistically determine which factors correlate with high levels of parking demand, then addressing those factors can be a good way to start trying to decrease reliance on driving. We will continue to collaborate with MAPC on data collection and throughout the analysis process to explore which parts of MAPC’s Perfect Fit Parking study model can be adapted and applied to this study.
One goal of this study was to gain a better understanding of the lab and life sciences industry in the Boston region and learn more about the travel behavior of the industry’s workforce. Through market research, we learned that, despite recent economic developments, the life sciences industry in Massachusetts will likely continue to grow in size and expand from known hubs such as Kendall Square to more far-reaching suburbs. Every municipality is different and classifies life sciences labs differently in their zoning ordinances. Our analysis of parking policies illuminated a pattern in which the farther from Boston and less accessible by transit a municipality is, the higher their parking ratios tend to be. The most accessible municipalities—Boston, Cambridge, and Somerville—have switched from parking minimums to maximums in some or all cases to encourage the use of non-driving commuting modes.
Through our interviews with stakeholders, we learned how parking requirements are translated into practice, namely that developers tend to be more market-driven when making decisions about parking. This often leads to a disconnect between the amount of parking being built and what is actually necessary. In our conversations, the responsibility for this phenomenon was laid on multiple actors who all have their own, sometimes competing objectives. The analyses that will be conducted in Phase II of this study should provide information that will help these stakeholders come to a consensus about how to determine parking at these sites.
In this study, numerous strategies to utilize parking space most effectively, as well as to discourage SOV commutes and reduce the perceived need for abundant parking were discussed. Repurposing extra parking spaces into other uses that provide amenities for life sciences workers, implementing plans for shared or mixed-use parking, and increasing transit accessibility were all discussed by stakeholders as interventions they are trying to implement at lab locations across the Boston region. Shuttle services and other TDM strategies have the potential to transform how life sciences workers commute to and from work, but more investment in these strategies is necessary in order to make a profound impact on people’s reliance on single-occupancy vehicles.
The other objective of this study was to develop a methodology to study the supply of and demand for parking at lab and life science facilities. CTPS has incorporated the lessons learned from our research and stakeholder interviews to plan the next phase of this project. We have created materials for in-person data collection and an online survey that will provide us with valuable insights into parking supply and utilization at life sciences labs throughout the Boston region. Along with MAPC, we look forward to gathering and analyzing this data, resulting in rigorous research and recommendations to help guide parking management at current and future lab and life sciences facilities.
Appendix 1: Property Manager Survey
Appendix 2: Data Collection Sheet
1 Kasia Hart et al. 2019. “Metro Boston Perfect Fit Parking Initiative”. MAPC. https://perfectfitparking.mapc.org/assets/documents/Final%20Perfect%20Fit%20Report.pdf
2 MassBio. 2022. “2022 INDUSTRY SNAPSHOT.” MassBio. https://www.massbio.org/wp-content/uploads/2022/08/FINAL-2022_IndustrySnapshot.pdf
3 MassBio. 2022.
4 MassBio. 2022.
5 Carlock, Catherine. 2022. “Boston’s lab boom is hitting the brakes”. The Boston Globe, November 15, 2022. https://www.boston.com/news/the-boston-globe/2022/11/15/bostons-lab-boom-is-hitting-the-brakes/
6 Carlock. 2022.
7 Newmark. 2022. “Boston Life Science Market”. Newmark. https://www.nmrk.com/storage-nmrk/uploads/fields/pdf-market-reports/4Q22-Boston-Life-Science-Market.pdf
8 CBRE. 2023. “Developers bet on future of life science as uncertainty creeps into the market” CBRE. https://mktgdocs.cbre.com/2299/d2e19015-1e9c-458f-a7d2-42136abd19db-2480475813.pdf
9 MassBio. 2022. “2022 Transportation Survey”. MassBio. December 2022. MassBio 2022 Transportation Survey
10 Mohl, Bruce. 2022. “Biotech workers driving more, using the T less”. CommonWealth Magazine. December 7, 2022. https://commonwealthmagazine.org/transportation/biotech-workers-driving-more-using-the-t-less/
11 Mohl. 2022.
12 O’Reilly Jr, William R. 2014. “Microbes, Mice and Minefields: Unique Issues in Developing and Leasing Life Science Facilities” Wilmer Cutler Pickering Hale and Dorr, LLP. https://www.wilmerhale.com/insights/publications/microbes-mice-and-minefields-unique-issues-in-developing-and-leasing-life-science-facilities
13 O’Reilly Jr. 2014.
14 O’Reilly Jr. 2014.
15 “MAXIMUM PARKING RATIOS”, City of Boston. https://www.boston.gov/departments/transportation/maximum-parking-ratios
16 “Ratio Map and Table,” City of Boston
17 Lexington, MA, City Code, § 7.2.4, https://ecode360.com/27630398
18 Adam Johnson et al. 2023. “Life Science Building Design Guidelines” BPDA. https://www.bostonplans.org/getattachment/7487618e-c160-4758-9e3e-7bd81eae708e
19 Adam Johnson et al. 2023
20 “2023 Life Science Economic Impact Report”, Biocom California, https://www.biocom.org/news/eir/#san-diego
21 San Francisco, CA, Planning Code, § 890.52. https://codelibrary.amlegal.com/codes/san_francisco/latest/sf_planning/0-0-0-27121
22 San Francisco, CA, Planning Code, § 150, https://codelibrary.amlegal.com/codes/san_francisco/latest/sf_planning/0-0-0-18845
23 San Deigo, CA. 2023. “San Diego Municipal Code Chapter 14: General Regulations”. Table 142-05G, https://docs.sandiego.gov/municode/MuniCodeChapter14/Ch14Art02Division05.pdf
24 San Diego, CA. 2023
25 Watertown, MA. City Code, § 6.01 Required off-street parking spaces, https://ecode360.com/37103247
26 Watertown, MA. City Code
27 Massbuilds, https://www.massbuilds.com/map
28 Lab Locations. 2023. CoStar Group. www.costar.com
The Boston Region Metropolitan Planning Organization (MPO) operates its programs, services, and activities in compliance with federal nondiscrimination laws including Title VI of the Civil Rights Act of 1964 (Title VI), the Civil Rights Restoration Act of 1987, and related statutes and regulations. Title VI prohibits discrimination in federally assisted programs and requires that no person in the United States of America shall, on the grounds of race, color, or national origin (including limited English proficiency), be excluded from participation in, denied the benefits of, or be otherwise subjected to discrimination under any program or activity that receives federal assistance. Related federal nondiscrimination laws administered by the Federal Highway Administration, Federal Transit Administration, or both, prohibit discrimination on the basis of age, sex, and disability. The Boston Region MPO considers these protected populations in its Title VI Programs, consistent with federal interpretation and administration. In addition, the Boston Region MPO provides meaningful access to its programs, services, and activities to individuals with limited English proficiency, in compliance with U.S. Department of Transportation policy and guidance on federal Executive Order 13166.
The Boston Region MPO also complies with the Massachusetts Public Accommodation Law, M.G.L. c 272 sections 92a, 98, 98a, which prohibits making any distinction, discrimination, or restriction in admission to, or treatment in a place of public accommodation based on race, color, religious creed, national origin, sex, sexual orientation, disability, or ancestry. Likewise, the Boston Region MPO complies with the Governor's Executive Order 526, section 4, which requires that all programs, activities, and services provided, performed, licensed, chartered, funded, regulated, or contracted for by the state shall be conducted without unlawful discrimination based on race, color, age, gender, ethnicity, sexual orientation, gender identity or expression, religion, creed, ancestry, national origin, disability, veteran's status (including Vietnam-era veterans), or background.
A complaint form and additional information can be obtained by contacting the MPO or at http://www.bostonmpo.org/mpo_non_discrimination.
To request this information in a different language or in an accessible format, please contact
Title VI Specialist
Boston Region MPO
10 Park Plaza, Suite 2150
Boston, MA 02116
civilrights@ctps.org
By Telephone:
857.702.3700 (voice)
For people with hearing or speaking difficulties, connect through the state MassRelay service:
Relay Using TTY or Hearing Carry-over: 800.439.2370
Relay Using Voice Carry-over: 866.887.6619
Relay Using Text to Speech: 866.645.9870
For more information, including numbers for Spanish speakers, visit https://www.mass.gov/massrelay.