Chapter 2: Safety Improvements in Cambridge
Chapter 3: Pedestrianizing Moody Street in Waltham
Project Manager
Blake Acton
Project Principal
Paul Christner
Data Analysts
Sophie Fox
Blake Acton
Graphics
Kim DeLauri
The preparation of this document was supported by the Boston Region MPO through MPO Planning and §5303 Contract #118967.
Central Transportation Planning Staff is directed by the Boston Region Metropolitan Planning Organization (MPO). The MPO is composed of state and regional agencies and authorities, and local governments.
December 2023
For general inquiries, contact
Central Transportation Planning Staff
State Transportation Building
Ten Park Plaza, Suite 2150
Boston, Massachusetts 02116
857.702.3700
The Boston Region Metropolitan Planning Organization (MPO) operates its programs, services, and activities in compliance with federal nondiscrimination laws including Title VI of the Civil Rights Act of 1964 (Title VI), the Civil Rights Restoration Act of 1987, and related statutes and regulations. Title VI prohibits discrimination in federally assisted programs and requires that no person in the United States of America shall, on the grounds of race, color, or national origin (including limited English proficiency), be excluded from participation in, denied the benefits of, or be otherwise subjected to discrimination under any program or activity that receives federal assistance. Related federal nondiscrimination laws administered by the Federal Highway Administration, Federal Transit Administration, or both, prohibit discrimination on the basis of age, sex, and disability. The Boston Region MPO considers these protected populations in its Title VI Programs, consistent with federal interpretation and administration. In addition, the Boston Region MPO provides meaningful access to its programs, services, and activities to individuals with limited English proficiency, in compliance with U.S. Department of Transportation policy and guidance on federal Executive Order 13166.
The Boston Region MPO also complies with the Massachusetts Public Accommodation Law, M.G.L. c 272 sections 92a, 98, 98a, which prohibits making any distinction, discrimination, or restriction in admission to, or treatment in a place of public accommodation based on race, color, religious creed, national origin, sex, sexual orientation, disability, or ancestry. Likewise, the Boston Region MPO complies with the Governor's Executive Order 526, section 4, which requires that all programs, activities, and services provided, performed, licensed, chartered, funded, regulated, or contracted for by the state shall be conducted without unlawful discrimination based on race, color, age, gender, ethnicity, sexual orientation, gender identity or expression, religion, creed, ancestry, national origin, disability, veteran's status (including Vietnam-era veterans), or background.
A complaint form and additional information can be obtained by contacting the MPO or at http://www.bostonmpo.org/mpo_non_discrimination.
To request this information in a different language or in an accessible format, please contact
Title VI Specialist
Boston Region MPO
10 Park Plaza, Suite 2150
Boston, MA 02116
civilrights@ctps.org
By Telephone:
857.702.3700 (voice)
For people with hearing or speaking difficulties, connect through the state MassRelay service:
Relay Using TTY or Hearing Carry-over: 800.439.2370
Relay Using Voice Carry-over: 866.887.6619
Relay Using Text to Speech: 866.645.9870
For more information, including numbers for Spanish speakers, visit https://www.mass.gov/massrelay.
This study builds upon the previous Central Transportation Planning Staff (CTPS) guidebook, Managing Curb Space in the Boston Region: A Guidebook, which examined curb management examples, best practices, and challenges in the Boston region (Acton et al. 2021). The goal of this study is to provide municipalities with tools and guidance for data collection and analysis of curb management strategies.
To support this goal and to develop insights and recommendations based on real-world conditions, CTPS conducted two case studies. The purpose of these case studies was to calculate a series of metrics that assess curb use interventions and their impacts on parking activity and the usage of public curb space. The first case study focused on the Porter Square Safety Improvement Project in Cambridge, Massachusetts, which introduced parking spaces for people with disabilities, buffered bike lanes, and loading zones along a segment of Massachusetts Avenue. The second case study evaluated the implementation of outdoor dining on Moody Street in Waltham, Massachusetts. For both case studies, CTPS collected data before and after the interventions were implemented and conducted analyses to explore their impacts.
For this phase of the work, the sample sizes chosen were large enough to adequately explore our chosen methodologies but may not be large enough for rigorous statistical analysis. Additionally, these methods were only applied to two case studies, so planners should be cautious when using these results to make generalized statements about other curb management projects in the Boston region. The objective of this report is to demonstrate the effectiveness of the data collection and analysis processes that measure the impact of curb management strategies, culminating in a series of recommendations for planners and other stakeholders for conducting their own curb studies.
The case study in Cambridge investigated the area of the Porter Square Safety Improvement Project implemented by the City of Cambridge in Summer 2022. The primary objective of the project was “to achieve a safe street design for people of all ages and abilities” by redesigning the curb space of a quarter-mile section of Massachusetts Avenue near Porter Square between Roseland Street and Beech Street (City of Cambridge 2022a). The project upgraded the existing unprotected bike lanes to buffered semi-protected bike lanes, added parking spaces for people with disabilities, created loading zones, and reduced the number of metered parking spaces along the corridor.
For this case study, CTPS examined the impact of curb use changes in the northern segment of the redesign, highlighted in Figure 1 below. CTPS limited the study area to this section to improve the accuracy of vehicle-duration data and to capture shorter trips with frequent 15-minute data collection intervals. Key changes of the redesign in this section include the following:
CTPS measured curb utilization before and after project implementation to develop insights into how to analyze commercial and noncommercial parking activity in the area. CTPS investigated specific parking behavior, such as vehicle occupancy, capacity, duration, and unauthorized parking.
Figure 1
Case Study Area Within the Porter Square Safety Improvement Project
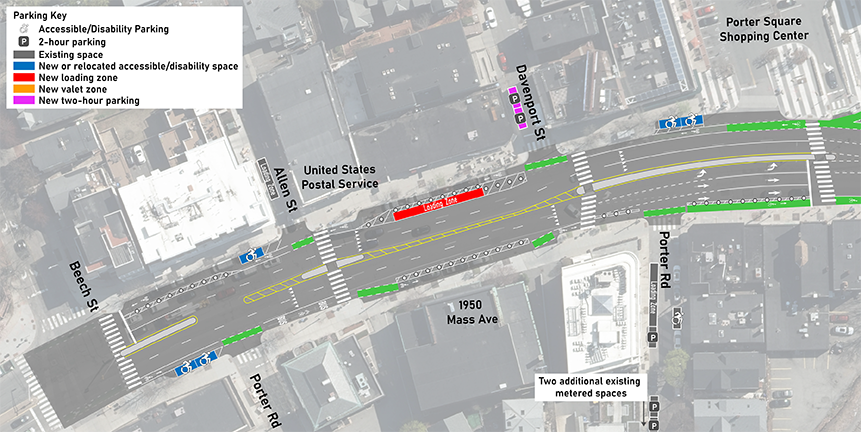
Source: “MassAve_Redesign_ai_6_6_2022” by the City of Cambridge (2022c).
The City of Cambridge stated that improving safety is the central goal of the Porter Square Safety Improvement Project (City of Cambridge 2022b). Because the focus of this study was to measure changes in vehicle activity and not evaluate whether Cambridge met their safety goals, we did not examine safety impacts as part of this work.
The Porter Square Safety Improvement Project reduced the number of spaces dedicated to vehicle parking in the study area from 29 to 21 (Table 1). At the same time, the number of car-sized equivalent curb spaces dedicated to safer bicycle travel significantly increased from two to 15. The Porter Square project also converted a row of easily accessible, centrally located curb spaces along Massachusetts Avenue from a two-hour metered zone to a 30-minute loading zone.
The number of strictly no-parking spaces also declined from eight to three. These no-parking spaces are typically placed around intersections to increase visibility for both pedestrians and drivers. Before the intervention, about 19 percent of the curb space served as unusable buffer space at intersections. Much of this space was replaced with buffered bike lanes, thereby increasing the amount of potentially useful curb space in the study area from 81 percent to 93 percent.
Table 1
Number of Parking Spaces and Car-sized Equivalent Curb Spaces in Study Area Before and After Intervention
Curb Use |
Subtype |
Spaces Before |
Spaces After |
Change |
Parking |
Two-hour metered |
19 |
6 |
-13 |
Parking |
30-min loading zone |
0 |
5 |
+5 |
Parking |
Accessible |
2 |
3 |
+1 |
Parking |
Loading zone |
8 |
7 |
-1 |
Parking Total |
N/A |
29 |
21 |
-8 |
Bike Lane |
Buffered/protected |
2 |
15 |
+13 |
No Parking |
N/A |
8 |
3 |
-5 |
Bus Stop |
N/A |
3 |
3 |
0 |
Notes: Car-sized equivalent curb spaces are the number of parking spaces that could fit in the equivalent length of curb space.
N/A = not applicable.
Source: Central Transportation Planning Staff.
The foundational data-collection plan follows the Metropolitan Area Planning Council’s (MAPC) guide How to Do a Parking Study (Un 2010). Data were collected during ten shifts; five before and five after the curb use change. This resulted in a fairly limited sample size, which may not be representative of typical curb use activity in the study area. Table 2 shows each pair of shifts, the day, time, and collection dates. Each shift before the intervention was paired with a shift after the intervention that took place on a matching day of the week and time interval. Ideally, data collection before and after an intervention would be performed in the same season to avoid confounding factors such as seasonal travel patterns, school schedules, and more.
Table 2
Data-Collection Shifts in Cambridge
Day |
Before Date |
After Date |
Shift Time |
Thursday |
July 21 |
November 10 |
6:00 AM–10:00 AM |
Saturday |
July 31 |
November 5 |
10:00 AM–2:00 PM |
Tuesday |
July 19 |
November 1 |
10:00 AM–2:00 PM |
Wednesday |
July 27 |
November 9 |
2:00 PM–6:00 PM |
Tuesday |
July 19 |
November 15 |
6:00 PM–9:00 PM |
Source: Central Transportation Planning Staff.
During each shift, the data collector walked along the study route, starting over at the beginning of the loop every 15 minutes. This resulted in 16 rounds of data collection per four-hour shift and 12 rounds for the three-hour shift (Tuesday 6:00 PM–9:00 PM), resulting in a total of 152 loops across the entire case study area. To measure vehicle duration and authorized parking, the data collector recorded the last three digits of vehicle license plates while traveling the loop. To measure commercial activity, data collectors classified vehicles as either commercial or noncommercial following the guidelines by the Urban Freight Lab as shown in Figure 2 (Urban Freight Lab 2020). Data collectors also noted whether vehicles were blocking the bike lane. An example of a data-collection sheet is shown in Figure 3.
Figure 2
Urban Freight Lab’s Vehicle Classification Guidelines
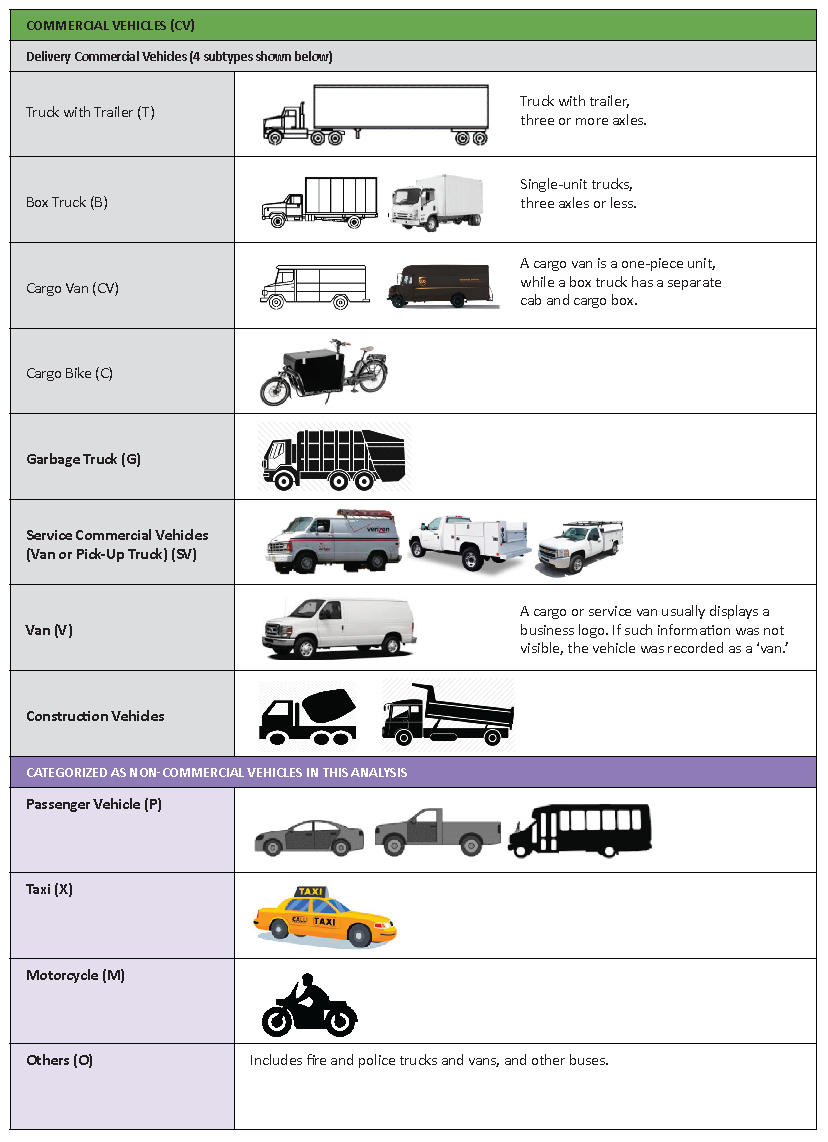
Source: “Method Overview and Step-by-Step Process to Conduct a Curb Occupancy Study” by the Urban Freight Lab (2020).
Figure 3
Sample of Field Data Collection Sheet
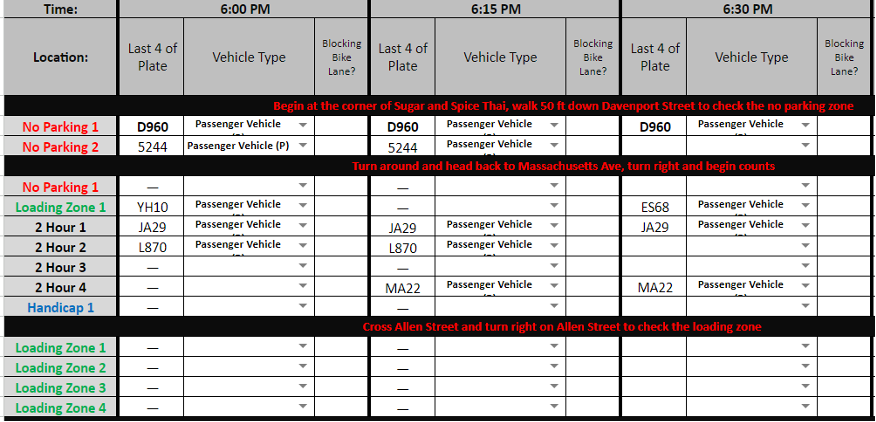
Source: Central Transportation Planning Staff.
Once the data collection was complete, the sheets were digitized for comparison of the before-and-after data. In these sheets, each occupied parking space was represented as one row. The attributes included were the day of collection, the shift, the spot type (two-hour, 30-minutes, no parking, loading zone, bike lane, bus stop, or an accessible spot), the last few digits of the license plate, vehicle type, and authorization to park in the location.
To determine if a vehicle was parked under the parking space’s time limit, we considered the number of consecutive 15-minute time slots where the same vehicle was parked in the same spot. Since the data collector does not record the exact minute of each observation, each time a vehicle is observed it is assumed to have spent 15 minutes in that location. For example, if a vehicle is in the same spot for two collection rounds, then it is assumed that it was there for 30 minutes. Therefore, if the same vehicle is observed in a two-hour space more than eight times (15 minutes * 8 rounds = 120 minutes), or in 30-minute space more than two times (15 minutes * 2 rounds = 30 minutes) it is assumed to have exceeded the time limit.
We used vehicle-duration data to determine whether a vehicle was authorized to park at the location. Any vehicle observed parking within the designated time limit and in a zone where vehicle parking is allowed was considered authorized. We also assumed that any car parked in an accessible spot was authorized unless the data collector noted otherwise. Any noncommercial vehicles observed in a commercial loading zone for more than 15 minutes, or any commercial vehicles observed in a loading zone for more than 30 minutes were considered unauthorized. If the data collector indicated that a vehicle was blocking a bike lane or located in a no parking zone or bus stop then it was considered unauthorized parking, regardless of how long the vehicle was parked.
There were instances of vehicles that were already parked at the beginning of a shift and others that were parked at the end of a shift. Since the shifts were only three to four hours, it was not possible to determine the exact amount of time these vehicles were parked outside of the collection period. Where possible, we considered enforcement hours noticed on signage in the area when categorizing authorized parking activity. For loading zones, we assumed that the time limits were always enforced. We also assumed the 8:00 AM to 8:00 PM enforcement period applied to the 30-minute loading zone as well.
There were a few additional assumptions made when making this dataset:
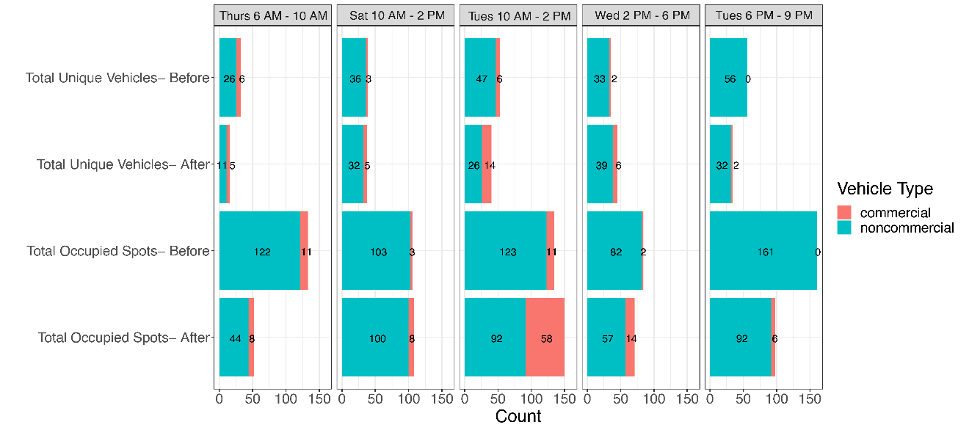
The first analysis developed summary statistics. We examined the total number of occupied parking spaces and number of unique vehicles that were parked in the study area before and after project implementation. Table 3 shows the results of this analysis. The number of occupied spaces was determined by adding the total number of times a vehicle occupied a spot during each shift, regardless of license plate. The number of unique vehicles was determined by counting the number of unique license plates for the different vehicle types throughout a shift. The table also highlights the percent change from before to after the redesign. The data showed an overall decline in both the number of occupied spots and the number of unique vehicles, especially during the morning and evening shifts. This result is unsurprising considering the amount of curb space in the study area available to vehicle parking declined by 28 percent.
Table 3
Change in All Parking Activity Before and After Curb Use Redesign
Shift Day |
Shift Time |
Occupied Spaces Before |
Occupied Spaces After |
Change in Occupied Spaces |
Unique Vehicles Before |
Unique Vehicles After |
Change in Unique Vehicles |
Thursday |
6:00 AM–10:00 AM |
133 |
52 |
-60.9 % |
32 |
16 |
-50.0 % |
Saturday |
10:00 AM–2:00 PM |
106 |
108 |
1.9 % |
39 |
37 |
-5.1 % |
Tuesday |
10:00 AM–2:00 PM |
134 |
150 |
11.9 % |
53 |
40 |
-24.5 % |
Wednesday |
2:00 PM–6:00 PM |
84 |
71 |
-15.5 % |
35 |
45 |
28.6 % |
Tuesday |
6:00 PM–9:00 PM |
161 |
98 |
-39.1 % |
56 |
34 |
-39.3 % |
Notes: Values represents the total number of occupied curb spaces or unique vehicles over an entire shift, which represents three or four hours.
Source: Central Transportation Planning Staff.
The results from Table 3 are displayed in Figure 4 in chart form and are categorized by vehicle type. Since the project changed parking availability for both commercial and noncommercial vehicles, this analysis explores whether the data yielded different results for the different types of vehicles. The chart shows that while overall space occupancy and unique visitors decreased, this trend was not consistent by vehicle type.
For each shift, while we observed that the number of noncommercial occupied spaces declined, there was a dramatic increase in the total number of spaces occupied by commercial vehicles. The data show that this increase in commercial vehicle activity occurred on Massachusetts Avenue between Davenport Street and Allen Street where two-hour metered parking was replaced with a 30-minute loading zone. The data suggest the new loading zone is highly utilized by commercial vehicle operators. This might be explained by the fact that compared to the loading zones on Allen Street and Porter Road, the new loading zone is longer, more visible, and more easily accessed by larger vehicles. The shorter time limit could also encourage faster turnover, increasing the chances that commercial vehicles will find adequate space to maneuver, load, and unload.
Figure 4
Parking Activity Before and After Curb Use Redesign
Source: Central Transportation Planning Staff.
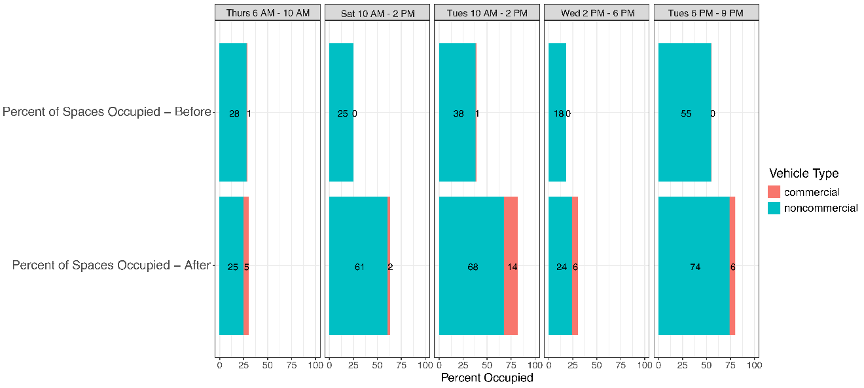
The results in the previous section suggest that when the amount of available parking space decreased, so did the observed number of occupied spaces. The next step was to examine whether the remaining parking spaces were experiencing higher rates of occupancy than before the intervention, especially the two-hour parking spaces, which were most affected in the redesign. The analysis in this section explores this question.
Figure 5 presents the ratio of two-hour parking occupied by vehicles before and after the redesign. The data show an increase in occupancy of the remaining two-hour spaces in every shift, suggesting that the intervention led to a more efficient use of two-hour parking supply. Though the redesign reduced the number of metered spaces, at least one of the six spaces was typically vacant during the data collection. On each occasion when all of the spaces were occupied, there were 30-minute spots available as well as loading zone areas for those needing to park for a brief period of time.
Figure 5
Percent Occupancy of Two-Hour Parking Spaces
Before and After Curb Use Redesign
Source: Central Transportation Planning Staff.
Visitors can also access the area via the MBTA’s Red Line and the Fitchburg commuter rail line via Porter Square Station, three bus routes, or a buffered bike lane, and there is also a 300-space parking lot at the Porter Square Shopping Center for Porter Square visitors, all within a one-minute walk from the study area. Considering the many options available to visitors for access to the study area, it seems unlikely that the loss of 12 curb spaces would deter a significant number of people from visiting. Overall, these results suggest that the redesign represents an exchange for improved safety for bicycle travelers in the area with little to no loss in convenience to a small number of vehicle travelers.
Another area of interest was the effect the redesign had on the amount of time vehicles spent in the study area, including parking activity in zones where vehicle parking is prohibited such as bike lanes, bus stops, and no parking zones. These data are presented in Figures 6 and 7. Figure 6 shows the average duration in hours before the redesign by curb use and vehicle type. Figure 7 shows the same data after the redesign.
These results show a pattern in which vehicles were parked in spots for longer amounts of time after the redesign compared to before, especially in the two-hour parking spaces. A possible explanation for these results is that before the redesign, vehicles making shorter trips and longer trips both occupied two-hour parking spaces. After the redesign, vehicles making shorter trips began using the 30-minute loading zone while those on longer trips continued using two-hour spaces. However, as with the other analyses, these results are based on a limited sample size. More extensive data should be collected before making a definitive observation about the redesign’s effect on parking duration.
Figure 6
Average Parking Time by Curb Use and Vehicle Type:
Before Curb Use Redesign
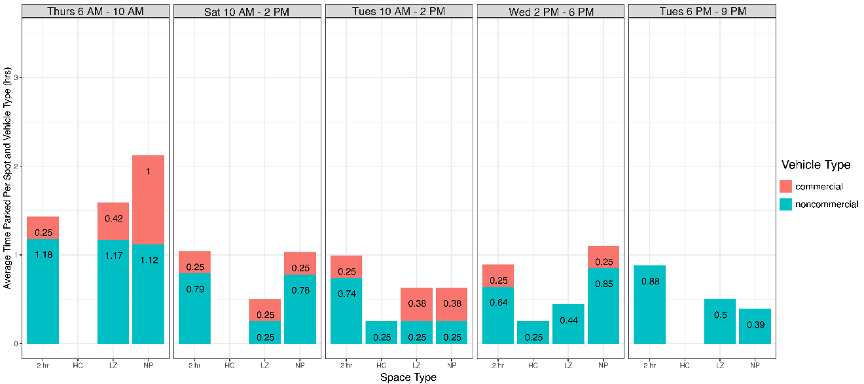
Notes: 2 hr = 2-hour metered parking. 30 min = 30-minute loading zone. HC = accessible parking for people with disabilities. LZ = loading zone. NP = no parking.
Source: Central Transportation Planning Staff.
Figure 7
Average Parking Time by Curb Use and Vehicle Type:
After Curb Use Redesign
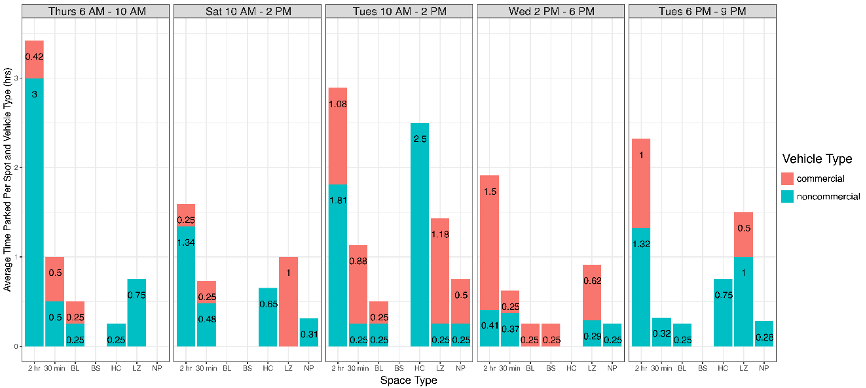
Notes: 2 hr = 2-hour metered parking. 30 min = 30-minute loading zone. BL = bike lane. BS = bus stop. HC = accessible parking for people with disabilities. LZ = loading zone. NP = no parking.
Source: Central Transportation Planning Staff.
The redesign changed the number of metered parking spots in the study area. Because of this, we also wanted to explore if there was a change in the number of authorized parked vehicles. In this study, authorized parking was defined as any vehicle that is observed parking within the designated time limit and in a zone where vehicle parking is allowed. The results of this analysis are shown in Table 4. Our data sample showed that changes to the percent of authorized parking were mixed; during some shifts an increase was observed, while a decline was observed on other shifts. Across all shifts, the percent of parking that was authorized decreased slightly, suggesting that the elimination of parking spaces did not lead to any large changes in the rate of unauthorized parking activity.
Table 4
Authorized Commercial and Noncommercial Parking Activity
Before and After Curb Use Change
Shift Day |
Shift Time |
Total Authorized Parking Before |
Total Authorized Parking After |
Percent Authorized Before |
Percent Authorized After |
Thursday |
6:00 AM–10:00 AM |
97 |
41 |
72.9 % |
78.8 % |
Saturday |
10:00 AM–2:00 PM |
71 |
81 |
67 % |
75 % |
Tuesday |
10:00 AM–2:00 PM |
117 |
98 |
87.3 % |
65.3 % |
Wednesday |
2:00 PM–6:00 PM |
61 |
60 |
72.6 % |
84.5 % |
Tuesday |
6:00 PM–9:00 PM |
136 |
79 |
84.5 % |
80.6 % |
Source: Central Transportation Planning Staff.
One of the important aspects of the redesign was the creation of the 30-minute loading zone, improving the area’s ability to accommodate commercial vehicles. For a final analysis, we wanted to see if the data indicated any change in the amount authorized parking activity for commercial vehicles. As shown in Table 5, the data suggests that the redesign of the curb not only led to an increase in commercial parking, but also the share of that parking that was authorized.
Table 5
Authorized Commercial Parking Activity
Before and After Curb Use Change
Shift Day |
Shift Time |
Total Authorized Parking Before |
Total Authorized Parking After |
Percent Authorized Before |
Percent Authorized After |
Thursday |
6:00 AM–10:00 AM |
5 |
7 |
45.5 % |
87.5 % |
Saturday |
10:00 AM–2:00 PM |
2 |
6 |
66.7 % |
75 % |
Tuesday |
10:00 AM–2:00 PM |
6 |
30 |
54.5 % |
51.7 % |
Wednesday |
2:00 PM–6:00 PM |
1 |
10 |
50 % |
71.4 % |
Tuesday |
6:00 PM–9:00 PM |
0 |
6 |
N/A |
100 % |
Source: Central Transportation Planning Staff.
The Porter Square Safety Improvement Project case study opened the door for a fascinating case study. The data collected by CTPS allowed for a wide range of analyses that explored the possible impacts of the redesign on curb usage in this high activity area. These analyses examined the total occupied spaces and number of unique vehicles found in the study area before and after the redesign and sought to answer questions about the occupancy rates of parking spots, the parking duration of people visiting Porter Square, and whether there was a change in the amount of that parking activity was authorized. The details in our data set allowed us to dive deeper into trends based on the types of vehicles present, the time of day or day of the week, and the type of parking spots. While more data should be collected before making strong claims, the results of this case study suggest that the Porter Square redesign led to a more efficient use of remaining curb space for vehicle activity while promoting the area's accessibility for people traveling by bicycle.
For the past several years, Moody Street in Waltham has been closed to vehicular traffic from May 1 to October 31. This pedestrianization, or the limiting of roadway space to pedestrians, first occurred in 2020 as a response to the COVID-19 pandemic and is intended to provide more space for safer outdoor dining and support local businesses.
The Moody Street case study represents a significant change to the use of curb space. About 100 curbside parking spaces were replaced with at least 17 outdoor dining installations. Figures 8 and 9 present maps that show these changes and the restaurants participating in the outdoor dining program. These changes have had an impact on parking activity and capacity in the area. In order to understand this impact, CTPS conducted a curb usage case study in 2022 by collecting data on parking utilization before and after the closure of Moody Street to vehicles, as well as utilization data on outdoor dining installations.
Through this case study, CTPS sought to develop methods that address the following research questions regarding the closure of Moody Street to vehicle traffic and the partial replacement of curb space with parklets or dining installations:
This study provides a deeper understanding of the impact of the Moody Street intervention on parking activity and capacity and how this change has affected the use of public space in the area.
Figure 8
Moody Street Vehicular Traffic Closure, Businesses and Parking Locations
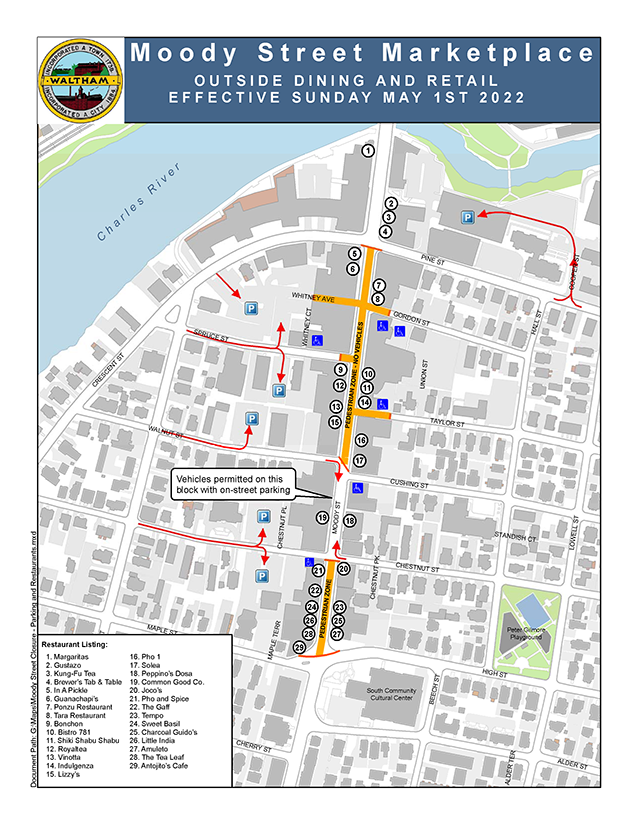
Source: City of Waltham (2021).
Figure 9
Parking and Parklets Locations
Before and After the Pedestrianization of Moody Street
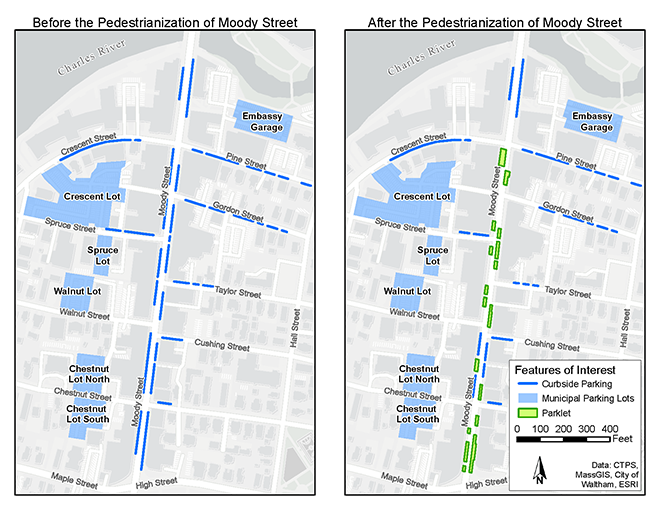
Source: Central Transportation Planning Staff.
In this case study, we collected data during nine shifts, which are shown in Table 6. During the first three shifts, parking data was collected before the closing of Moody Street to establish a baseline of parking activity. After the closing of Moody Street, we collected parking and parklet data during six shifts with comparable days and times to the baseline. The data can be organized into two categories: 1) Monday or Tuesday, representing the weekday from 10:00 AM to 6:00 PM with a one-hour gap between 1:00 PM and 2:00 PM; and 2) Saturday from 2:00 PM to 6:00 PM.
We collected parking data in one-hour intervals due to the availability of data collectors and the large size of the study area. We used a more frequent 30-minute interval for monitoring parklets. A one-hour interval for parking is not ideal for accurately calculating turnover or vehicle duration (since observations can have an error of nearly one hour), so we instead relied on vehicle occupancy and the number total unique vehicles metrics. As was the case with the Porter Square Case Study, pre- and post-pedestrianization data would ideally be collected in the same season, and more expansive data collection is needed to draw strong conclusions about the impact of the closure.
Table 6
Data-Collection Shifts in Downtown Waltham
Date (2022) |
Day |
Time |
Before/After Street Closure |
Activity |
Average Temperature (degrees) |
Collection Interval |
April 23 |
Saturday |
2:00 PM–6:00 PM |
Before |
Parking |
54 |
1 hour |
April 25 |
Monday |
2:00 PM–6:00 PM |
Before |
Parking |
50 |
1 hour |
April 26 |
Tuesday |
10:00 AM–1:00 PM |
Before |
Parking |
52 |
1 hour |
June 18 |
Saturday |
2:00 PM–6:00 PM |
After |
Parking |
66 |
1 hour |
June 21 |
Tuesday |
10:00 AM–1:00 PM |
After |
Parking |
67 |
1 hour |
June 21 |
Tuesday |
2:00 PM–6:00 PM |
After |
Parking |
68 |
1 hour |
July 9 |
Saturday |
2:00 PM–6:00 PM |
After |
Parklets |
70 |
30 minutes |
July 11 |
Monday |
2:00 PM–6:00 PM |
After |
Parklets |
84 |
30 minutes |
July 12 |
Tuesday |
10:00 AM–1:00 PM |
After |
Parklets |
86 |
30 minutes |
Source: Central Transportation Planning Staff.
The data collection process for parking data was based on the steps in MAPC’s parking study guide, summarized here (Un 2010):
Figure 10
Walking Route for Parking Data Collection in Downtown Waltham
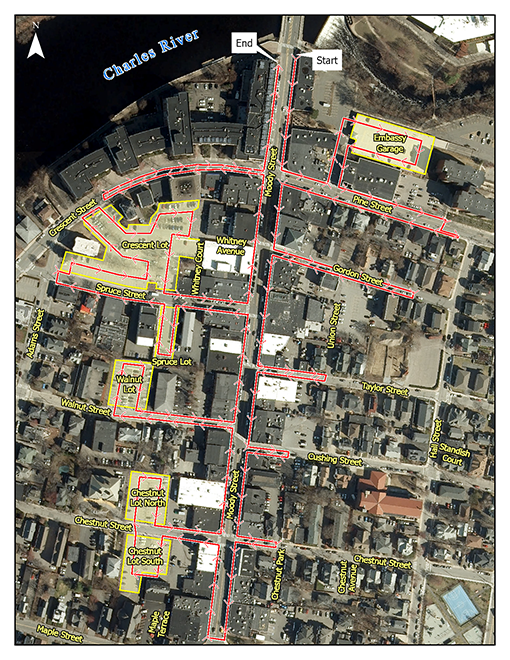
Source: Central Transportation Planning Staff.
Once the parking data-collection process was complete, the next step was to process and analyze the data by first combining all datasets into one spreadsheet following the example demonstration dataset shown in Table 7. The table contains the following data:
Table 7
Prepared Parking Dataset Demonstration
Block ID |
Space ID |
Parking Allowed |
10:00 AM–11:00 AM |
11:00 AM–12:00 PM |
12:00 PM–1:00 PM |
1 |
1 |
1 |
0 |
2AL |
2AL |
1 |
2 |
1 |
0 |
1WE |
0 |
1 |
3 |
1 |
2KX |
2KX |
0 |
1 |
4 |
0 |
0 |
0 |
0 |
2 |
1 |
0 |
0 |
6BT |
0 |
2 |
2 |
1 |
KKR |
KKR |
1CR |
Source: Central Transportation Planning Staff.
Some basic analysis was performed on the data with little processing and simple math. Table 8 is an example that shows how the data was used for a vehicle-occupancy analysis. To prepare the data for this analysis, we replaced all vehicle license plate values with a “1.” To conduct an analysis of the number of unique vehicles, we replaced license plate values with a “1” only when a vehicle was seen for the first time. Finally, since we were only concerned with authorized parking in this case study, we removed any rows with “0” values in the “Parking Allowed” column.
Using the data, prepared as demonstrated in Table 8, we performed a simple parking-utilization analysis by totaling the numbers in each column. In this example, the sum of the “Parking Allowed” column shows that there are four spaces in the study area and that two vehicles parked there between 10:00 AM and 11:00 AM, resulting in a 50 percent utilization.
Parking data in this form are flexible, enabling the exploration of a variety of additional questions. For example, we can determine the average utilization over time by finding the average sum of each column, limit the analysis to a specific block, or keep only “Parking Allowed” equal to “0” to analyze unauthorized parking activity.
Table 8
Demonstration of Simple Occupancy Analysis of Parking Dataset
Block ID |
Space ID |
Parking Allowed |
10:00 AM–11:00 AM |
11:00 AM–12:00 PM |
12:00 PM–1:00 PM |
1 |
1 |
1 |
0 |
1 |
1 |
1 |
2 |
1 |
0 |
1 |
0 |
1 |
3 |
1 |
1 |
1 |
0 |
2 |
2 |
1 |
1 |
1 |
1 |
|
Totals: |
4 Spaces |
2 Vehicles |
4 Vehicles |
2 Vehicles |
|
Utilization: |
N/A |
50 % |
100 % |
50 % |
Source: Central Transportation Planning Staff.
In this case study, CTPS developed a method to measure activity in the outdoor dining installations on Moody Street. This method not only measures the number of people visiting each parklet, but also estimates the number of unique visitors to the parklet. The steps for collecting and analyzing parklet data are summarized as follows:
Figure 11 details an example of how to estimate the number of unique visitors in each parklet. The map on the left represents a count of parklet visitors at 10:00 AM and the map on the right is a count at 10:30 AM. Notice that both maps contain a “1” at the bottom of the Lizzy’s parklet and the pair of “2”s in the bottom half of the parklet outside the Solea restaurant. While it is possible that these are new visitors it is likely that they are the same party represented on both maps, so we can subtract them from the number of unique visitors to their respective parklet.
Figure 11
Example of Data Collection Maps of Parklet Activity
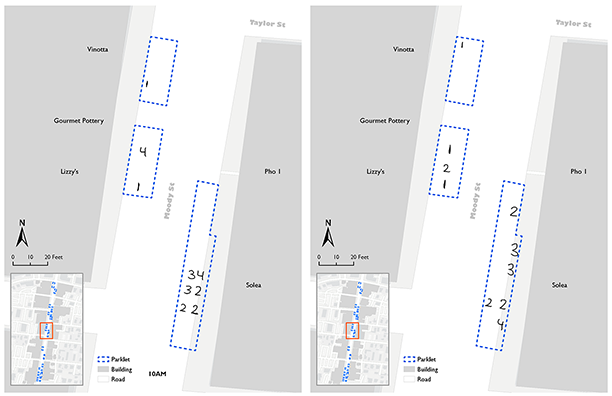
Notes: Numbers represent the number of people sitting at tables and their approximate location.
Source: Central Transportation Planning Staff.
While the previous analyses for this case study explored the intervention’s impacts on the number of vehicles present in the study area, it is also important to understand how it impacts the number of people visiting the area. Thus, we wanted to calculate how many unique people use an area of curb space per unit of time, a measure of curb productivity. For this study, we used an hour as the unit of time. By calculating this metric both before and after a curb change, we can determine the effectiveness of a curb change intervention.
For example, to calculate the number of unique visitors per hour of an area with a mix of parking spaces and parklets, we count that 50 vehicles use the parking spaces per hour and 50 people use the parklets per hour. We then convert the vehicles value to number of people by multiplying the 50 vehicles by the average number of people each vehicle trip carries. This value is 1.67 people per vehicle trip as described by the National Household Travel Survey (FHWA 2018). The result is 83.5 people per hour. Next, we combine vehicle and parklet usage to get the number of people using the curb space throughout the area per hour, which in this example equals 133.5.
The pedestrianization of Moody Street reduced the available parking supply in the study area by approximately 12 percent, from 854 to 768 spaces, by eliminating approximately 100 of the 185 parking spaces on Moody Street. We wanted to examine this intervention’s impact on parking utilization in the study area and explore whether there were instances of supply exceeding demand. The results of these analyses can indicate whether the change is successful, or if it discourages pedestrian activity on Moody Street.
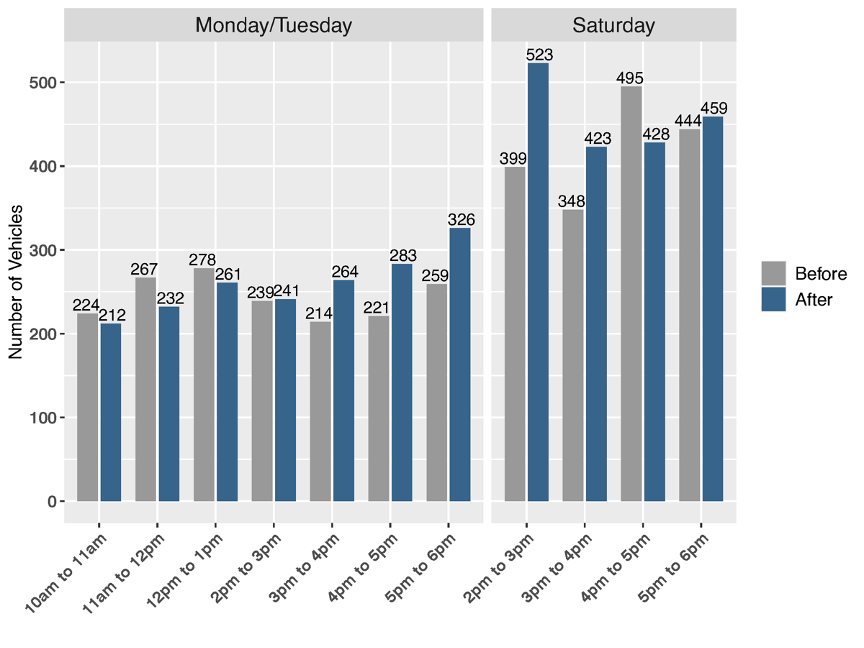
The data collected for this case study allowed us to examine the changes in parking activity at a fine granularity. Figure 12 presents the total number of vehicles observed in the study area before and after the pedestrianization of Moody Street, split up by the time of day in hour-long increments. Despite the small sample size, the results of this analysis can encourage discussion about the effects of the intervention on activity in the study area. For example, after the intervention, we observed a pattern of eight percent fewer vehicles between 10:00 AM and 1:00 PM on Mondays and Tuesdays. The reason for this pattern is not immediately clear, but one possible explanation is that the closure of Moody Street to vehicle traffic may have reduced the convenience of visiting downtown for midday trips (e.g., lunch, personal care, medical services, and shopping), while increasing the attractiveness of visiting downtown for evening trips that may include outdoor dining.
The reverse is true between 3:00 PM and 6:00 PM, which coincides with the evening peak travel period, when Moody Street is likely to experience the greatest amount of vehicle traffic. After the intervention, there were 26 percent more vehicles during this time period. These results could suggest that the intervention increased the attractiveness of Moody Street as an after-work destination to eat, drink, and socialize. Perhaps, the lack of vehicle traffic turned Moody Street into a refuge allowing visitors to avoid the noise and stress caused by evening congestion. As with the previous case study, further data collection and analysis should be conducted before making any strong claims.
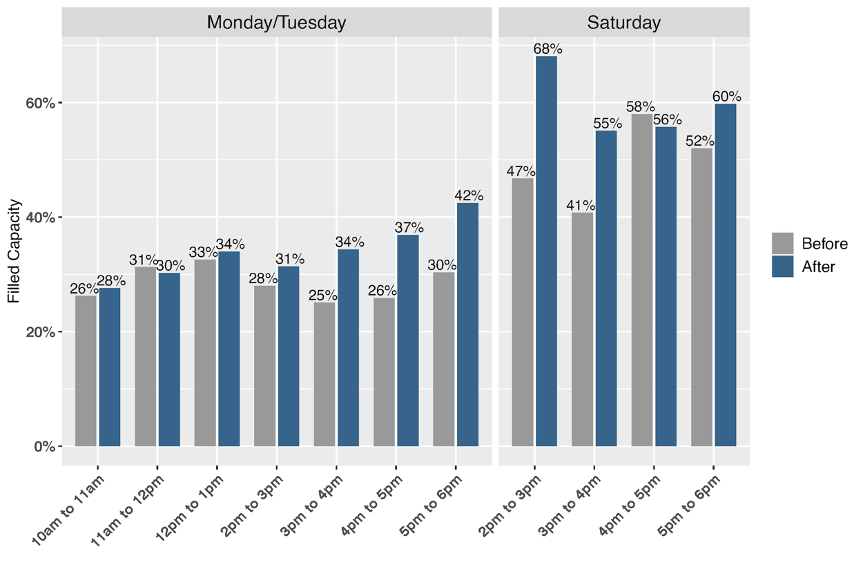
In addition to the raw values of parked vehicles, it was also important to examine the change in the occupancy percentage of available parking by time of day, to see if the reduction in parking supply led to demand that exceeded the capacity of the study area. These results are presented in Figure 13. They show that even if the number of total vehicles decreased, there were instances when the utilization of the spaces increased but never exceeded the capacity.
Figure 12
Total Vehicles in Moody Street Study Area by Time and Day
Source: Central Transportation Planning Staff.
Figure 13
Total Parking Utilization in Moody Street Study Area by Time and Day
Source: Central Transportation Planning Staff.
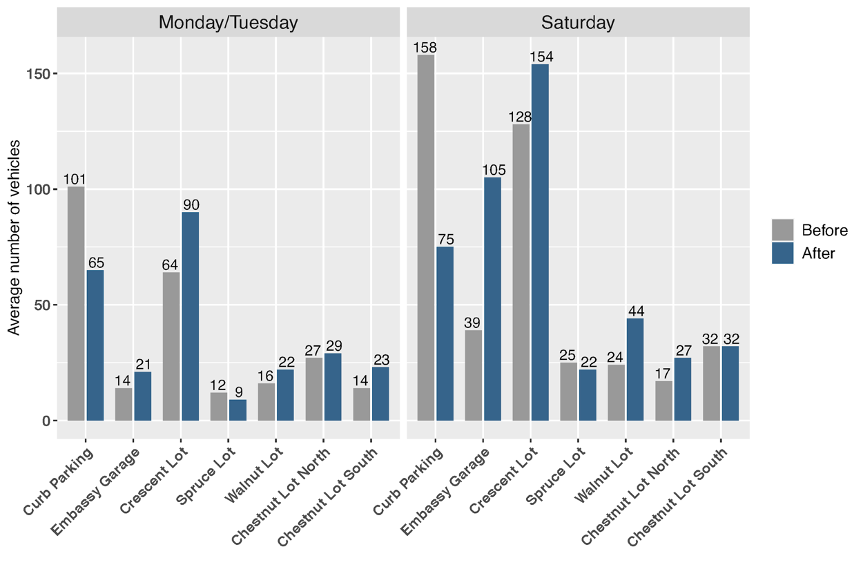
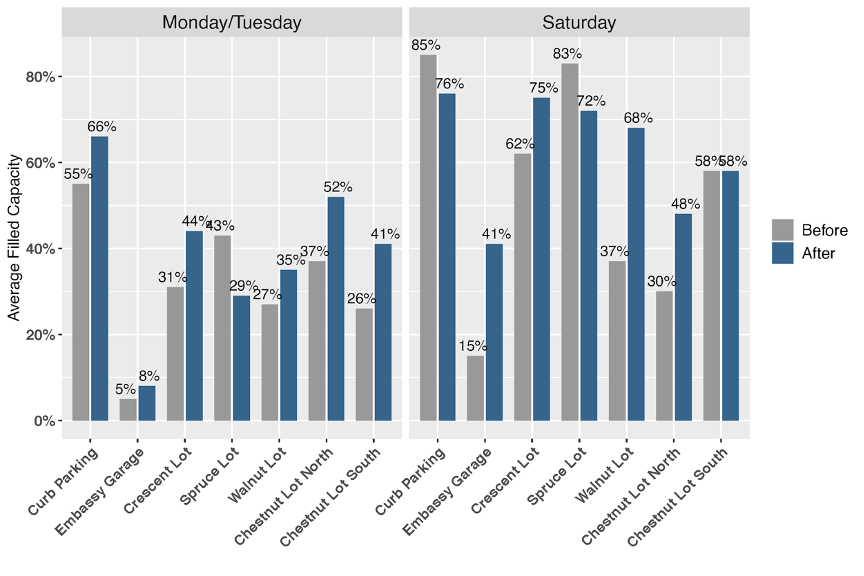
Unlike the previous case study, the data collected for this case study included parking counts for the lots and garages surrounding the main area of interest. With this information, we were able to explore how activity patterns changed in these neighboring lots when parking access to Moody Street was eliminated. Figure 14 presents the average number of vehicles in the study area by location on Monday/Tuesday and Saturday both before and after the intervention. Additionally, Figure 15 presents the same data as a percentage of total parking capacity at each location. In both charts, "Curb Parking" represents all curbside parking in the study area. These preliminary findings reveal a pattern: on both Monday/Tuesday and Saturday the pedestrianization of Moody Street led to a movement of vehicles from curbside parking into nearby off-street municipal lots and garages.
Figure 14
Average Number of Vehicles in Study Area by Location and Day
Source: Central Transportation Planning Staff.
Figure 15
Average Parking Utilization in Study Area by Location and Day
Source: Central Transportation Planning Staff.
On Monday/Tuesday, the majority of vehicles move into the Crescent Lot in the northern portion of the study area. This pattern, seen in the results by time of day, suggests that midday trips on weekdays are concentrated in the northern half of the study area. People making these trips, as previously discussed, are the least likely to benefit from outdoor dining and may be inconvenienced from having to park farther away from their destination. However, the results show that this potential inconvenience is not enough to reduce the number of trips to the study area, as the decline in curbside parking was more than offset by the number of additional vehicles in the municipal lots.
Finally, observations described in Figure 15, which shows the average parking utilization for each location by capacity, reveal that there is enough parking space in every off-street lot to absorb the additional demand from the decline in curbside parking capacity. The data suggest that the Embassy Garage may be acting as overflow capacity, since curb parking along with the nearby Crescent and Spruce lots are nearing capacity with average utilization across these locations at 74 percent. However, it is important to emphasize that even with the relatively greater demand on Saturday, there is still plenty of capacity in the Embassy Garage, as the average utilization only reached 41 percent after the intervention.
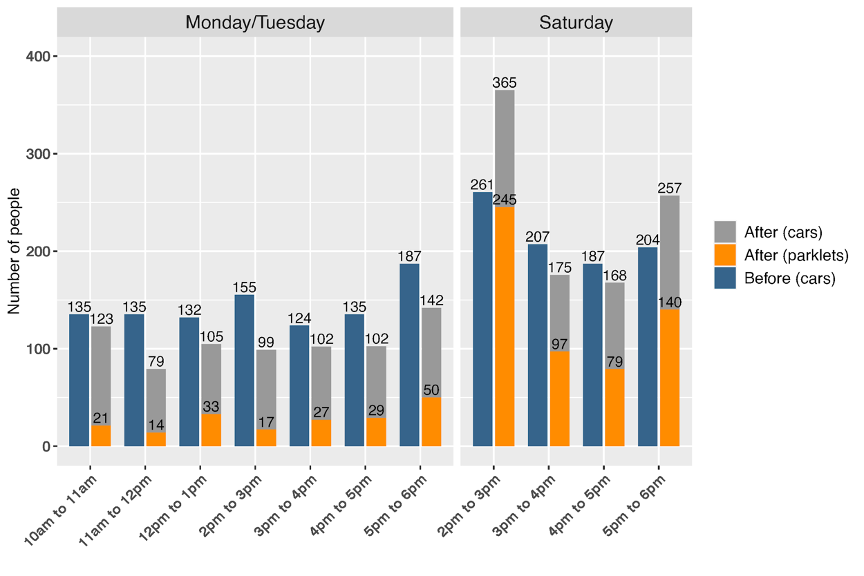
This section presents the analysis of the impact of closing Moody Street to vehicles in terms of the hourly number of unique people using the curb space. These results are shown in Figures 16 and 18. Figure 16 displays the hourly number of unique people using the curb space (both people in vehicles and people using the parklets) by time of day across the entire study area. Figure 18 displays the results for specific locations (or blocks) shown on the map in Figure 17.
Since one of the goals of pedestrianizing Moody Street is to encourage activity in the parklets, it was interesting to get a sense of the usage rates at different times of day. As shown in Figure 16, the data suggest that the hourly rate of visitors throughout the entire study area on Mondays and Tuesdays was consistently lower following the closure of Moody Street to vehicles, but on Saturday, we observed overall greater numbers of people visiting per hour than before and substantially more parklet usage than during the week. These data also suggest that the popularity of parklets varies significantly depending on the time and the day of the week. Popularity peaks on weekend mornings and evenings.
Figure 16
Number of Unique People Using Curb Space in the Moody Street Study Area by Time and Day
Source: Central Transportation Planning Staff.
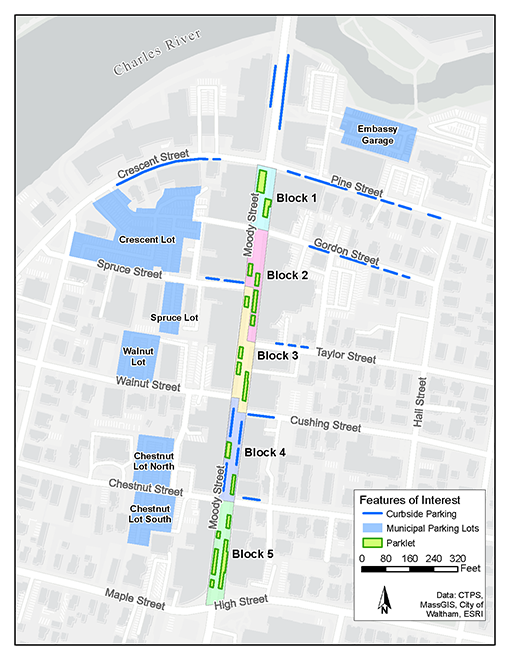
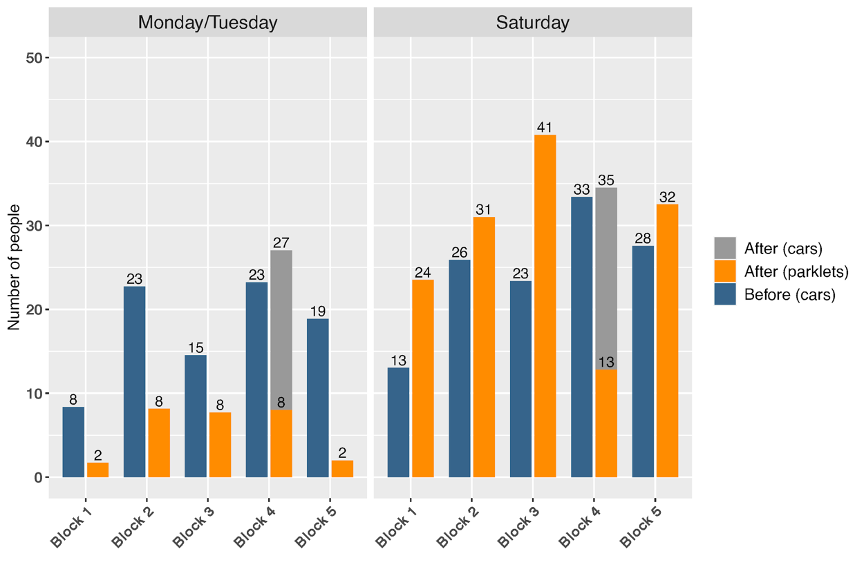
As with the parking utilization analyses, we wanted to explore the change in the number of unique users of curb space by location as well as by time of day. Instead of breaking the area up by type of parking, we split Moody Street into five segments, or blocks, and measured the changes at each one. Figure 17 is a map that shows the boundaries of these segments. The only block that retained some curbside parking after the pedestrianization of Moody Street was Block 4; the others only have parklets. Parklet projects typically replace immediate and adjacent curb parking around the installations and rarely involve eliminating all curb parking along an entire city block. This makes Block 4 an interesting micro case study since, unlike the rest of Moody Street, much of the curbside parking remained after the intervention, allowing vehicles to park in 18 of the original 25 spaces on the block.
Figure 18 presents the curb space usage data by location and compares all-day average changes in hourly usage between the blocks on Moody Street. Overall, these data follow patterns established by the time-of-day analysis where the Monday and Tuesday data exhibited declines in hourly usage while the Saturday data showed increases. The only exception to this pattern was Block 4, which experienced an increase in curb space usage per hour on Mondays and Tuesdays. While allowing vehicles into Block 4 reduces the safety, noise, and comfort benefits enjoyed by the rest of Moody Street, it also boosts the usage of the block’s curb space.
Figure 17
Parking and Parklet Locations after Intervention
Source: Central Transportation Planning Staff.
Figure 18
Average Number of Unique People Using Curb Space
Source: Central Transportation Planning Staff.
In conclusion, this study on the pedestrianization of Moody Street in Waltham led to interesting analyses about the effects of this type of intervention on parking activity. We were able to explore how removing access to curbside parking spots changed how people occupy the remaining spaces and utilize parking in nearby municipal lots. The introduction of parklets to allow for outdoor dining presents visitors with a new way to interact with the space and, according to our analyses, had a minimal impact on parking activity and capacity in the area. Despite a 12 percent reduction in parking supply, there were no instances where parking demand exceeded supply in the project area. Interestingly, while much of the convenient curb parking along Moody Street was eliminated, thereby requiring most visitors to park in nearby lots and walk farther to their destination, the total number of vehicles observed in the study area increased.
The preliminary results of this case study indicate that the project traded previously empty parking spaces in municipal parking lots for a safe, quiet, and pleasant outdoor social space that benefits both visitors and local businesses. Waltham created a popular, safer, and enjoyable public space for the community while supporting local businesses and without negatively impacting parking availability in the area.
Across the two case studies, many analyses were conducted to explore various metrics assessing curb management strategies. The focus of the work on these strategies is to provide planners with tools that they can adapt to analyze the effectiveness of their own projects.
Both case studies involved an exploration of how the number of vehicles parked in the study area changed after the interventions were implemented. In the Porter Square study, this change was presented as both a change in the total number of occupied spots and as the number of unique vehicles present. Additionally, since one important aspect of the project was the introduction of a new loading zone, we also sorted the data to compare the activity of commercial and noncommercial vehicles. The Moody Street study included an analysis of the parking activity by time of day and, because we had parking counts of surrounding lots, we also looked at the change in parking by location.
Both case studies also examined the percentage of the available parking spaces that were occupied by vehicles. The Moody Street case study made the same time and location distinctions as with the change in parking activity analyses. In the Porter Square study, we decided to look specifically at the two-hour parking spaces, since those were the space types that were most affected by the redesign.
Two metrics that were unique to the Porter Square case study were the change in parking duration and change in unauthorized parking. In this study, authorized parking was defined as any vehicle that is observed parking within the designated time limit and in a zone where vehicle parking is allowed. Since the redesign involved both the loss of parking spaces and the transformation of curb space to different types of parking, these analyses are intended to help us paint a fuller picture of how drivers were interacting with the space.
The hourly curb space usage analyses were unique to the Moody Street case study. We were not only examining the change in the number of people parking, but also the activity of those visiting the new parklets in the study area. As a result, we developed a method to estimate how many unique visitors came to the study area by combining these two populations.
Planners seeking to conduct a curb study in their municipality should refer to Managing Curb Space in the Boston Region: A Guidebook and consider the following lessons learned before and during the study process:
This pair of case studies demonstrates to planners and municipal officials in the Boston region how a small team with limited resources can measure the effects of curb use changes in their municipality. Both studies evaluated curb space changes by exploring different methods for conducting parking studies. In Cambridge, CTPS studied the impact of a curbside parking redesign by evaluating commercial and noncommercial vehicle activity, parking spot occupancy, parking duration, and instances of unauthorized parking. In Waltham, CTPS expanded standard parking study methods to include parklet activity and hourly curb usage to measure the effects of pedestrianizing portions of Moody Street and replacing curb parking with parklets. While there were limitations for both of these studies, including the amount of data collected and the ability to explore how these curb management strategies interact with the broader communities in which they are situated, CTPS was able to explore many data collection and analysis methods and make recommendations to planners who would like to conduct similar studies for their municipalities in the future.
Acton, Blake, Paul Christner, Emily Domanico, Meghan O’Connor, and Kim Delauri. 2021. “Managing Curb Space in the Boston Region: A Guidebook.” Boston Region Metropolitan Planning Organization (MPO). https://www.bostonmpo.org/managing-curb-space.
City of Cambridge. 2022a. “Porter Square Safety Improvements.” City of Cambridge. https://www.cambridgema.gov/-/media/Files/Traffic/2022/portersquare/portersquarepamphlet427.pdf.
———. 2022b. “Porter Square Safety Improvement Project.” presented at the Community Meeting Roseland St to Beech St, Virtual, April 26. https://www.cambridgema.gov/-/media/Files/Traffic/2022/portersquare/thirdporterpresentationforposting.pdf.
———. 2022c. “MassAve_Redesign_ai_6_6_2022.” City of Cambridge. https://www.cambridgema.gov/-/media/Images/Traffic/2022projects/portersquare/massave_design_ai_6_6_2022.jpg.
City of Waltham. 2021. “Support Our Downtown Small Businesses - Moody Street Will Be Open for Outdoor Dining & Retail from May 1st through October 31st!” City of Waltham. https://www.city.waltham.ma.us/home/news/support-our-downtown-small-businesses-moody-street-will-be-open-for-outdoor-dining-retail.
Un, Kit. 2010. “How to Do a Parking Study.” Metropolitan Area Planning Council (MAPC). https://www.mapc.org/resource-library/how-to-do-a-parking-study/.
Urban Freight Lab. 2020. “Method Overview and Step-by-Step Process to Conduct a Curb Occupancy Study.” Urban Freight Lab. https://depts.washington.edu/toolkit/sites/default/files/toolkit_resource_files/CurbOccupanyMethodOverview.pdf.