
Appendix A: Other Boston Region Transportation Planning Studies
Appendix B: Public Participation and Response to Public Comments
Appendix C: Universe of Proposed New Studies for Federal Fiscal Year 2024 UPWP
Appendix D: Geographic Distribution of UPWP Studies and Technical Analysis
Appendix E: Regulatory and Policy Framework
Appendix F: Boston Reigon Metropolitan Planning Organization Membership
This appendix consists of transportation studies and technical analysis work that MPO staff will conduct to support the work of various transportation agencies in the Boston Region Metropolitan Planning Organization (MPO) area, as well as brief descriptions of planning studies that will be conducted in the Boston Region MPO area by individual agencies, such as the Massachusetts Department of Transportation (MassDOT) and the Massachusetts Bay Transportation Authority (MBTA), during federal fiscal year (FFY) 2024. This appendix is divided into two sections. The first describes contract-based work that MPO staff will undertake to support the planning work of other agencies, while the second describes studies supported by federal planning (but not MPO) funds and/or studies that MPO and partner agency staff have determined to be of regional significance.
The project listings in Section 1 are organized by funding agency and include studies and technical analyses for MassDOT, the MBTA, and other agencies in the Boston region. The project listings in Section 2 indicate whether components of the projects will be conducted by CTPS, and are organized hierarchically: first by type of study, then by geography, then by the entity organizing or leading the study effort.
The transportation studies and technical analysis work described in this section will be conducted to support the work of various transportation agencies in the Boston Region Metropolitan Planning Organization (MPO) area.
Some of the contracts described in this section are issued to the Central Transportation Planning Staff (CTPS) every year and generally coincide with either the federal fiscal year (FFY) or the state fiscal year (SFY). Examples include MassDOT PL and MassDOT Statewide Planning and Research (SPR) contracts. Other contracts are issued for tasks and technical support to be conducted over a multiyear period, and they might be renewed with the agencies after several years. A third contract type covers the work for discrete studies or technical analyses intended to be completed within a specified timeframe. These may either be one-time contracts in which CTPS conducts analysis or technical support to further a specific agency project, such as MassDOT’s Interstate 90 (I-90) Allston Multimodal Modeling Support project, or they can be contracts in which CTPS provides technical support to an agency for data collection and analysis that is undertaken annually, such as the MBTA National Transit Database (NTD): Data Collection and Analysis contract.
The work conducted on behalf of the agencies includes data collection and analyses covering a broad range of topics, including travel demand modeling, air quality, traffic engineering, Title VI, and environmental justice. The products of this work are vital to support compliance with federal and state regulations such as the Massachusetts Environmental Policy Act (MEPA) and Title VI of the Civil Rights Act of 1964. CTPS also enhances regional understanding of critical transportation issues through the preparation of graphics, maps, and other materials for agency studies and presentations. The work described in this section is organized by agency and includes studies and technical analyses for MassDOT, the MBTA, and other agencies in the Boston region.
Table A-1
Unified Planning Work Program Budget—New and Continuing Agency Transportation Planning Studies and Technical Analyses for FFY 2024
| Project ID | Name | Total Contract | Funding Source |
| Varies by project | MassDOT SPR Program Support | $500,000 | SPR |
| 13155 | MassDOT Title VI Program | $95,000 | MassDOT |
| Varies by project | MassDOT-Directed Planning Assistancea | n/a | MassDOT 3C PL |
| TBD | Allston | $400,000 | MassDOT |
| TBD | McCormack | $60,000 | MassDOT |
| MassDOT Projects | blank | $995,000 | blank |
| 11415 | AFC 2.0 Equity Analysis | $76,972 | MBTA |
| 11497 | MBTA 2023 Triennial Title VI Report | $145,800 | MBTA |
| 11429 | MBTA 2022 Title VI Program Monitoring | $79,700 | MBTA |
| 11496 | MBTA Mapping Support | $18,000 | MBTA |
| 11500 | MBTA Map and Signage Support to Bus Network Redesign | $31,755 | MBTA |
| 14376 | MBTA Rider Oversight Committee Support IV | $31,342 | MBTA |
| 14374 | MBTA SFY 2022 National Transit Database (NTD) Support | $127,288 | MBTA |
| 14375 | MBTA SFY 2023 National Transit Database (NTD) Support | $165,145 | MBTA |
| TBD | MBTA North Shore Busway | $108,819 | MBTA |
| TBD | MBTA Bus Tool Ongoing Support | $60,000 | MBTA |
| 14378 | MBTA SFY 2024 National Transit Database (NTD) Support | MBTA | |
| 11422 | MBTA Transit Service Data Collection X | $540,000 | MBTA |
| 11430 | MBTA Transit Service Data Collection XI | $590,000 | MBTA |
| 14358 | Service Equity Analysis Support to the MBTA | $115,000 | MBTA |
| MBTA Projects | blank | $2,098,821 | blank |
| blank | Other (SS4A, Municipalities, etc.) | $95,000 | Other |
| Other Projects | blank | $95,000 | blank |
| Agency-Funded and Client-Funded Subtotal | blank | $3,239,821 | blank |
The contracts and technical analyses in this section are being undertaken for MassDOT.
Project ID Number |
Varies |
Funding Source |
MassDOT SPR |
FFY 2024 Total Budget |
$490,000 |
CTPS provides support to MassDOT’s SPR program as requested. These contracts will include multiple individual projects or tasks throughout the federal fiscal year.
CTPS will conduct studies and analyses and provide technical assistance upon request. Two projects that are either underway or expected to begin in FFY 2024 are the Roadway Inventory and Related Support Maintenance and the Statewide Model Assistance Project. Other projects may be added throughout FFY 2024.
Activities and work products will depend on tasks requested by MassDOT’s Office of Transportation Planning.
Project ID Number |
13155 |
Funding Source |
MassDOT Other |
Total Contract Amount |
$95,000 |
FFY 2024 Total Budget |
$10,000 |
Under this contract, CTPS will continue to provide technical support to MassDOT for developing and implementing its Title VI Program for both the Federal Highway Administration (FHWA) and the Federal Transit Administration (FTA).
MassDOT, as a recipient of federal funds from both FHWA and the FTA, is required to comply with Title VI of the Civil Rights Act of 1964, and with protections enacted through several other laws and executive orders that prohibit discrimination based on gender, age, income, and disability. Through this technical support work, CTPS will assist MassDOT in complying with these nondiscrimination laws.
Staff will provide technical support to MassDOT as described above.
Project ID Number |
Varies |
Funding Source |
MassDOT-Direct PL |
FFY 2024 Total Budget |
$359,326 |
CTPS will provide transit-planning assistance to MassDOT and the MBTA by conducting various studies under MassDOT’s FHWA-funded PL Program. This task will include multiple individual projects or tasks throughout the federal fiscal year.
In FFY 2024, CTPS will continue to assist the MBTA with the MBTA Sources of Community Value study. The focus of this study is to identify, quantify, and propose mechanisms to accrue incremental sources of value and revenue for the MBTA outside of the existing developer mitigation framework. The results of the study would inform state leadership about funding options to support transit. Other projects may be added throughout FFY 2024 to support transit-related research, planning, data collection, and analysis.
For the MBTA Sources of Community Value Study, staff will provide estimates of revenues and other value from potential sources of revenue and a technical memo documenting study findings. Additional activities and work products will depend on tasks requested by MassDOT and the MBTA.
Project ID Number |
13809 |
Funding Source |
MassDOT |
Total Contract |
$200,000 |
FFY 2024 Total Budget |
$100,000 |
MassDOT and its project team are currently developing a Supplemental Draft Environmental Impact Report for the Allston Multimodal project. CTPS will produce travel-demand forecasts in support of this environmental filing.
CTPS will support MassDOT by using the CTPS regional travel demand model set to estimate highway volumes, transit volumes, and mode splits for opening-year (2030) and horizon-year (2040) scenarios of the Allston Multimodal project. In addition, CTPS will assist the project team with an economic impact analysis.
In FFY 2024 staff will finalize the analysis and study documentation and support the environmental filing preparation and engagement as needed.
The contracts and technical analyses in this section are being undertaken for the MBTA.
Project ID Number |
14375 (SFY 2023) 14378 (SFY 2024) |
Funding Source |
MBTA |
Total Contract* |
$584,949 |
FFY 2024 Total Budget |
$7,649 (SFY 2023) $147,340 (SFY 2024) $50,276 (SFY 2025) |
*Multiple contract years are represented.
For many years, in support of the MBTA’s NTD submittals to the FTA, CTPS has produced passenger-miles traveled and unlinked trip estimates for MBTA services. This project will develop these estimates for the following modes:
CTPS will use the following methods to collect the data on which these estimates will be based:
The MBTA will submit its SFY 2023 NTD passenger-miles traveled and unlinked trip estimates for various transit modes to the FTA with the aid of CTPS during FFY 2024. The final technical memoranda for SFY 2024 NTD will be completed in FFY 2025.
CTPS will complete the final technical memoranda and auditing process for SFY 2023 NTD reporting and will complete data collection begun in FFY 2023 for SFY 2024. Field staff will begin collecting data for SFY 2025 NTD reporting.
Project ID Number |
11497 |
Funding Source |
MBTA |
Total Contract |
$145,800 |
FFY 2024 Total Budget |
$90,700 |
Under this contract, CTPS provides the MBTA with technical assistance by collecting and analyzing MBTA service data to compare service provided to minority riders with service provided to nonminority riders. This work supports the MBTA’s compliance with Title VI requirements.
Staff will collect and analyze data on the following service indicators:
The data-collection and analysis activities will help to fulfill monitoring required as part of the MBTA’s ongoing Title VI Program. The results of the data collection efforts and analyses will be reported in a memorandum to the MBTA for internal review and follow up and will be included in the next triennial program.
CTPS will incorporate relevant demographic data from the MBTA’s 2022 passenger survey and subsequent updates where appropriate as they become available.
CTPS will provide documentation about selected service monitoring evaluations for SFY 2023 MBTA service and amenities.
Project ID Number |
11422 |
Funding Source |
MBTA |
Total Contract |
$1,130,000 |
FFY 2024 Total Budget |
$198,000 |
The work conducted under this contract will help the MBTA to assess bus and rapid transit service changes.
The MBTA requires ongoing data collection regarding its transit system to assess service changes. As part of this project, CTPS collects ridership and performance data to support future MBTA service changes. Work may also include support for improving the ridecheck database so that it will be compatible with new software and data sources. CTPS also may provide analytical assistance to the MBTA as requested.
Project ID Number |
14376 (SFY 2022–25) |
Funding Source |
MBTA |
Total Contract |
$31,342 |
FFY 2024 Total Budget |
$7,000 |
The MBTA established a Rider Oversight Committee (ROC) in 2004 to provide ongoing public input on a number of different issues, including strategies for increasing ridership, developing new fare structures, and prioritizing capital improvements. Through this contract, CTPS supports the MBTA by providing ongoing technical assistance to the ROC.
Assistance provided by CTPS has included offering insights into the MBTA’s planning processes, providing data analysis, and attending committee meetings, at which staff may respond directly to ROC members’ questions.
CTPS will continue to provide technical assistance to the MBTA ROC and attend committee and subcommittee meetings.
Project ID Number |
TBD |
Funding Source |
MBTA |
Total Contract |
$120,000 |
FFY 2024 Total Budget |
$40,000 |
CTPS will support the MBTA in conducting the required Title VI service equity analyses for major service changes that take place during the duration of this contract.
CTPS will conduct service equity analyses for MBTA major service changes. CTPS will follow the new Service and Fare Equity policy in conducting its analyses.
CTPS will incorporate relevant demographic data from the MBTA’s 2022 passenger survey and subsequent updates where appropriate as they become available.
CTPS will prepare technical memoranda documenting service equity analyses for each major service change.
Project ID Number |
11496 |
Funding Source |
MBTA |
Total Contract |
$18,000 |
FFY 2024 Total Budget |
$3,000 |
The objective of this work is to provide map-making support upon request from the MBTA. At the time of each request, CTPS will provide the MBTA with an estimate of the specific cost and schedule for completing the map(s).
CTPS will update MBTA maps, upon request from the MBTA, within the budget provided for this project.
Updated district maps to reflect changes in bus routes and bus route garage assignments. Upon request from the MBTA, CTPS staff will update other existing CTPS-created MBTA maps within the budget provided for this project.
Project ID Number |
11500 |
Funding Source |
MBTA |
Total Contract |
$25,000 |
FFY 2024 Total Budget |
$25,000 |
The objective of this work is to provide map-making support, upon request from the MBTA.
CTPS will update MBTA maps, upon request from the MBTA, within the budget provided for this project.
Updated rapid transit system, bus, and neighborhood maps to reflect changes to bus routes in accordance with the MBTA Bus Network Redesign. Upon request from the MBTA, CTPS staff will update other existing CTPS-created MBTA maps within the budget provided for this project.
Project ID Number |
22217 |
Funding Source |
MBTA |
Total Contract |
$213,000 |
FFY 2024 Total Budget |
$25,000 |
CTPS is supporting the MBTA in preparation for environmental filings for the proposed connection between the Red and Blue Lines at the Charles/MGH Station. CTPS will continue to be engaged in developing traffic and transit projections for this work in FFY 2024.
CTPS will use the Boston Region MPO’s travel demand model to analyze the traffic and transit impact of the proposed connection between the Red and Blue Lines and the closure of Bowdoin Station.
Some of the analysis for this study will be completed in FFY 2023. In FFY 2024, staff will finalize the analysis, prepare study documentation, and support the environmental filing preparation and engagement as needed.
Project ID Number |
11498 |
Funding Source |
MBTA |
Total Contract |
$108,819 |
FFY 2024 Total Budget |
$80,000 |
The MBTA has proposed a center-running bus lane facility linking Wonderland Station in Revere to Lynn (at the intersection of Broad and Chestnut Street/Atlantic Street) via North Shore Road, General Edwards Bridge, the Lynnway, and Broad Street. This bus rapid transit facility would produce a two-seat rapid-transit service between downtown Lynn and Boston.
Using the Boston Region MPO’s regional travel demand model set and other tools, CTPS will support MBTA and its project team by assessing the existing traffic conditions and travel patterns, and by providing modeling results and analyses for use in the evaluation of the proposed reconstruction scenario.
A technical memorandum summarizing the general modeling methodology and the results of the analysis will be provided to the MBTA and the project team.
Project ID Number |
11415 |
Funding Source |
MBTA |
Total Contract |
$91,972 |
FFY 2024 Total Budget |
$19,000 |
As part of the Fare Transformation initiative, the MBTA is developing a new AFC system, known as AFC 2.0, to supplant its existing fare payment system. In late 2017, the contract for the design, integration, and implementation of AFC 2.0 was awarded to Cubic | John Laing. This change in the MBTA’s fare payment system will also lead to changes that may negatively affect some riders. The MBTA has requested that CTPS analyze the equity of the impacts of the following components of AFC 2.0: elimination of cash on board, fee for specific fare media, and potential changes in fare structure.
CTPS will evaluate the distribution of fare vending machines and other fare media sales locations, the equity impacts of charging for a fare card, and a package of various fare structure changes that may be implemented with AFC 2.0. Tasks in this project include
CTPS will follow the new Service and Fare Equity policy in conducting its analyses.
CTPS will incorporate relevant demographic data from the MBTA’s 2022 passenger survey and subsequent updates where appropriate as they become available.
CTPS will produce technical memoranda documenting the equity analysis of the proposed fare structure changes, the equity analysis of the fare card fee, and the equity analysis of proposed fare sales locations.
Project ID Number |
11501 |
Funding Source |
MBTA |
Total Contract |
$95,000 |
FFY 2024 Total Budget |
$15,000 |
The MBTA requested that CTPS analyze the equity impacts of potential changes in fare structure and tariffs, including a low-income fare program and other potential changes. CTPS has provided technical assistance to the MBTA related to fare structure and tariff changes for more than 25 years, most recently in SFY 2021–23. This project will analyze equity impacts of a low-income fare program and other potential changes in the MBTA’s fare structure and tariffs.
CTPS will assess how to incorporate new 2022 MBTA passenger survey data into its agent-based model. CTPS will also update the base-year fare revenue and ridership to the most recent available and appropriate year. CTPS will use a model to analyze the potential effects of changes in fare structure, tariffs, and policy on different socioeconomic groups in accordance with the requirements of FTA Circular 4702.1B Title VI Requirements and Guidelines for FTA Recipients and the MBTA’s Service and Fare Change Equity Policy. This work will be closely related to ongoing Title VI work conducted by CTPS.
CTPS will follow the new Service and Fare Equity policy in conducting its analyses.
CTPS will produce a memorandum documenting the equity analysis of the set of proposed fare structure changes.
The contracts and technical analyses in this section are being undertaken for other agencies in the Boston region.
Project ID Number |
22222 |
Funding Source |
City of Boston City of Cambridge City of Somerville |
Total Contract |
$96,310 |
FFY 2024 Total Budget |
$18,000 |
The Cities of Boston, Somerville, and Cambridge are contracting with CTPS to examine the equity implications of potential changes to the Bluebikes fare structure including fare product changes and the impacts of adding e-bikes to the Bluebikes fleet. The Bluebikes bikeshare system currently charges riders using a pass-based or a per-ride based fee, where users pay a set cost to access the bikeshare system regardless of travel distance. Many bikeshare systems across the United States, including Washington, DC’s Capital Bikeshare, Philadelphia’s Indego, and Chicago’s Divvy, incorporate a per-minute fee structure for electric bike (e-bike) trips. This study will identify how potential fare changes could affect riders of underserved population groups, including people of color, people with low incomes, and people with limited English proficiency.
CTPS will coordinate with the Cities of Boston, Somerville, and Cambridge to analyze how potential changes to the Bluebikes fare structure and bike fleet composition will impact riders of underserved population groups. Tasks in this project include estimating demographics of riders, conducting a demographic survey, estimating fare elasticity impacts, modeling equity impacts from e-bikes, modeling fare change scenarios, developing an interactive report, and documenting results.
CTPS will produce a memorandum documenting the equity analysis of the set of fare change scenarios and an interactive report that recalculates metrics based on updated ridership inputs and potential fare price changes.
This section consists of brief descriptions of planning studies that will be conducted in the Boston Region MPO area by individual agencies, such MassDOT and the MBTA, during FFY 2024. This section describes studies supported by federal planning (but not MPO) funds, and/or studies that MPO and partner agency staff have determined to be of regional significance. The project listings in this indicate whether components of the projects will be conducted by CTPS, and are organized hierarchically: first by type of study, then by geography, then by the entity organizing or leading the study effort.
The projects in this section are not subject to the MPO’s public participation process. Rather, they follow their own public processes, parts of which may be required by the Massachusetts Environmental Policy Act. They are included here to provide a more complete picture of the surface-transportation-planning projects occurring in the region. The listings contained in this section were provided to CTPS prior to June 23, 2023.
Beyond Mobility, the Massachusetts 2050 Long-Range Transportation Plan, is a planning process that will result in a blueprint for guiding transportation decision-making and investments in Massachusetts in a way that advances MassDOT’s goals and maximizes the equity and resiliency of the transportation system. The Plan will serve as a strategic plan for MassDOT and document the most pressing transportation priorities for MassDOT to address between now and 2050, relying heavily on input from the public.
The Impact of Teleworking Study is developing plausible future scenarios for teleworking in Massachusetts and will use a modeling approach to understand the effects that teleworking changes may have on the Commonwealth’s transportation system. This study will examine how anticipated increases and/or decreases in teleworking could change household and aggregate travel behavior through measures that include overall vehicle-miles traveled, trip attributes, and mode share. The potential macroeconomics impact of these changes in travel behavior will also be analyzed. The modeled projections for each scenario could assist MassDOT in future decision-making by providing information about how the demands on the transportation system will change and how the mix of transportation investment may need to respond.
MassDOT has developed an Electric Vehicle (EV) Infrastructure Deployment Plan for Massachusetts as required by the NEVI Program. Key activities during the initial plan development process included modeling EV charging demand on highway corridors in Massachusetts, analyzing economic factors associated with direct current fast charging technology, prioritizing highway corridor segments for investment of NEVI funds, and seeking stakeholder input on key questions. The MassDOT NEVI Plan has been approved. MassDOT is now proceeding with a planning process to determine the role of MassDOT-owned sites in the NEVI network buildout and to develop a model solicitation and contracting approach for partnering with a private entity to install fast charging infrastructure on EV Alternative Fuel Corridors in Massachusetts, which may help to ease range anxiety for drivers on long-distance trips.
MassDOT’s Office of Transportation Planning is conducting a study to determine long-term multimodal transportation and safety improvements to the Newton Corner I-90: Exit 127 (formerly Exit 17) Interchange in Newton, Massachusetts, bordering Brighton and Watertown.
This conceptual planning study will examine ways to improve mobility, system reliability, safety, connectivity, equity, economic opportunity, accessibility, efficiency, and climate resiliency in the study area.
MassDOT, the Executive Office of Environmental Affairs/Department of Conservation and Recreation, and the City of Boston have partnered to conduct a multimodal transportation study, and engage a recently created legislative (Morrissey) commission dedicated to long-term comprehensive planning for Morrissey Boulevard and the surrounding area in Dorchester, Massachusetts. This effort will build on past designs for the study area and contribute to preliminary, conceptual designs to improve the public realm, mobility, connectivity, safety, and climate resiliency in the corridor. This effort will also incorporate ongoing and future developments in the area to balance these projects with the local community. The resulting transportation alternatives will be presented as part of a public involvement process.
MassDOT’s Office of Transportation Planning is conducting a study to develop a framework, methodology, and web-based tool for estimating the impacts of land use developments, including public and private developments, on the delivery and performance of transit services in Massachusetts. The deliverables from this project will inform MassDOT, MBTA, and regional transit authority decision-making and help these agencies take a more proactive approach to development mitigation.
The Program for Mass Transportation (PMT) is the MBTA’s long-range capital planning document; it defines a 25-year vision for public transportation in eastern Massachusetts. The MBTA’s enabling legislation requires the MBTA to update the PMT every five years and to implement the policies and priorities outlined in it through the annual Capital Investment Program. MassDOT’s Office of Transportation Planning will lead the process for updating the 2024 PMT.
MassDOT’s Office of Transportation Planning is conducting a study regarding opportunities to implement and improve transit priority and multimodal travel over the Gilmore Bridge in Boston and Cambridge, as well as explore the feasibility of building a new bridge between Charlestown and Cambridge to serve transit, walking, and biking trips.
The Gilmore Bridge Mobility Improvements Study will establish existing mobility and other travel conditions within the study area and evaluate short-, medium-, and long-term recommendations intended to address the needs of current and anticipated future travelers along the corridor, with a particular emphasis on providing dedicated bus lanes. In addition to exploring opportunities for transit priority measures and active transportation improvements on the Gilmore Bridge, the study will assess the feasibility of constructing a new bridge between Charlestown and Cambridge to serve transit, walking, and biking trips.
The City of Boston is progressing with the redesign of the Rutherford Avenue corridor in Charlestown, which extends approximately 1.5 miles from the North Washington Street Bridge to Sullivan Square and provides a critical connection between Everett, Somerville, suburbs north and east of Boston, and Boston’s downtown business area. Reconstruction of this corridor is currently programmed in the Transportation Improvement Program beginning in 2022. The corridor’s highway-like design is inconsistent with present-day design preferences and local circumstances, and the function and design of the Sullivan Square rotary is problematic. Pedestrian mobility is limited, and bicycle travel is not compatible with the high-speed road. The corridor is eight- to 10-lanes wide (120 to 140 feet), presenting a significant barrier between areas on either side of the roadway, such as the Bunker Hill Community College, Paul Revere Park, the Hood Business Park employment area, and MBTA rapid transit stations.
There are significant transit-oriented development opportunities along the corridor, and public investment in new infrastructure will support development of commercial and residential uses, whose tenants otherwise probably would not, or could not, locate to the area. A number of major structural elements in the corridor were constructed more than 60 years ago; they are approaching the end of their life cycle and will need to be replaced. With the Central Artery/Tunnel project now complete, more traffic remains on facilities such as Interstate 93 and US Route 1; therefore, reduced traffic volumes along Rutherford Avenue present a unique opportunity to transform the corridor’s character from a 1950s-era, automobile-oriented facility to a twenty-first century, multimodal, urban boulevard corridor that will accommodate private development.
The Climate Adaptation Vulnerability Assessment is a planning-level analysis of which transportation assets are at risk of flooding over the coming century. This study identifies flood exposure for in-state National Highway System roads, bridges, and large culverts; MassDOT- and MBTA-owned rail; MassDOT facilities; and many public-use airports. It assesses damage and repair costs, time estimates for repairs, and considers the consequences from loss of service. Specifically, this study will estimate “do nothing” costs and qualitative consequences of at-risk transportation assets under future conditions assuming no intervention. This information can be used during the capital planning process to prioritize investments that avoid or reduce long-term climatic impacts associated with flooding.
This study will develop recommendations about where and how to leverage existing facilities and resources that could contribute to the development of a shared travel network, as well as where these existing facilities could be expanded and where new facilities and assets could be introduced.
The New England University Transportation Center (Region One) is a research consortium that includes the Massachusetts Institute of Technology (lead university), Harvard University, and the state universities of Massachusetts, Connecticut, and Maine. It is funded by the US Department of Transportation’s University Transportation Centers (UTC) Program. The New England UTC conducts multiyear research programs that seek to assess and make improvements for transportation safety as well as develop a systems-level understanding of livable communities. For more information, visit the New England University Transportation Center’s website at http://utc.mit.edu/.
This appendix will be completed after the Public Comment Period.
This appendix describes the Universe of Proposed New Studies, a key step in the evolution of the federal fiscal year (FFY) Unified Planning Work Program (UPWP). The Universe documents the study concepts that the Boston Region Metropolitan Planning Organization (MPO) staff collected or suggested for the development of the FFY 2024 UPWP. Study suggestions are collected through email, a public survey, and presentations at Metropolitan Area Planning Council (MAPC) subregional committee meetings and Regional Transportation Advisory Council meetings. Each entry includes a summary of the purpose of the proposed study.
Studies in the Universe, shown in Table C-1, are organized into the following categories:
Table C-2 tracks the breakdown of studies chosen for funding in the UPWP from FFY 2017 to the present by category.
Staff and the UPWP Committee evaluate each proposed study in the Universe based on the extent to which a study concept addresses each of the six Long-Range Transportation Plan goal areas:
The process of developing a final list of studies to be funded also includes consideration of staff capacity in relevant areas and work that is occurring in other agencies to avoid redundancy.
In addition to evaluating the proposed new studies in the Universe, MPO staff define general scopes and estimated costs for the proposed studies and consider potential feasibility issues. These various factors, along with the availability of funds for new studies, were considered as staff identified a recommended set of new proposed planning studies for review by the UPWP Committee. For more information about the process of developing and evaluating the Universe, please see Chapter 2.
Table C-1
Universe of Proposed Studies for FFY 2024
| Study Information | |||||
| ID | Project Name | Project Purpose and Outcome | Estimated Budget | Source | Staff Comments |
| ACTIVE TRANSPORTATION | blank | blank | blank | blank | blank |
| A-1 | Parking in Bike Lane: Strategies for Safety and Prevention | Purpose: The purpose of this study is to address the issue of vehicles parked in bike lanes in the Boston region. This poses a safety hazard for cyclists and pedestrians and creates a need for them to switch lanes. The study aims to research successful strategies and practices employed in other cities and municipalities to address the problem and recommend strategies that can be implemented in the Boston region. Approach/Methodology: The study will begin with a comprehensive research phase that will analyze the approaches adopted by other cities (such as a New York proposal to pay people who report cars parked in bike lanes) in addressing the issue of vehicles parked in bike lanes. The research will include a review of existing policies and programs, as well as interviews with peers to better understand their approach and challenges. In addition, the study will engage with municipalities in the Boston region to understand existing policies, gather data on the problem in the region through data collection and surveys, and identify municipalities most interested in piloting the recommended approaches. The study will work with the selected municipalities to develop potential concepts and pilot the most promising one, ensuring the program is tailored to the needs of the region. Anticipated Outcome: The anticipated outcome of the study is a report that summarizes the research findings, including successful strategies employed by other cities to address the issue of parked vehicles in bike lanes, and recommendations for potential approaches that can be piloted in the Boston region. The report will also include details on the piloted program and its feasibility and effectiveness, along with recommendations for scaling the program beyond the pilot phase. |
Ilana Strauss, Staff Survey | ||
| A-2 | Separated bike/pedestrian paths are starting to come together on the north side of Boston, between the Minuteman Bikeway to the Northern Strand Trail. It would be great to see a comprehensive plan that identifies what is needed to provide safe non-motorized travel throughout as much of this region as possible, including connections with public transit stations and blue bikes. | Julie Wormser (Mystic River Watershed Association), Public Survey | |||
| A-3 | Pedestrian Safety: Inventory, survey, and assess Inner Core and Suburban roadway and street Intersection and mid-block crosswalks for existing conditions and identify pedestrian safety deficiencies/threats needing remedial actions and/or facilities. Locations of pedestrian crossings (i.e., formal and informal “desire lines”) are frequent sites of pedestrian-vehicle conflicts, crashes, and injuries/fatalities. Such problem areas persist, despite attention given to pavement markings, traffic control lights, and other measures. Sometimes the situation is an uneven implementation of Complete Street design guidance; sometimes it is due to lack of context-sensitive common sense; other times vehicle speed or curb enforcement is not applied. Other times, pedestrians themselves act irresponsibly, are distracted from awareness of surroundings. A too-frequent problem occurs in (often retail) areas with dense curbside parking available to mixed sizes and types of vehicles. The common situation is with a crosswalk (even a marked one) that permits vehicle parking too close to a pedestrian’s entry point to the crosswalk. In these cases, the view of the pedestrian to oncoming/upstream traffic is severely diminished or totally obstructed until the pedestrian is already walking perhaps 10 feet into the crosswalk, often too late for a driver to adjust. This situation is a pedestrian threat with any vehicle parked too close to the crosswalk, but is especially dangerous when a vehicle is large, such as SUVs, mini vans, delivery vans/vehicles, trucks. Consistent and enforced remedy is needed in all such (municipal) crosswalk locations. To avoid unsafe perpetuation from debate or confusion, a suggestion is there should be a universal ban on any vehicle parking within 15 feet upstream from a crosswalk, mid-block, or intersection. To rely on each of the Commonwealth’s 351 municipalities to adhere to implementing such a policy almost falls into the realm of fantasy. Once the type and degree of the problem situations are identified by CTPS, ultimately, this pedestrian safety measure would best come in the form of a statewide law from the State House. |
John McQueen, Email | |||
| LAND USE, ENVIRONMENT, AND ECONOMY | blank | blank | blank | blank | blank |
| L-1 | Opportunities for the MPO to Support TOD | This study will analyze and identify ways for the MPO to support TOD in the Boston region, through policy and/or investment. The FFY 2022 TDM study surfaced the idea of the MPO helping the Commonwealth enforce the MBTA Communities TOD zoning through TIP criteria revisions or similar policy options. This study would engage MPO members, policy experts, and others about the feasibility of this and other ways for the MPO to support TOD throughout the region. Staff will prepare a report and lead discussions at the MPO board. |
$40,000–$60,000 | Staff Survey | |
| ROADWAY AND MULTIMODAL MOBILITY | blank | blank | blank | blank | blank |
| M-1 | Lab and Municipal Parking Phase II | This year's UPWP includes a discrete study that focuses on Lab and Municipal Parking. The objective of this work is to expand upon MAPC's Perfect Fit Parking study, which focused on residential parking, to develop a methodology to study supply of and demand for parking at lab and life science facilities. The methodology will be defined during Phase I of this study. On-site data collection for a number of sites will be required. Phase II of the study would employ this methodology to study parking supply and utilization at lab and life science facilities across the region. A data set of parking supply and utilization at lab and life science facilities; recommendations for municipal planners regarding provision of parking at these facilities. |
$60,000–$80,000 | Staff Survey | |
| M-2 | Exploring Roadway Pricing: Engagement with Local Stakeholders | Context of the underlying problem While many roadway-pricing projects have been successful in reducing congestion, fund transportation projects, and address air quality, others have not been implemented for a variety of reasons. Concerns such as impacts on transportation equity populations, suburban and rural drivers, and business activities have been raised for some projects. Ongoing, substantive, and sincere public engagement and education efforts have meaningfully influenced roadway-pricing program design. Although roadway pricing has been implemented in many cities in the United States, studies have found that the public and many policymakers still have difficulty understanding the purpose and benefits of the concept. However, once projects open, there are few complaints and positive feedback. Potential solutions to explore • MPO staff will identify key stakeholders in Massachusetts to communicate and build consensus on the benefits from roadway pricing. • The engagement efforts will include advocates or interest groups, business chambers of commerce, municipal officials, planners, and the public. • MPO staff will survey, host forums, and develop brochures on several topics such as pricing styles, benefits, transportation equity, business activities, air quality, etc. Anticipated outcomes Staff will prepare a memorandum documenting the communications and engagement efforts. The findings will provide the MPO valuable public feedback on how to implement a future roadway-pricing scheme. |
Seth Asante, Staff Survey | ||
| TRANSIT | blank | blank | blank | blank | blank |
| T-1 | Effective ways to reduce school-related vehicle trips | Over the last several decades, there has been a noticeable shift from parents allowing children to commute to school independently. Modes such as walking, biking, and taking the bus to school have been used less frequently, compared to dropping their children off at school. The effects of this shift have resulted in an increase of SOV travel; an increase in vehicle emissions; an increase of stress on commuting parents; potentially a decline in personal heath (both parents and children spend more time sitting in a vehicle instead of walking and biking).
This study would look at several funding mechanisms such as taxes, sponsorships, or congestion pricing to provide funding for the solutions listed above. This study will analyze different strategies that will look at ways to alleviate congestion near schools. First, a literature review will be written to show studies that have previously been completed on this topic. Then, a brief analysis would be conducted to see what strategies best fit the Boston region. A memorandum will be written that would summarize each of the final strategies. The memorandum can then be presented to specific communities that have congested roadway locations near schools. |
$60,000–$80,000 | Staff Survey | |
| T-2 | Review and Analysis of Community Connections Shuttles | This study would consist of a review of shuttle services funded through the MPO Community Connections program to gain a better understanding of the various successes and challenges of the MPO’s shuttle programs. Further, the study could pull data from all available shuttles to break down cost per rider, usage rates, GHG reductions, and other interesting/useful data points. The study is intended for MPO members and municipalities to enable decision-making regarding the long-term viability of the Community Connections shuttle program. Literature review and data analysis of current and past funded shuttle programs by the MPO; types of services offered; technology used by service; mapping of current shuttle service areas; data analysis of ridership, air quality, and equity impacts of the services; financial analysis of shuttle services; implementation, startup, and funding of shuttle services; long-term funding and successes; current needs and issues; interviews with current shuttle operators. This study would be used to evaluate the current success of funding shuttle services through the Community Connections program and could enable further discussion on the future viability of the program and whether the program is good in terms of cost/benefit. |
$40,000–$60,000 | Staff Survey | |
| T-3 | Toward Regional Transit Fare and Service Integration | This study would be an extension of the current MBTA Mobility Integrations study. Other regions have found success unifying multiple transit operators under a single fare schedule and enhancing interagency coordination on service, scheduling, and infrastructure. Such integrations make transit more user friendly by simplifying payment and provide a more cohesive transit network that encourages connections across a greater geographic area. These integrations may also make the transit system more equitable by enhancing service options for workers in transit-critical communities, who often have longer commutes that cross geographic, agency, and modal boundaries. This study would seek to determine best practices for initiating and implementing these integrations, and potentially identify specific considerations, concerns, and opportunities relevant to Greater Boston. This study would primarily involve identifying and researching regions where these kinds of intermodal and interagency integrations have been successful. This would include researching policy documentation, studying which integrations were implemented and how, and identifying challenges or missteps to avoid if such integrations are to take place in Greater Boston. If time and budget allow, this could also involve interviewing individuals from these regions/agencies (similar to the Mobility Integrations interviews). Current fare policies and service integrations among Greater Boston RTAs would also be examined. Interviews might also be applicable to this portion of the project to identify potential venues for this collaboration to take place and any specific concerns that agencies may have. |
$40,000–$60,000 | Staff Survey | |
| T-4 | In our Boston Metro region (and our state), we do not have an overarching comprehensive transportation plan that notes where we believe there should be fixed route service, where there should be demand services, where there should be point-to-point services, and who should run these. The result is an array of disparate services that are urged to regionalize themselves and collaborate themselves, though often times so many separate town borders and agency differences make this challenging. In addition, this plethora of diverse transportation options still leave us with many gaps and inefficiencies. We should map out the most ideal transportation network, including its frequencies and also map out the most ideal plan for how we deal with the inevitable gaps in the network. This work should also lead to a better CPT—HST plan and enhance so many other planning efforts. Even MBTA Bus Network Redesign does not really indicate the most ideal network, rather it just seems to be based on what can they most easily achieve within limited resources. In addition to better planning processes, we can then best identify the funding mechanisms to carry out this plan and identify when we may be able to pool resources, blend and braid funds, and consider any legislative changes, if necessary. This is for the entire Boston MPO region, which includes many transit authorities and also an array of services in between. Such planning would also help us identify how we would deal with overlap in these areas and also gaps in services. I would also recommend that in this process, we look at the integration of paratransit with other demand response services. |
Susan Barrett, Public Survey | |||
| T-5 | Context: For a variety of reasons with which we are all familiar, increasing the use of transit is a goal of the BRMPO; but which parameters have larger impact on transit use? The new TDM contains many parameters, with some being new and some being different versions of parameters that were used in the previous TDM. Proposed Study: This would be a basic research study to explore which parameters and combinations of parameters have larger effects on transit usage (with a focus on EJ communities and/or communities with large populations of minorities and/or those with low incomes). The study would explore parameters that easily come to mind but it would also explore combinations of parameters that would not ordinarily come to mind. Anticipated Outcomes: Discovery/confirmation of the parameters and combination of parameters that have larger impacts on transit use could help in the design and selection of projects that increase the use of transit. It could also provide insight as to how to design projects that minimize the negative effects on the use of transit. |
Len Diggins, Email | |||
| T-6 | Demographic Change and Transit Propensity in Eastern MA | Planners often use demographic data, among other tools, to project how people will travel around our area of responsibility. Typically, we expect that people in wealthier areas will use transit less, and that there is a significant difference in both demographics and land use between cities and suburbs. And while it is true that the Boston area is highly segregated, it is also true that American suburbs are changing and diversifying rapidly. In addition, the COVID-19 pandemic forced transit agencies to reconsider who their core markets are and who best to serve them. This study would seek to contextualize the pandemic-era shifts within a broader story of demographic change, and push planners to question (or reconfirm!) longstanding assumptions about who lives where and what they need. This study partially follows up on the work done in the FFY 2022 UPWP study “An Exploration of Destination Access and Transportation Cost Analyses.” Among other things, that study examined demographic change from the 2010 Census to the 2020 Census, and used 2020 Census data to examine destination access for protected populations. We propose expanding the analysis to include the 2000 Census, giving a longer-term view of demographic change over time, and exploring the ability to use destination access tools and past transit schedule data to examine change in destination access over time. In turn, this analysis would be used to analyze the impact those changes might have on demand for transit. More details can be requested from MBTA staff. |
Sandy Johnston, MBTA | ||
| T-7 | Review of and Lessons From Transit Capital Construction Costs Research | In recent years there has been significant examination in the transit world of the problem of rising capital construction costs. This is particularly significant in light of investments being made as part of the Bipartisan Infrastructure Law (BIL), as well as the need to rehab significant parts of the MBTA’s legacy infrastructure; invest in resiliency; and prepare for fleet electrification. We propose a study focused on examining recent research and findings on this topic and making high-level recommendations to the MBTA and other relevant stakeholders for how to streamline construction and lower costs. Sources could include the NYU Transit Costs Project and Eno Center report on the same topic. The study could also include interviews with experts in the field and people working on capital construction at the MBTA and other agencies. | Sandy Johnston, MBTA | ||
| RESILIENCE | blank | blank | blank | blank | blank |
| R-1 | Modeling Evacuation Routes | Use flood risk data to determine what infrastructure might fail at a given risk level; model transportation flows when that infrastructure is unavailable. The Massachusetts Coastal Flood Risk Model would be used to identify infrastructure at risk of flooding. The Travel Demand Model networks would be updated to reflect the infrastructure unavailable during floods to examine how travel patterns would change in response. Anticipated outcomes include a report of findings and potential identification of key evacuation routes. | $80,000–$100,000 | Staff Survey | |
| R-2 | Strategies for Environmental Outreach and Engagement | The MPO is well-positioned to connect different types of stakeholders around shared interests and facilitate collaboration throughout the region on transportation planning topics, including the key goal areas of climate resiliency and equity. To bring more representation of environmental, EJ, and resiliency topics and perspectives into our work, it is important to understand the various efforts and interests currently operating in this space, and to build relationships with practitioners and other interested parties. A first step to building these connections and expanding collaboration on environmental and resiliency themes is to determine the most effective engagement strategies for the MPO to pursue. Doing so would support the current UPWP's themes of resiliency, equity, and uncertainty by bringing environmental practitioners to the table who have not historically been engaged in MPO work. This study would support and advance both the resiliency and engagement programs, which currently lack capacity to build in this work at the program level. Surveys and interviews to connect with local environmental advocacy and environmental justice groups as well as municipal-level environmental departments to understand how resiliency practitioners would like to be engaged in MPO work.
Report outlining the benefits and obstacles associated with different approaches to environmental engagement, a list of Boston Region groups and departments interested in engaging with the MPO, and recommendations on environmental engagement best practices, strategies, and platforms to be utilized by MPO staff in future work. |
$20,000–$40,000 | Judy Taylor and Stella Jordan, Staff Survey | |
| R-3 | MPO Support for Transportation Network Electrification | This would be a research project to inform the MPO and its partners (municipalities, transportation agencies, and others) about the challenges and opportunities related to electrifying various aspects of the region’s transportation system (electric automobiles, trucks, bikes, and transit vehicles). The goal would be to guide the MPO as it makes investments to meet objectives in its Clean Air and Healthy Communities Goal area. This research could cover
The output of this study could be a report similar to “Connected and Autonomous Vehicles and the Boston MPO—A First Look” (2017) and “Promising Greenhouse Gas Reduction Strategies for the Boston Region" (2018). This report would be geared towards helping MPO members understand key issues related to transportation system electrification. Depending on the results of this research, future studies could support the development of guidebooks. |
$50,000 | Michelle Scott, Judy Taylor | |
| TECHNICAL SUPPORT and OTHER | blank | blank | blank | blank | blank |
| TRANSIT EQUITY | blank | blank | blank | blank | blank |
| TE-1 | Applying Conveyal to TIP Project Scoring | This study would create a process and a baseline set of resources that could be used to score TIP projects using the Conveyal destination access analysis application. It would be geared towards helping the MPO select projects that will help it achieve objectives in its Access and Connectivity goal area.
|
$70,000 | Michelle Scott, Betsy Harvey, Logan Casey, Ethan Lapointe | |
| TE-2 | Identify transit options that match transportation-underserved workers with transportation-underserved employers, in transportation-underserved areas. | Objective The goal of this proposed study is to ensure that Massachusetts offers transportation services that provide (1) environmental/energy/congestion benefits, (2) livability benefits (social and economic justice), (3) mobility equity, and (4) improved public and economic health. To achieve these, staff are recommending that UPWP conduct a study of transit options designed to match transportation-underserved workers with transportation-underserved employers, in transportation-underserved areas. The desired outcome is a set of models: well-researched, evidence-based, practicable examples for municipalities to use according to their unique circumstances. Context Transportation-underserved areas include rural and suburban communities with weak links to commuter rail and public transit (MBTA and/or RTAs). Also, in these communities, Chapter 40B and 40R requirements have resulted in substantial affordable developments, where those who need to work may have to rely on their own cars. Adding to residents who are financially vulnerable (especially single parents) are those students who are working while seeking credentials for secure employment, and retirees, whose pensions/Social Security may not be sufficient (e.g., the housing-cost burdened). Such residents are actually or potentially transportation-underserved workers. Operating in transportation-underserved areas are transportation-underserved employers. Not only in-town retail businesses but also large corporations in rural/suburban areas have difficulty finding and keeping employees.(1) In Massachusetts, entry-level jobs in the healthcare sector are an example: personal care aides, homecare aides, nurses/aides. Other entry-level jobs that are hard to fill include support staff and workers in food preparation and service. The goal is not simply to provide transportation to low-level workers but to assure that growth can occur because transportation nodes include education/training sites, dependent care sites (child care and adult day), and other sites that help workers not only keep jobs but gain skills. Proposed Study Details The UPWP study would be guided by the fundamental transportation principle of coverage, i.e., the study would incorporate coverage goals to ensure equity in the target region(s) and, hence, in the Commonwealth.(2) The study would focus on the transportation-underserved, across residents, businesses, and geographic areas; that is, transportation-underserved workers, employers, and municipalities (see details below). |
|||
| TE-2 (cont.) | Transportation-underserved workers are those
The goal of the proposed transit network is to help fill high demand jobs such as personal care aides, home health aides, nursing assistants, school support staff, and food prep and serving. Illustrations from BLS.gov data on MA employment include examples of certificate and/or entry-level jobs. NOTE: health services and education are the two biggest employers in the state (see details below).
Transportation-underserved geographic areas |
||||
| TE-2 (cont.) | Potential Solutions By incorporating the guiding principle of coverage in the study of transportation underserved (above), the UPWP study should provide the following innovative design solutions: a. Primary design innovation: inclusion of employment-supporting nodes in an origin-employment-destination transit model b. Secondary design innovation: transit providers chosen to be predominantly hybrid or EVs (environmental/energy benefits); fares/subsidies encourage predominance of shared rides (reduction of congestion); integration with MBTA and RTAs (increase energy/congestion reduction benefits. c. Tertiary design innovation: Financial sustainability by multiple means of funding. Each potential solution is described in more detail below. The primary innovation is design of an Origin-Support-(Employment) Destination transit network model. There is compelling evidence that the workers who are this study's focus cannot succeed only with transportation to and from their jobs.(3) For instance, single-parent heads of household, workers such as students at second/third/weekend shift jobs, individuals returning to work, and retirees may also need dependent-care (child care, adult day care) sites, in order to hold a job or move from part-time to full-time employment with benefits. Thus, UPWP's primary innovation is creation of a transit network that enlarges the origin-destination model to include support nodes. In addition to dependent care sites, such nodes might include "layover stops" on certain days at grocery stores, pharmacies, banks for brief errands on the way home. They could also include designated education/training sites, at specific times, so that workers could gain/improve skills and students would have reliable transportation from school to work. The secondary innovation is design of environmental/energy/congestion benefits model. Participation as transit providers would require vendors to use hybrid/EV fleets as much as possible. Rider fees and subsidies would be designed to ensure predominance of shared rides. And, reliable integration with MBTA, commuter rail, and RTA fixed route schedules would further increase these benefits. |
||||
| TE-2 (cont.) | The tertiary innovation is design of financial sustainability via multiple means of funding. Innovative transit systems like the one proposed require innovative financial support. Coverage goals, because they seek to assure equity as well as efficiency, will require subsidies. The origin-support-destination transit network can become financially sustainable by a variety of means: Employer contributions (a stable, reliable workforce reduces the organizational costs of turnover, hiring, training)
Anticipated Outcomes |
||||
18 Total study concepts
LRTP Goal Area Acronyms:
S = Safety SP/M = System Preservation and Modernization CM/M = Capacity Management and Mobility TE = Transportation Equity CA/SC = Clean Air/Sustainable Communities EV = Economic Vitality
Abbreviations:
AADT = annual average daily traffic. BIL = Bipartisan Infrastructure Law. CBD = central business district. CMP = Congestion Management Process. CPT-HST = Coordinated Public Transit--Human Services Transportation. CTPS = Central Transportation Planning Staff. DMU = diesel multiple unit. EJ = Environmental Justice. EMU = electric multiple unit. ESG = Environmental, Social, and Governance. EV = Electric Vehicles. FHWA = Federal Highway Administration. FFY = federal fiscal year. TFA = Federal Transit Authority. GHG = Greenhouse Gas. GIS = Geographic Information System. HEV = high-emitting vehicles. ITI = Institute of Transportation Engineers. LRTP = Long-Range Transportation Plan. MAPC = Metropolitan Area Planning Council. MassDOT = Massachusetts Department of Transportation. MassGIS = Massachusetts Bureau of Geographic Information. MBTA = Massachusetts Bay Transportation Authority. MEPA = Massachusetts Environmental Policy Act. MPO = Metropolitan Planning Organization. NEPA = National Environmental Policy Act. NIMBY = Not In My Back Yard. NYC DOT = New York City Department of Transportation. PEV = Pedestrian Environmental Variable. PRCA = Pedestrian Report Card Assessment. ROW = right-of-way. RTA = regional transit authority. SOV = single occupancy vehicle. TAZ = transportation analysis zone. TDM = transportation demand management. TIP = Transportation Improvement Program. TMA = transportation management association. TOD = transit-oriented development. UPWP = Unified Planning Work Program.
Table C-2
Studies Funded in the UPWP, by Category, FFYs 2017–24
| blank | FFY 2017 | FFY 2018 | FFY 2019 | FFY 2020 | FFY 2021 | FFY 2022 | FFY 2023 | FFY 2024 |
| Active Transportation | 1 | 1 | 1 | 1 | 1 | 1 | 3 | |
| Land Use, Environment, and Economy | 1 | 1 | 0 | 0 | 1 | 3 | 0 | 0 |
| Roadway and Multimodal Mobility | 4 | 5 | 6 | 4 | 5 | 5 | 1 | |
| Transit | 1 | 2 | 1 | 3 | 2 | 1 | 4 | |
| Transportation Equity | 0 | 0 | 0 | 1 | 0 | 1 | 4 | |
| Resilience | 0 | 0 | 0 | 1 | 1 | 0 | 0 | 0 |
| Other | 1 | 1 | 1 | 1 | 3 | 1 | 0 | 0 |
| Total | 8 | 10 | 9 | 11 | 13 | 12 | 12 | 12 |
This Appendix summarizes the Metropolitan Planning Organization (MPO)-funded work products produced by MPO staff (the Central Transportation Planning Staff) and the staff of the Metropolitan Area Planning Council (MAPC) during federal fiscal years (FFY) 2019 through 2023, as well as work products expected to be completed by the end of FFY 2023. The narrative below describes the methodology used to compile this information, as well as potential use cases for these data to inform and guide public involvement and regional equity considerations.
The purpose of this data collection is to better understand the geographic spread of Unified Planning Work Program (UPWP) work products (that is, reports and technical memoranda) throughout the Boston region. This analysis provides an initial glimpse at which communities and areas of the metropolitan region have benefited from transportation studies and analyses (or have received technical support) conducted by the MPO staff with continuing, comprehensive, and cooperative (3C) planning funds.
In addition, this Appendix includes a preliminary analysis of the distribution of MPO work products to minority populations, low-income populations, and people with limited English proficiency (LEP) based on their share of the population in each municipality. This is an initial approach to assess how MPO studies may benefit these populations. To further analyze this work, a pair of maps were developed that display the geographic spread of the 2023 work products. In the future, the development of the UPWP Study Recommendations Tracking Database, which will include these visualizations and the creation of an interactive online interface, will allow a more precise analysis of where and how study and analysis funds are spent.
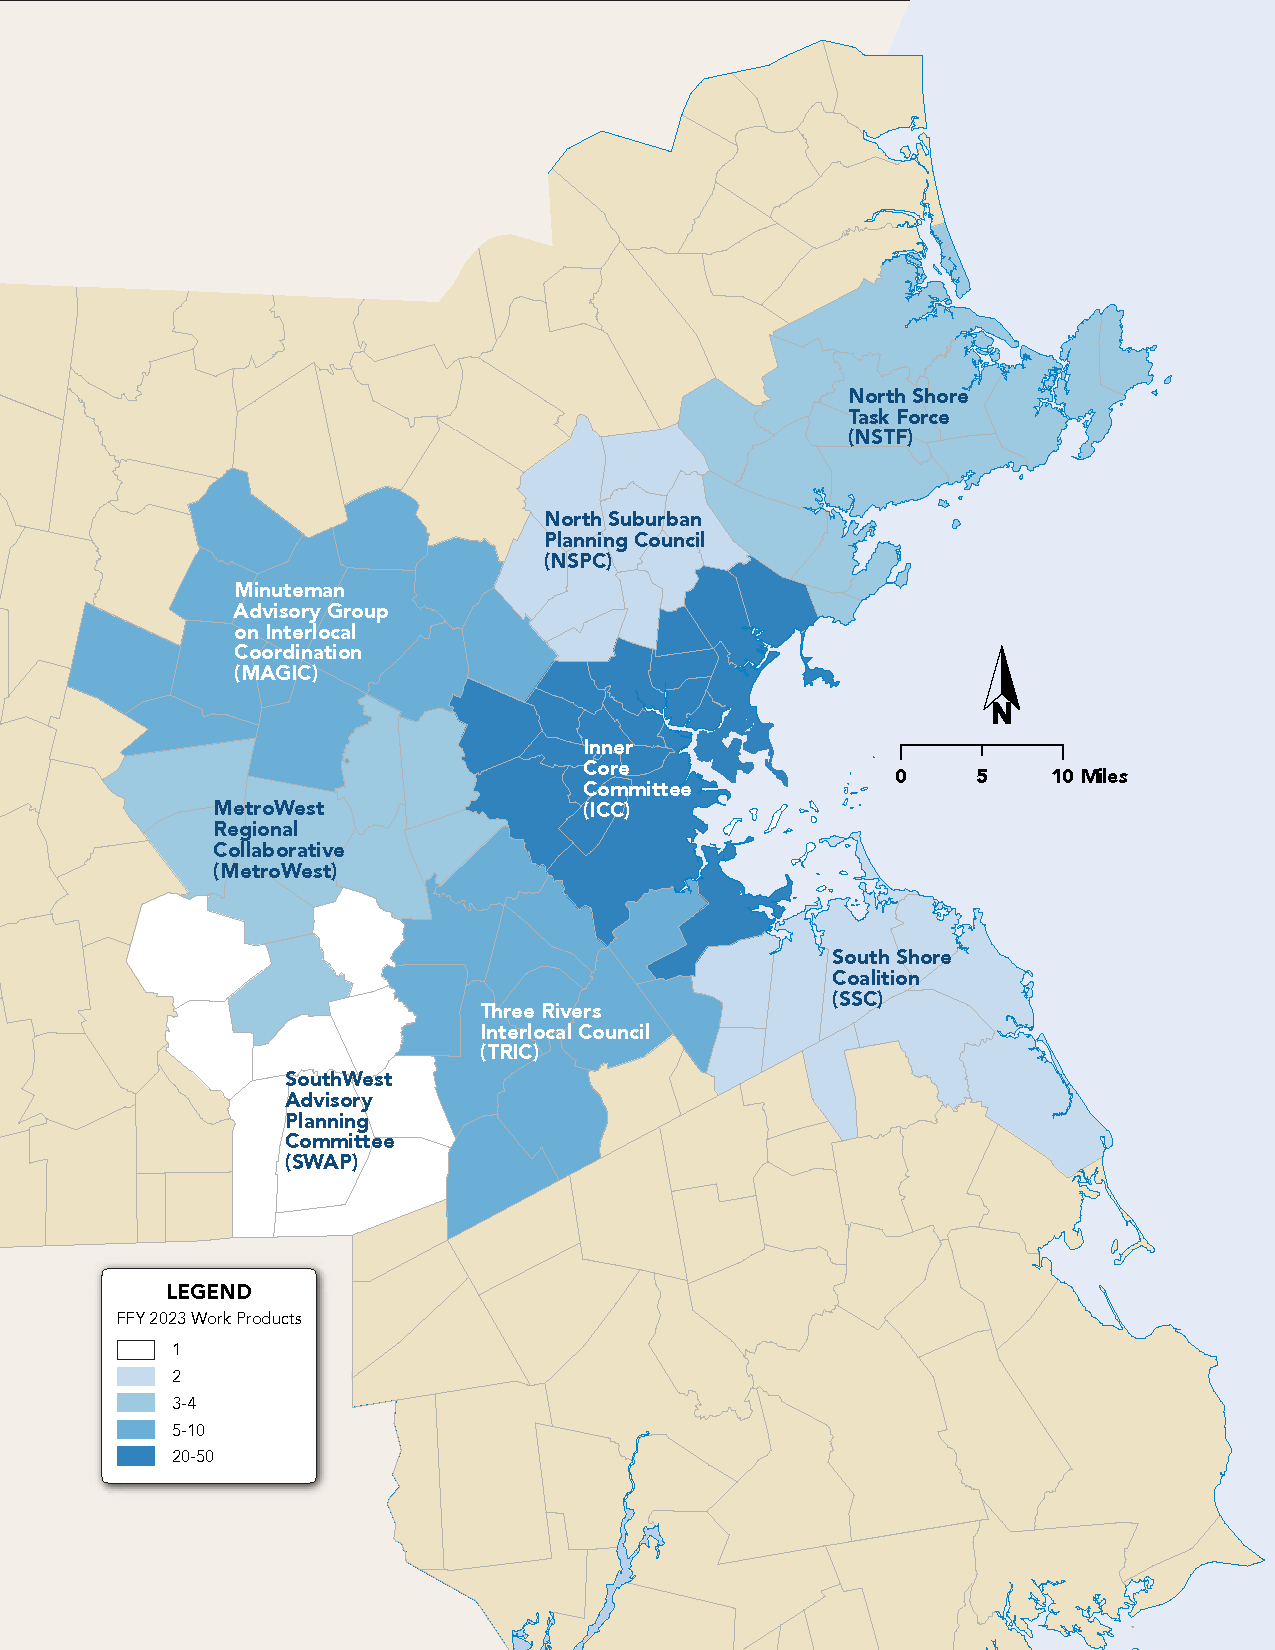
Table D-1 presents a summary of UPWP tasks completed from FFY 2019 through FFY 2023 that resulted in benefits to specific municipalities, aggregated to the subregional level. Figure D-1 is a map that displays the 2023 results geographically. Table D-2 presents the information from Table D-1 disaggregated by municipality, and Figure D-2 maps these results. Studies that had a regional focus are presented in Table D-3.
The geographic distribution of UPWP studies (those benefiting specific communities and those benefiting a wider portion of the region) can inform the UPWP funding decisions made for each FFY. When considered in combination with other information, the geographic distribution of MPO-funded UPWP studies can help guide the MPO’s public outreach to ensure that, over time, we are meeting needs throughout the region.
Table D-1
Summary of Distribution of Work Products by FFY and Subregion
| Subregion | Number of Work Products | Demographics | ||||||||
| Name | FFY 2019 | FFY 2020 | FFY 2021 | FFY 2022 | FFY 2023 | FFYs 2019–23 Total | Total Population | Percent Minority | Percentage of Residents in Poverty | Percentage of Residents with LEP |
| ICC | 26 | 17 | 14 | 20 | 46 | 123 | 1,759,970 | 48.2% | 25.7% | 16.2% |
| MAGIC | 16 | 9 | 6 | 4 | 13 | 48 | 181,858 | 26.8% | 9.0% | 5.5% |
| MWRC | 2 | 0 | 9 | 3 | 4 | 18 | 250,783 | 33.8% | 14.8% | 10.9% |
| NSPC | 3 | 1 | 1 | 1 | 2 | 8 | 217,978 | 19.8% | 10.5% | 4.8% |
| NSTF | 7 | 4 | 1 | 6 | 4 | 22 | 297,068 | 16.9% | 17.4% | 5.6% |
| SSC | 3 | 3 | 1 | 9 | 2 | 18 | 224,764 | 17.5% | 13.0% | 4.3% |
| SWAP | 0 | 0 | 3 | 1 | 1 | 5 | 149,159 | 19.6% | 10.9% | 5.2% |
| TRIC | 15 | 14 | 10 | 10 | 7 | 56 | 275,614 | 29.1% | 12.0% | 6.9% |
| Regionwide Total | 72 | 48 | 45 | 54 | 79 | 298 | 3,357,194 | 36.5% | 19.7% | 11.5% |
Notes:
LEP is tabulated for the population aged five years and older, the minority population and population in poverty are for the entire region.
People who identify as minority are those who identify as a race other than White or as Hispanic or Latino/a/x.
Sources:
Minority population: U.S. Census Bureau; Decennial Census, Table P2 (Race); generated by CTPS; using api.census.gov (2023-03-27).
Low-income population: U.S. Census Bureau; American Community Survey, 2017-2021 American Community Survey 5-Year Estimates, Table C17002 (Income Level), generated by CTPS; using api.census.gov; (2023-03-27).
People with LEP: U.S. Census Bureau; American Community Survey, 2017-2021 American Community Survey 5-Year Estimates, Table B16004 (Limited English Proficiency), generated by CTPS; using api.census.gov; (2023-03-27).
Median Household Income: U.S. Census Bureau; American Community Survey, 2017-2021 American Community Survey 5-Year Estimates, Table B19013 (Median Household Income), generated by CTPS; using api.census.gov; (2023-03-27).
Figure D-1
Map of 2023 Work Products by Subregion
As noted above, this analysis examined FFYs 2019 through 2023. To generate information on the number of UPWP studies during these FFYs that benefitted specific cities and towns in the Boston region, MPO staff performed the following tasks:
Table D-2 shows the number of completed MPO-funded UPWP work products from FFY 2019 through FFY 2023 that are determined to provide benefits to specific municipalities. Studies and technical analyses are grouped by the year in which they were completed, rather than the year in which they were first programmed in the UPWP. Examples of the types of studies and work in the table include the following:
Figure D-2 maps these results for FFY 2023.
Table D-2
Number of UPWP Tasks by FFY and Municipality, Grouped by Subregion
| Municipality | Number of Work Products | Demographics | |||||||||
| 2019 | 2020 | 2021 | 2022 | 2023 | 2019–23 Total | Total Population | Percent Minority | Percentage of Residents in Poverty | Percentage of Residents with LEP | Median Income | |
| Arlington | 2 | 1 | 0 | 0 | 3 | 6 | 46,308 | 24.80% | 10.60% | 6.60% | $125,701 |
| Belmont | 0 | 0 | 0 | 1 | 0 | 1 | 27,295 | 30.40% | 9.40% | 8.50% | $151,502 |
| Boston | 9 | 3 | 5 | 11 | 8 | 36 | 675,647 | 55.40% | 31.60% | 16.70% | $81,744 |
| Brookline | 1 | 3 | 0 | 1 | 2 | 7 | 63,191 | 34.70% | 17.30% | 9.10% | $122,356 |
| Cambridge | 1 | 1 | 0 | 0 | 2 | 4 | 118,403 | 44.60% | 19.50% | 7.90% | $112,565 |
| Chelsea | 1 | 2 | 1 | 0 | 3 | 7 | 40,787 | 79.80% | 41.90% | 41.30% | $64,782 |
| Everett | 1 | 2 | 0 | 0 | 3 | 6 | 49,075 | 65.90% | 33.70% | 31.40% | $71,510 |
| Lynn | 1 | 0 | 1 | 1 | 2 | 5 | 101,253 | 65.90% | 33.90% | 26.00% | $63,922 |
| Malden | 1 | 0 | 1 | 0 | 3 | 5 | 66,263 | 60.00% | 31.80% | 26.90% | $77,119 |
| Medford | 0 | 1 | 0 | 0 | 1 | 2 | 59,659 | 33.20% | 18.10% | 9.70% | $107,853 |
| Melrose | 0 | 0 | 1 | 0 | 2 | 3 | 29,817 | 20.40% | 11.20% | 5.50% | $125,229 |
| Newton | 0 | 1 | 0 | 1 | 2 | 4 | 88,923 | 29.90% | 9.20% | 6.40% | $164,607 |
| Quincy | 2 | 1 | 2 | 3 | 3 | 11 | 101,636 | 45.80% | 23.80% | 20.60% | $85,041 |
| Revere | 2 | 1 | 1 | 0 | 3 | 7 | 62,186 | 55.10% | 32.10% | 29.30% | $73,041 |
| Saugus | 0 | 0 | 0 | 0 | 0 | 0 | 28,619 | 24.90% | 17.60% | 6.70% | $93,737 |
| Somerville | 3 | 0 | 2 | 0 | 5 | 10 | 81,045 | 34.80% | 20.80% | 11.00% | $108,896 |
| Waltham | 1 | 0 | 0 | 1 | 0 | 2 | 65,218 | 39.60% | 19.10% | 10.20% | $103,498 |
| Watertown | 0 | 1 | 0 | 1 | 2 | 4 | 35,329 | 26.90% | 14.30% | 10.00% | $101,402 |
| Winthrop | 1 | 0 | 0 | 0 | 2 | 3 | 19,316 | 21.10% | 16.10% | 7.00% | $86,780 |
| ICC Subtotals | 26 | 17 | 14 | 20 | 46 | 123 | 1,759,970 | 48.20% | 25.70% | 16.20% | N/A |
| Acton | 3 | 3 | 0 | 0 | 1 | 7 | 24,021 | 36.90% | 11.40% | 8.90% | $138,163 |
| Bedford | 2 | 0 | 0 | 1 | 2 | 5 | 14,383 | 26.50% | 8.40% | 4.60% | $140,647 |
| Bolton | 1 | 0 | 0 | 0 | 0 | 1 | 5,665 | 13.50% | 7.90% | 2.00% | $167,132 |
| Boxborough | 1 | 0 | 0 | 0 | 0 | 1 | 5,506 | 32.90% | 10.00% | 5.40% | $136,875 |
| Carlisle | 1 | 0 | 0 | 0 | 0 | 1 | 5,237 | 21.20% | 5.70% | 1.60% | $216,000 |
| Concord | 1 | 1 | 2 | 1 | 3 | 8 | 18,491 | 18.20% | 8.10% | 3.30% | $169,335 |
| Hudson | 1 | 0 | 1 | 0 | 0 | 2 | 20,092 | 21.40% | 14.80% | 10.60% | $94,191 |
| Lexington | 1 | 1 | 1 | 1 | 1 | 5 | 34,454 | 43.30% | 6.10% | 7.00% | $202,852 |
| Lincoln | 1 | 1 | 1 | 0 | 1 | 4 | 7,014 | 23.80% | 15.50% | 2.10% | $145,833 |
| Littleton | 1 | 1 | 0 | 0 | 1 | 3 | 10,141 | 16.90% | 11.30% | 2.00% | $140,511 |
| Maynard | 1 | 1 | 0 | 0 | 1 | 3 | 10,746 | 17.00% | 10.90% | 5.00% | $112,432 |
| Stow | 1 | 0 | 0 | 0 | 0 | 1 | 7,174 | 14.30% | 6.50% | 2.20% | $147,841 |
| Sudbury | 1 | 1 | 1 | 1 | 3 | 7 | 18,934 | 19.10% | 3.70% | 2.30% | $217,847 |
| MAGIC Subtotals | 16 | 9 | 6 | 4 | 13 | 48 | 181,858 | 26.80% | 9.00% | 5.50% | N/A |
| Ashland | 0 | 0 | 1 | 0 | 1 | 2 | 18,832 | 31.50% | 11.50% | 9.20% | $115,959 |
| Framingham | 2 | 0 | 1 | 1 | 2 | 6 | 72,362 | 46.30% | 21.10% | 17.90% | $90,638 |
| Holliston | 0 | 0 | 1 | 0 | 0 | 1 | 14,996 | 15.80% | 8.30% | 4.30% | $142,348 |
| Marlborough | 0 | 0 | 1 | 0 | 0 | 1 | 41,793 | 40.90% | 22.10% | 14.90% | $86,230 |
| Natick | 0 | 0 | 1 | 1 | 0 | 2 | 37,006 | 24.40% | 10.80% | 7.80% | $122,914 |
| Southborough | 0 | 0 | 1 | 0 | 0 | 1 | 10,450 | 24.50% | 8.50% | 5.40% | $170,223 |
| Wayland | 0 | 0 | 1 | 1 | 0 | 2 | 13,943 | 23.20% | 5.60% | 4.40% | $203,789 |
| Wellesley | 0 | 0 | 1 | 0 | 0 | 1 | 29,550 | 26.70% | 7.40% | 4.40% | $226,250 |
| Weston | 0 | 0 | 1 | 0 | 1 | 2 | 11,851 | 26.00% | 12.30% | 4.60% | $220,815 |
| MWRC Subtotals | 2 | 0 | 9 | 3 | 4 | 18 | 250,783 | 33.80% | 14.80% | 10.90% | N/A |
| Burlington | 1 | 0 | 0 | 0 | 0 | 1 | 26,377 | 30.00% | 11.70% | 5.20% | $124,755 |
| Lynnfield | 0 | 0 | 0 | 0 | 0 | 0 | 13,000 | 13.50% | 10.00% | 2.90% | $147,237 |
| North Reading | 0 | 0 | 0 | 0 | 0 | 0 | 15,554 | 11.50% | 7.00% | 2.60% | $123,813 |
| Reading | 0 | 0 | 0 | 0 | 0 | 0 | 25,518 | 12.80% | 8.10% | 2.60% | $145,552 |
| Stoneham | 0 | 0 | 0 | 0 | 0 | 0 | 23,244 | 18.60% | 12.10% | 6.00% | $105,541 |
| Wakefield | 0 | 0 | 1 | 1 | 2 | 4 | 27,090 | 14.30% | 11.20% | 3.10% | $110,372 |
| Wilmington | 1 | 1 | 0 | 0 | 0 | 2 | 23,349 | 13.80% | 8.50% | 2.20% | $146,250 |
| Winchester | 0 | 0 | 0 | 0 | 0 | 0 | 22,970 | 25.40% | 7.20% | 5.70% | $184,844 |
| Woburn | 1 | 0 | 0 | 0 | 0 | 1 | 40,876 | 27.20% | 14.60% | 8.80% | $95,184 |
| NSPC Subtotals | 3 | 1 | 1 | 1 | 2 | 8 | 217,978 | 19.80% | 10.50% | 4.80% | N/A |
| Beverly | 1 | 1 | 0 | 1 | 1 | 4 | 42,670 | 15.40% | 19.60% | 4.50% | $89,882 |
| Danvers | 1 | 0 | 0 | 1 | 0 | 2 | 28,087 | 12.70% | 12.50% | 3.60% | $105,654 |
| Essex | 1 | 0 | 0 | 0 | 0 | 1 | 3,675 | 7.50% | 18.80% | 1.00% | $116,027 |
| Gloucester | 0 | 0 | 0 | 0 | 0 | 0 | 29,729 | 11.70% | 20.30% | 4.30% | $82,984 |
| Hamilton | 1 | 0 | 0 | 0 | 0 | 1 | 7,561 | 11.10% | 12.60% | 2.00% | $116,699 |
| Ipswich | 0 | 0 | 0 | 0 | 0 | 0 | 13,785 | 9.00% | 14.40% | 1.70% | $111,701 |
| Manchester-by-the-Sea | 1 | 0 | 0 | 1 | 1 | 3 | 5,395 | 6.70% | 5.60% | 1.20% | $193,279 |
| Marblehead | 0 | 0 | 0 | 0 | 0 | 0 | 20,441 | 9.20% | 9.20% | 2.60% | $154,049 |
| Middleton | 0 | 0 | 0 | 0 | 0 | 0 | 9,779 | 15.70% | 9.30% | 5.00% | $155,482 |
| Nahant | 0 | 0 | 0 | 0 | 0 | 0 | 3,334 | 9.00% | 12.80% | 2.10% | $99,456 |
| Peabody | 1 | 1 | 0 | 1 | 0 | 3 | 54,481 | 22.70% | 18.20% | 9.60% | $83,570 |
| Rockport | 0 | 0 | 0 | 0 | 0 | 0 | 6,992 | 6.90% | 13.40% | 0.40% | $88,377 |
| Salem | 1 | 1 | 1 | 2 | 2 | 7 | 44,480 | 31.50% | 28.90% | 8.70% | $72,884 |
| Swampscott | 0 | 1 | 0 | 0 | 0 | 1 | 15,111 | 14.20% | 12.80% | 9.40% | $114,086 |
| Topsfield | 0 | 0 | 0 | 0 | 0 | 0 | 6,569 | 10.00% | 9.90% | 1.40% | $155,208 |
| Wenham | 0 | 0 | 0 | 0 | 0 | 0 | 4,979 | 12.60% | 6.90% | 2.70% | $154,375 |
| NSTF Subtotals | 7 | 4 | 1 | 6 | 4 | 22 | 297,068 | 16.90% | 17.40% | 5.60% | N/A |
| Braintree | 0 | 1 | 0 | 1 | 1 | 3 | 39,143 | 29.90% | 11.90% | 9.60% | $114,916 |
| Cohasset | 0 | 0 | 0 | 1 | 0 | 1 | 8,381 | 7.20% | 8.50% | 0.00% | $156,689 |
| Hingham | 2 | 1 | 1 | 2 | 0 | 6 | 24,284 | 8.50% | 8.30% | 2.10% | $154,300 |
| Holbrook | 0 | 0 | 0 | 0 | 0 | 0 | 11,405 | 34.40% | 14.10% | 3.60% | $89,763 |
| Hull | 0 | 0 | 0 | 1 | 1 | 2 | 10,072 | 8.30% | 10.30% | 0.70% | $117,120 |
| Marshfield | 0 | 0 | 0 | 1 | 0 | 1 | 25,825 | 6.80% | 14.40% | 0.40% | $109,841 |
| Norwell | 1 | 1 | 1 | 1 | 0 | 4 | 11,351 | 8.80% | 5.30% | 1.60% | $172,022 |
| Rockland | 0 | 0 | 0 | 0 | 0 | 0 | 17,803 | 17.50% | 18.40% | 4.00% | $90,315 |
| Scituate | 0 | 0 | 0 | 1 | 0 | 1 | 19,063 | 6.60% | 8.20% | 2.40% | $129,132 |
| Weymouth | 0 | 0 | 0 | 1 | 0 | 1 | 57,437 | 22.60% | 17.60% | 6.20% | $91,592 |
| SSC Subtotals | 3 | 3 | 1 | 9 | 2 | 18 | 224,764 | 17.50% | 13.00% | 4.30% | N/A |
| Bellingham | 0 | 0 | 0 | 0 | 0 | 0 | 16,945 | 14.60% | 13.50% | 3.90% | $109,042 |
| Franklin | 0 | 0 | 0 | 0 | 0 | 0 | 33,261 | 14.90% | 10.10% | 2.70% | $127,608 |
| Hopkinton | 0 | 0 | 0 | 0 | 0 | 0 | 18,758 | 26.80% | 7.00% | 2.40% | $179,192 |
| Medway | 0 | 0 | 0 | 1 | 1 | 2 | 13,115 | 11.70% | 9.30% | 1.50% | $147,257 |
| Milford | 0 | 0 | 1 | 0 | 0 | 1 | 30,379 | 34.00% | 18.30% | 15.80% | $89,332 |
| Millis | 0 | 0 | 0 | 0 | 0 | 0 | 8,460 | 12.00% | 11.80% | 6.70% | $131,138 |
| Norfolk | 0 | 0 | 0 | 0 | 0 | 0 | 11,662 | 15.90% | 3.40% | 0.90% | $168,281 |
| Sherborn | 0 | 0 | 1 | 0 | 0 | 1 | 4,401 | 18.30% | 3.60% | 1.20% | $218,906 |
| Wrentham | 0 | 0 | 1 | 0 | 0 | 1 | 12,178 | 10.40% | 8.20% | 0.80% | $147,201 |
| SWAP Subtotals | 0 | 0 | 3 | 1 | 1 | 5 | 149,159 | 19.60% | 10.90% | 5.20% | N/A |
| Canton | 1 | 3 | 0 | 1 | 1 | 6 | 24,370 | 27.10% | 7.70% | 5.10% | $118,814 |
| Dedham | 1 | 2 | 1 | 1 | 0 | 5 | 25,364 | 22.00% | 14.30% | 5.60% | $108,047 |
| Dover | 1 | 0 | 1 | 0 | 0 | 2 | 5,923 | 19.20% | 2.40% | 3.20% | $250,001 |
| Foxborough | 1 | 2 | 1 | 0 | 0 | 4 | 18,618 | 16.40% | 17.50% | 3.90% | $95,410 |
| Medfield | 1 | 0 | 1 | 0 | 0 | 2 | 12,799 | 12.50% | 7.50% | 1.10% | $196,820 |
| Milton | 2 | 1 | 3 | 2 | 1 | 9 | 28,630 | 29.00% | 12.70% | 4.60% | $153,971 |
| Needham | 2 | 0 | 0 | 1 | 1 | 4 | 32,091 | 18.90% | 6.60% | 4.70% | $182,813 |
| Norwood | 2 | 2 | 1 | 2 | 2 | 9 | 31,611 | 27.50% | 16.30% | 10.50% | $96,414 |
| Randolph | 1 | 0 | 0 | 1 | 1 | 3 | 34,984 | 73.40% | 22.50% | 18.90% | $87,869 |
| Sharon | 1 | 0 | 0 | 0 | 1 | 2 | 18,575 | 33.20% | 3.70% | 5.80% | $157,928 |
| Walpole | 1 | 2 | 1 | 1 | 0 | 5 | 26,383 | 17.10% | 10.40% | 3.00% | $138,821 |
| Westwood | 1 | 2 | 1 | 1 | 0 | 5 | 16,266 | 17.20% | 6.30% | 3.80% | $171,071 |
| TRIC Subtotals | 15 | 14 | 10 | 10 | 7 | 56 | 275,614 | 29.10% | 12.00% | 6.90% | N/A |
| Grand Total | 72 | 48 | 45 | 54 | 79 | 298 | 3,357,194 | 36.50% | 19.70% | 11.50% | N/A |
Notes:
Limited English proficiency is tabulated for the population aged five and older, the minority population and population in poverty are for the entire region.
People who identify as minority are those who identify as a race other than White or as Hispanic or Latino/a/x.
Sources:
Minority population: U.S. Census Bureau; Decennial Census, Table P2 (Race); generated by CTPS; using api.census.gov (2023-03-27).
Low-income population: U.S. Census Bureau; American Community Survey, 2017-2021 American Community Survey 5-Year Estimates, Table C17002 (Income Level), generated by CTPS; using api.census.gov; (2023-03-27).
People with LEP: U.S. Census Bureau; American Community Survey, 2017-2021 American Community Survey 5-Year Estimates, Table B16004 (Limited English Proficiency), generated by CTPS; using api.census.gov; (2023-03-27).
Median Household Income: U.S. Census Bureau; American Community Survey, 2017-2021 American Community Survey 5-Year Estimates, Table B19013 (Median Household Income), generated by CTPS; using api.census.gov; (2023-03-27).
Figure D-2
Map of 2023 UPWP Tasks by Municipality
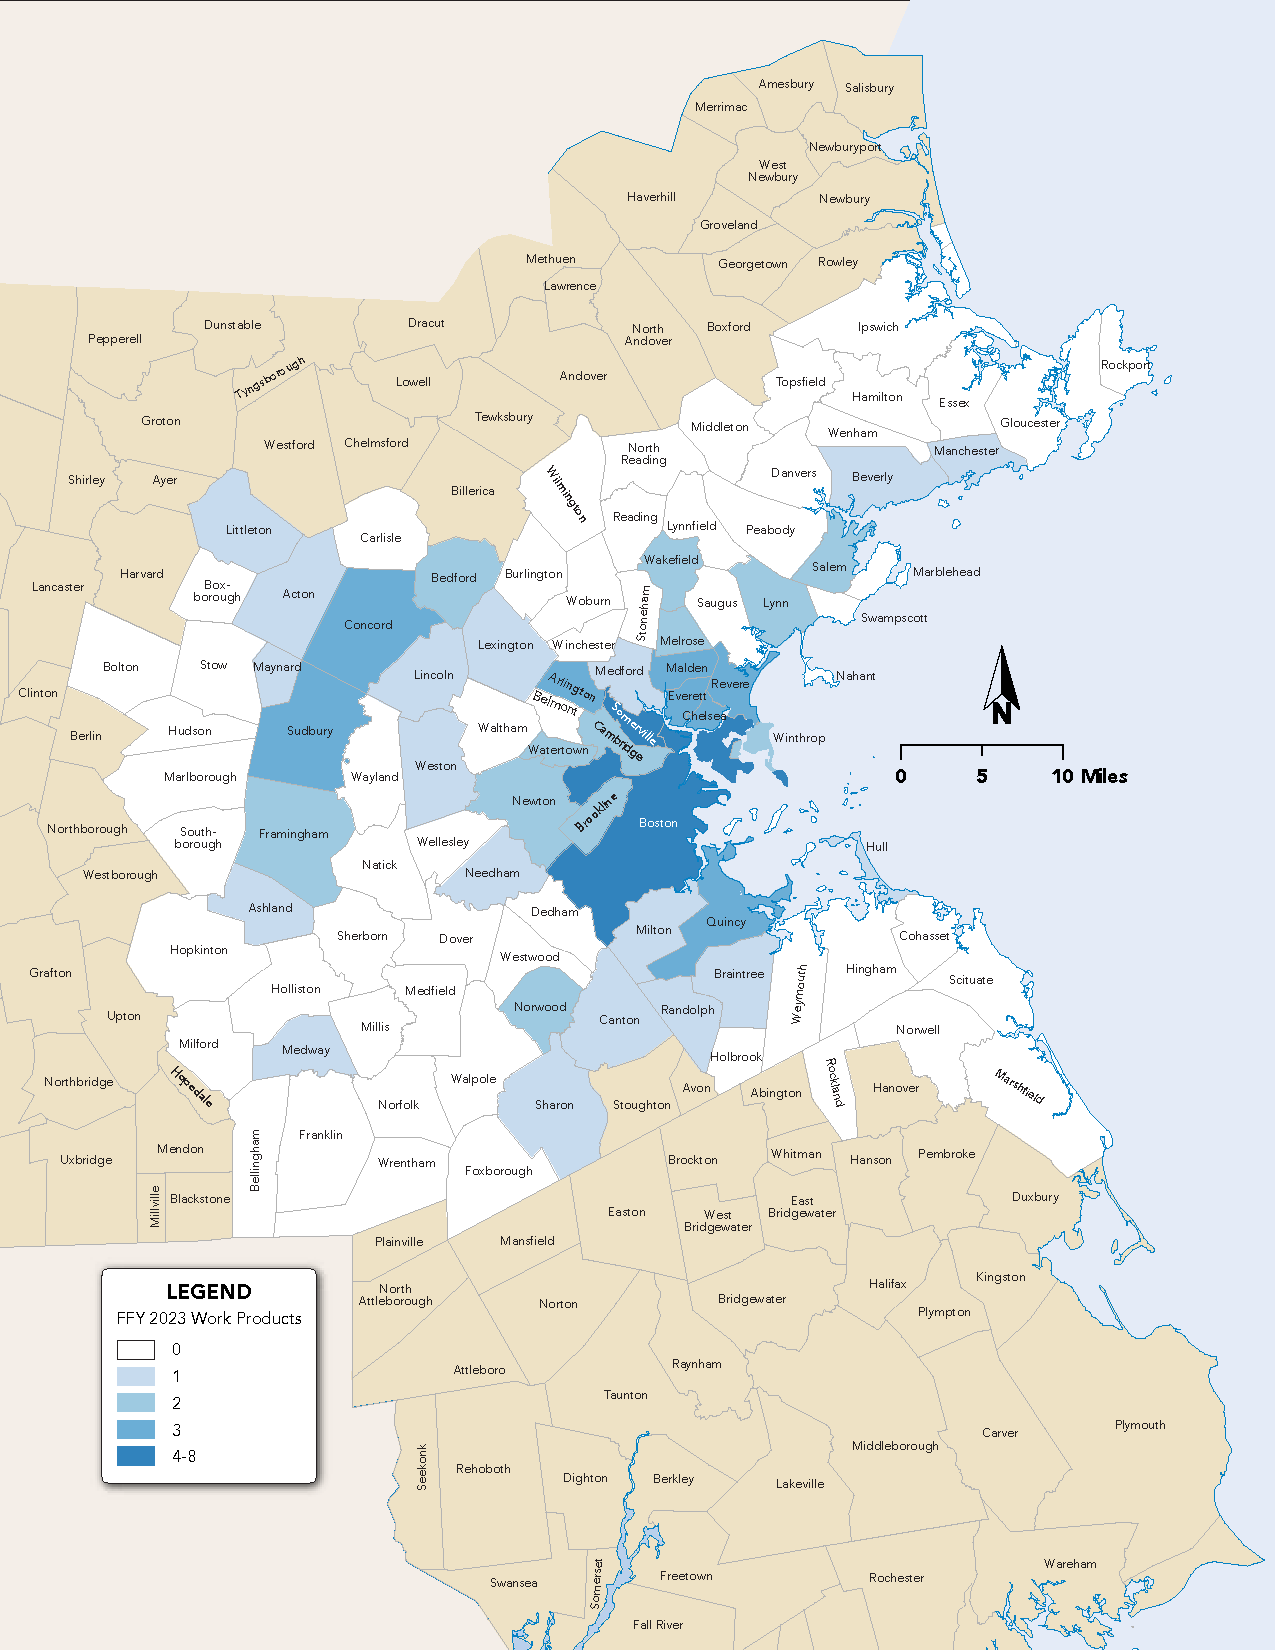
In addition to work that benefits specific municipalities, many projects funded by the MPO through the UPWP have a regional focus. Table D-3 lists MPO-funded UPWP studies completed from 2019 through 2023 that were regional in focus. Some regionally focused studies may have work products that overlap with those analyzed in the tables above.
More information on these studies and other work can be found on the MPO’s website (https://www.bostonmpo.org/recent_studies) or by contacting Srilekha Murthy, UPWP Manager, at smurthy@ctps.org.
Table D-3
Regionally Focused MPO-Funded UPWP Studies
FFY 2023 |
|
CTPS |
MAPC |
|
|
FFY 2022 |
|
CTPS |
MAPC |
|
|
FFY 2021 |
|
CTPS |
MAPC |
|
|
FFY 2020 |
|
CTPS |
MAPC |
|
|
FFY 2019 |
|
CTPS |
MAPC |
|
|
MPO staff collects these data annually. These data can potentially be used to inform UPWP funding decisions and could be used in concert with other data in the following future analyses:
Analyses such as these would provide the MPO with a clearer understanding of how the work programmed through the UPWP addresses the needs of the region.
This appendix contains detailed background on the regulatory documents, legislation, and guidance that shape the Boston Region Metropolitan Planning Organization’s (MPO) transportation planning process.
The Boston Region MPO is charged with executing its planning activities in line with federal and state regulatory guidance. Maintaining compliance with these regulations allows the MPO to directly support the work of these critical partners and ensures its continued role in helping the region move closer to achieving federal, state, and regional transportation goals. This appendix describes all of the regulations, policies, and guidance taken into consideration by the MPO during development of the certification documents and other core work the MPO will undertake during federal fiscal year (FFY) 2024.
The MPO’s planning processes are guided by provisions in federal transportation authorization bills, which are codified in federal statutes and supported by guidance from federal agencies. The Bipartisan Infrastructure Law (BIL), signed into law on November 15, 2021, replaced the Fixing America’s Surface Transportation (FAST) Act as the nation’s five-year surface transportation bill, and covers FFYs 2022–26. This section describes new provisions established in the BIL as well as items established under previous bills, such as the FAST Act.
The purpose of the national transportation goals, outlined in Title 23, section 150, of the United States Code (23 USC § 150), is to increase the accountability and transparency of the Federal-Aid Highway Program and to improve decision-making through performance-based planning and programming. The national transportation goals include the following:
The Boston Region MPO has incorporated these national goals, where practicable, into its vision, goals, and objectives, which provide a framework for the MPO’s planning processes. More information about the MPO’s vision, goals, and objectives is included in Chapter 1.
The MPO gives specific consideration to the federal planning factors, described in Title 23, section 134, of the US Code (23 USC § 134), when developing all documents that program federal transportation funds. In accordance with the legislation, studies and strategies undertaken by the MPO shall
The Boston Region MPO has also incorporated these federal planning factors into its vision, goals, and objectives. Table E-1 shows the relationships between FFY 2023 MPO studies and activities and these federal planning factors.
Table E-1
FFY 2024 3C-Funded UPWP Studies and Programs—Relationship to Federal Planning Factors
| 3C-funded Certification Activities | Ongoing Technical Assistance | New and Recurring 3C-funded Planning Studies* | Administration and Resource Management | MAPC Activities | |||||||||||||||||||||||||||||||
| Federal Planning Factor | Support to the MPO and its Committees | General Editorial | General Graphics | Public Engagement Program | Long-Range Transportation Plan | Transportation Improvement Program | Performance-Based Planning and Programming | Air Quality Conformity and Support Activities | Unified Planning Work Program | Transportation Equity Program | Congestion Management Process | Multimodal Mobility Infrastructure Program | Freight Planning Support | Data Program | Transit Working Group Support | Bicycle and Pedestrian Support Activities | Climate Resiliency Program | Roadway Safety Audits | Community Transportation Technical Assistance (CTPS and MAPC) | Regional Transit Service Planning Technical Support | Strategies for Environmental Outreach and Engagement | Parking in Bike Lanes: Strategies for Safety and Prevention | Lab and Municipal Parking Phase II | Applying Conveyal to TIP Project Scoring | Computer Resource Management | Professional Development | Corridor/Subarea Planning Studies | Alternative Mode Planning and Coordination | MetroCommon 2050 | Land-Use Development Project Reviews | MPO/MAPC Liaison Activities | UPWP Support | Land-use Data and Forecasts for Transportation Modeling | Subregional Support Activities | |
| 1 | Support the economic vitality of the metropolitan area, especially by enabling global competitiveness, productivity, and efficiency. | • | • | • | • | • | • | • | • | • | • | • | • | • | • | • | • | • | • | • | • | • | • | • | • | ||||||||||
| 2 | Increase the safety of the transportation system for all motorized and nonmotorized users. | • | • | • | • | • | • | • | • | • | • | • | • | • | • | • | • | • | • | • | |||||||||||||||
| 3 | Increase the ability of the transportation system to support homeland security and to safeguard the personal security of all motorized and nonmotorized users. | • | • | • | • | • | • | • | |||||||||||||||||||||||||||
| 4 | Increase accessibility and mobility of people and freight. | • | • | • | • | • | • | • | • | • | • | • | • | • | • | • | • | • | • | • | • | • | • | • | • | • | • | • | • | • | • | ||||
| 5 | Protect and enhance the environment, promote energy conservation, improve the quality of life, and promote consistency between transportation improvements and state and local planned growth and economic development patterns. | • | • | • | • | • | • | • | • | • | • | • | • | • | • | • | • | • | • | • | • | • | • | • | • | • | • | • | |||||||
| 6 | Enhance the integration and connectivity of the transportation system, across and between modes, for people and freight. | • | • | • | • | • | • | • | • | • | • | • | • | • | • | • | • | • | • | • | • | • | • | • | • | ||||||||||
| 7 | Promote efficient system management and operation. | • | • | • | • | • | • | • | • | • | • | • | • | • | • | • | • | • | • | • | • | • | • | ||||||||||||
| 8 | Emphasize the preservation of the existing transportation system. | • | • | • | • | • | • | • | • | • | • | • | • | • | • | • | • | ||||||||||||||||||
| 9 | Improve the resiliency and reliability of the transportation system and reduce or mitigate storm water impacts of surface transportation. | • | • | • | • | • | • | • | • | • | • | • | • | • | • | • | • | • | • | • | • | ||||||||||||||
| 10 | Enhance travel and tourism. | • | • | • | • | • | • | • | • | • | • | • | |||||||||||||||||||||||
* For ongoing FFY 2023 3C-funded studies, see FFY 2023 UPWP
** Includes Support to the MPO and its Committees, Public Participation Process, and Regional Transportation Advisory Council Support
FFY = Federal Fiscal Year. UPWP = Unified Planning Work Program.
The United States Department of Transportation (USDOT), in consultation with states, MPOs, and other stakeholders, established performance measures relevant to the national goals established in the FAST Act. These performance topic areas include roadway safety, transit system safety, National Highway System (NHS) bridge and pavement condition, transit asset condition, NHS reliability for both passenger and freight travel, traffic congestion, and on-road mobile source emissions. The FAST Act and related federal rulemakings require states, MPOs, and public transportation operators to follow performance-based planning and programming practices—such as setting targets—to ensure that transportation investments support progress towards these goals. See Chapter 3 for more information about how the MPO has and will continue to conduct performance-based planning and programming.
On December 30, 2021, the Federal Highway Administration and Federal Transit Administration jointly issued updated planning emphasis areas for use in MPOs’ transportation planning process, following the enactment of the BIL. Those planning emphasis areas include the following:
The Clean Air Act, most recently amended in 1990, forms the basis of the United States’ air pollution control policy. The act identifies air quality standards, and the US Environmental Protection Agency (EPA) designates geographic areas as attainment (in compliance) or nonattainment (not in compliance) areas with respect to these standards. If air quality in a nonattainment area improves such that it meets EPA standards, the EPA may redesignate that area as being a maintenance area for a 20-year period to ensure that the standard is maintained in that area.
The conformity provisions of the Clean Air Act “require that those areas that have poor air quality, or had it in the past, should examine the long-term air quality impacts of their transportation system and ensure its compatibility with the area’s clean air goals.” Agencies responsible for Clean Air Act requirements for nonattainment and maintenance areas must conduct air quality conformity determinations, which are demonstrations that transportation plans, programs, and projects addressing that area are consistent with a State Implementation Plan (SIP) for attaining air quality standards.
Air quality conformity determinations must be performed for capital improvement projects that receive federal funding and for those that are considered regionally significant, regardless of the funding source. These determinations must show that projects in the MPO’s Long-Range Transportation Plan (LRTP) and Transportation Improvement Program (TIP) will not cause or contribute to any new air quality violations; will not increase the frequency or severity of any existing air quality violations in any area; and will not delay the timely attainment of air quality standards in any area. The policy, criteria, and procedures for demonstrating air quality conformity in the Boston region were established in Title 40, parts 51 and 53, of the Code of Federal Regulations (40. C.F.R. 51, 40 C.F.R. 53).
On April 1, 1996, the EPA classified the cities of Boston, Cambridge, Chelsea, Everett, Malden, Medford, Quincy, Revere, and Somerville as in attainment for carbon monoxide (CO) emissions. Subsequently, the Commonwealth established a CO maintenance plan through the Massachusetts SIP process to ensure that emission levels did not increase. While the maintenance plan was in effect, past TIPs and LRTPs included an air quality conformity analysis for these communities. As of April 1, 2016, the 20-year maintenance period for this maintenance area expired and transportation conformity is no longer required for carbon monoxide in these communities. This ruling is documented in a letter from the EPA dated May 12, 2016.
On April 22, 2002, the EPA classified the City of Waltham as being in attainment for CO emissions with an EPA-approved limited-maintenance plan. In areas that have approved limited-maintenance plans, federal actions requiring conformity determinations under the EPA’s transportation conformity rule are considered to satisfy the conformity test. The MPO is not required to perform a modeling analysis for a conformity determination for carbon monoxide, but it has been required to provide a status report on the timely implementation of projects and programs that will reduce emissions from transportation sources—so-called transportation control measures—which are included in the Massachusetts SIP. In April 2022, the EPA issued a letter explaining that the carbon monoxide limited maintenance area in Waltham has expired. Therefore, the MPO is no longer required to demonstrate transportation conformity for this area, but the rest of the maintenance plan requirements, however, continue to apply, in accordance with the SIP.
On February 16, 2018, the US Court of Appeals for the DC Circuit issued a decision in South Coast Air Quality Management District v. EPA, which struck down portions of the 2008 Ozone National Ambient Air Quality Standards (NAAQS) SIP Requirements Rule concerning the ozone NAAQS. Those portions of the SIP Requirements Rule included transportation conformity requirements associated with the EPA’s revocation of the 1997 ozone NAAQS. Massachusetts was designated as an attainment area in accord with the 2008 ozone NAAQS but as a nonattainment or maintenance area as relates to the 1997 ozone NAAQS. As a result of this court ruling, MPOs in Massachusetts must once again demonstrate conformity for ozone when developing LRTPs and TIPs.
MPOs must also perform conformity determinations if transportation control measures (TCM) are in effect in the region. TCMs are strategies that reduce transportation-related air pollution and fuel use by reducing vehicle-miles traveled and improving roadway operations. The Massachusetts SIP identifies TCMs in the Boston region. SIP-identified TCMs are federally enforceable and projects that address the identified air quality issues must be given first priority when federal transportation dollars are spent. Examples of TCMs that were programmed in previous TIPs include rapid-transit and commuter-rail extension programs (such as the Green Line Extension in Cambridge, Medford, and Somerville, and the Fairmount Line improvements in Boston), parking-freeze programs in Boston and Cambridge, statewide rideshare programs, park-and-ride facilities, residential parking-sticker programs, and the operation of high-occupancy-vehicle (HOV) lanes.
In addition to reporting on the pollutants identified in the 1990 Clean Air Act Amendments, the MPOs in Massachusetts are also required to perform air quality analyses for carbon dioxide as part of the state’s Global Warming Solutions Act (GWSA) (see below).
The Boston Region MPO complies with Title VI of the Civil Rights Act of 1964, the American with Disabilities Act of 1990 (ADA), Executive Order 12898—Federal Actions to Address Environmental Justice in Minority Populations and Low-income Populations (EJ EO), and other federal and state nondiscrimination statutes and regulations in all programs and activities it conducts. Per federal and state law, the MPO does not discriminate on the basis of race, color, national origin (including limited-English proficiency), religion, creed, gender, ancestry, ethnicity, disability, age, sex, sexual orientation, gender identity or expression, veteran’s status, or background. The MPO strives to provide meaningful opportunities for participation of all persons in the region, including those protected by Title VI, the ADA, the EJ EO, and other nondiscrimination mandates.
The MPO also assesses the likely benefits and adverse effects of transportation projects on equity populations (populations covered by federal regulations, as identified in the MPO’s Transportation Equity program) when deciding which projects to fund. This is done through the MPO’s project selection criteria. MPO staff also evaluate the projects that are selected for funding, in the aggregate, to determine their overall impacts and whether they improve transportation outcomes for equity populations. The major federal requirements pertaining to nondiscrimination are discussed below.
Title VI of the Civil Rights Act of 1964 requires that no person be excluded from participation in, be denied the benefits of, or be subjected to discrimination on the basis of race, color, or national origin, under any program or activity provided by an agency receiving federal financial assistance. Executive Order 13166—Improving Access to Services for Persons with Limited English Proficiency, dated August 11, 2000, extends Title VI protections to people who, as a result of their nationality, have limited English proficiency. Specifically, it calls for improved access to federally assisted programs and activities, and it requires MPOs to develop and implement a system through which people with limited English proficiency can meaningfully participate in the transportation planning process. This requirement includes the development of a Language Assistance Plan that documents the organization’s process for providing meaningful language access to people with limited English proficiency who access their services and programs.
Executive Order 12898, dated February 11, 1994, requires each federal agency to advance environmental justice by identifying and addressing any disproportionately high and adverse human health or environmental effects, including interrelated social and economic effects, of its programs, policies, and activities on minority and low-income populations.
On April 15, 1997, the USDOT issued its Final Order to Address Environmental Justice in Minority Populations and Low-Income Populations. Among other provisions, this order requires programming and planning activities to
The 1997 Final Order was updated in 2012 with USDOT Order 5610.2(a), which provided clarification while maintaining the original framework and procedures.
Title III of the ADA “prohibits states, MPOs, and other public entities from discriminating on the basis of disability in the entities’ services, programs, or activities,” and requires all transportation projects, plans, and programs to be accessible to people with disabilities. Therefore, MPOs must consider the mobility needs of people with disabilities when programming federal funding for studies and capital projects. MPO-sponsored meetings must also be held in accessible venues and be conducted in a manner that provides for accessibility. Also, MPO materials must be made available in accessible formats.
The Age Discrimination Act of 1975 prohibits discrimination on the basis of age in programs or activities that receive federal financial assistance. In addition, the Rehabilitation Act of 1975, and Title 23, section 324, of the US Code (23 USC § 324) prohibit discrimination based on sex.
Much of the MPO’s work focuses on encouraging mode shift and diminishing GHG emissions through improving transit service, enhancing bicycle and pedestrian networks, and studying emerging transportation technologies. All of this work helps the Boston region contribute to statewide progress towards the priorities discussed in this section.
Beyond Mobility, the Massachusetts 2050 Transportation Plan, is a planning process that will result in a blueprint for guiding transportation decision-making and investments in Massachusetts in a way that advances MassDOT’s goals and maximizes the equity and resiliency of the transportation system. MPO staff continue to coordinate with MassDOT staff so that Destination 2050, the MPO’s next Long-Range Transportation Plan, is aligned with the Beyond Mobility plan.
The Commission on the Future of Transportation in the Commonwealth—established by Massachusetts Governor Charlie Baker’s Executive Order 579—published Choices for Stewardship in 2019. This report makes 18 recommendations across the following five thematic categories to adapt the transportation system in the Commonwealth to emerging needs:
Beyond Mobility will build upon the Commission report’s recommendations. The Boston Region MPO supports these statewide goals by conducting planning work and making investment decisions that complement MassDOT’s efforts and reflect the evolving needs of the transportation system in the region.
The Massachusetts 2023 Strategic Highway Safety Plan (SHSP) identifies the state’s key safety needs and guides investment decisions to achieve significant reductions in highway fatalities and serious injuries on all public roads. The SHSP establishes statewide safety goals and objectives and key safety emphasis areas, and it draws on the strengths of all highway safety partners in the Commonwealth to align and leverage resources to address the state’s safety challenges collectively. The Boston Region MPO considers SHSP goals, emphasis areas, and strategies when developing its plans, programs, and activities.
The Massachusetts Transportation Asset Management Plan (TAMP) is a risk-based asset management plan for the bridges and pavement that are in the NHS inventory. The plan describes the condition of these assets, identifies assets that are particularly vulnerable following declared emergencies such as extreme weather, and discusses MassDOT’s financial plan and risk management strategy for these assets. The Boston Region MPO considers MassDOT TAMP goals, targets, and strategies when developing its plans, programs, and activities.
In 2017, MassDOT finalized the Massachusetts Freight Plan, which defines the short- and long-term vision for the Commonwealth’s freight transportation system. In 2018, MassDOT released the related Commonwealth of Massachusetts State Rail Plan, which outlines short- and long-term investment strategies for Massachusetts’ freight and passenger rail systems (excluding the commuter rail system). In 2019, MassDOT released the Massachusetts Bicycle Transportation Plan and the Massachusetts Pedestrian Transportation Plan, both of which define roadmaps, initiatives, and action plans to improve bicycle and pedestrian transportation in the Commonwealth. These plans were updated in 2021 to reflect new investments in bicycle and pedestrian projects made by MassDOT since their release. The MPO considers the findings and strategies of MassDOT’s modal plans when conducting its planning, including through its Freight Planning Support and Bicycle/Pedestrian Support Activities programs.
The GWSA makes Massachusetts a leader in setting aggressive and enforceable GHG reduction targets and implementing policies and initiatives to achieve these targets. In keeping with this law, the Massachusetts Executive Office of Energy and Environmental Affairs (EEA), in consultation with other state agencies and the public, developed the Massachusetts Clean Energy and Climate Plan for 2020. This implementation plan, released on December 29, 2010 (and updated in 2015), establishes the following targets for overall statewide GHG emission reductions:
In 2018, EEA published its GWSA 10-year Progress Report and the GHG Inventory estimated that 2018 GHG emissions were 22 percent below the 1990 baseline level.
MassDOT fulfills its responsibilities, defined in the Massachusetts Clean Energy and Climate Plan for 2020, through a policy directive that sets three principal objectives:
In January 2015, the Massachusetts Department of Environmental Protection amended Title 310, section 7.00, of the Code of Massachusetts Regulations (310 CMR 60.05), Global Warming Solutions Act Requirements for the Transportation Sector and the Massachusetts Department of Transportation, which was subsequently amended in August 2017. This regulation places a range of obligations on MassDOT and MPOs to support achievement of the Commonwealth’s climate change goals through the programming of transportation funds. For example, MPOs must use GHG impact as a selection criterion when they review projects to be programmed in their TIPs, and they must evaluate and report the GHG emissions impacts of transportation projects in LRTPs and TIPs.
The Commonwealth’s 10 MPOs (and three non-metropolitan planning regions) are integrally involved in supporting the GHG reductions mandated under the GWSA. The MPOs seek to realize these objectives by prioritizing projects in the LRTP and TIP that will help reduce emissions from the transportation sector. The Boston Region MPO uses its TIP project evaluation criteria to score projects based on their GHG emissions impacts, multimodal Complete Streets accommodations, and ability to support smart growth development. Tracking and evaluating GHG emissions by project will enable the MPOs to anticipate GHG impacts of planned and programmed projects. See Chapter 3 for more details related to how the MPO conducts GHG monitoring and evaluation.
On September 9, 2013, MassDOT passed the Healthy Transportation Policy Directive to formalize its commitment to implementing and maintaining transportation networks that allow for various mode choices. This directive will ensure that all MassDOT projects are designed and implemented in ways that provide all customers with access to safe and comfortable walking, bicycling, and transit options.
In November 2015, MassDOT released the Separated Bike Lane Planning & Design Guide. This guide represents the next step in MassDOT’s continuing commitment to Complete Streets, sustainable transportation, and the creation of more safe and convenient transportation options for Massachusetts’ residents. This guide may be used by project planners and designers as a resource for considering, evaluating, and designing separated bike lanes as part of a Complete Streets approach.
In the current LRTP, Destination 2040, the Boston Region MPO has continued to use investment programs—particularly its Complete Streets and Bicycle Network and Pedestrian Connections programs—that support the implementation of Complete Streets projects. The next LRTP, Destination 2050, is being developed in tandem with the FFY 2024–28 TIP and will continue to provide similar support. In the Unified Planning Work Program, the MPO budgets to support these projects, such as the MPO’s Bicycle and Pedestrian Support Activities program, corridor studies undertaken by MPO staff to make conceptual recommendations for Complete Streets treatments, and various discrete studies aimed at improving pedestrian and bicycle accommodations.
MassDOT developed the Congestion in the Commonwealth 2019 report to identify specific causes of and impacts from traffic congestion on the NHS. The report also made recommendations for reducing congestion, including addressing local and regional bottlenecks, redesigning bus networks within the systems operated by the Massachusetts Bay Transportation Authority (MBTA) and the other regional transit authorities, increasing MBTA capacity, and investigating congestion pricing mechanisms such as managed lanes. These recommendations guide multiple new efforts within MassDOT and the MBTA and are actively considered by the Boston Region MPO when making planning and investment decisions.
On March 18, 2019, MassDOT and the MBTA released Focus40, the MBTA’s Program for Mass Transportation, which is the 25-year investment plan that aims to position the MBTA to meet the transit needs of the Greater Boston region through 2040. Complemented by the MBTA’s Strategic Plan and other internal and external policy and planning initiatives, Focus40 serves as a comprehensive plan guiding all capital planning initiatives at the MBTA. These initiatives include the Rail Vision plan, which will inform the vision for the future of the MBTA’s commuter rail system; the Bus Network Redesign (formerly the Better Bus Project), the plan to re-envision and improve the MBTA’s bus network; and other plans. The Boston Region MPO continues to monitor the status of Focus40 and related MBTA modal plans to inform its decision-making about transit capital investments, which are incorporated to the TIP and LRTP.
MetroCommon 2050, which was developed by the Metropolitan Area Planning Council (MAPC) and adopted in 2021, is Greater Boston’s regional land use and policy plan. MetroCommon 2050 builds off of MAPC’s previous plan, MetroFuture (adopted in 2008), and includes an updated set of strategies for achieving sustainable growth and equitable prosperity in the region. The MPO considers MetroCommon 2050’s goals, objectives, and strategies in its planning and activities. See Chapter 7 for more information about MetroCommon 2050 development activities.
MetroCommon 2050 will serve as the foundation for land use projections in the MPO’s next LRTP, Destination 2050. The MPO’s next LRTP is currently in development and is anticipated to be adopted by the MPO board in the summer of 2023
The purpose of the Congestion Management Process (CMP) is to monitor and analyze the mobility of people using transportation facilities and services, develop strategies for managing congestion based on the results of traffic monitoring, and move those strategies into the implementation stage by providing decision-makers in the region with information and recommendations for improving the transportation system’s performance. The CMP monitors roadways, transit, and park-and-ride facilities in the Boston region for safety, congestion, and mobility, and identifies problem locations. See Chapter 3 for more information about the MPO’s CMP.
Every four years, the Boston Region MPO completes a Coordinated Public Transit–Human Services Transportation Plan (CPT–HST), in coordination with the development of the LRTP. The CPT–HST supports improved coordination of transportation for seniors and people with disabilities in the Boston region. This plan also guides transportation providers in the Boston region who are developing proposals to request funding from the Federal Transit Administration’s Section 5310 Program. To be eligible for funding, a proposal must meet a need identified in the CPT–HST. The CPT–HST contains information about
The MPO adopted its current CPT–HST in 2019 and is currently developing its next CPT–HST, which is expected to be adopted in 2023.
The MBTA and the region’s RTAs—the Cape Ann Transportation Authority (CATA) and the MetroWest Regional Transit Authority (MWRTA)—are responsible for producing transit asset management plans that describe their asset inventories and the condition of these assets, strategies, and priorities for improving the state of good repair of these assets. The Boston Region MPO considers goals and priorities established in these plans when developing its plans, programs, and activities.
The MBTA, CATA, and MWRTA are required to create and annually update Public Transit Agency Safety Plans that describe their approaches for implementing Safety Management Systems on their transit systems. The Boston Region MPO considers goals, targets, and priorities established in these plans when developing its plans, programs, and activities.
The COVID-19 pandemic has radically shifted the way many people in the Boston region interact with the regional transportation system. The pandemic’s effect on everyday life has had short-term impacts on the system and how people travel, and it may have lasting effects. State and regional partners have advanced immediate changes in the transportation network in response to the situation brought about by the pandemic. Some of the changes may become permanent, such as the expansion of bicycle, bus, sidewalk, and plaza networks, and a reduced emphasis on traditional work trips. As the region recovers from the impacts of the COVID-19 pandemic and the long-term effects become apparent, state and regional partners’ guidance and priorities are likely to be adjusted.
The Boston Region Metropolitan Planning Organization (MPO) includes both permanent members and municipal members who are elected for three-year terms. Details about the MPO’s members are listed below.
The Massachusetts Department of Transportation (MassDOT) was established under Chapter 25 (An Act Modernizing the Transportation Systems of the Commonwealth of Massachusetts) of the Acts of 2009. MassDOT has four divisions: Highway, Rail and Transit, Aeronautics, and the Registry of Motor Vehicles. The MassDOT Board of Directors, composed of 11 members appointed by the governor, oversees all four divisions and MassDOT operations and works closely with the Massachusetts Bay Transportation Authority (MBTA) Board of Directors. The MassDOT Board of Directors was expanded to 11 members by the Legislature in 2015, a group of transportation leaders assembled to review structural problems with the MBTA and deliver recommendations for improvements. MassDOT has three seats on the MPO board, including seats for the Highway Division.
The MassDOT Highway Division has jurisdiction over the roadways, bridges, and tunnels that were overseen by the former Massachusetts Highway Department and Massachusetts Turnpike Authority. The Highway Division also has jurisdiction over many bridges and parkways that previously were under the authority of the Department of Conservation and Recreation. The Highway Division is responsible for the design, construction, and maintenance of the Commonwealth’s state highways and bridges. It is also responsible for overseeing traffic safety and engineering activities for the state highway system. These activities include operating the Highway Operations Control Center to ensure safe road and travel conditions.
The MBTA, created in 1964, is a body politic and corporate, and a political subdivision of the Commonwealth. Under the provisions of Chapter 161A of the Massachusetts General Laws, it has the statutory responsibility within its district of operating the public transportation system in the Boston region, preparing the engineering and architectural designs for transit development projects, and constructing and operating transit development projects. The MBTA district comprises 175 communities, including all of the 97 cities and towns of the Boston Region MPO area.
In April 2015, as a result of a plan of action to improve the MBTA, a five-member Fiscal and Management Control Board (FMCB) was created. The FMCB was created to oversee and improve the finances, management, and operations of the MBTA. The FMCB’s authorizing statute called for an initial three-year term, with the option for the board to request that the governor approve a single two-year extension. In 2017, the FMCB’s initial mandate, which would have expired in June 2018, was extended for two years, through June 30, 2020. In 2020, the FMCB’s mandate was extended a second time for an additional period of one year, through June 30, 2021.
Following the expiration of the FMCB’s extended mandate, the MBTA Board of Directors was formed as a permanent replacement to provide oversight for the agency. By statute, the board consists of seven members, including the Secretary of Transportation as an ex-officio member. The MBTA Advisory Board appoints one member who has municipal government experience in the MBTA’s service area and experience in transportation operations, transportation planning, housing policy, urban planning, or public or private finance. The Governor appoints the remaining five board members, which include an MBTA rider and member of an environmental justice population, and a person recommended by the President of the American Federation of Labor and Congress of Industrial Organizations.
The MBTA Advisory Board was created by the Massachusetts Legislature in 1964 through the same legislation that created the MBTA. The Advisory Board consists of representatives of the 175 cities and towns that compose the MBTA’s service area. Cities are represented by either the city manager or mayor, and towns are represented by the chairperson of the board of selectmen. Specific responsibilities of the Advisory Board include reviewing and commenting on the MBTA’s long-range plan, the Program for Mass Transportation; proposed fare increases; the annual MBTA Capital Investment Program; the MBTA’s documentation of net operating investment per passenger; and the MBTA’s operating budget. The MBTA Advisory Board advocates for the transit needs of its member communities and the riding public.
The Massachusetts Port Authority (Massport) has the statutory responsibility under Chapter 465 of the Acts of 1956, as amended, for planning, constructing, owning, and operating such transportation and related facilities as may be necessary for developing and improving commerce in Boston and the surrounding metropolitan area. Massport owns and operates Boston Logan International Airport, the Port of Boston’s Conley Terminal, Flynn Cruiseport Boston, Hanscom Field, Worcester Regional Airport, and various maritime and waterfront properties, including parks in the Boston neighborhoods of East Boston, South Boston, and Charlestown.
The Metropolitan Area Planning Council (MAPC) is the regional planning agency for the Boston region. It is composed of the chief executive officer (or a designee) of each of the cities and towns in the MAPC’s planning region, 21 gubernatorial appointees, and 12 ex-officio members. It has statutory responsibility for comprehensive regional planning in its region under Chapter 40B of the Massachusetts General Laws. It is the Boston Metropolitan Clearinghouse under Section 204 of the Demonstration Cities and Metropolitan Development Act of 1966 and Title VI of the Intergovernmental Cooperation Act of 1968. Also, its region has been designated an economic development district under Title IV of the Public Works and Economic Development Act of 1965, as amended. MAPC’s responsibilities for comprehensive planning encompass the areas of technical assistance to communities, transportation planning, and development of zoning, land use, demographic, and environmental studies. MAPC activities that are funded with federal metropolitan transportation planning dollars are documented in the Boston Region MPO’s Unified Planning Work Program.
The City of Boston, six elected cities (currently Beverly, Everett, Framingham, Newton, Somerville, and Burlington), and six elected towns (currently Acton, Arlington, Brookline, Hull, Medway, and Norwood,) represent the 97 municipalities in the Boston Region MPO area. The City of Boston is a permanent MPO member and has two seats. There is one elected municipal seat for each of the eight MAPC subregions and four seats for at-large elected municipalities (two cities and two towns). The elected at-large municipalities serve staggered three-year terms, as do the eight municipalities representing the MAPC subregions.
The Regional Transportation Advisory Council, the MPO’s citizen advisory group, provides the opportunity for transportation-related organizations, non-MPO member agencies, and municipal representatives to become actively involved in the decision-making processes of the MPO as it develops plans and prioritizes the implementation of transportation projects in the region. The Advisory Council reviews, comments on, and makes recommendations regarding certification documents. It also serves as a forum for providing information on transportation topics in the region, identifying issues, advocating for ways to address the region’s transportation needs, and generating interest among members of the general public in the work of the MPO.
The Federal Highway Administration (FHWA) and Federal Transit Administration (FTA) participate in the Boston Region MPO in an advisory (nonvoting) capacity, reviewing the Long-Range Transportation Plan, Transportation Improvement Program, and Unified Planning Work Program, and other facets of the MPO’s planning process to ensure compliance with federal planning and programming requirements. These two agencies oversee the highway and transit programs, respectively, of the United States Department of Transportation under pertinent legislation and the provisions of the Bipartisan Infrastructure Law (BIL).