Appendix A: Other Boston Region Transportation Planning Studies
Appendix B: Public Engagement and Public Comments
Appendix C: Universe of Proposed Discrete Studies for Federal Fiscal Year 2025 UPWP
Appendix D: Geographic Distribution of UPWP Studies and Technical Analysis
Appendix E: Regulatory and Policy Framework
Appendix F: Boston Reigon Metropolitan Planning Organization Membership
This appendix consists of transportation studies and technical analysis work that MPO staff will conduct to support the work of various transportation agencies in the Boston Region Metropolitan Planning Organization (MPO) area, as well as brief descriptions of planning studies that will be conducted in the Boston Region MPO area by individual agencies, such as the Massachusetts Department of Transportation (MassDOT) and the Massachusetts Bay Transportation Authority (MBTA), during federal fiscal year (FFY) 2025. This appendix is divided into two sections. The first describes contract-based work that MPO staff will undertake to support the planning work of other agencies, while the second describes studies supported by federal planning (but not MPO) funds and/or studies that MPO and partner agency staff have determined to be of regional significance.
The project listings in Section 1 are organized by funding agency and include studies and technical analyses for MassDOT, the MBTA, and other agencies in the Boston region. The project listings in Section 2 indicate whether components of the projects will be conducted by CTPS, and are organized hierarchically: first by type of study, then by geography, then by the entity organizing or leading the study effort.
The transportation studies and technical analysis work described in this section will be conducted to support the work of various transportation agencies in the Boston Region MPO area.
Some of the contracts described in this section are issued to the Central Transportation Planning Staff (CTPS) every year and generally coincide with either the FFY or the state fiscal year (SFY). Examples include MassDOT PL and MassDOT Statewide Planning and Research (SPR) contracts. Other contracts are issued for tasks and technical support to be conducted over a multiyear period, and they might be renewed with the agencies after several years. A third contract type covers the work for discrete studies or technical analyses intended to be completed within a specified timeframe. These may either be one-time contracts in which CTPS conducts analysis or technical support to further a specific agency project, such as MassDOT’s Interstate 90 (I-90) Allston Multimodal Modeling Support project, or they can be contracts in which CTPS provides technical support to an agency for data collection and analysis that is undertaken annually, such as the MBTA National Transit Database (NTD): Data Collection and Analysis contract.
The work conducted on behalf of the agencies includes data collection and analyses covering a broad range of topics, including travel demand modeling, air quality, traffic engineering, Title VI, and environmental justice. The products of this work are vital to support compliance with federal and state regulations such as the Massachusetts Environmental Policy Act and Title VI of the Civil Rights Act of 1964. CTPS also enhances regional understanding of critical transportation issues through the preparation of graphics, maps, and other materials for agency studies and presentations. The work described in this section is organized by agency and includes studies and technical analyses for MassDOT, the MBTA, and other agencies in the Boston region.
Table A-1
Unified Planning Work Program Budget—New and Continuing Agency Transportation Planning Studies and Technical Analyses for FFY 2025
| Project ID | Name | Total Contract | FFY 2025 Spending | Funding Source |
| Varies by project | MassDOT SPR Program Support | $500,000 | SPR | |
| 13155 | MassDOT Title VI Program | $95,000 | $20,000 | MassDOT |
| Varies by project | MassDOT-Directed Planning Assistance | $359,326 | MassDOT 3C PL | |
| 13809 | I-90 Allston Multimodal Modeling | $336,037 | $75,000 | MassDOT |
| MassDOT Projects | blank | $1,290,363 | $95,000 | blank |
| 11415 | AFC 2.0 Equity Analysis | $116,972 | $19,000 | MBTA |
| 11432 | MBTA 2024 and 2025 Title VI Program Monitoring | $197,964 | $90,700 | MBTA |
| 11496 | MBTA Mapping Support | $18,000 | $6,000 | MBTA |
| 11500 | MBTA Map and Signage Support to Bus Network Redesign | $20,000 | $20,000 | MBTA |
| 14376 | MBTA Rider Oversight Committee Support IV | $31,342 | $7,000 | MBTA |
| TBD | MBTA North Shore Busway | $108,819 | $80,000 | MBTA |
| 14378 | MBTA SFY 2024 National Transit Database (NTD) Support | $204,782 | $9,260 | MBTA |
| 14379 | MBTA SFY 2025 National Transit Database (NTD) Support | $234,184 | $166,220 | MBTA |
| 11430 | MBTA Transit Service Data Collection XI | $1,130,000 | $198,000 | MBTA |
| 14358 | Service Equity Analysis Support to the MBTA | $115,000 | $25,000 | MBTA |
| 22217 | Red Blue Connector Study | $213,000 | $15,000 | MBTA |
| MBTA Projects | blank | $2,390,063 | $636,180 | blank |
| Other (SS4A, Municipalities, etc.) | $350,000 | $350,000 | Other | |
| Other Projects | blank | 350,000 | blank | blank |
| Agency-Funded and Client-Funded Subtotal | blank | $4,030,426 | blank |
The contracts and technical analyses in this section are being undertaken for MassDOT.
Project ID Number |
Varies |
Funding Source |
MassDOT SPR |
FFY 2025 Total Budget |
$490,000 |
CTPS provides support to MassDOT’s SPR program as requested. These contracts will include multiple individual projects or tasks throughout the federal fiscal year.
CTPS will conduct studies and analyses and provide technical assistance upon request. Two projects that are either underway or expected to begin in FFY 2025 are the Roadway Inventory and Related Support Maintenance and the Statewide Model Assistance Project. Other projects may be added throughout FFY 2025.
Activities and work products will depend on tasks requested by MassDOT’s Office of Transportation Planning.
Project ID Number |
13155 |
Funding Source |
MassDOT Other |
Total Contract Amount |
$95,000 |
FFY 2025 Total Budget |
$20,000 |
Under this contract, CTPS will continue to provide technical support to MassDOT for developing and implementing its Title VI Program for both the Federal Highway Administration (FHWA) and the Federal Transit Administration (FTA).
MassDOT, as a recipient of federal funds from both FHWA and the FTA, is required to comply with Title VI of the Civil Rights Act of 1964, and with protections enacted through several other laws and executive orders that prohibit discrimination based on gender, age, income, and disability. Through this technical support work, CTPS will assist MassDOT in complying with these nondiscrimination laws.
Staff will provide technical support to MassDOT as described above.
Project ID Number |
Varies |
Funding Source |
MassDOT-Direct PL |
FFY 2025 Total Budget |
$359,326 |
CTPS will provide transit-planning assistance to MassDOT and the MBTA by conducting various studies under MassDOT’s FHWA-funded PL Program. This task will include multiple individual projects or tasks throughout the federal fiscal year.
Projects will be added throughout FFY 2025 to support transit-related research, planning, data collection, and analysis.
Activities and work products will depend on tasks requested by MassDOT and the MBTA.
Project ID Number |
13809 |
Funding Source |
MassDOT |
Total Contract |
$400,000 |
FFY 2025 Total Budget |
$75,000 |
MassDOT and its project team are currently developing a Supplemental Draft Environmental Impact Report for the Allston Multimodal project. CTPS will produce travel-demand forecasts in support of this environmental filing.
CTPS will support MassDOT by using the CTPS regional travel demand model set to estimate highway volumes, transit volumes, and mode splits for horizon-year (2050) scenarios of the Allston Multimodal project.
In FFY 2025 staff will finalize the analysis and study documentation and support the environmental filing preparation and engagement as needed.
The contracts and technical analyses in this section are being undertaken for the MBTA.
Project ID Number |
14378 (SFY 2024) TBD (SFY 2026) |
Funding Source |
MBTA |
Total Contract* |
$684,859 |
FFY 2025 Total Budget |
$9,260 (SFY 2024) $166,220 (SFY 2025) $50,496 (SFY 2026) |
*Multiple contract years are represented.
For many years, in support of the MBTA’s NTD submittals to the FTA, CTPS has produced passenger-miles traveled and unlinked trip estimates for MBTA services. This project will develop these estimates for the following modes:
CTPS will use the following methods to collect the data on which these estimates will be based:
The MBTA will submit its SFY 2024 NTD passenger-miles traveled and unlinked trip estimates for various transit modes to the FTA with the aid of CTPS during FFY 2025. The final technical memoranda for SFY 2025 NTD will be completed in FFY 2026.
CTPS will complete the final technical memoranda and auditing process for SFY 2024 NTD reporting and will complete data collection begun in FFY 2024 for SFY 2025. Field staff will begin collecting data for SFY 2026 NTD reporting.
Project ID Number |
11432 |
Funding Source |
MBTA |
Total Contract |
$197,964 |
FFY 2025 Total Budget |
$90,700 |
Under this contract, CTPS provides the MBTA with technical assistance by collecting and analyzing MBTA service data to compare service provided to minority riders with service provided to nonminority riders. This work supports the MBTA’s compliance with Title VI requirements.
Staff will collect and analyze data on the following service indicators:
The data-collection and analysis activities will help to fulfill monitoring required as part of the MBTA’s ongoing Title VI Program. The results of the data collection efforts and analyses will be reported in a memorandum to the MBTA for internal review and follow up and will be included in the next triennial program.
CTPS will incorporate relevant demographic data from the MBTA’s 2022 passenger survey and subsequent updates where appropriate as they become available.
CTPS will provide documentation about selected service monitoring evaluations for SFY 2023 and 2024 MBTA service and amenities.
Project ID Number |
11422 |
Funding Source |
MBTA |
Total Contract |
$1,130,000 |
FFY 2025 Total Budget |
$198,000 |
The work conducted under this contract will help the MBTA to assess bus and rapid transit service changes.
The MBTA requires ongoing data collection regarding its transit system to assess service changes. As part of this project, CTPS collects ridership and performance data to support future MBTA service changes. Work may also include support for improving the ridecheck database so that it will be compatible with new software and data sources. CTPS also may provide analytical assistance to the MBTA as requested.
Project ID Number |
14376 (SFY 2022–25) |
Funding Source |
MBTA |
Total Contract |
$31,342 |
FFY 2025Total Budget |
$7,000 |
The MBTA established a Rider Oversight Committee (ROC) in 2004 to provide ongoing public input on a number of different issues, including strategies for increasing ridership, developing new fare structures, and prioritizing capital improvements. Through this contract, CTPS supports the MBTA by providing ongoing technical assistance to the ROC.
Assistance provided by CTPS has included offering insights into the MBTA’s planning processes, providing data analysis, and attending committee meetings, at which staff may respond directly to ROC members’ questions.
CTPS will continue to provide technical assistance to the MBTA ROC and attend committee and subcommittee meetings.
Project ID Number |
TBD |
Funding Source |
MBTA |
Total Contract |
$115,000 |
FFY 2025 Total Budget |
$25,000 |
CTPS will support the MBTA in conducting the required Title VI service equity analyses for major service changes that take place during the duration of this contract.
CTPS will conduct service equity analyses for MBTA major service changes. CTPS will follow the new Service and Fare Equity policy in conducting its analyses.
CTPS will incorporate relevant demographic data from the MBTA’s 2022 passenger survey and subsequent updates where appropriate as they become available.
CTPS will prepare technical memoranda documenting service equity analyses for each major service change.
Project ID Number |
11496 |
Funding Source |
MBTA |
Total Contract |
$18,000 |
FFY 2025 Total Budget |
$6,000 |
The objective of this work is to provide map-making support upon request from the MBTA. At the time of each request, CTPS will provide the MBTA with an estimate of the specific cost and schedule for completing the map(s).
CTPS will update MBTA maps, upon request from the MBTA, within the budget provided for this project.
Updated district maps to reflect changes in bus routes and bus route garage assignments. Upon request from the MBTA, CTPS staff will update other existing CTPS-created MBTA maps within the budget provided for this project.
Project ID Number |
11500 |
Funding Source |
MBTA |
Total Contract |
$20,000 |
FFY 2024 Total Budget |
$20,000 |
The objective of this work is to provide map-making support, upon request from the MBTA.
CTPS will update MBTA maps, upon request from the MBTA, within the budget provided for this project.
Updated rapid transit system, bus, and neighborhood maps to reflect changes to bus routes in accordance with the MBTA Bus Network Redesign. Upon request from the MBTA, CTPS staff will update other existing CTPS-created MBTA maps within the budget provided for this project.
Project ID Number |
22217 |
Funding Source |
MBTA |
Total Contract |
$213,000 |
FFY 2025 Total Budget |
$15,000 |
CTPS is supporting the MBTA in preparation for environmental filings for the proposed connection between the Red and Blue Lines at the Charles/MGH Station. CTPS will continue to be engaged in developing traffic and transit projections for this work in FFY 2025.
CTPS will use the Boston Region MPO’s travel demand model to analyze the traffic and transit impact of the proposed connection between the Red and Blue Lines and the closure of Bowdoin Station.
The primary analysis for this study was completed in FFY 2024. Staff will continue to support preparation of the environmental filing, grant applications, and public engagement as needed.
Project ID Number |
11498 |
Funding Source |
MBTA |
Total Contract |
$108,819 |
FFY 2025 Total Budget |
$80,000 |
The MBTA has proposed a center-running bus lane facility linking Wonderland Station in Revere to Lynn (at the intersection of Broad and Chestnut Street/Atlantic Street) via North Shore Road, General Edwards Bridge, the Lynnway, and Broad Street. This bus rapid transit facility would produce a two-seat rapid-transit service between downtown Lynn and Boston.
Using the Boston Region MPO’s regional travel demand model set and other tools, CTPS will support MBTA and its project team by assessing the existing traffic conditions and travel patterns, and by providing modeling results and analyses for use in the evaluation of the proposed reconstruction scenario.
A technical memorandum summarizing the general modeling methodology and the results of the analysis will be provided to the MBTA and the project team.
Project ID Number |
11415 |
Funding Source |
MBTA |
Total Contract |
$116,972 |
FFY 2025 Total Budget |
$19,000 |
As part of the Fare Transformation initiative, the MBTA is developing a new AFC system, known as AFC 2.0, to supplant its existing fare payment system. In late 2017, the contract for the design, integration, and implementation of AFC 2.0 was awarded to Cubic | John Laing. This change in the MBTA’s fare payment system will also lead to changes that may negatively affect some riders. The MBTA has requested that CTPS analyze the equity of the impacts of the following components of AFC 2.0: elimination of cash on board, fee for specific fare media, and potential changes in fare structure.
CTPS will evaluate the distribution of fare vending machines and other fare media sales locations, the equity impacts of charging for a fare card, and a package of various fare structure changes that may be implemented with AFC 2.0. Tasks in this project include
CTPS will follow the new Service and Fare Equity policy in conducting its analyses.
CTPS will incorporate relevant demographic data from the MBTA’s 2022 passenger survey and subsequent updates where appropriate as they become available.
CTPS will produce technical memoranda documenting the equity analysis of the proposed fare structure changes, the equity analysis of the fare card fee, and the equity analysis of proposed fare sales locations.
This section consists of brief descriptions of planning studies that will be conducted in the Boston Region MPO area by individual agencies, such as MassDOT and the MBTA, during FFY 2024. This section describes studies supported by federal planning (but not MPO) funds, and/or studies that MPO and partner agency staff have determined to be of regional significance. The project listings in this indicate whether components of the projects will be conducted by CTPS, and are organized hierarchically: first by type of study, then by geography, then by the entity organizing or leading the study effort.
The projects in this section are not subject to the MPO’s public participation process. Rather, they follow their own public processes, parts of which may be required by the Massachusetts Environmental Policy Act. They are included here to provide a more complete picture of the surface-transportation-planning projects occurring in the region. The listings contained in this section were provided to CTPS prior to July 1, 2023.
In 2023, the Boston Region MPO received funding through the Safe Streets and Roads for All Grant Program in the amount of $2,160,435 to develop a Safety Action Plan. MassDOT is providing the required 20 percent match of $540,109, which brings the total budget for this work to $2,700,544. The MPO will adopt the Safe System approach in developing the Action Plan. Recommendations will focus on high-risk corridors and include low-cost, high-impact countermeasures that can be widely implemented, new processes and policies, continuous monitoring of crash data, innovative technologies, and collaborative conceptual plans for multi-jurisdictional corridors. A Task Force responsible for Action Plan oversight will be established and include diverse representation from municipalities, advocacy and community groups, underserved communities, public health organizations, and vulnerable roadway users. The MPO will work with a variety of stakeholders to develop a Safety Action Plan for the region and facilitate collaboration across jurisdictions to meet the region’s Vision Zero goal.
Other municipalities that received this grant in the Boston region are listed below:
Beyond Mobility, the Massachusetts 2050 Long-Range Transportation Plan, is a planning process that will result in a blueprint for guiding transportation decision-making and investments in Massachusetts in a way that advances MassDOT’s goals and maximizes the equity and resiliency of the transportation system. The Plan will serve as a strategic plan for MassDOT and document the most pressing transportation priorities for MassDOT to address between now and 2050, relying heavily on input from the public.
The project team, considering what the world will be like in 2050, analyzed previous plans, public engagement responses, and results from a needs assessment and identified six key priority areas of Massachusetts to focus on over the long term. These are safety, destination connectivity, travel experience, reliability, supporting clean transportation, and resiliency. Within the Plan, vision statements, values, problem statements, and more than 100 action items have been developed and are organized by these six priority areas.
Beyond Mobility was finalized in June 2024 and the full plan and executive summary are available on the plan webpage https://www.mass.gov/beyond-mobility.
The Impact of Teleworking Study is developing plausible future scenarios for teleworking in Massachusetts and will use a modeling approach to understand the effects that teleworking changes may have on the Commonwealth’s transportation system. This study will examine how anticipated increases and/or decreases in teleworking could change household and aggregate travel behavior through measures that include overall vehicle-miles traveled, trip attributes, and mode share. The potential macroeconomics impact of these changes in travel behavior will also be analyzed. The modeled projections for each scenario could assist MassDOT in future decision-making by providing information about how the demands on the transportation system will change and how the mix of transportation investment may need to respond.
MassDOT has developed an Electric Vehicle (EV) Infrastructure Deployment Plan for Massachusetts as required by the NEVI Program. Key activities during the initial plan development process included modeling EV charging demand on highway corridors in Massachusetts, analyzing economic factors associated with direct current fast charging technology, prioritizing highway corridor segments for investment of NEVI funds, and seeking stakeholder input on key questions. The MassDOT NEVI Plan has been approved. MassDOT is now proceeding with a planning process to determine the role of MassDOT-owned sites in the NEVI network buildout and to develop a model solicitation and contracting approach for partnering with a private entity to install fast charging infrastructure on EV Alternative Fuel Corridors in Massachusetts, which may help to ease range anxiety for drivers on long-distance trips.
MassDOT’s Office of Transportation Planning is conducting a study to determine long-term multimodal transportation and safety improvements to the Newton Corner I-90: Exit 127 (formerly Exit 17) Interchange in Newton, Massachusetts, bordering Brighton and Watertown.
This conceptual planning study will examine ways to improve mobility, system reliability, safety, connectivity, equity, economic opportunity, accessibility, efficiency, and climate resiliency in the study area.
MassDOT, the Executive Office of Environmental Affairs/Department of Conservation and Recreation, and the City of Boston have partnered to conduct a multimodal transportation study, and engage a recently created legislative (Morrissey) commission dedicated to long-term comprehensive planning for Morrissey Boulevard and the surrounding area in Dorchester, Massachusetts. This effort will build on past designs for the study area and contribute to preliminary, conceptual designs to improve the public realm, mobility, connectivity, safety, and climate resiliency in the corridor. This effort will also incorporate ongoing and future developments in the area to balance these projects with the local community. The resulting transportation alternatives will be presented as part of a public involvement process.
MassDOT’s Office of Transportation Planning is conducting a study of long-term alternatives for the replacement of the Maurice J. Tobin Memorial Bridge (“Tobin Bridge”). The Tobin Bridge carries US Route 1 over the Mystic River and connects Boston and Chelsea. In tangent with developing future means for Route 1 to cross the river, this study will consider opportunities to implement and improve transit priority and multimodal travel over the future bridge or its alternative and accommodate existing and future vehicle traffic levels.
MassDOT’s Office of Transportation Planning is conducting a study to develop a framework, methodology, and web-based tool for estimating the impacts of land use developments, including public and private developments, on the delivery and performance of transit services in Massachusetts. The deliverables from this project will inform MassDOT, MBTA, and regional transit authority decision-making and help these agencies take a more proactive approach to development mitigation.
The Program for Mass Transportation (PMT) is the MBTA’s long-range capital planning document. It defines a 25-year vision for public transportation in eastern Massachusetts. Massachusetts General Law requires the MBTA to update the PMT every five years and to implement the policies and priorities outlined in it through the annual Capital Investment Program (CIP). MassDOT’s Office of Transportation Planning will lead the process for updating the new PMT.
MassDOT’s Office of Transportation Planning is conducting a study to examine opportunities to improve and implement transit priority and multimodal travel over the Gilmore Bridge in Boston and Cambridge, as well as explore the feasibility of building a new bridge between Charlestown and Cambridge to serve transit, walking, and biking trips.
The Gilmore Bridge Mobility Improvements Study will examine existing mobility and other travel conditions within the study area and evaluate short-, medium-, and long-term recommendations intended to address the needs of current and anticipated future travelers along the corridor, with a particular emphasis on providing dedicated bus lanes. In addition to exploring opportunities for transit priority measures and active transportation improvements on the Gilmore Bridge, the study will assess the feasibility of constructing a new bridge between Charlestown and Cambridge to serve transit, walking, and biking trips.
In March 2023, the MBTA submitted a grant application to the Federal Transit Administration’s Areas of Persistent Poverty Program (APP). The APP Program is focused on providing funds for projects to assist areas of persistent poverty or historically disadvantaged communities. Eligible projects include things such as improvements to transit facilities, planning for low- or no-emission buses, and funding for coordinated public transit human service transportation plans. The MBTA submitted an application requesting $470,000 to design on-route battery electric bus (BEB) charging at Forest Hills and Ashmont stations. In July 2023, the MBTA received notice of an award under the APP Program for $127,366 to design electric bus charging at Ashmont Station.
Ashmont Station is a pivotal MBTA station in terms of its mobility benefits facilitating transfers to numerous local bus routes as well as to subway and commuter rail. Ensuring BEBs operate efficiently and continuously throughout the service area is paramount to guaranteeing access to employment opportunities for new and existing riders alike. In addition, a majority of the bus ridership on routes serving the station originate from areas designated by the United States Department of Transportation as Areas of Persistent Poverty and Historically Disadvantaged Communities. The funding to design on-route BEB charging at Ashmont Station is an important step in improving the reliability of bus service and decreasing the air quality impacts of diesel buses in and around the routes that serve the station. The MBTA’s full transition to BEBs relies on the design and construction of on-route BEB charging throughout the bus network.
FTA requires that any grants related to planning work (such as this one) be amended into the appropriate regional Unified Planning Work Program (UPWP). As such, this proposed UPWP amendment will add this project to the Appendix of the Boston Region MPO’s Federal Fiscal Year (FFY) 2024 UPWP. Since the study will be grant-funded, it will not impact funding for any other studies programmed in the FFY 2024 UPWP.
The City of Boston is progressing with the redesign of the Rutherford Avenue corridor in Charlestown, which extends approximately 1.5 miles from the North Washington Street Bridge to Sullivan Square and provides a critical connection between Everett, Somerville, suburbs north and east of Boston, and Boston’s downtown business area. Reconstruction of this corridor is currently programmed in the Transportation Improvement Program beginning in 2022. The corridor’s highway-like design is inconsistent with present-day design preferences and local circumstances, and the function and design of the Sullivan Square rotary is problematic. Pedestrian mobility is limited, and bicycle travel is not compatible with the high-speed road. The corridor is eight- to 10-lanes wide (120 to 140 feet), presenting a significant barrier between areas on either side of the roadway, such as the Bunker Hill Community College, Paul Revere Park, the Hood Business Park employment area, and MBTA rapid transit stations.
There are significant transit-oriented development opportunities along the corridor, and public investment in new infrastructure will support development of commercial and residential uses, whose tenants otherwise probably would not, or could not, locate to the area. A number of major structural elements in the corridor were constructed more than 60 years ago; they are approaching the end of their life cycle and will need to be replaced. With the Central Artery/Tunnel project now complete, more traffic remains on facilities such as Interstate 93 and US Route 1; therefore, reduced traffic volumes along Rutherford Avenue present a unique opportunity to transform the corridor’s character from a 1950s-era, automobile-oriented facility to a twenty-first century, multimodal, urban boulevard corridor that will accommodate private development.
Planning
RCP Award: $1,800,000
The project will develop a plan to connect across the open-cut highway by building an open space for the community and prepare design guidelines to reconnect the Chinatown neighborhood separated by the construction of Interstate 90 in the 1960s. Construction of I-90 displaced hundreds of Chinese American families through land seizure and demolition, including removal of the thriving Hudson Street neighborhood, for the installation of a ramp and retaining wall. In the Leather District, another thriving and historically Chinese American community, roughly 20 percent of Chinese American family homes were impacted by the construction. As a result, Boston’s Chinatown now lacks access to safe and open greenspace, affordable housing, and is disproportionately impacted by traffic and unclean air.
This project is intended to directly address the longstanding physical division in Boston’s historic Chinatown and to repair and enrich the area located between Shawmut Avenue and Washington Street, a disadvantaged community that has been marginalized, underserved, and overburdened by pollution. This project would also increase greenery and safe and accessible walking routes, improve safety, and decrease the use of motorized vehicles. The City of Boston proposes to create a steering committee of city and community members in the planning process. The application suggests that the air rights created by the connection could be used to create housing and job opportunities for the neighborhood.
This is a planning-level analysis of which transportation assets are at risk of flooding over the coming century. This study identifies flood exposure for in-state National Highway System roads, bridges, and large culverts; MassDOT- and MBTA-owned rail; MassDOT facilities; and many public-use airports. It assesses damage and repair costs, time estimates for repairs, and considers the consequences from loss of service. Specifically, this study will estimate “do nothing” costs and qualitative consequences of at-risk transportation assets under future conditions assuming no intervention. This information can be used during the capital planning process to prioritize investments that avoid or reduce long-term climatic impacts associated with flooding.
This study will develop recommendations about where and how to leverage existing facilities and resources that could contribute to the development of a shared travel network, as well as where these existing facilities could be expanded and where new facilities and assets could be introduced.
The New England University Transportation Center (Region One) is a research consortium that includes the Massachusetts Institute of Technology (lead university), Harvard University, and the state universities of Massachusetts, Connecticut, and Maine. It is funded by the US Department of Transportation’s University Transportation Centers (UTC) Program. The New England UTC conducts multiyear research programs that seek to assess and make improvements for transportation safety as well as develop a systems-level understanding of livable communities. For more information, visit the New England University Transportation Center’s website at http://utc.mit.edu/.
In the course of developing the Unified Planning Work Program (UPWP), the staff of the Boston Region Metropolitan Planning Organization (MPO) followed the procedures set forth in the MPO’s Public Engagement Plan to ensure early, active, and continuous public involvement in the transportation planning process.
The Federal Fiscal Year (FFY) 2025 UPWP development process began in October 2023. Staff solicited input on topics and priorities for study and program development through the following engagement activities:
Ideas received through these engagement activities were compiled into the FFY 2025 UPWP Universe of Proposed Studies. The ideas were further refined and prioritized through a process that included public meetings with the UPWP Committee and the Advisory Council. In addition to collecting ideas via the channels listed above, staff held a series of public discussions with the UPWP Committee and the Advisory Council to provide more information and solicit feedback about MPO programs and the program activities planned in FFY 2025.
The document development process, described in Chapter 2, culminated in the MPO board’s recommendation for the FFY 2025 UPWP. On May 18, 2024, the MPO board voted to release the draft UPWP document for public review. This vote initiated an official 21-day public review period.
Information about engagement conducted during the public review period and comments received will be included in the final version of the document, which will be posted to the MPO’s website following a vote for endorsement.
This appendix describes the Universe of Proposed Discrete Studies (the Universe), which is prepared as a step in the development of the federal fiscal year (FFY) Unified Planning Work Program (UPWP). Each year, the Boston Region Metropolitan Planning Organization (MPO) invites stakeholders in the region to submit ideas for study concepts that may be of benefit to the region. Study suggestions are collected through email and a public survey, and at Metropolitan Area Planning Council (MAPC) subregional committee meetings and Regional Transportation Advisory Council meetings. Those who submit ideas are asked to include a summary of the purpose of the study they are proposing. Where feasible in terms of alignment with MPO priorities, staff capacity, and resources, MPO staff will further consider integrating study ideas from the Universe into the MPO’s work.
Studies in the Universe, shown in Table C-1, are organized into the following categories:
Studies collected in the Universe are further categorized according to whether they are suited to be considered as stand-alone, discrete studies to be completed in a single federal fiscal year with clearly identifiable deliverables or to be further considered for potential incorporation within ongoing program work. In either case, all ideas captured in the Universe are assessed for feasibility in the context of consistency with MPO priorities, staff capacity, and resources. In addition, study ideas are assessed in the context of work that is occurring in other agencies to avoid redundancy.
Table C-2 tracks the breakdown of studies chosen for funding in the UPWP from FFY 2018 to the present by category.
One important framework that MPO staff and the UPWP Committee use to evaluate each proposed study in the Universe is the extent to which a study concept addresses each of the six Long-Range Transportation Plan goal areas:
A subset of the proposed studies in the Universe that may be suitable as discrete studies is refined into a final list to be considered for funding in the annual UPWP. Most of the MPO’s annual planning budget is dedicated to ongoing and evolving core and programmatic work; the budget set-aside for discrete studies represents a small but important percentage of the overall budget. The discrete study set-aside offers opportunities for staff to explore relevant and timely topics that may not already be embedded in existing work but that align with the MPO’s goals and priorities and are feasible in terms of staff’s capacity to complete the studies in the federal fiscal year.
These various factors, along with the availability of funds for new discrete studies in the context of resources needed for required and programmatic work, inform the staff’s recommendation of scenarios of discrete studies for review by the UPWP Committee. For more information about the process of developing and evaluating the Universe, please see Chapter 2.
Table C-1
Universe of Proposed Studies for FFY 2025
| Study Information | |||
| ID | Project Name | Project Purpose and Outcome | Source |
| blank | blank | I think the MPO should study all the private transportation options (college shuttles, commuter shuttles, and even and particularly school buses) and evaluate if/when we would be better off if these services/resources were transitioned to a PUBLIC transportation system. This is not to say that these private services are never needed, but given the plethora that exist (with some school district bus systems almost equal in size to small RTAs), and given the shortage of funding for public transportation, yet the need and desire for more public transportation, shouldn't we be checking on the balance of resources? Additionally, with a shortage of drivers, wouldn't it be better to have job opportunities that offer 8 hours of work rather than multiple split shifts, which are usually the situation with school transportation and commuter shuttles? Additionally, with private services filling in gaps in service, but most not being open to the public, we still have gaps in service, except for a minority of people, and even then, the private services cannot fill all their transportation needs. Thank you! |
Susan Barrett, sbarrett@lexingtonma.gov |
| blank | blank | The MPO should study opportunities to create improved equity in electric vehicle charging infrastructure by embracing Level 1 charging. Level 1 charging is much less expensive and has a low impact on streetscapes and properties than Level 2 particularly in currently underserved areas such as urban curbside and multifamily residential parking. But there are a number of policy and structural barriers that hamper this technology from being easily adopted in the Boston area. In the study I would look at: the technical aspects (such as streetlight or parking lot light connected chargers), financial aspects (business models and public/private partnerships), funding recommendations such as including Level 1 in local/regional grants which are only budgeting for Level 2 or 3 chargers, policy objectives like including Level 1 in local building code / EV readiness, and more. I run a company building a public-facing Level 1 EV charger that is based in Newton and am creating a type of charger that can be deployed in currently underserved areas at scale due to much lower cost and project complexity. Many residents and municipal stakeholders in our area that I have spoken to are excited about this technology and view Level 1 as a viable option for a number of use cases. However there are a number of structural and policy barriers to implementing this at scale that planning studies could help to assess and influence. I would be happy to discuss this topic at further length with the MPO to share some of what I have learned that might help the MPO determine areas of focus for their research. |
Ross Bloom, ross@revvit.net |
| blank | blank | Creating a regionwide freight priority network map of all roadways classified as major arterial or greater (and time-permitting, minor arterial). The study could be phased into specific corridors or based on subregions. Many available resources, including the 2023 Massachusetts Freight Plan (https://www.mass.gov/doc/draft-2023-massachusetts-freight-plan/download) focus on interstates that carry the majority of truck traffic, but do not reflect the roadways that are subject to many MPO studies and capital project investments. | Ethan Lapointe, elapointe@ctps.org |
| blank | blank | A coordinated study effort with the Metropolitan Area Planning Council to review how Section 3A MBTA Communities zoning in a given subregion may impact demand for all forms of transit services. Findings would be able to be used in recommendations to prioritize certain transit investments or service expansions (including new service). | Ethan Lapointe, elapointe@ctps.org |
| blank | blank | Changes in mode split on arterials where bus lanes and bike lanes have been implemented by eliminating a travel lane. How did LOS and queues change and what was the impact on air quality. | Anne L. McKinnon, am103477556@cs.com |
| blank | blank | It's been 6 years since Greater Boston saw it's first pop-up dedicated bus lane in Everett- using cones and a few cops. Since then, bus lanes have sprouted up, in various forms, throughout the region, and many more are planned. Most of the research to date focuses solely on the immediate impacts of the bus lanes on time savings and reliability improvements for bus riders, and, to a lesser degree, ridership. Little data exists on how dedicated bus and bus/bike lanes have impacted general traffic or road safety. Now that most of these bus lanes have been in operation for at least 1-3 years, the time is right to study not just how bus lanes improve travel for bus riders, but for everyone using the street. MAPC can collaborate on this with you! | Julia Wallerce, jwallerce@mapc.org |
| blank | blank | Investigate the use TILE2NET (https://github.com/VIDA-NYU/tile2net) for greatly improving the extent and accuracy of the MPO's database of pedestrian facilities (i.e., sidewalks and crosswalks). The only source for this data currently available to the MPO is the MassDOT Road Inventory. Although work has been done on the sidewalk data in the Road Inventory, it has been a relatively low priority for MassDOT, and most if not all of the work has been done manually. TILE2NET offers the opportunity to generate sidewalk (and crosswalk) data from aerial imagery automatically. Given the availability of high-reslolution (15 cm) aerial imagery for the entire state, and TILE2NET's success in generating sidewalk and crosswalk data for Cambridge and Washington, D.C. (among other places), employing it systematically to generate this data for a representative sample of MPO cities and towns seems like a logical next step. In order to 'scope' the project, rather than undertaking running TILE2NET on the entire MPO region (or entire state) for starters, we propose to do it on a representative sample of cities and towns in the MPO region - possibly one city or town in each MPO subregion - in order to evaluate the effectiveness of the tool on a variety of landscapes. The results would then be shared with the TILE2NET development team, which could use this information to further refine their algorithms if needed. (If TILE2NET is shown to be effective, the MPO might considering work on TILE2NET by the TILE2NET development team directly in future.) The results would also be compared with the sidewalk data in the Road Inventory and shared with MassDOT for the purpose of updating the sidewalk data in the Road Inventory as needed. |
Benjamin Krepp, bkrepp@ctps.org |
| blank | blank | There should also be a study looking at the existing bike network across municipalities and developing a plan to better connect it and expand upon it. |
Cole Rainey-Slavick, c.raineyslavick@gmail.com |
| blank | blank | There should be a study of the performance of different types of bus lanes, determining their relative effectiveness and making suggestions for future projects. | Cole Rainey-Slavick, c.raineyslavick@gmail.com |
| blank | blank | Produce a study of privately owned and operated parking in the metro-Boston region. Using fire department permits, or other publicly available information, calculate the number of parking spots available for public use in Boston and surrounding communities. This can be utilized by policy makers to determine the feasibility of a parking surcharge for parking in privately owned garages/lots in the future to fund local transportation initiatives. | Brian Kane, bkane@mbtaadvisoryboard.gov |
| blank | blank | How to identify long-term operation funding sources for on-demand transit options and how to expand on-demand transit in other regions, understanding that grants are not feasible for long-term operational funding. | Darlene Wynne, dwynne@beverlyma.gov |
| blank | blank | Take counts at key locations entering Boston inner of Bluebikes, regular bikes, skateboards, scooters and helmet use on each. | Jeffrey Ferris, jeffrey@ferriswheelbikeshop.com |
| blank | blank | Continue the freight decarbonization study for Boston Harbor North beyond the literature review to develop an actionable plan | Karl Allen, kallen@chelseama.gov |
| blank | blank | I work at UMass Boston as the Sustainability & Resiliency Planner. We draw students, staff, and faculty from a wide metropolitan area and want to provide a flexible range of commuter options. We also, for equity reasons, want to expand options to our first-generation, low-income students to have access to cost-saving and lower-carbon transportation modes through public transit and newer options such as electric bikes. Many studies are focused on traditional employees' commute times, but college students (especially ours, who often work full time too) have many different schedules than regular commute modes. We run a campus shuttle to the nearest T stop because the MBTA bus options are not sufficient. I would be interested in partnering with MPO to study this issue further and figuring out how public universities can partner with public transit entities to expand access to low-carbon commute options. | Janna Cohen-Rosenthal, janna.cohenrosenthal@umb.edu |
| blank | blank | Title: Comparative Analysis of Sidewalk Infrastructure Expenditure in MPO Communities: A Case for Pedestrian Infrastructure Investments and Local Implementation of Complete Streets Design Standards Introduction: The Boston Region Metropolitan Planning Organization (MPO) plays a crucial role in transportation planning and investment decisions in the region. As part of its commitment to promoting sustainable and accessible transportation options, it is essential to understand the current state of sidewalk infrastructure and the investment patterns of MPO communities. This study aims to conduct a comparative analysis of sidewalk infrastructure expenditure across MPO communities, with the goal of highlighting the need for pedestrian infrastructure investments and advocating for local implementation of Complete Streets design standards. Objectives: a) To assess the current state of sidewalk infrastructure in MPO communities. b) To compare and analyze the expenditure patterns of MPO communities on sidewalk infrastructure. c) To evaluate the correlation between sidewalk infrastructure expenditure and pedestrian safety and accessibility. d) To identify best practices and successful strategies for local implementation of Complete Streets design standards. e) To provide evidence-based recommendations for prioritizing pedestrian infrastructure investments and advocating for the adoption of Complete Streets design standards at the local level. Methodology: a) Data Collection: i) Conduct a comprehensive review of existing literature, reports, and studies on sidewalk infrastructure expenditure and complete streets design standards. ii) Collaborate with MPO communities to collect data on sidewalk infrastructure expenditure, including capital investments, maintenance costs, and repair expenses. iii) Gather information on pedestrian safety and accessibility indicators, such as pedestrian accidents and injuries, sidewalk conditions, and connectivity to key destinations. iv) Identify communities that have successfully implemented Complete Streets design standards and gather data on their experiences and outcomes. Data Analysis: i) Analyze the collected data to determine the variation in sidewalk infrastructure expenditure among MPO communities. ii) Examine the correlation between sidewalk infrastructure expenditure and pedestrian safety and accessibility indicators. iii) Compare the outcomes and benefits of communities that have implemented Complete Streets design standards with those that have not. Expected Outcomes: a) A comprehensive understanding of the current state of sidewalk infrastructure in MPO communities. b) Identification of the variation in sidewalk infrastructure expenditure among MPO communities. c) Assessment of the correlation between sidewalk infrastructure expenditure and pedestrian safety and accessibility indicators. d) Identification of best practices and successful strategies for local implementation of Complete Streets design standards. e) Evidence-based recommendations for prioritizing pedestrian infrastructure investments and advocating for the adoption of Complete Streets design standards at the local level. Conclusion: This study could to provide valuable insights into the expenditure patterns of MPO communities on sidewalk infrastructure and highlight the need for pedestrian infrastructure investments and local implementation of Complete Streets design standards. The findings and recommendations from this study will help the Boston Region Metropolitan Planning Organization make informed decisions regarding transportation planning, prioritization of investments, and policy advocacy for pedestrian-friendly infrastructure. |
Iolando Spinola, ispinola@walkboston.org |
| blank | blank | Realize and unlock the massive environmental and economic benefits of restoring rail-based mass transportation on existing abandoned and linear-park-converted railroad right of ways. It has long been touted that rail to trail conversion "preserves the right of way for future mass transportation use". That "future mass transportation use" need arrived years ago and it is well past the time to put these irreplaceable transportation corridors to good use in order to --fight climate change --provide practical, year round transportation for all citizens (instead of seasonal, recreational use which, for all intents and purposes, is how rail-trails are being used with little impact to car-based commuting - the MPO / MAPC's own project evaluation data supports this fact) --create practical alternatives to reduce freight movement by highway All it takes is an admission by the MPO that the above points are far more important than creating exclusive-use recreational linear parks used only by a tiny fraction of Massachusetts citizens. Climate change and transportation solutions must be driven with a holistic approach and cannot be derailed by individual special interests. Do the right thing MPO......for all of us! |
Kurt Marden, kurtm22@gmail.com |
| blank | blank | In FFY 2023, the MPO took on a study titled "Sustainability and Decarbonization in the North Suffolk Region." This entry proposes a continuation of this study, focused on developing a regional freight decarbonization action plan. Stakeholder engagement in this study revealed strong interest in advancing decarbonization strategies such as electric fleet transitions. At the same time, there are long standing challenges that various areas within the Boston region that have on-going initiatives to address. This study will convene a group of stakeholders in the freight industry throughout the Boston region, including Environmental Justice advocacy groups/CBOs, interested municipalities, and industry actors. MPO staff are well positioned to facilitate larger conversations throughout the region outlining actionable steps to achieve emissions reductions goals. | Erin Maguire, emaguire@ctps.org |
| blank | blank | The MPO funds dozens of projects each year, several of which aim to reduce congestion and improve air quality. While the MPO often makes projections about how air quality may improve after the completion of a project, the organization lacks a process for evaluating these outcomes in air quality on a project or localized basis. A study that evaluates the change in air quality metrics in close proximity to recently completed projects in the region would help inform future planning decisions. We would evaluate the change in air quality using PurpleAir monitors, which are small devices that can be installed on structures near roadways. These monitors can report Particulate Matter (pm 2.5 and pm 10) and Ozone levels, and both metrics are reported as part of Congestion Management and Air Quality performance reporting. Placing PurpleAir monitors near recently completed projects, especially Complete Streets-type projects that have a quantified estimate of decreased emissions, would allow MPO staff to evaluate the effectiveness of programs and projects that aim to reduce emissions. Since improving air quality is a function of both the Climate Resilience and Air Quality Program, as well as Performance-Based Planning and Programming, it is possible that such work would need only be partially funded by the UPWP, and that some funds for staff time could be found within those two programs. Funds for the study would be spent in three main areas: purchasing PurpleAir monitor equipment, MPO staff time, and Communications and Engagement outreach to local planners and organizations in municipalities where air quality would be evaluated. |
Sam Taylor, staylor@ctps.org |
| blank | blank | Micro-Mobility impacts, outlook, and planning implications. Electric micro-mobility, from scooters to e-bikes, is spreading rapidly across the region. Last mile distances are stretching to 'last miles.' How does this impact station 'walk sheds?' How are transit stations impacted? (micro-mobility storage? bike lane access? e-bike share locations?) Policies to accommodate micro-mobility on transit - Size? Batteries (safety)? Where? If not accommodate on transit - storage at stations? Policies to accommodate micro-mobility on existing bike infrastructure - Bike lane usage? Dedicated bike path usage? Speed restrictions? Conflict risk with other modes on this infrastructure? What are the maximum distances travelers are willing to travel on micro-mobility? Does it replace transit? Reg bikes? Walkers? Drivers? Can micro-mobility improve access to transit from 'transit deserts?' or underserved populations/areas? What are the impediments to broader adoption? Storage? Safety? Distance? Mode switching? Are there any safety risks associated with micro-mobility vehicles? |
Chris Counihan, chris.h.counihan@gmail.com |
| blank | blank | Hey MPO Team: I am very interested to understand current levels of multi-modal trips that occur between active modes (bikeshare, personal bikes or other micromobility form factors) and the MBTA. For example, how well utilized are T bike parking facilities? How about bike racks on MBTA buses? We know that most people – with the exception of drivers – do the same thing every day or on every trip. What we need to understand is how people are making mid-trip connections and what we can do to encourage and support those types of trips more. Happy to chat in person, if helpful! Best, Mully |
Scott Mullen, mully@abettercity.org |
| blank | blank | What should bike parking/storage look like that accounts for the growing popularity of e-bikes? E-bikes are growing in popularity in some areas of the United States. Yet, they are heavier, more expensive, and (in some cases, mostly refurbished bikes) have resulted in fires. Given these considerations, what does safe, secure bike infrastructure look like that could be built at scale in multi-family housing, including affordable housing? | Katharine Lusk, katharine.lusk@boston.gov |
| blank | blank | Expanding bike-share: As the BlueBikes system has matured in Metro Boston, the benefits for sustainable mobility have been amazing for myself personally. Going to cities like Salem has also been fantastic given the existence of a micro BlueBike network there has really expanded my mobility options and quality of life (taking the train to Salem and then being able to pick up a BlueBike to get where I need to go in town). What can be done to expand this to the rest of the commuter rail network, such that most of the major cities and towns outside of Boston are benefiting from a similar system (Lowell, Lawrence, Fitchburg, Lynn, Brockton, Worcester, Framingham, Norwood, etc.). I think the key really is having a unified, integrated system that spans the commonwealth, not 5+ different bikeshare systems operated by different jurisdictions. What can be done to integrate MBTA payment methods with BlueBikes fares? A study exploring options for expansion models, potential benefits and barriers, and formulating some recommended next steps/a pilot would be fantastic. | Andrew |
| blank | blank | Exploring the potential for 15-minute neighborhoods to promoting socio-economic benefits in Metro Boston. Where could the work and have the best outcomes? What would be needed to pull them off? Where could they be piloted? | Andrew |
| blank | blank | Study potential Infill locations along transit and commuter rail lines. This study should take into account both gaps in the walk zone, existing housing and job density and future development plans, as well as transit depended and vulnerable populations. Some intuitive locations to study on the rapid transit lines are around Medford Street in Malden or Rivers Edge in Medford on the Orange Line, Morrissey Boulevard and Redfield Street on the Braintree branch of the Red Line, near Mt Auburn Street and between Kendall and central (preferably close to the likely location of a station for any version of transit on the grand junction) on the trunk of the red line, and around Byron Street on the blue line. Additionally many commuter rail lines pass through areas of higher density with a further stop spacing than for many of their stops in less urban locations. If the MBTA is serious about a regional rail transformation that needs to be rectified. The commuter rail has served as a viable alternative during shutdowns on the Orange Line and other track work for some people. In order to enable more people to take advantage of this, and provide necessary redundancy as the T works to rebuild after decades of disinvestment. Many commuter rail lines have locations worth studying as well. On the Haverhill line & Newburyport/Rockport line Sullivan Square should likely be prioritized. The Fairmount line, as the only commuter rail line entirely in the city of Boston and in an area of the city otherwise lacking rapid transit should also be prioritized in moving towards a regional rail style service. Locations at River street and Columbia Road should be examined. On the Newburyport/Rockport lines locations to analyze for stations could be somewhere in Everett, Eastern Ave in Chelsea, Between Winthrop Ave and VFW Parkway and/or near Wonderland in Revere, and somewhere in southern Salem. Additionally making Riverworks a full stop and moving it north should be analyzed. Somerville has been left out on the Lowell line and stations should be considered at Tufts, East Somerville/Brickbottom, and possibly somewhere in between. Additionally a station at Montvale Ave in Woburn should be considered. Fitchburg line also has locations worthy of consideration including Union Square, Alewife, Brighton Street in Belmont, and Beaver Street in Waltham. It is good to see more concrete plans for West station on the Worcester line however there are more locations worth consideration such as around Brooks street, Parsons Street, or North Beacon street in Brighton, Newton corner, and around Shrewsbury street and Plantation street in Worcester. Finally on the Franklin/Foxboro & Providence/Stoughton lines a station you should study if a station should be returned to Canterbury Street/Cummins Highway. Any infill station conceivably improves accessibility to and utility of these lines but you should study potential locations and develop a priority list of infill stations to begin moving through development phases. |
Cole Rainey-Slavick, c.raineyslavick@gmail.com |
| blank | blank | The MPO should make a regional study of the various bicycle plans in the area: Boston Bike Network Plan, Cambridge Bicycle Plan, Somerville Bicycle Network Plan, Connect Arlington, the Sustainable Transportation Plan, Brookline Green Routes Bicycle Network Plan, Medford's Bicycle Infrastructure Master Plan, Lynn Walking and Bicycling Network Plan, Salem Bicycle Master Plan, City of Quincy Bicycle and Pedestrian Network Plan, Town of Milton Bicycle and Pedestrian Master Plan, Lexington's Town-wide Bicycle and Pedestrian Plan, Newton's Bicycle/Pedestrian Network Plan, Towns of Dedham & Westwood Bicycle and Pedestrian Network Plan, Needham Bike plan, Etc. This study should analyze whether these plans meet current standards and best practices in bike infrastructure, particularly the Separated Bike Lane Planning & Design Guide from MassDOT. It should also look at the proposed bike improvements on a regional scale, finding and proposing fixes for gaps in the networks created by municipal boundaries. |
Cole Rainey-Slavick, c.raineyslavick@gmail.com |
| blank | Regional Bicycle LTS Analysis | The Level of Traffic Stress (LTS) is a metric used to categorize how stressful it is to travel on a road or path. A bicycle LTS metric is often used in bike network planning to identify safe, comfortable bike routes throughout an area. Bike LTS metrics are currently used within Conveyal's routing algorithm and in different municipalities to support bicycle network planning (Boston and Cambridge). This study would allow the BRMPO to help coordinate a regional perspective to bike LTS assignment that could help identify regional needs for bike facility improvements. This project will 1) assess similarities and differences in existing bike LTS assignments in the Boston region, 2) develop a region-wide bike LTS metric for MPO planning efforts, and 3) identify a workflow to assess the impact of proposed bike facility improvements. Similar effort from DVRPC as reference: Bicycle LTS & Connectivity Analysis (https://www.dvrpc.org/webmaps/bike-lts/) |
Emily Domanico, edomanico@ctps.org |
| blank | blank | Improving approaches to public engagement for planning and envisioning transportation projects. This can include not only in-person or hybrid local and sub-regional planning activities or events, but efforts for novel regionwide public engagement to improve general awareness of MPO activities. This may not only include general 'branding' activities, but also efforts to adopt novel technologies such as project dashboards or new comment tracking software to improve two-way communications between the MPO and the public. 'Branding' efforts could incorporate additional attendance at public events or public awareness campaigns conducted in tandem with peer agencies. Investments in engagement materials (fliers, interactive displays, mascots/iconography) could be considered or evaluated for efficacy. | Ethan Lapointe, elapointe@ctps.org |
| blank | Title: Modeling Flood Impact on Destination Access | Motivation/Approach: CTPS has recently gained access to and begun analyzing the Woods Hole Group’s Massachusetts Coastal Flood Risk Model (MC-FRM) outputs, which detail exposure to coastal flood risk from 2018 to 2070. While initial work in the agency has estimated total population exposure to this risk, there has not yet been work in identifying how potential flooding might impact the transportation system for different populations in terms of destination access. Using the MC-FRM with other data sources (e.g., demographic data, elevation data, the Road Inventory, the OSM network, GTFS data, MBTA service alerts), staff would utilize Conveyal to measure this impact regionwide. Depending on data availability, this work could extend to include inland flooding as well, potentially as a future phase. Outcomes: Technical memo detailing motivation, methodology and initial results; potential for a relatively simple interactive app Notes: The primary unexplored analytical aspect of this work is devising a methodology for what links in the transportation system (including transit) might become flooded and unable to travel through as a result. Estimated budget of $60-70K. Supporting Work: This study builds well upon previous data work using MC-FRM or Conveyal (e.g. Equity Metrics dashboard, Applying Conveyal to TIP Scoring study). It could also build a foundation for future work to create modified GTFS files that reflect accessibility limitations. Additionally, this study could complement work involving the travel demand model and the MC-FRM. Applicable Themes/Programs: Resiliency, Equity |
Tanner Bonner, tbonner@ctps.org |
| blank | blank | Following on from work in the BPDA Plan:East Boston document, I think it is worth devoting some time to exploring different blue line extensions westward. Unlike many other recent transit extensions, such as the Green Line Extension, there is no historical route or 1950’s plan for the blue line to be extended west that we can follow. Instead, we as a metro area have a unique opportunity to develop a completely new routing free from historic precedent, and can try to connect the areas we think need connecting. Any transit extension will take a long time from planning to construction, but studying blue line extension routings now will put us a year or two ahead of the green line extension schedule, which first published extension route maps in 1926. | Sam Ghildardi, samghilardi@gmail.com |
| blank | blank | I would like to see a study about region wide rail with trails feasibility along side the regions rail lines. The Needham line, the Framingham/Worcester line, Walpole/Foxboro, Providence/Stoughton Braintree/Quincy, D Line from Newton, Fitchburg line, Lowell line ...etc all have potential to create a network of off street paths for active commuting. These paths could connect communities for short distance trips and offer longer distance active commuting trips to and from Boston. Gaps in service could be replaced with biking/micromobility. Most trains on these can handle a bike on board for true multimodal options. The MBTA generally allows a path offset 10' from center from the rail lines and most of these rail lines have the space to accommodate that offset. Review the success of the GLX community path in Somerville! | Timothy Bulger, tsbulger@gmail.com |
| blank | blank | Regional networks: are there bike/ped/transit corridors/connections that could exist across municipalities but don't? (because of differences in policy/funding/other limitations among municipalities) Where are the opportunities to make big impacts in our sustainable transportation networks? | Ryan McKinnon, rmckinnon@cambridgema.gov |
| blank | The Future of the Curb Phase IV - Exploring Electric Vehicle Charging and Car Sharing Curb Uses | Purpose The Future of the Curb Phase IV - Exploring Electric Vehicle Charging and Car Sharing Curb Uses will build on the previous Future of the Curb studies that provided references for planners as they adapt and manage curb space. Within the guidebook (Future of the Curb II), CTPS identified potential metrics to evaluate the success of curb management changes, and in this new study CTPS staff would continue to further these test methods. This phase would focus specifically on the effects of dedicating curb space towards the charging for EVs, as well as the effect of dedicating curb space towards dedicated car sharing parking. Both uses of curb space require limiting the curb available for novel uses of the curb, and the effectiveness and efficiency of these dedicated spaces should be measured to gain a better understanding of their value compared to other curb uses. With over $5 Billion allocated for EV charging so far, the National Electric Vehicle Infrastructure (NEVI) Formula and Grant Program is a necessary tool in our nation’s struggle to reduce our carbon emissions, to achieve the national and state goal of Net Zero by 2050. This massive volume of new funding specifically dedicated for EV charging opens the opportunity for communities to radically change the way vehicles are fueled. Similarly, recent debate around the transition to net zero has highlighted the need of mode shift, in addition to the transition from combustion vehicles to EVs. Car share has become a hot topic as a way to reduce private vehicle ownership, reduce SOV travel and greenhouse emissions, induce mode shift, and potentially subsidize access to the automobile network for low-income or no-vehicle household users. This study addresses resiliency, and uncertainty within our transportation network. This study relates to resilience efforts around the transition from fossil fuel based transportation to electric based transportation. Similarly, this study would support the uncertainty within these under-studied technologies and would help to further our Region’s understanding of the value of EV charging and dedicated Car Sharing parking. EV Charging is a novel use of the curb and this study could further the best practices created by previous iterations of Future of the Curb work. This study advances the MPO goals for Mobility and Reliability by helping planners adapt curb space to meet changing demands and expanding the realm of data available on these currently niche, but soon to be important curb uses. The study would further support the MPO’s goal of Clean Air and Healthy Communities, by supporting the further study of new fueling infrastructure that will be required as part of the goals to reach net zero emissions by 2050. Approach Staff will collect data to measure their efficacy through digital data sources available (such as municipal EV charging station session data and carsharing bookings through car sharing entities) and through in-person data collection efforts (such as turnover counts in parking spaces). Many factors could play into the usage of curbside public EV charging, such as the power and speed the EV charger is able to provide (Level 2 vs Level 3 charging), the cost of charging, additional parking fees, and whether the charging is located on a street curb or in a parking lot. For car sharing, factors such as vehicle utilization and cost of usage could be explored to understand utilization of dedicated car sharing spaces. CTPS staff will then analyze the results to compare the metrics throughout the region and generate a model to estimate the effect curb management changes will have on different community types. |
Logan Casey, lkcmaine@gmail.com |
| blank | Learning from Transit Outage and Closure Experiences | Purpose The need to plan for and respond to emergency situations in the Boston region is becoming more urgent year after year. Even the definition of an “emergency” could be expanded beyond traditional definitions to include MBTA maintenance shutdowns, weather-related incidents, climate impacts, and public health events, such as the need for social-distancing during the COVID-19 pandemic. Specifically, recent closures such as the MBTA’s Orange Line shutdown in August of 2022, as well as the closure of the Green Line Central Tunnel in January 2024 for emergency repair work has highlighted the need for additional transportation resilience strategies when critical transportation infrastructure are reduced or unavailable. In response to these significant closures in August of 2022, the MBTA and the City of Boston, among other partners, provided alternative transportation options including replacement bus services, as well as free, 45 minute Bluebike bikeshare trips to supplement service provided by the Orange Line. Additionally, the City implemented quick-build bike and bus lanes to ensure the replacement services were efficient, safe, and effective. These solutions helped to ease the discomfort related to the closure and offered a variety of ways for users to navigate the diversion. Looking forward, the region is expecting many additional maintenance closures, as well as ever-increasing risks of extreme weather, which continue to threaten the continuity and access afforded by the transit network. This study would be an opportunity to learn from past transit closure experiences, and provide recommendations on how to provide better substitute services and provide continuity of the transit network. The goals of this study will be to Study and document best practices and effective strategies (locally and nationally) for public transportation access during a variety of emergency situations Document how the use of temporary infrastructure during an emergency can be used as a demonstration project for permanent street changes This study advances the MPO goals for Reliability and Uncertainty by helping planners adapt to closure of significant parts of the transportation network and expanding the realm of knowledge and data regarding how to respond to these closure events. Furthermore, the study will help to clarify effective strategies to respond to planned closures, unexpected or emergency events. The study would further support the MPO’s goals of Mobility and Reliability, Access and Connectivity by supporting the continued availability and utility of the public transit network during times of emergency or unexpected outages. Further, it would support the MPO’s goal of resilience, by exploring potential substitutions and solutions for public transit when parts of the network are unavailable. Approach Staff will collect data to measure the effects of transit network shutdowns through data sources available (such as Bluebike trip data, MBTA shuttle replacement service data, cell phone data [such as StreetLight]) and potentially in-person data collection efforts (such as rider interviews) to better understand how the Bluebikes network can support the resilience of the transit network in emergency or unexpected circumstances. Further, CTPS could also document quick-build actions that were taken as part of the closure response, such as the implementation of quick-build bike and bus lanes. CTPS staff will then analyze the results to understand the effectiveness of the resilience strategies, such as creating alternative bus service, dedicated bus and bike lanes, and increasing service in the Bluebikes network to support public transportation needs during emergency situations. CTPS staff will generate a report to summarize the data and create recommendations of best practices for future closures or emergency events affecting all or portions of the transit network. Final deliverables will include Case studies including local and national examples of how public transportation systems have approached a variety of closures and emergencies A “how-to” guidebook to share with municipal staff, transit agencies, and regional planners to help them prepare for and respond to emergency situations |
Logan Casey, lkcmaine@gmail.com |
| blank | Multimodal Mobility Hub Feasibility | Multimodal mobility hub provides an integrated platform of mobility services, amenities, and activities to maximize transportation network and the first- and last-mile connectivity. They are integrated as a community focal point in the network for all modes of transportation. Multimodal mobility hubs are usually categorized into two types: A passenger hub and a freight hub. A passenger hub can include infrastructure for pedestrians, bicyclists, transit users, and others such as e-cargo bikes, bike share, electric scooter share, bus connections, park-and-ride facility (personal vehicles, personal bikes, personal e-scooters, etc). Examples of important activities supported by a freight hub includes the transition of goods from large trucks to more small and sustainable vehicles like e-cargo bikes and electric commercial vehicles for last-mile delivery. These considerations in how we use transportation for daily trips as well as the movement of goods help in improving safety, noise and air quality conditions. | Shravanthi Gopalan Narayanan, sgnarayanan@ctps.org |
| blank | Future of the Curb Phase IV | Future of the Curb Phase IV- Transit—This would be an extension of phase three of the future of the curb work, this time focusing on a transit-related project, such as one that would implement bus priority curb management strategies. The project would involve identifying the project, collecting before and after data, and performing analyses to asses the changes in curb space usage as a result of the intervention. This would most likely culminate in a technical memo. | Sophie Fox, sfox@ctps.org |
| blank | Decarbonizing the Freight Sector: Exploring the potential for using e-cargo bikes for first-/last-mile freight deliveries | Growing globalization coupled with a post-pandemic shift to online shopping has increased our dependence on freight, especially in urban areas. Urban societies rely on freight to serve a wide variety of needs, including but not limited to food, consumer goods, and fuel. However, residents have expressed concerns about the growing number of large trucks and freight delivery vehicles (e.g., Amazon vans) passing through and stopping in their neighborhoods. Some regions, both within the United States and around the world, are experimenting with a regional freight delivery system. Such a system depends on the establishment of neighborhood freight hubs to which freight vehicles transport their cargo, following which e-cargo bikes are used to provide the first-/last-mile connection from these hubs directly to people’s homes. In addition to ‘traditional’ freight deliveries, e-cargo bikes are also thought of as a promising alternative to car-oriented food delivery systems (e.g., Doordash, Uber Eats). The City of Boston is currently running a pilot called ‘Boston Delivers’ to this effect for local businesses in Allston and Brighton. Building on these recent efforts, MPO staff should explore the potential for establishing neighborhood freight hubs and using e-cargo bikes for first-/last-mile freight deliveries across the Boston region (or in the Inner Core, at the very least). This system could address the urgent need to decarbonize the freight sector, in addition to mitigating the various other concerns residents regularly voice over the increased presence of freight vehicles near their homes. | Rounaq Basu, rbasu@ctps.org |
| blank | Making the Data Walk: Improving the use of the Bike-Ped Count Data Application | MPO staff presented an enhanced version of the Bike-Ped Count Data Application in the February Board Meeting. While this was a much needed and welcome effort, we still have work to do to improve the use of this application so that diverse stakeholders can access and engage with the data for a wide variety of purposes without requiring programming, data analysis, or spatial analysis skills. Some useful features to include in the next version of this application include the ability to summarize data across a range of years, filter data by location and facility type, compare data across different locations and time, and visualize counts by mode succinctly. An important update to the “middleware” is also necessary to enable some of these features. In addition to these technical updates, staff need to work on expanding the data inventory using both manual and automated methods and improving stakeholder engagement with this application. Such an effort would be key to improving our knowledge of active mobility patterns and informing better active transportation planning in our region. | Rounaq Basu, rbasu@ctps.org |
| blank | Bikes and Trains: A marriage made in heaven, at loggerheads, or a mix of both (like most marriages)? | One of the most often cited challenges to using urban rail transit is the lack of decent first-/last-mile connections. Public bikesharing systems (such as Bluebikes) have the potential to address this concern by making it easier for some people to access rail transit stations. Of course, much depends on where the stations are located and who has the ability and willingness to bike (amidst valid concerns around safety and inclement weather, especially in our region). In recent years, MPO staff have engaged in several projects around bikesharing use in the region. Building on these prior efforts, it is time to examine a fundamental question: What is the relationship between Bluebikes and the T? Do Bluebikes really improve connectivity to the T, and, if so, what are the conditions that enable such a relationship? On the other hand, do people use Bluebikes as an alternative to the T, and, if so, what kinds of transit trips are most likely to be substituted? (As an aside, my money is on shorter trips, especially by bus.) This is a fundamental exploration to a better understanding of multimodality in the region, so that we can design a more efficient transit system that also accounts for the complementary as well as competitive nature of other modes. Extending this research, MPO staff could apply their analytic framework to examine the effect of transit service disruptions (such as the Orange Line shutdown or more recent service disruptions, especially along the Green Line) on Bluebikes usage. To what extent did ‘usual’ transit riders use Bluebikes when transit was not available or was simply too onerous to use? | Rounaq Basu, rbasu@ctps.org |
| blank | Mode Shift: What would it take to move the needle? | Several municipalities across the country, including the City of Boston, have released Climate Action Plans that include ambitious mode shift targets. For example, the City of Boston hopes to achieve a mode shift to the effect of 75% of trips being made by non-auto modes by 2030. How are these cities going to get there? What mix of policy strategies can help them hit these lofty goals? How are they monitoring progress towards these goals? MPO staff should conduct a literature review of some of these Climate Action Plans to find answers to these questions, and explore case studies of successful mode shift implementation both within and beyond the United States with an eye towards parsing out what would be most valuable and effective for our region. While many of us know what policy levers would be needed to achieve these targets (e.g., more reliable and expanded transit service, safer conditions for walking and biking, parking space reductions, land use changes), we need to learn from those who have been more successful than us about how they were able to move from idea conceptualization to successful operationalization. How did they manage and coordinate interactions with partner agencies and synergistic policy goals? Perhaps a high-level analysis, along the lines of the ‘Sources of Community Value’ study, could also be done to estimate the impact of each individual policy strategy (e.g., to what extent would Bluebikes network expansion aid in mode shift?). | Rounaq Basu, rbasu@ctps.org |
| blank | Roadway Pricing: Balancing the need for a transition to sustainable mobility with equity considerations | MPO staff recently presented their takeaways from interviews with a range of roadway pricing program administrators around the country and proposed key recommendations for us to keep in mind as we think about a similar strategy in our region. With widespread adoption of electric vehicles looming on the horizon (and being encouraged by both the State and the Federal administrations), the gas tax is unlikely to remain a viable fiscal source to support public transit. While electric vehicles may have lower tailpipe emissions than their fossil fuel-fueled counterparts, they are unlikely to be a silver bullet for the many challenges associated with auto-dependence. MPO staff can build on their recent study to further explore the idea of roadway pricing, but with more focused attention to the Boston region. Using data from the MA Vehicle Census and Replica, MPO staff should be able to examine vehicle miles traveled by different communities within our region. Such an analysis could allow us to provide rough estimates of revenue generated by different pricing strategies (such as cordon pricing around a particular central zone, or a direct tax on miles traveled). It would also be possible to examine the disparate impacts of such policies on different communities and, thereby, advocate for targeted discounts or subsidies for EJ communities and those who are forced into car ownership by a lack of high-quality alternatives. | Rounaq Basu, rbasu@ctps.org |
| blank | MBTA Study Concepts, Winter 2024: Understanding Suburban Change and Impacts to Transit Demand | (Updated from a 2024 proposal) There is a common narrative that the suburbs, both nationally and in the Boston area, are changing. MBTA would like to better understand how that change is happening; to what extent, and where, narratives of change and available demographic data match up; and what that means for transit demand current and future. Tasks may include 1. Task 1: Qualitative engagement with suburban stakeholders to identify perceptions of change and changing need 2. Task 2: Analysis of demographic data 3. Task 3: Analysis of suburban transit provision, by MBTA, RTAs, or other operators, relative to peer metros 4. Task 4: Identifying priority areas for transit improvement This concept partially follows up on the work done in the FFY 2022 UPWP study “An Exploration of Destination Access and Transportation Cost Analyses.” Among other things, that study examined demographic change from the 2010 Census to the 2020 Census, and used 2020 Census data to examine destination access for protected populations. We propose expanding the analysis to include the 2000 Census, giving a longer-term view of demographic change over time, and exploring the ability to use destination access tools and past transit schedule data to examine change in destination access over time. In turn, this analysis would be used to analyze the impact those changes might have on demand for transit. It could also draw on a scope Steven Andrews has previously developed to analyze the quantitative elements of this type of research. |
Sandy Johnston, sjohnston2@mbta.com |
Table C-2
Studies Funded in the UPWP, by Category, FFYs 2018–25
| blank | FFY 2018 | FFY 2019 | FFY 2020 | FFY 2021 | FFY 2022 | FFY 2023 | FFY 2024 | FFY 2025 |
| Active Transportation | 1 | 1 | 1 | 1 | 1 | 3 | 1 | blank |
| Land Use, Environment, and Economy | 1 | 1 | 0 | 1 | 3 | 0 | 0 | blank |
| Roadway and Multimodal Mobility | 5 | 6 | 4 | 5 | 5 | 1 | 1 | 2 |
| Transit | 2 | 1 | 3 | 2 | 1 | 4 | 0 | blank |
| Transportation Equity | – | 0 | 1 | 0 | 1 | 4 | 1 | blank |
| Resilience | – | 0 | 1 | 1 | 0 | 0 | 1 | blank |
| Other | 1 | 1 | 1 | 3 | 1 | 0 | 0 | 1 |
| Total | 10 | 10 | 11 | 13 | 12 | 12 | 4 | 3 |
This Appendix summarizes the geographic distribution of the Metropolitan Planning Organization (MPO)-funded work products produced by MPO staff (the Central Transportation Planning Staff) and the staff of the Metropolitan Area Planning Council (MAPC) during federal fiscal years (FFY) 2020 through 2024, as well as work products expected to be completed by the end of FFY 2024. The narrative below describes the methodology used to compile this information, as well as potential use cases for these data to inform and guide public involvement and regional equity considerations.
The purpose of this data collection is to better understand the geographic spread of Unified Planning Work Program (UPWP) work products (that is, reports and technical memoranda) throughout the Boston region. This analysis provides an initial glimpse at which communities and areas of the metropolitan region have benefited from transportation studies and analyses (or have received technical support) conducted by the MPO staff with continuing, comprehensive, and cooperative (3C) planning funds.
In addition, this Appendix includes a preliminary analysis of the distribution of MPO work products to minority populations, low-income populations, and people with limited English proficiency (LEP) based on their share of the population and the median income in each municipality. This is an initial approach to assess how MPO studies may benefit these populations. To further analyze this work, a pair of maps were developed that display the geographic spread of the 2024 work products.
Table D-1 presents a summary of UPWP tasks completed from FFY 2020 through FFY 2024 that resulted in benefits to specific municipalities, aggregated to the subregional level. Figure D-1 is a map that displays the 2024 results geographically. Table D-2 presents the information from Table D-1 disaggregated by municipality, and Figure D-2 maps these results. Studies that had a regional focus are presented in Table D-3.
The geographic distribution of UPWP studies (those benefiting specific communities and those benefiting a wider portion of the region) can inform the UPWP funding decisions made for each FFY. When considered in combination with other information, the geographic distribution of MPO-funded UPWP studies can help guide the MPO’s public outreach to ensure that, over time, we are meeting needs throughout the region.
Table D-1
Summary of Distribution of Work Products by FFY and Subregion
Subregion |
Number of Work Products |
Demographics |
||||||||
Name |
FFY 2020 |
FFY 2021 |
FFY 2022 |
FFY 2023 |
FFY 2024 |
FFYs 2020-24 Total |
Total Population |
Percent Minority |
Percentage of Residents in Poverty |
Percentage of Residents with LEP |
ICC |
17 |
14 |
20 |
46 |
21 |
118 |
1,759,970 |
48.20% |
25.40% |
16.10% |
MAGIC |
9 |
6 |
4 |
13 |
5 |
37 |
181,858 |
26.80% |
9.20% |
5.40% |
MWRC |
0 |
9 |
3 |
4 |
5 |
21 |
250,783 |
33.80% |
14.70% |
11.40% |
NSPC |
1 |
1 |
1 |
2 |
3 |
8 |
217,978 |
19.80% |
10.90% |
5.20% |
NSTF |
4 |
1 |
6 |
4 |
4 |
19 |
297,068 |
16.90% |
16.70% |
5.80% |
SSC |
3 |
1 |
9 |
2 |
5 |
20 |
224,764 |
17.50% |
13.00% |
4.40% |
SWAP |
0 |
3 |
1 |
1 |
2 |
7 |
149,159 |
19.60% |
11.40% |
5.90% |
TRIC |
14 |
10 |
10 |
7 |
5 |
46 |
275,614 |
29.10% |
12.50% |
6.70% |
Regionwide Total |
48 |
45 |
54 |
79 |
50 |
276 |
3,357,194 |
36.50% |
19.50% |
11.50% |
Notes:
LEP is tabulated for the population aged five years and older, the minority population and population in poverty are for the entire region.
People who identify as minority are those who identify as a race other than White or as Hispanic or Latino/a/x.
Sources:
Minority population: U.S. Census Bureau; Decennial Census, Table P2 (Race); generated by CTPS; using api.census.gov (2023-03-27).
Low-income population: U.S. Census Bureau; American Community Survey, 2017-2021 American Community Survey 5-Year Estimates, Table C17002 (Income Level), generated by CTPS; using api.census.gov; (2023-03-27).
People with LEP: U.S. Census Bureau; American Community Survey, 2017-2021 American Community Survey 5-Year Estimates, Table B16004 (Limited English Proficiency), generated by CTPS; using api.census.gov; (2023-03-27).
Median Household Income: U.S. Census Bureau; American Community Survey, 2017-2021 American Community Survey 5-Year Estimates, Table B19013 (Median Household Income), generated by CTPS; using api.census.gov; (2023-03-27).
Figure D-1
Map of 2024 Work Products by Subregion
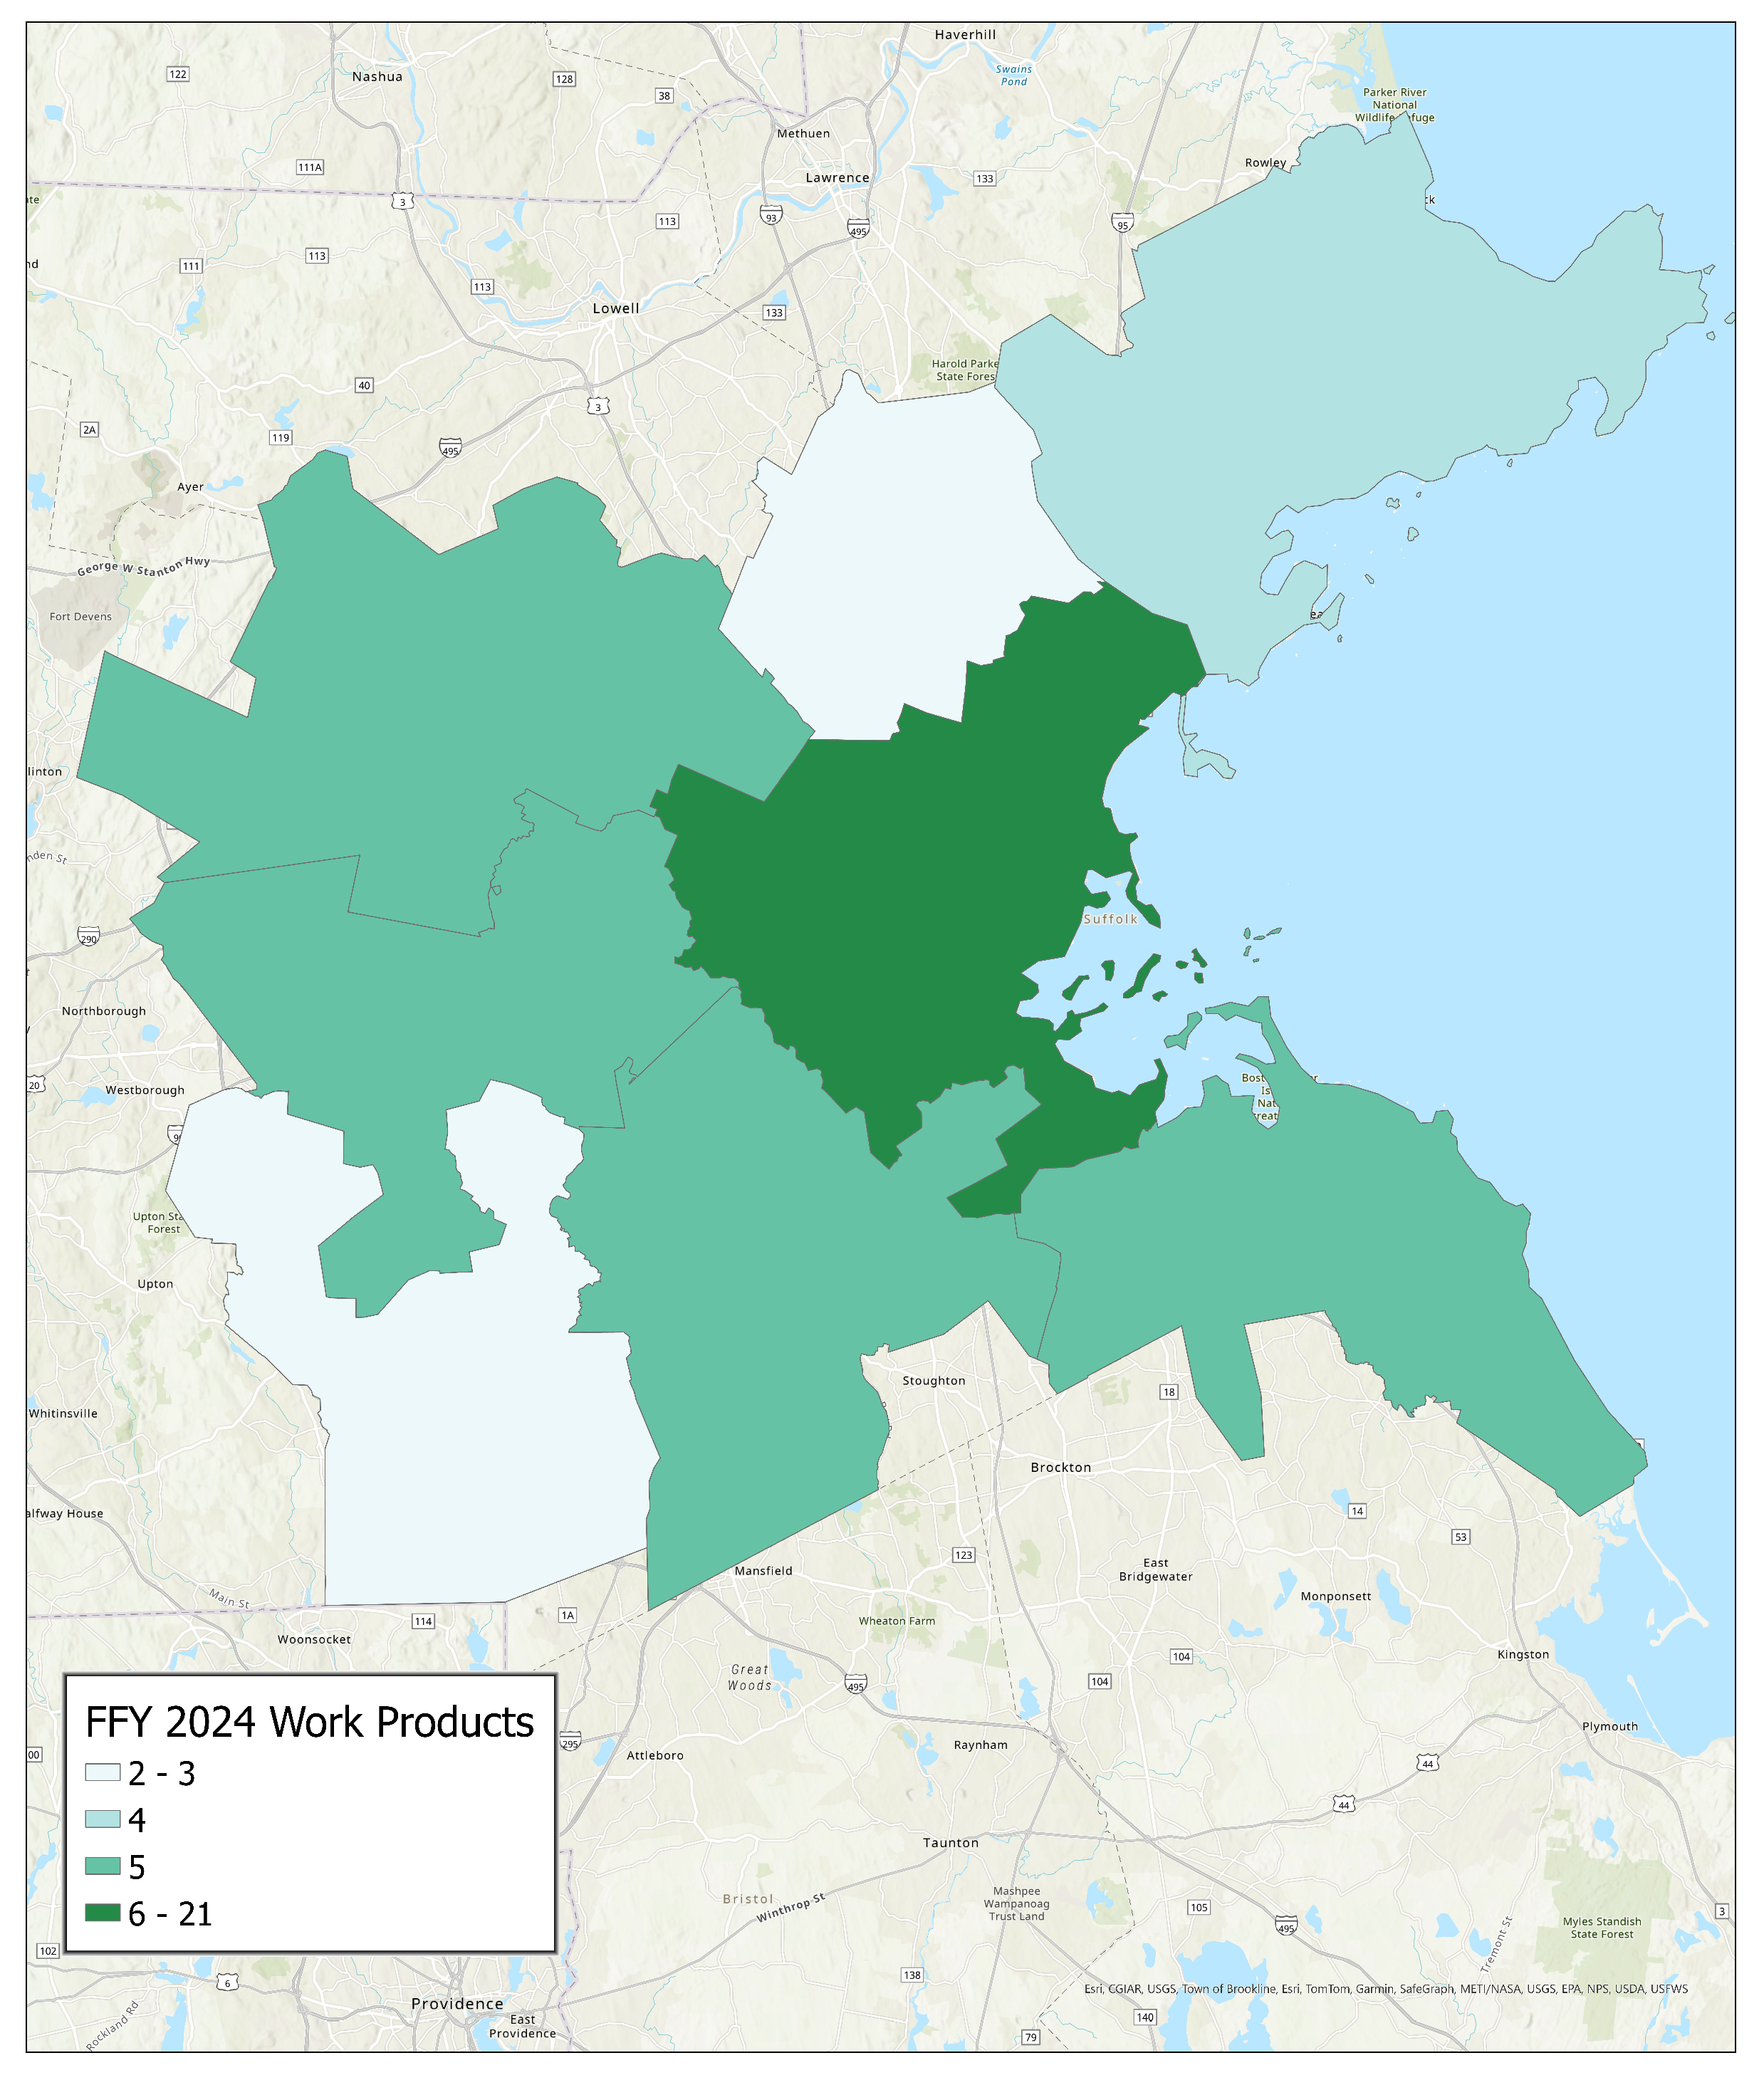
As noted above, this analysis examined work conducted in FFYs 2020 through 2024. To generate information on the number of UPWP studies during these FFYs that benefitted specific cities and towns in the Boston region, MPO staff performed the following tasks:
Table D-2 shows the number of completed MPO-funded UPWP work products from FFY 2020 through FFY 2024 that are determined to provide benefits to specific municipalities. Studies and technical analyses are grouped by the year in which they were completed, rather than the year in which they were first programmed in the UPWP. Examples of the types of studies and work in the table include the following:
Figure D-2 maps these results for FFY 2023.
The data in the tables show that there is not a strong relationship between the percent of the population in municipalities who identify as minority and the number of studies conducted in the municipality since 2019. The same is true for the percent of the population in poverty or with LEP. This suggests that studies are not always distributed equitably; if they were, we would expect to see the number of studies increase with the percent of people who identify as minority, have a low income, or have LEP, and where there is a lower median income.
With regards to geographic distribution, the Inner Core Committee (ICC) subregion, has had the most studies since 2019, with 557, but also the highest population, with 1,759,970 people. It also has the highest ratio of studies per person, followed by the Minuteman Advisory Group on Interlocal Coordination (MAGIC) and the Three Rivers Interlocal Council (TRIC). The South West Advisory Planning Committee (SWAP) has the lowest. This suggests that municipalities in the ICC, MAGIC, and TRIC subregions receive disproportionately more studies than municipalities in other subregions.
As the MPO considers studies to fund in future years, it should consider prioritizing funding in those municipalities that have received less funding in the past and where many minority, low-income, and/or people with LEP live.
Table D-2
Number of UPWP Tasks by FFY and Municipality, Grouped by Subregion
| Municipality | Number of Work Products | Demographics | |||||||||
| 2020 | 2021 | 2022 | 2023 | 2024 | 2020-24 Total | Total Population | Percent Minority | Percentage of Residents in Poverty | Percentage of Residents with LEP | Median Income | |
| Arlington | 1 | 0 | 0 | 3 | 1 | 5 | 46,308 | 24.80% | 11.20% | 6.00% | $136,312 |
| Belmont | 0 | 0 | 1 | 0 | 0 | 1 | 27,295 | 30.40% | 7.80% | 8.30% | $164,918 |
| Boston | 3 | 5 | 11 | 8 | 5 | 32 | 675,647 | 55.40% | 31.20% | 16.10% | $89,212 |
| Brookline | 3 | 0 | 1 | 2 | 1 | 7 | 63,191 | 34.70% | 16.30% | 8.40% | $130,600 |
| Cambridge | 1 | 0 | 0 | 2 | 1 | 4 | 118,403 | 44.60% | 19.80% | 8.30% | $121,539 |
| Chelsea | 2 | 1 | 0 | 3 | 1 | 7 | 40,787 | 79.80% | 42.10% | 42.60% | $71,051 |
| Everett | 2 | 0 | 0 | 3 | 4 | 9 | 49,075 | 65.90% | 35.90% | 31.40% | $77,796 |
| Lynn | 0 | 1 | 1 | 2 | 0 | 4 | 101,253 | 65.90% | 33.40% | 27.00% | $70,046 |
| Malden | 0 | 1 | 0 | 3 | 1 | 5 | 66,263 | 60.00% | 29.80% | 26.30% | $90,295 |
| Medford | 1 | 0 | 0 | 1 | 1 | 3 | 59,659 | 33.20% | 18.60% | 9.70% | $114,863 |
| Melrose | 0 | 1 | 0 | 2 | 0 | 3 | 29,817 | 20.40% | 11.30% | 6.10% | $126,305 |
| Newton | 1 | 0 | 1 | 2 | 1 | 5 | 88,923 | 29.90% | 9.30% | 6.80% | $176,373 |
| Quincy | 1 | 2 | 3 | 3 | 1 | 10 | 101,636 | 45.80% | 23.80% | 20.50% | $90,668 |
| Revere | 1 | 1 | 0 | 3 | 1 | 6 | 62,186 | 55.10% | 29.60% | 32.70% | $78,968 |
| Saugus | 0 | 0 | 0 | 0 | 0 | 0 | 28,619 | 24.90% | 17.20% | 8.20% | $96,064 |
| Somerville | 0 | 2 | 0 | 5 | 1 | 8 | 81,045 | 34.80% | 19.60% | 10.00% | $120,778 |
| Waltham | 0 | 0 | 1 | 0 | 0 | 1 | 65,218 | 39.60% | 19.90% | 9.70% | $113,443 |
| Watertown | 1 | 0 | 1 | 2 | 1 | 5 | 35,329 | 26.90% | 12.90% | 9.90% | $117,625 |
| Winthrop | 0 | 0 | 0 | 2 | 1 | 3 | 19,316 | 21.10% | 17.80% | 7.20% | $98,901 |
| ICC Subtotals | 17 | 14 | 20 | 46 | 21 | 118 | 1,759,970 | 48.20% | 25.40% | 16.10% | N/A |
| Acton | 3 | 0 | 0 | 1 | 2 | 6 | 24,021 | 36.90% | 10.00% | 8.30% | $150,482 |
| Bedford | 0 | 0 | 1 | 2 | 1 | 4 | 14,383 | 26.50% | 11.50% | 7.50% | $143,736 |
| Bolton | 0 | 0 | 0 | 0 | 0 | 0 | 5,665 | 13.50% | 6.80% | 2.20% | $191,208 |
| Boxborough | 0 | 0 | 0 | 0 | 0 | 0 | 5,506 | 32.90% | 8.60% | 6.00% | $151,207 |
| Carlisle | 0 | 0 | 0 | 0 | 0 | 0 | 5,237 | 21.20% | 5.60% | 2.70% | $247,656 |
| Concord | 1 | 2 | 1 | 3 | 0 | 7 | 18,491 | 18.20% | 7.50% | 2.70% | $184,086 |
| Hudson | 0 | 1 | 0 | 0 | 0 | 1 | 20,092 | 21.40% | 13.40% | 9.60% | $103,086 |
| Lexington | 1 | 1 | 1 | 1 | 0 | 4 | 34,454 | 43.30% | 7.20% | 7.30% | $206,323 |
| Lincoln | 1 | 1 | 0 | 1 | 0 | 3 | 7,014 | 23.80% | 15.60% | 4.50% | $158,894 |
| Littleton | 1 | 0 | 0 | 1 | 0 | 2 | 10,141 | 16.90% | 12.50% | 1.40% | $151,488 |
| Maynard | 1 | 0 | 0 | 1 | 1 | 3 | 10,746 | 17.00% | 13.60% | 2.80% | $112,524 |
| Stow | 0 | 0 | 0 | 0 | 1 | 1 | 7,174 | 14.30% | 7.10% | 2.20% | $166,833 |
| Sudbury | 1 | 1 | 1 | 3 | 0 | 6 | 18,934 | 19.10% | 3.00% | 1.90% | $234,427 |
| MAGIC Subtotals | 9 | 6 | 4 | 13 | 5 | 37 | 181,858 | 26.80% | 9.20% | 5.40% | N/A |
| Ashland | 0 | 1 | 0 | 1 | 1 | 3 | 18,832 | 31.50% | 8.90% | 8.90% | $124,311 |
| Framingham | 0 | 1 | 1 | 2 | 1 | 5 | 72,362 | 46.30% | 21.60% | 18.60% | $94,909 |
| Holliston | 0 | 1 | 0 | 0 | 1 | 2 | 14,996 | 15.80% | 8.50% | 3.70% | $149,614 |
| Marlborough | 0 | 1 | 0 | 0 | 0 | 1 | 41,793 | 40.90% | 24.30% | 17.30% | $94,199 |
| Natick | 0 | 1 | 1 | 0 | 1 | 3 | 37,006 | 24.40% | 9.60% | 7.20% | $133,605 |
| Southborough | 0 | 1 | 0 | 0 | 1 | 2 | 10,450 | 24.50% | 7.20% | 6.20% | $186,432 |
| Wayland | 0 | 1 | 1 | 0 | 0 | 2 | 13,943 | 23.20% | 6.10% | 3.90% | $208,750 |
| Wellesley | 0 | 1 | 0 | 0 | 0 | 1 | 29,550 | 26.70% | 6.20% | 4.80% | $250,001 |
| Weston | 0 | 1 | 0 | 1 | 0 | 2 | 11,851 | 26.00% | 10.60% | 4.40% | $250,001 |
| MWRC Subtotals | 0 | 9 | 3 | 4 | 5 | 21 | 250,783 | 33.80% | 14.70% | 11.40% | N/A |
| Burlington | 0 | 0 | 0 | 0 | 1 | 1 | 26,377 | 30.00% | 13.40% | 4.80% | $133,936 |
| Lynnfield | 0 | 0 | 0 | 0 | 0 | 0 | 13,000 | 13.50% | 14.10% | 5.10% | $160,931 |
| North Reading | 0 | 0 | 0 | 0 | 1 | 1 | 15,554 | 11.50% | 6.50% | 2.80% | $141,442 |
| Reading | 0 | 0 | 0 | 0 | 0 | 0 | 25,518 | 12.80% | 8.40% | 2.90% | $154,662 |
| Stoneham | 0 | 0 | 0 | 0 | 0 | 0 | 23,244 | 18.60% | 11.70% | 7.00% | $112,935 |
| Wakefield | 0 | 1 | 1 | 2 | 1 | 5 | 27,090 | 14.30% | 10.40% | 3.20% | $125,592 |
| Wilmington | 1 | 0 | 0 | 0 | 0 | 1 | 23,349 | 13.80% | 8.90% | 2.50% | $151,034 |
| Winchester | 0 | 0 | 0 | 0 | 0 | 0 | 22,970 | 25.40% | 7.20% | 5.30% | $208,531 |
| Woburn | 0 | 0 | 0 | 0 | 0 | 0 | 40,876 | 27.20% | 14.30% | 9.70% | $104,780 |
| NSPC Subtotals | 1 | 1 | 1 | 2 | 3 | 8 | 217,978 | 19.80% | 10.90% | 5.20% | N/A |
| Beverly | 1 | 0 | 1 | 1 | 0 | 3 | 42,670 | 15.40% | 19.20% | 4.20% | $99,525 |
| Danvers | 0 | 0 | 1 | 0 | 0 | 1 | 28,087 | 12.70% | 10.10% | 3.40% | $116,636 |
| Essex | 0 | 0 | 0 | 0 | 0 | 0 | 3,675 | 7.50% | 15.70% | 1.30% | $133,553 |
| Gloucester | 0 | 0 | 0 | 0 | 0 | 0 | 29,729 | 11.70% | 22.20% | 5.00% | $84,465 |
| Hamilton | 0 | 0 | 0 | 0 | 1 | 1 | 7,561 | 11.10% | 8.40% | 0.80% | $138,250 |
| Ipswich | 0 | 0 | 0 | 0 | 1 | 1 | 13,785 | 9.00% | 12.60% | 1.90% | $123,266 |
| Manchester-by-the-Sea | 0 | 0 | 1 | 1 | 0 | 2 | 5,395 | 6.70% | 7.10% | 0.90% | $209,052 |
| Marblehead | 0 | 0 | 0 | 0 | 0 | 0 | 20,441 | 9.20% | 9.90% | 2.20% | $164,104 |
| Middleton | 0 | 0 | 0 | 0 | 0 | 0 | 9,779 | 15.70% | 8.50% | 6.00% | $168,245 |
| Nahant | 0 | 0 | 0 | 0 | 0 | 0 | 3,334 | 9.00% | 11.90% | 1.20% | $105,867 |
| Peabody | 1 | 0 | 1 | 0 | 0 | 2 | 54,481 | 22.70% | 17.10% | 9.80% | $91,125 |
| Rockport | 0 | 0 | 0 | 0 | 0 | 0 | 6,992 | 6.90% | 13.60% | 0.40% | $95,091 |
| Salem | 1 | 1 | 2 | 2 | 2 | 8 | 44,480 | 31.50% | 26.70% | 10.00% | $79,196 |
| Swampscott | 1 | 0 | 0 | 0 | 0 | 1 | 15,111 | 14.20% | 14.80% | 9.80% | $118,646 |
| Topsfield | 0 | 0 | 0 | 0 | 0 | 0 | 6,569 | 10.00% | 8.50% | 3.80% | $162,734 |
| Wenham | 0 | 0 | 0 | 0 | 0 | 0 | 4,979 | 12.60% | 9.70% | 2.00% | $181,982 |
| NSTF Subtotals | 4 | 1 | 6 | 4 | 4 | 19 | 297,068 | 16.90% | 16.70% | 5.80% | N/A |
| Braintree | 1 | 0 | 1 | 1 | 0 | 3 | 39,143 | 29.90% | 13.20% | 9.20% | $120,593 |
| Cohasset | 0 | 0 | 1 | 0 | 0 | 1 | 8,381 | 7.20% | 8.00% | 1.40% | $178,013 |
| Hingham | 1 | 1 | 2 | 0 | 1 | 5 | 24,284 | 8.50% | 7.40% | 2.10% | $170,326 |
| Holbrook | 0 | 0 | 0 | 0 | 1 | 1 | 11,405 | 34.40% | 17.60% | 3.30% | $96,920 |
| Hull | 0 | 0 | 1 | 1 | 0 | 2 | 10,072 | 8.30% | 9.30% | 0.40% | $128,022 |
| Marshfield | 0 | 0 | 1 | 0 | 0 | 1 | 25,825 | 6.80% | 14.50% | 0.90% | $118,750 |
| Norwell | 1 | 1 | 1 | 0 | 0 | 3 | 11,351 | 8.80% | 6.80% | 1.90% | $179,777 |
| Rockland | 0 | 0 | 0 | 0 | 1 | 1 | 17,803 | 17.50% | 17.70% | 2.90% | $98,295 |
| Scituate | 0 | 0 | 1 | 0 | 0 | 1 | 19,063 | 6.60% | 9.80% | 1.90% | $127,173 |
| Weymouth | 0 | 0 | 1 | 0 | 2 | 3 | 57,437 | 22.60% | 16.00% | 6.60% | $95,879 |
| SSC Subtotals | 3 | 1 | 9 | 2 | 5 | 20 | 224,764 | 17.50% | 13.00% | 4.40% | N/A |
| Bellingham | 0 | 0 | 0 | 0 | 0 | 0 | 16,945 | 14.60% | 13.50% | 3.80% | $116,152 |
| Franklin | 0 | 0 | 0 | 0 | 0 | 0 | 33,261 | 14.90% | 9.40% | 3.10% | $138,062 |
| Hopkinton | 0 | 0 | 0 | 0 | 0 | 0 | 18,758 | 26.80% | 7.70% | 3.10% | $191,439 |
| Medway | 0 | 0 | 1 | 1 | 0 | 2 | 13,115 | 11.70% | 10.10% | 3.10% | $165,614 |
| Milford | 0 | 1 | 0 | 0 | 0 | 1 | 30,379 | 34.00% | 20.80% | 17.70% | $92,843 |
| Millis | 0 | 0 | 0 | 0 | 0 | 0 | 8,460 | 12.00% | 13.00% | 5.30% | $140,816 |
| Norfolk | 0 | 0 | 0 | 0 | 1 | 1 | 11,662 | 15.90% | 3.00% | 0.80% | $182,716 |
| Sherborn | 0 | 1 | 0 | 0 | 0 | 1 | 4,401 | 18.30% | 2.80% | 1.30% | $242,688 |
| Wrentham | 0 | 1 | 0 | 0 | 1 | 2 | 12,178 | 10.40% | 8.30% | 0.80% | $151,833 |
| SWAP Subtotals | 0 | 3 | 1 | 1 | 2 | 7 | 149,159 | 19.60% | 11.40% | 5.90% | N/A |
| Canton | 3 | 0 | 1 | 1 | 0 | 5 | 24,370 | 27.10% | 10.20% | 5.30% | $130,134 |
| Dedham | 2 | 1 | 1 | 0 | 1 | 5 | 25,364 | 22.00% | 13.70% | 5.90% | $118,877 |
| Dover | 0 | 1 | 0 | 0 | 0 | 1 | 5,923 | 19.20% | 4.20% | 3.30% | $250,001 |
| Foxborough | 2 | 1 | 0 | 0 | 0 | 3 | 18,618 | 16.40% | 17.10% | 3.10% | $104,350 |
| Medfield | 0 | 1 | 0 | 0 | 0 | 1 | 12,799 | 12.50% | 9.10% | 1.00% | $215,099 |
| Milton | 1 | 3 | 2 | 1 | 1 | 8 | 28,630 | 29.00% | 12.30% | 4.10% | $170,531 |
| Needham | 0 | 0 | 1 | 1 | 1 | 3 | 32,091 | 18.90% | 6.60% | 4.60% | $206,261 |
| Norwood | 2 | 1 | 2 | 2 | 0 | 7 | 31,611 | 27.50% | 18.70% | 11.30% | $98,653 |
| Randolph | 0 | 0 | 1 | 1 | 1 | 3 | 34,984 | 73.40% | 21.30% | 17.10% | $94,905 |
| Sharon | 0 | 0 | 0 | 1 | 1 | 2 | 18,575 | 33.20% | 3.40% | 5.90% | $181,545 |
| Walpole | 2 | 1 | 1 | 0 | 0 | 4 | 26,383 | 17.10% | 10.90% | 3.40% | $151,875 |
| Westwood | 2 | 1 | 1 | 0 | 0 | 4 | 16,266 | 17.20% | 9.20% | 3.00% | $192,887 |
| TRIC Subtotals | 14 | 10 | 10 | 7 | 5 | 46 | 275,614 | 29.10% | 12.50% | 6.70% | N/A |
| Grand Total | 48 | 45 | 54 | 79 | 50 | 276 | 3,357,194 | 36.50% | 19.50% | 11.50% | N/A |
Notes:
Limited English proficiency is tabulated for the population aged five and older, the minority population and population in poverty are for the entire region.
People who identify as minority are those who identify as a race other than White or as Hispanic or Latino/a/x.
Sources:
Minority population: U.S. Census Bureau; Decennial Census, Table P2 (Race); generated by CTPS; using api.census.gov (2023-03-27).
Low-income population: U.S. Census Bureau; American Community Survey, 2017-2021 American Community Survey 5-Year Estimates, Table C17002 (Income Level), generated by CTPS; using api.census.gov; (2023-03-27).
People with LEP: U.S. Census Bureau; American Community Survey, 2017-2021 American Community Survey 5-Year Estimates, Table B16004 (Limited English Proficiency), generated by CTPS; using api.census.gov; (2023-03-27).
Median Household Income: U.S. Census Bureau; American Community Survey, 2017-2021 American Community Survey 5-Year Estimates, Table B19013 (Median Household Income), generated by CTPS; using api.census.gov; (2023-03-27).
Figure D-2
Map of 2023 UPWP Tasks by Municipality
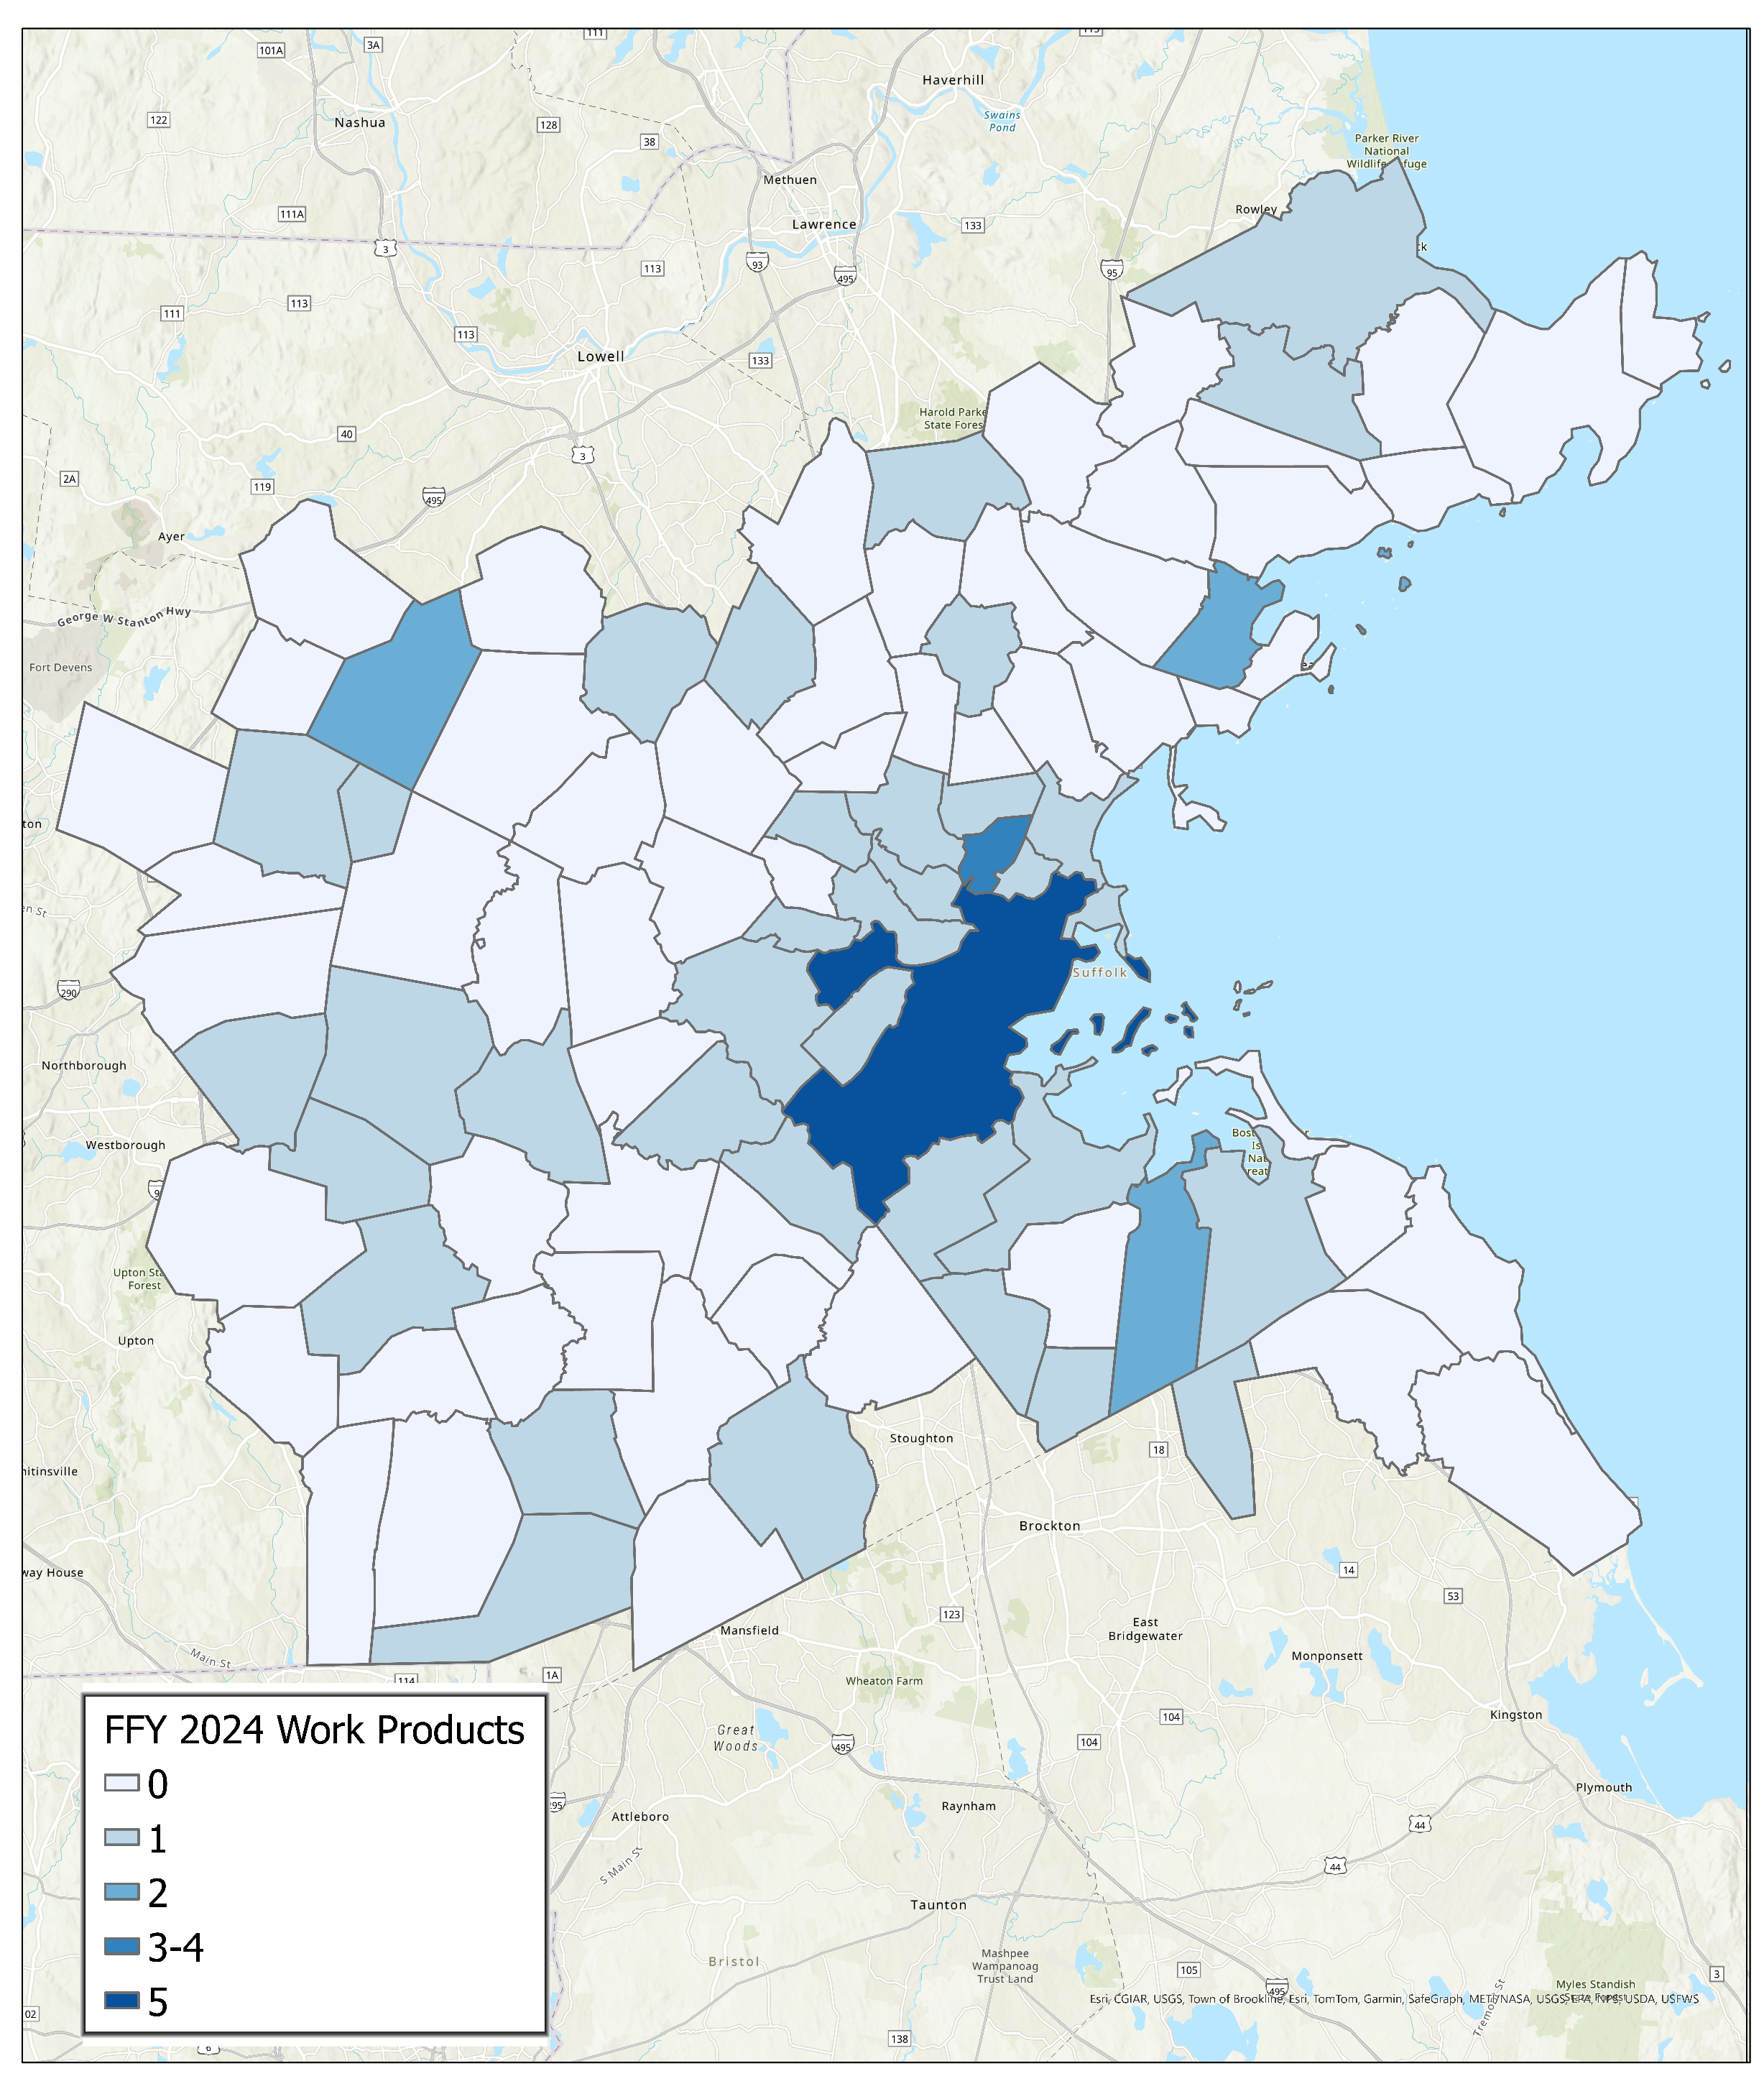
In addition to work that benefits specific municipalities, many projects funded by the MPO through the UPWP have a regional focus. Table D-3 lists MPO-funded UPWP studies completed from 2019 through 2023 that were regional in focus, meaning that they provided benefit to multiple communities and types of municipalities. Some regionally focused studies may have work products that overlap with those analyzed in the tables above.
More information on these studies and other work can be found on the MPO’s website (https://www.bostonmpo.org/recent_studies) or by contacting Srilekha Murthy, UPWP Manager, at smurthy@ctps.org.
Table D-3
Regionally Focused MPO-Funded UPWP Studies
| FFY 2024 | |
| CTPS | MAPC |
| • Lab and Municipal Parking Phase II • Parking in Bike Lanes: Strategies for Safety and Prevention • Strategies for Environmental Outreach and Engagement • Applying Conveyal to TIP Project Scoring |
|
| FFY 2023 | |
| CTPS | MAPC |
| • Update Bicycle/Pedestrian Count Database • Flexible Fixed-Route Bus Service • Transit Modernization Program • Lab and Municipal Parking Study • Learning from Roadway Pricing Experiences |
|
| FFY 2022 | |
| CTPS | MAPC |
| • Trip Generation Follow-up • Travel Demand Management Follow-up • The Future of the Curb Phase 3 • Identifying Transportation Inequities in the Boston Region • Staff-Generated Research Topics |
• MetroCommon 2050: Greater Boston’s Next Regional Vision |
| FFY 2021 | |
| CTPS | MAPC |
| • Improving Pedestrian Variables in the Travel Demand Model • Regional TDM Strategies • Trip Generation Rate Research • Access to CBDs Phase 2 • The Future of the Curb Phase 2 • Multimodal Resilience and Emergency Planning • MPO Staff-Generated Research Topics • Mapping Major Transportation Infrastructure Projects in the Boston Region • Exploring Resilience in MPO-Funded Corridor and Intersection Studies |
• Rideshare Electrification Working Group • Impacts of E-commerce in Massachusetts • Planning Successful Bus Priority • Projects in Greater Boston • MetroCommon Regional Plan Development |
| FFY 2020 | |
| CTPS | MAPC |
| • Operating a Successful Shuttle Program • Further Development of the MPOs Community Transportation Program • Disparate Impact Metrics Analysis • Pedestrian Report Card Assessment Dashboard • Innovations in Estimating Trip Generation Rates • Review of Vision Zero Strategies |
• Participation in Rail Vision Study • Participation in East-West Rail Study • MetroCommon Regional Plan Development • Review of Institute of Traffic Engineers Trip Generation Estimates • Inventory of National TNC Fee Structures • Analysis of How Local and State Governments in North America Use TNC Data for Regulation • Literature Review of Initiatives to Incentivize Zero Emission TNC Vehicles |
MPO staff collects these data annually. These data can potentially be used to inform UPWP funding decisions and could be used in concert with other data in the following future analyses:
Analyses such as these would provide the MPO with a clearer understanding of how the work programmed through the UPWP addresses the needs of the region.
This appendix contains detailed background on the regulatory documents, legislation, and guidance that shape the Boston Region Metropolitan Planning Organization’s (MPO) transportation planning process.
The Boston Region MPO is charged with executing its planning activities in line with federal and state regulatory guidance. Maintaining compliance with these regulations allows the MPO to directly support the work of these critical partners and ensures its continued role in helping the region move closer to achieving federal, state, and regional transportation goals. This appendix describes the regulations, policies, and guidance taken into consideration by the MPO during development of the certification documents and other core work the MPO will undertake during federal fiscal year (FFY) 2025.
The MPO’s planning processes are guided by provisions in federal transportation authorization bills, which are codified in federal statutes and supported by guidance from federal agencies. The Bipartisan Infrastructure Law (BIL) was signed into law on November 15, 2021 as the nation’s five-year surface transportation bill, and covers FFYs 2022–26. This section describes new provisions established in the BIL.
The purpose of the national transportation goals, outlined in Title 23, section 150, of the United States Code (23 USC § 150), is to increase the accountability and transparency of the Federal-Aid Highway Program and to improve decision-making through performance-based planning and programming. The national transportation goals include the following:
The Boston Region MPO has incorporated these national goals, where practicable, into its vision, goals, and objectives, which provide a framework for the MPO’s planning processes. More information about the MPO’s vision, goals, and objectives is included in Chapter 1.
The MPO gives specific consideration to the federal planning factors, described in Title 23, section 134, of the US Code (23 USC § 134), when developing all documents that program federal transportation funds. In accordance with the legislation, studies and strategies undertaken by the MPO shall
The Boston Region MPO has also incorporated these federal planning factors into its vision, goals, and objectives. Table E-1 shows the relationships between FFY 2024 MPO studies and activities and these federal planning factors.
Table E-1
FFY 2025 3C-Funded UPWP Studies and Programs—Relationship to Federal Planning Factors
| Federal Planning Factor | 3C-funded Certification Activities | Ongoing Technical Assistance | New and Recurring 3C-funded Planning Studies* | Administration and Resource Management | MAPC Activities | |||||||||||||||||||||||||||||
| Support to the MPO and its Committees | General Editorial | General Graphics | Public Engagement Program | Long-Range Transportation Plan | Transportation Improvement Program | Performance-Based Planning and Programming | Air Quality Program | Unified Planning Work Program | Transportation Equity Program | Congestion Management Process | Multimodal Mobility Infrastructure Program | Freight Planning Support | Data Program | Transit Working Group Support | Bicycle and Pedestrian Planning Program | Climate Resilience Program | Roadway Safety Audits | Community Transportation Technical Assistance (CTPS and MAPC) | Regional Transit Service Planning Technical Support | Bluebikes and MBTA Connections | Roadway Pricing: Balancing the Need for a Transition to Sustainable Mobility with Equity Considerations | Decarbonizing the Freight Sector: Exploring the Potential for Using E-cargo Bikes for First-/Last-mile Freight Deliveries | IT Resource Management | Professional Development | Corridor/Subarea Planning Studies | Alternative Mode Planning and Coordination | MetroCommon 2050 | Land-Use Development Project Reviews | MPO/MAPC Liaison Activities | UPWP Support | Land-use Data and Forecasts for Transportation Modeling | Subregional Support Activities | ||
| 1 | Support the economic vitality of the metropolitan area, especially by enabling global competitiveness, productivity, and efficiency. | • | • | • | • | • | • | • | • | • | • | • | • | • | • | • | • | • | • | • | • | • | • | |||||||||||
| 2 | Increase the safety of the transportation system for all motorized and nonmotorized users. | • | • | • | • | • | • | • | • | • | • | • | • | • | • | • | • | • | • | • | ||||||||||||||
| 3 | Increase the ability of the transportation system to support homeland security and to safeguard the personal security of all motorized and nonmotorized users. | • | • | • | • | • | • | • | ||||||||||||||||||||||||||
| 4 | Increase accessibility and mobility of people and freight. | • | • | • | • | • | • | • | • | • | • | • | • | • | • | • | • | • | • | • | • | • | • | • | • | • | • | • | • | • | ||||
| 5 | Protect and enhance the environment, promote energy conservation, improve the quality of life, and promote consistency between transportation improvements and state and local planned growth and economic development patterns. | • | • | • | • | • | • | • | • | • | • | • | • | • | • | • | • | • | • | • | • | • | • | • | • | • | • | |||||||
| 6 | Enhance the integration and connectivity of the transportation system, across and between modes, for people and freight. | • | • | • | • | • | • | • | • | • | • | • | • | • | • | • | • | • | • | • | • | • | • | • | • | |||||||||
| 7 | Promote efficient system management and operation. | • | • | • | • | • | • | • | • | • | • | • | • | • | • | • | • | • | • | • | • | • | ||||||||||||
| 8 | Emphasize the preservation of the existing transportation system. | • | • | • | • | • | • | • | • | • | • | • | • | • | • | • | • | • | ||||||||||||||||
| 9 | Improve the resiliency and reliability of the transportation system and reduce or mitigate storm water impacts of surface transportation. | • | • | • | • | • | • | • | • | • | • | • | • | • | • | • | • | • | • | • | ||||||||||||||
| 10 | Enhance travel and tourism. | • | • | • | • | • | • | • | • | • | • | • | ||||||||||||||||||||||
* For ongoing FFY 2024 3C-funded studies, see FFY 2024 UPWP
** Includes Support to the MPO and its Committees, Public Participation Process, and Regional Transportation Advisory Council Support
FFY = Federal Fiscal Year. UPWP = Unified Planning Work Program.
The United States Department of Transportation (USDOT), in consultation with states, MPOs, and other stakeholders, established performance measures relevant to the national goals established in the FAST Act. These performance topic areas include roadway safety, transit system safety, National Highway System (NHS) bridge and pavement condition, transit asset condition, NHS reliability for both passenger and freight travel, traffic congestion, and on-road mobile source emissions. The FAST Act and related federal rulemakings require states, MPOs, and public transportation operators to follow performance-based planning and programming practices—such as setting targets—to ensure that transportation investments support progress towards these goals. See Chapter 3 for more information about how the MPO has and will continue to conduct performance-based planning and programming.
On December 30, 2021, the Federal Highway Administration and Federal Transit Administration jointly issued updated planning emphasis areas for use in MPOs’ transportation planning process, following the enactment of the BIL. Those planning emphasis areas include the following:
The Clean Air Act, most recently amended in 1990, forms the basis of the United States’ air pollution control policy. The act identifies air quality standards, and the US Environmental Protection Agency (EPA) designates geographic areas as attainment (in compliance) or nonattainment (not in compliance) areas with respect to these standards. If air quality in a nonattainment area improves such that it meets EPA standards, the EPA may redesignate that area as being a maintenance area for a 20-year period to ensure that the standard is maintained in that area.
The conformity provisions of the Clean Air Act “require that those areas that have poor air quality, or had it in the past, should examine the long-term air quality impacts of their transportation system and ensure its compatibility with the area’s clean air goals.” Agencies responsible for Clean Air Act requirements for nonattainment and maintenance areas must conduct air quality conformity determinations, which are demonstrations that transportation plans, programs, and projects addressing that area are consistent with a State Implementation Plan (SIP) for attaining air quality standards.
Air quality conformity determinations must be performed for capital improvement projects that receive federal funding and for those that are considered regionally significant, regardless of the funding source. These determinations must show that projects in the MPO’s Long-Range Transportation Plan (LRTP) and Transportation Improvement Program (TIP) will not cause or contribute to any new air quality violations; will not increase the frequency or severity of any existing air quality violations in any area; and will not delay the timely attainment of air quality standards in any area. The policy, criteria, and procedures for demonstrating air quality conformity in the Boston region were established in Title 40, parts 51 and 53, of the Code of Federal Regulations (40. C.F.R. 51, 40 C.F.R. 53).
On April 1, 1996, the EPA classified the cities of Boston, Cambridge, Chelsea, Everett, Malden, Medford, Quincy, Revere, and Somerville as in attainment for carbon monoxide (CO) emissions. Subsequently, the Commonwealth established a CO maintenance plan through the Massachusetts SIP process to ensure that emission levels did not increase. While the maintenance plan was in effect, past TIPs and LRTPs included an air quality conformity analysis for these communities. As of April 1, 2016, the 20-year maintenance period for this maintenance area expired and transportation conformity is no longer required for carbon monoxide in these communities. This ruling is documented in a letter from the EPA dated May 12, 2016.
On April 22, 2002, the EPA classified the City of Waltham as being in attainment for CO emissions with an EPA-approved limited-maintenance plan. In areas that have approved limited-maintenance plans, federal actions requiring conformity determinations under the EPA’s transportation conformity rule are considered to satisfy the conformity test. The MPO is not required to perform a modeling analysis for a conformity determination for carbon monoxide, but it has been required to provide a status report on the timely implementation of projects and programs that will reduce emissions from transportation sources—so-called transportation control measures—which are included in the Massachusetts SIP. In April 2022, the EPA issued a letter explaining that the carbon monoxide limited maintenance area in Waltham has expired. Therefore, the MPO is no longer required to demonstrate transportation conformity for this area, but the rest of the maintenance plan requirements, however, continue to apply, in accordance with the SIP.
On February 16, 2018, the US Court of Appeals for the DC Circuit issued a decision in South Coast Air Quality Management District v. EPA, which struck down portions of the 2008 Ozone National Ambient Air Quality Standards (NAAQS) SIP Requirements Rule concerning the ozone NAAQS. Those portions of the SIP Requirements Rule included transportation conformity requirements associated with the EPA’s revocation of the 1997 ozone NAAQS. Massachusetts was designated as an attainment area in accord with the 2008 ozone NAAQS but as a nonattainment or maintenance area as relates to the 1997 ozone NAAQS. As a result of this court ruling, MPOs in Massachusetts must once again demonstrate conformity for ozone when developing LRTPs and TIPs.
MPOs must also perform conformity determinations if transportation control measures (TCM) are in effect in the region. TCMs are strategies that reduce transportation-related air pollution and fuel use by reducing vehicle-miles traveled and improving roadway operations. The Massachusetts SIP identifies TCMs in the Boston region. SIP-identified TCMs are federally enforceable and projects that address the identified air quality issues must be given first priority when federal transportation dollars are spent. Examples of TCMs that were programmed in previous TIPs include rapid-transit and commuter-rail extension programs (such as the Green Line Extension in Cambridge, Medford, and Somerville, and the Fairmount Line improvements in Boston), parking-freeze programs in Boston and Cambridge, statewide rideshare programs, park-and-ride facilities, residential parking-sticker programs, and the operation of high-occupancy-vehicle (HOV) lanes.
In addition to reporting on the pollutants identified in the 1990 Clean Air Act Amendments, the MPOs in Massachusetts are also required to perform air quality analyses for carbon dioxide as part of the state’s Global Warming Solutions Act (GWSA) (see below).
The Boston Region MPO complies with Title VI of the Civil Rights Act of 1964, the American with Disabilities Act of 1990 (ADA), Executive Order 12898—Federal Actions to Address Environmental Justice in Minority Populations and Low-income Populations (EJ EO), and other federal and state nondiscrimination statutes and regulations in all programs and activities it conducts. Per federal and state law, the MPO does not discriminate on the basis of race, color, national origin (including limited-English proficiency), religion, creed, gender, ancestry, ethnicity, disability, age, sex, sexual orientation, gender identity or expression, veteran’s status, or background. The MPO strives to provide meaningful opportunities for participation of all persons in the region, including those protected by Title VI, the ADA, the EJ EO, and other nondiscrimination mandates.
The MPO also assesses the likely benefits and adverse effects of transportation projects on equity populations (populations covered by federal regulations, as identified in the MPO’s Transportation Equity program) when deciding which projects to fund. This is done through the MPO’s project selection criteria. MPO staff also evaluate the projects that are selected for funding, in the aggregate, to determine their overall impacts and whether they improve transportation outcomes for equity populations. The major federal requirements pertaining to nondiscrimination are discussed below.
Title VI of the Civil Rights Act of 1964 requires that no person be excluded from participation in, be denied the benefits of, or be subjected to discrimination on the basis of race, color, or national origin, under any program or activity provided by an agency receiving federal financial assistance. Executive Order 13166—Improving Access to Services for Persons with Limited English Proficiency, dated August 11, 2000, extends Title VI protections to people who, as a result of their nationality, have limited English proficiency. Specifically, it calls for improved access to federally assisted programs and activities, and it requires MPOs to develop and implement a system through which people with limited English proficiency can meaningfully participate in the transportation planning process. This requirement includes the development of a Language Assistance Plan that documents the organization’s process for providing meaningful language access to people with limited English proficiency who access their services and programs.
Executive Order 12898, dated February 11, 1994, requires each federal agency to advance environmental justice by identifying and addressing any disproportionately high and adverse human health or environmental effects, including interrelated social and economic effects, of its programs, policies, and activities on minority and low-income populations.
On April 15, 1997, the USDOT issued its Final Order to Address Environmental Justice in Minority Populations and Low-Income Populations. Among other provisions, this order requires programming and planning activities to
The 1997 Final Order was updated in 2012 with USDOT Order 5610.2(a), which provided clarification while maintaining the original framework and procedures.
Title III of the ADA “prohibits states, MPOs, and other public entities from discriminating on the basis of disability in the entities’ services, programs, or activities,” and requires all transportation projects, plans, and programs to be accessible to people with disabilities. Therefore, MPOs must consider the mobility needs of people with disabilities when programming federal funding for studies and capital projects. MPO-sponsored meetings must also be held in accessible venues and be conducted in a manner that provides for accessibility. Also, MPO materials must be made available in accessible formats.
The Age Discrimination Act of 1975 prohibits discrimination on the basis of age in programs or activities that receive federal financial assistance. In addition, the Rehabilitation Act of 1975, and Title 23, section 324, of the US Code (23 USC § 324) prohibit discrimination based on sex.
Much of the MPO’s work focuses on encouraging mode shift and diminishing GHG emissions through improving transit service, enhancing bicycle and pedestrian networks, and studying emerging transportation technologies. All of this work helps the Boston region contribute to statewide progress towards the priorities discussed in this section.
Beyond Mobility, the Massachusetts 2050 Transportation Plan, is a planning process that will result in a blueprint for guiding transportation decision-making and investments in Massachusetts in a way that advances MassDOT’s goals and maximizes the equity and resiliency of the transportation system. MPO staff continue to coordinate with MassDOT staff so that Destination 2050, the MPO’s Long-Range Transportation Plan, is aligned with the Beyond Mobility plan.
The Commission on the Future of Transportation in the Commonwealth—established by Massachusetts Governor Charlie Baker’s Executive Order 579—published Choices for Stewardship in 2019. This report makes 18 recommendations across the following five thematic categories to adapt the transportation system in the Commonwealth to emerging needs:
Beyond Mobility will build upon the Commission report’s recommendations. The Boston Region MPO supports these statewide goals by conducting planning work and making investment decisions that complement MassDOT’s efforts and reflect the evolving needs of the transportation system in the region.
The Massachusetts 2023 Strategic Highway Safety Plan (SHSP) identifies the state’s key safety needs and guides investment decisions to achieve significant reductions in highway fatalities and serious injuries on all public roads. The SHSP establishes statewide safety goals and objectives and key safety emphasis areas, and it draws on the strengths of all highway safety partners in the Commonwealth to align and leverage resources to address the state’s safety challenges collectively. The Boston Region MPO considers SHSP goals, emphasis areas, and strategies when developing its plans, programs, and activities.
The Massachusetts Transportation Asset Management Plan (TAMP) is a risk-based asset management plan for the bridges and pavement that are in the NHS inventory. The plan describes the condition of these assets, identifies assets that are particularly vulnerable following declared emergencies such as extreme weather, and discusses MassDOT’s financial plan and risk management strategy for these assets. The Boston Region MPO considers MassDOT TAMP goals, targets, and strategies when developing its plans, programs, and activities. MassDOT’s TAMP was most recently updated in 2023.
In 2017, MassDOT finalized the Massachusetts Freight Plan, which defines the short- and long-term vision for the Commonwealth’s freight transportation system. In 2018, MassDOT released the related Commonwealth of Massachusetts State Rail Plan, which outlines short- and long-term investment strategies for Massachusetts’ freight and passenger rail systems (excluding the commuter rail system). In 2019, MassDOT released the Massachusetts Bicycle Transportation Plan and the Massachusetts Pedestrian Transportation Plan, both of which define roadmaps, initiatives, and action plans to improve bicycle and pedestrian transportation in the Commonwealth. These plans were updated in 2021 to reflect new investments in bicycle and pedestrian projects made by MassDOT since their release. In 2023, MassDOT released the Massachusetts Freight Plan, which identifies short- and long-term improvements and strategies for the state’s freight systems. The MPO considers the findings and strategies of MassDOT’s modal plans when conducting its planning, including through its Freight Planning Support and Bicycle/Pedestrian Support Activities programs.
The GWSA makes Massachusetts a leader in setting aggressive and enforceable GHG reduction targets and implementing policies and initiatives to achieve these targets. In keeping with this law, the Massachusetts Executive Office of Energy and Environmental Affairs (EEA), in consultation with other state agencies and the public, developed the Massachusetts Clean Energy and Climate Plan for 2020. This implementation plan, released on December 29, 2010, and updated in 2022 to reflect new interim targets, establishes the following targets for overall statewide GHG emission reductions:
In 2018, EEA published its GWSA 10-year Progress Report and the GHG Inventory estimated that 2018 GHG emissions were 22 percent below the 1990 baseline level.
On June 30, 2022, EEA certified its compliance with the 2020 emissions limit of 25 percent below the 1990 levels, noting that there was an estimated emissions reduction of 31.4 percent below the 1990 level in 2020.
MassDOT fulfills its responsibilities, defined in the Massachusetts Clean Energy and Climate Plan for 2050, through a policy directive that sets three principal objectives:
In January 2015, the Massachusetts Department of Environmental Protection amended Title 310, section 7.00, of the Code of Massachusetts Regulations (310 CMR 60.05), Global Warming Solutions Act Requirements for the Transportation Sector and the Massachusetts Department of Transportation, which was subsequently amended in August 2017. This regulation places a range of obligations on MassDOT and MPOs to support achievement of the Commonwealth’s climate change goals through the programming of transportation funds. For example, MPOs must use GHG impact as a selection criterion when they review projects to be programmed in their TIPs, and they must evaluate and report the GHG emissions impacts of transportation projects in LRTPs and TIPs.
The Commonwealth’s 10 MPOs (and three non-metropolitan planning regions) are integrally involved in supporting the GHG reductions mandated under the GWSA. The MPOs seek to realize these objectives by prioritizing projects in the LRTP and TIP that will help reduce emissions from the transportation sector. The Boston Region MPO uses its TIP project evaluation criteria to score projects based on their GHG emissions impacts, multimodal Complete Streets accommodations, and ability to support smart growth development. Tracking and evaluating GHG emissions by project will enable the MPO to anticipate GHG impacts of planned and programmed projects. See Chapter 3 for more details related to how the MPO conducts GHG monitoring and evaluation.
On September 9, 2013, MassDOT passed the Healthy Transportation Policy Directive to formalize its commitment to implementing and maintaining transportation networks that allow for various mode choices. This directive will ensure that all MassDOT projects are designed and implemented in ways that provide all users with access to safe and comfortable walking, bicycling, and transit options. MassDOT’s design justification process, which established controlling criteria for bicycle and pedestrian facilities, transit provisions and the length of off- and on-ramps, has helped to operationalize and further the goals of the original Healthy Transportation Policy Directive.
In November 2015, MassDOT released the Separated Bike Lane Planning & Design Guide. This guide represents a step in MassDOT’s continuing commitment to Complete Streets, sustainable transportation, and the creation of more safe and convenient transportation options for Massachusetts’ residents. This guide may be used by project planners and designers as a resource for considering, evaluating, and designing separated bike lanes as part of a Complete Streets approach.
In the current LRTP, Destination 2050, the Boston Region MPO continues to use investment programs—particularly its Complete Streets and Bicycle Network and Pedestrian Connections programs—that support the implementation of Complete Streets projects. In the Unified Planning Work Program, the MPO budgets to support these projects, such as the MPO’s Bicycle and Pedestrian Support Activities program, corridor studies undertaken by MPO staff to make conceptual recommendations for Complete Streets treatments, and various discrete studies aimed at improving pedestrian and bicycle accommodations.
MassDOT developed the Congestion in the Commonwealth 2019 report to identify specific causes of and impacts from traffic congestion on the NHS. The report also made recommendations for reducing congestion, including addressing local and regional bottlenecks, redesigning bus networks within the systems operated by the Massachusetts Bay Transportation Authority (MBTA) and the other regional transit authorities, increasing MBTA capacity, and investigating congestion pricing mechanisms such as managed lanes. These recommendations guide multiple new efforts within MassDOT and the MBTA and are actively considered by the Boston Region MPO when making planning and investment decisions.
On March 18, 2019, MassDOT and the MBTA released Focus40, the MBTA’s Program for Mass Transportation, which is the 25-year investment plan that aims to position the MBTA to meet the transit needs of the Greater Boston region through 2040. Complemented by the MBTA’s Strategic Plan and other internal and external policy and planning initiatives, Focus40 serves as a comprehensive plan guiding all capital planning initiatives at the MBTA. These initiatives include the Rail Vision plan, which will inform the vision for the future of the MBTA’s commuter rail system; the Bus Network Redesign (formerly the Better Bus Project), the plan to re-envision and improve the MBTA’s bus network; and other plans. The next update of the Program for Mass Transportation is planned for development in 2024.The Boston Region MPO continues to monitor the status of Focus40 and related MBTA modal plans to inform its decision-making about transit capital investments, which are incorporated into the TIP and LRTP.
MetroCommon 2050, which was developed by the Metropolitan Area Planning Council (MAPC) and adopted in 2021, is Greater Boston’s regional land use and policy plan. MetroCommon 2050 builds upon MAPC’s previous plan, MetroFuture (adopted in 2008), and includes an updated set of strategies for achieving sustainable growth and equitable prosperity in the region. The MPO considers MetroCommon 2050’s goals, objectives, and strategies in its planning and activities. See Chapter 7 for more information about MetroCommon 2050 development activities.
MetroCommon 2050 is the foundation for land use projections in the MPO’s LRTP, Destination 2050.
The purpose of the Congestion Management Process (CMP) is to monitor and analyze the mobility of people using transportation facilities and services, develop strategies for managing congestion based on the results of traffic monitoring, and move those strategies into the implementation stage by providing decision-makers in the region with information and recommendations for improving the transportation system’s performance. The CMP monitors roadways, transit, and park-and-ride facilities in the Boston region for safety, congestion, and mobility, and identifies problem locations. See Chapter 3 for more information about the MPO’s CMP.
Every four years, the Boston Region MPO completes a Coordinated Public Transit-Human Services Transportation Plan (CPT‒HST), in coordination with the development of the LRTP. The CPT‒HST supports improved coordination of transportation for seniors and people with disabilities in the Boston region by guiding transportation providers in their development of proposals for funding from the Federal Transit Administration’s Section 5310 Program (known in Massachusetts as the Community Transit Grant Program). To be eligible for funding, a proposal must meet a need identified in the CPT‒HST. The CPT‒HST contains information about
The MPO adopted its current CPT‒HST in 2023.
The MBTA and the region’s RTAs—the Cape Ann Transportation Authority (CATA) and the MetroWest Regional Transit Authority (MWRTA)—are responsible for producing transit asset management plans that describe their asset inventories and the condition of these assets, strategies, and priorities for improving the state of good repair of these assets. The Boston Region MPO considers goals and priorities established in these plans when developing its plans, programs, and activities.
The MBTA, CATA, and MWRTA are required to create and annually update Public Transit Agency Safety Plans that describe their approaches for implementing Safety Management Systems on their transit systems. The Boston Region MPO considers goals, targets, and priorities established in these plans when developing its plans, programs, and activities.
The COVID-19 pandemic has radically shifted the way many people in the Boston region interact with the regional transportation system. The pandemic’s effect on everyday life has had short-term impacts on the system and how people travel, but it may also have other lasting effects. Four years on from the beginning of the pandemic, travel patterns have shifted to reflect a hybrid working schedule for many workers. Some changes made in response to the pandemic may become permanent, such as the expansion of bicycle, bus, sidewalk, and plaza networks. As the region recovers from the impacts of the COVID-19 pandemic and the long-term effects become apparent, state and regional partners’ guidance and priorities are likely to be adjusted.
The Boston Region Metropolitan Planning Organization (MPO) includes both permanent members and municipal members who are elected for three-year terms. Details about the MPO’s members are listed below.
The Massachusetts Department of Transportation (MassDOT) was established under Chapter 25 (An Act Modernizing the Transportation Systems of the Commonwealth of Massachusetts) of the Acts of 2009. MassDOT has four divisions: Highway, Rail and Transit, Aeronautics, and the Registry of Motor Vehicles. The MassDOT Board of Directors, composed of 11 members appointed by the governor, oversees all four divisions and MassDOT operations and works closely with the Massachusetts Bay Transportation Authority (MBTA) Board of Directors. The MassDOT Board of Directors was expanded to 11 members by the Legislature in 2015, a group of transportation leaders assembled to review structural problems with the MBTA and deliver recommendations for improvements. MassDOT has three seats on the MPO board, including seats for the Highway Division.
The MassDOT Highway Division has jurisdiction over the roadways, bridges, and tunnels that were overseen by the former Massachusetts Highway Department and Massachusetts Turnpike Authority. The Highway Division also has jurisdiction over many bridges and parkways that previously were under the authority of the Department of Conservation and Recreation. The Highway Division is responsible for the design, construction, and maintenance of the Commonwealth’s state highways and bridges. It is also responsible for overseeing traffic safety and engineering activities for the state highway system. These activities include operating the Highway Operations Control Center to ensure safe road and travel conditions.
The MBTA, created in 1964, is a body politic and corporate, and a political subdivision of the Commonwealth. Under the provisions of Chapter 161A of the Massachusetts General Laws, it has the statutory responsibility within its district of operating the public transportation system in the Boston region, preparing the engineering and architectural designs for transit development projects, and constructing and operating transit development projects. The MBTA district comprises 177 communities, including all of the 97 cities and towns of the Boston Region MPO area.
In April 2015, as a result of a plan of action to improve the MBTA, a five-member Fiscal and Management Control Board (FMCB) was created. The FMCB was created to oversee and improve the finances, management, and operations of the MBTA. The FMCB’s authorizing statute called for an initial three-year term, with the option for the board to request that the governor approve a single two-year extension. In 2017, the FMCB’s initial mandate, which would have expired in June 2018, was extended for two years, through June 30, 2020. In 2020, the FMCB’s mandate was extended a second time for an additional period of one year, through June 30, 2021.
Following the expiration of the FMCB’s extended mandate, the MBTA Board of Directors was formed as a permanent replacement to provide oversight for the agency. By statute, the board consists of nine members, including the Secretary of Transportation as an ex-officio member. The MBTA Advisory Board appoints one member who has municipal government experience in the MBTA’s service area and experience in transportation operations, transportation planning, housing policy, urban planning, or public or private finance. The Governor appoints the remaining seven board members, which include an MBTA rider and member of an environmental justice population, and a person recommended by the President of the American Federation of Labor and Congress of Industrial Organizations.
The MBTA Advisory Board was created by the Massachusetts Legislature in 1964 through the same legislation that created the MBTA. The Advisory Board consists of representatives of the 175 cities and towns that compose the MBTA’s service area. Cities are represented by either the city manager or mayor, and towns are represented by the chairperson of the board of selectmen. Specific responsibilities of the Advisory Board include reviewing and commenting on the MBTA’s long-range plan, the Program for Mass Transportation; proposed fare increases; the annual MBTA Capital Investment Program; the MBTA’s documentation of net operating investment per passenger; and the MBTA’s operating budget. The MBTA Advisory Board advocates for the transit needs of its member communities and the riding public.
The Massachusetts Port Authority (Massport) has the statutory responsibility under Chapter 465 of the Acts of 1956, as amended, for planning, constructing, owning, and operating such transportation and related facilities as may be necessary for developing and improving commerce in Boston and the surrounding metropolitan area. Massport owns and operates Boston Logan International Airport, the Port of Boston’s Conley Terminal, Flynn Cruiseport Boston, Hanscom Field, Worcester Regional Airport, and various maritime and waterfront properties, including parks in the Boston neighborhoods of East Boston, South Boston, and Charlestown.
The Metropolitan Area Planning Council (MAPC) is the regional planning agency for the Boston region. It is composed of the chief executive officer (or a designee) of each of the cities and towns in the MAPC’s planning region, 21 gubernatorial appointees, and 12 ex-officio members. It has statutory responsibility for comprehensive regional planning in its region under Chapter 40B of the Massachusetts General Laws. It is the Boston Metropolitan Clearinghouse under Section 204 of the Demonstration Cities and Metropolitan Development Act of 1966 and Title VI of the Intergovernmental Cooperation Act of 1968. Also, its region has been designated an economic development district under Title IV of the Public Works and Economic Development Act of 1965, as amended. MAPC’s responsibilities for comprehensive planning encompass the areas of technical assistance to communities, transportation planning, and development of zoning, land use, demographic, and environmental studies. MAPC activities that are funded with federal metropolitan transportation planning dollars are documented in the Boston Region MPO’s Unified Planning Work Program.
The City of Boston, six elected cities (currently Beverly, Everett, Framingham, Newton, Somerville, and Burlington), and six elected towns (currently Acton, Arlington, Brookline, Hull, Wrentham, and Norwood,) represent the 97 municipalities in the Boston Region MPO area. The City of Boston is a permanent MPO member and has two seats. There is one elected municipal seat for each of the eight MAPC subregions and four seats for at-large elected municipalities (two cities and two towns). The elected at-large municipalities serve staggered three-year terms, as do the eight municipalities representing the MAPC subregions.
The Regional Transportation Advisory Council, the MPO’s citizen advisory group, provides the opportunity for transportation-related organizations, non-MPO member agencies, and municipal representatives to become actively involved in the decision-making processes of the MPO as it develops plans and prioritizes the implementation of transportation projects in the region. The Advisory Council reviews, comments on, and makes recommendations regarding certification documents. It also serves as a forum for providing information on transportation topics in the region, identifying issues, advocating for ways to address the region’s transportation needs, and generating interest among members of the general public in the work of the MPO.
The Federal Highway Administration (FHWA) and Federal Transit Administration (FTA) participate in the Boston Region MPO in an advisory (nonvoting) capacity, reviewing the Long-Range Transportation Plan, Transportation Improvement Program, and Unified Planning Work Program, and other facets of the MPO’s planning process to ensure compliance with federal planning and programming requirements. These two agencies oversee the highway and transit programs, respectively, of the United States Department of Transportation (USDOT) under pertinent legislation and the provisions of the Bipartisan Infrastructure Law (BIL).