
Goal:
Ensure that all people receive comparable benefits from, and are not disproportionately burdened by, MPO investments, regardless of race, color, national origin, age, income, ability, or sex.
Objectives:
Over three million people live in the Boston region, representing a broad range of ages, abilities, incomes, races, ethnicities, and nationalities. Not all residents benefit equally from transportation investments, and some have been traditionally underserved by transportation and underrepresented in the planning process. The Boston Region Metropolitan Planning Organization (MPO) considered the transportation needs of these underserved populations, referred to as transportation equity (TE) populations, in the development of this Needs Assessment.
Given the Boston region’s demographics and the changing nature of travel patterns (induced, in part, by emerging new technologies and increasing interest in transit and non-motorized transportation options), sustaining a transportation network that serves all residents continues to present challenges. As a regional transportation planning agency, the MPO has an important role to play in addressing these challenges. The chapter reports on the current transportation needs facing TE populations. This information will help the MPO better allocate limited resources to address the most significant needs.
As a recipient of federal funding, the Boston Region MPO is required to comply with various federal civil rights statutes, executive orders, and regulations that are intended to ensure that the transportation needs of traditionally underserved populations are considered in the MPO’s planning and programming and that they have opportunities participate in MPO activities. Specifically, federal laws prohibit MPOs from discriminating on the basis of race, color, national origin, sex, disability, and age in all of their activities, policies, and programs. MPOs are further required to identify and address the disproportionately high and adverse effects of their activities on minority and low-income populations, as well as provide meaningful access to their services for those with limited English proficiency (LEP) as an extension of national origin protections.
The Boston Region MPO considers TE populations to include those protected by federal laws and regulations—such as people who identify as minority and people with disabilities—as well as those who have specific transportation needs (members of transit-dependent households, for example). Specifically, the MPO considers TE populations to include the following groups:
The MPO’s Transportation Equity Program ensures that the MPO complies with all federal Title VI, environmental justice (EJ), and other nondiscrimination regulations. As part of the program, staff supports the development of the Long-Range Transportation Plan (LRTP) Needs Assessment by ensuring that the transportation needs of the populations covered by those mandates are considered and by identifying the transportation needs of TE populations through data analysis and public outreach.
Input from public outreach and results from data analyses show that TE needs coincide with needs identified in all of the MPO’s other goal areas. These needs include access to frequent, reliable public transit; more transit service to healthcare facilities; additional first- and last-mile connections to and from rail stations; more complete bicycle and pedestrian networks; safe bicycle and pedestrian transportation routes away from congested roadways in communities with high shares of TE populations; transit service during off-peak hours and for reverse commutes; transit service between suburbs, especially to and from job centers; bicycle routes to and from employment centers; bicycle facilities, sidewalks, and street crossings that are safe for children and elderly adults; and more sidewalks that are in compliance with the Americans with Disabilities Act (ADA). Outside of the existing goal areas, there is also a need to improve coordination across agency and political boundaries as many commenters said that poorly coordinated schedules and services can lead to long trips.
Table 8-1 provides more detail about the needs of TE populations, which were identified through public outreach and data analysis. It also includes staff recommendations for addressing each need. A description of the types of recommendations presented in the table includes the following:
Table 8-1
Transportation Equity Needs in the Boston Region Identified through Data Analysis and Public Outreach and Recommendations to Address Needs
| Emphasis Area |
Issue |
Needs |
Recommendations to |
|---|---|---|---|
Capacity Management and Mobility |
Serving non-traditional commutes |
There is a lack of public transit service for reverse commutes and off-peak commutes. |
Existing Programs Community Connections Program Regional Transit Service Planning Technical Assistance Existing Studies Reverse-Commute Areas Analysis Operating a Successful Shuttle Program |
Capacity Management and Mobility |
Gaps in transit service |
Some TE populations lack transit service comparable to service available to non-TE populations. |
Existing Programs Community Connections Program Regional Transit Service Planning and Technical Assistance Proposed Programs Bus Mobility Connect Elderly Adults with Transportation Existing Study Operating a Successful Shuttle Program |
Capacity Management and Mobility |
Transit reliability |
Rapid transit and bus service is unreliable for populations whose only option is transit. |
Existing Programs Major Infrastructure Regional Transit Service Planning Technical Assistance Proposed Programs Bus Mobility Connect Elderly Adults with Transportation Transit Modernization Existing Studies Transportation Access Studies of Commercial Business Districts The Future of the Curb |
Capacity Management and Mobility |
First-mile and last-mile connections |
First-mile and last-mile connections to transit (including pedestrian, bicycle, and transit routes) are lacking, causing barriers to transit usage. |
Existing Programs Bicycle Network and Pedestrian Connections Community Connections Program Regional Transit Service Planning Technical Assistance Proposed Programs Bus Mobility Connect Elderly Adults with Transportation Existing Studies Pedestrian Report Card Assessment Dashboard The Future of the Curb Transportation Access Studies of Commercial Business Districts Operating a Successful Shuttle Program Proposed Study Transportation Equity Areas Bicycle and Pedestrian Analysis |
Capacity Management and Mobility |
Active transportation options |
Elderly and youth populations have inadequate access to safe bicycle facilities. |
Existing Programs Bicycle and Pedestrian Connections Complete Streets Existing Studies The Future of the Curb Locations with High Bicycle and Pedestrian Crash Rates in the Boston Region MPO Area Proposed Study Transportation Equity Areas Bicycle and Pedestrian Analysis |
Capacity Management and Mobility |
Active transportation options |
Docked bike-share facilities in the Inner Core are not available to some communities with high shares of low-income or minority populations; the future of dockless bike-share systems is uncertain. |
Existing Program Community Connections Program Existing Study The Future of the Curb
|
Clean Air and Clean Communities |
Auto emissions |
More off-road active transportation routes are needed in communities with high shares of TE populations that live near congested roadways. |
Existing Program Bicycle and Pedestrian Connections Proposed Study Transportation Equity Areas Bicycle and Pedestrian Analysis |
Coordination between municipalities and regionsa |
Coordination of services between towns and transportation agencies |
Better coordination of schedules, routes, and services is needed between towns and between the MBTA and other regional transit authorities. |
Existing Program Regional Transit Service Planning Technical Assistance Existing Study Operating a Successful Shuttle Program |
Economic Vitality |
Transit service during non-peak commuting times to job-rich centers |
More transit service (late night, early morning, and reverse commute) is needed between job-rich centers—such as Longwood Medical Area, the Seaport, and suburban job centers—and underserved neighborhoods. |
Existing Programs Community Connections Program Major Infrastructure Proposed Program Bus Mobility Existing Studies Reverse-Commute Areas Analysis Transportation Access Studies of Commercial Business Districts Operating a Successful Shuttle Program |
Economic Vitality |
Lack of transit routes between suburbs |
New transit service is needed between low-income suburban residential communities and suburban job centers. |
Existing Programs Community Connections Program Major Infrastructure Regional Transit Service Planning Technical Assistance Proposed Program Bus Mobility Existing Studies Transportation Access Studies of Commercial Business Districts Operating a Successful Shuttle Program |
Economic Vitality |
Affordable housing |
Transportation needs of TE populations could be met by building transit-oriented developments that provide affordable housing near transit hubs and employment centers, particularly in the inner core and suburbs. |
Existing Program Transportation Equity Program—this can be coordinated with MAPC’s work on land use issues, including housing and transportation Existing Study Transportation Access Studies of Commercial Business Districts |
Economic Vitality |
Lack of safe bicycle routes to key destinations |
The region needs good-quality bicycle infrastructure that connects homes and final destinations, such as jobs and other amenity-rich locations, especially in and between communities with high shares of low-income or transit-dependent households. |
Existing Programs Bicycle Network and Pedestrian Connections Community Transportation Technical Assistance Complete Streets Existing Studies The Future of the Curb Transportation Access Studies of Commercial Business Districts Locations with High Bicycle and Pedestrian Crash Rates in the Boston Region MPO Area Proposed Study Transportation Equity Areas Bicycle and Pedestrian Analysis |
Safety |
Lack of safe bicycle routes within neighborhoods |
Improve access to safe bicycle facilities within communities with high shares of TE populations. |
Existing Programs Bicycle Network and Pedestrian Connections Complete Streets Existing Studies The Future of the Curb Locations with High Bicycle and Pedestrian Crash Rates in the Boston Region MPO Area Proposed Study Transportation Equity Areas Bicycle and Pedestrian Analysis |
Safety |
Unsafe sidewalks and street crossings, and incomplete pedestrian networks |
Improve sidewalks and street crossings, especially around schools, so that they are safe for children and elderly adults. |
Existing Programs Community Transportation Technical Assistance Complete Streets Intersection Improvements Existing Studies Pedestrian Report Card Assessment Dashboard Safety and Operations at Selected Intersections |
System Preservation |
Non-ADA compliant sidewalks |
Upgrade sidewalks to be compliant with the ADA. |
Existing Programs Community Transportation Technical Assistance Program Complete Streets Intersection Improvements Proposed Program Connect Elderly Adults with Transportation Existing Study Pedestrian Report Card Assessment Dashboard |
System Preservation |
Climate change |
Document potential exposure of TE populations to climate change impacts and determine how their ability to access transportation may be affected. |
Existing Program Transportation Equity Program Proposed Program Climate Resiliency Existing Study Exploring Resilience in MPO-funded Corridor and Intersection studies |
a Although this issue does not directly relate to the MPO’s goal areas, this topic was voiced during public outreach.
ADA = Americans with Disabilities Act. MAPC = Metropolitan Area Planning Council. MPO = Metropolitan Planning Organization. TE = transportation equity. UPWP = Unified Planning Work Program.
Source: Boston Region MPO.
This chapter discusses the transportation needs of TE populations identified through data analysis and public outreach. The information included in this chapter builds on information in previous LRTPs by identifying the needs of TE populations as they relate to each of the MPO’s other existing goal areas: Safety, Economic Vitality, Clean Air/Sustainable Communities, Capacity Management and Mobility, and System Preservation. This approach better organizes the transportation needs of TE populations in relationship to the other areas that are of interest to the MPO. This chapter summarizes analysis results specific to TE populations for analyses that are included for all populations in the other goal area chapters. The full descriptions of the methodologies used to evaluate the needs of TE populations can be found in the respective goal area chapters.
The findings in the Needs Assessment informs Destination 2040’s new TE goal and objectives, which shape how equity is considered in project selection and performance analysis in the Transportation Improvement Program (TIP) and the LRTP. The recommendations will help the MPO identify ways in which the MPO can address the needs through the Transportation Equity Program.
Supporting information that the MPO staff used to understand capacity management and mobility needs is included in the Appendices of this Needs Assessment.
The MPO staff regularly collects and analyzes demographic data on TE populations in the region. The analyses that follow describe the demographic characteristics of TE populations living within the region. These data are derived from the 2010 United States Census and the 2010–14 American Community Survey (ACS). The MPO staff uses these data to determine how many people or households of each TE population live in the Boston region, identify where in the region they live, and identify communities where there is a high share of TE populations.
To identify communities in which there is a high share of TE populations, the MPO sets a regional threshold for each population. For all TE populations except low-income households the regional threshold is defined as the average number of people or households within the MPO region who meet the definition of a TE population.2 For low-income households, the regional threshold is 60 percent of the region’s median household income. Data from the 2010–14 ACS show that the regionwide median income is $75,654; therefore, the low-income threshold is $45,392. These thresholds are used to identify transportation analysis zones (TAZs) in which there are a high share of TE populations. TAZs that exceed these thresholds are referred to here as transportation equity zones (TEZs).3 Figures 8-1 through 8-7 below show the TAZs that exceed regional threshold for each TE population.
Figure 8-1
Transportation Equity Zones: Minority
TAZ = transportation analysis zone.
Source: 2010 US Census.
Figure 8-2
Transportation Equity Zones: Low-Income
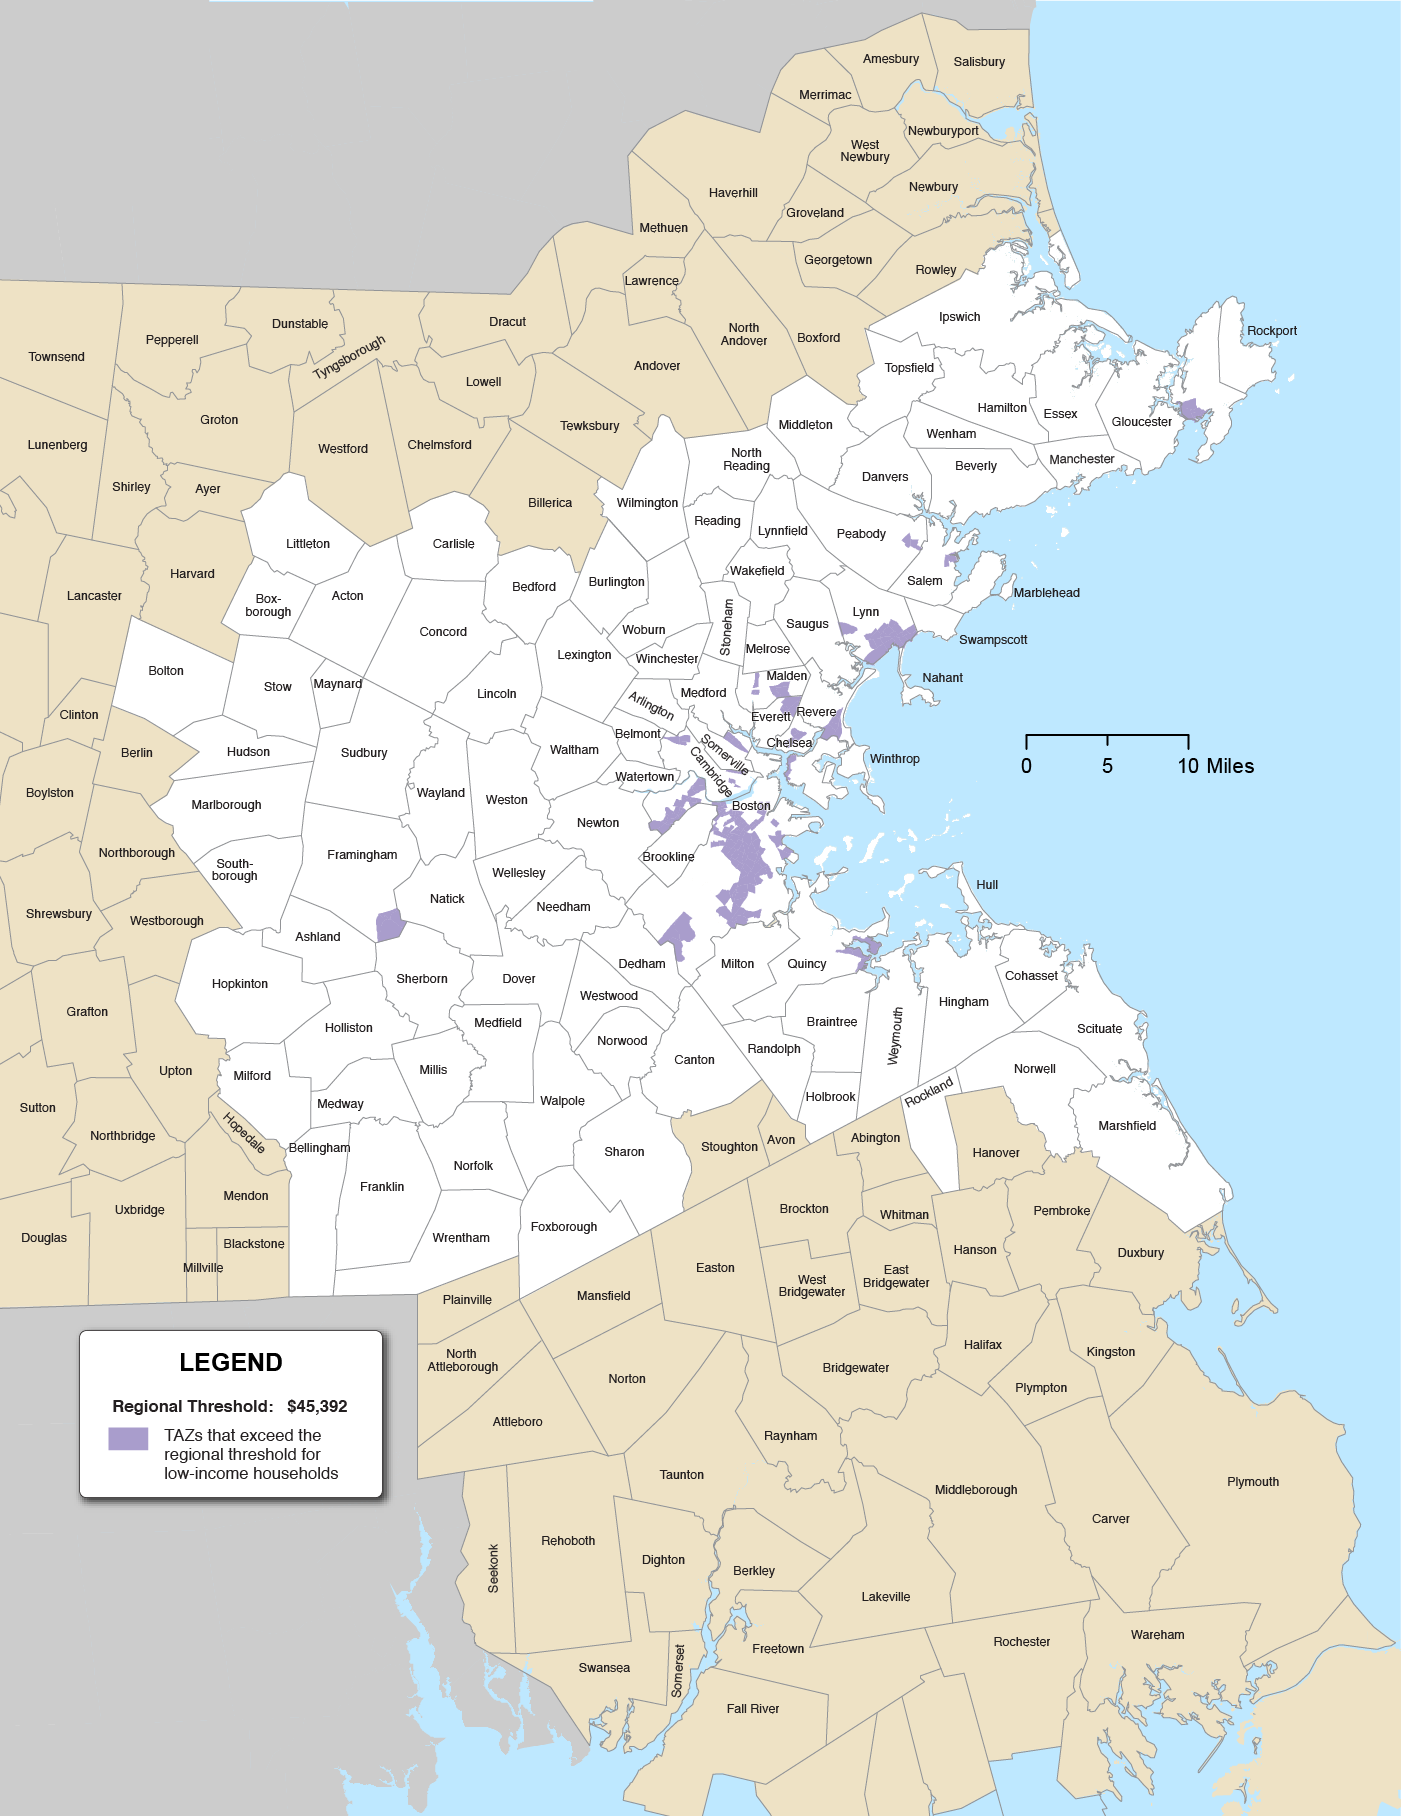
TAZ = transportation analysis zone.
Sources: 2010–14 American Community Survey and 2010 US Census.
Figure 8-3
Transportation Equity Zones: People with Limited English Proficiency
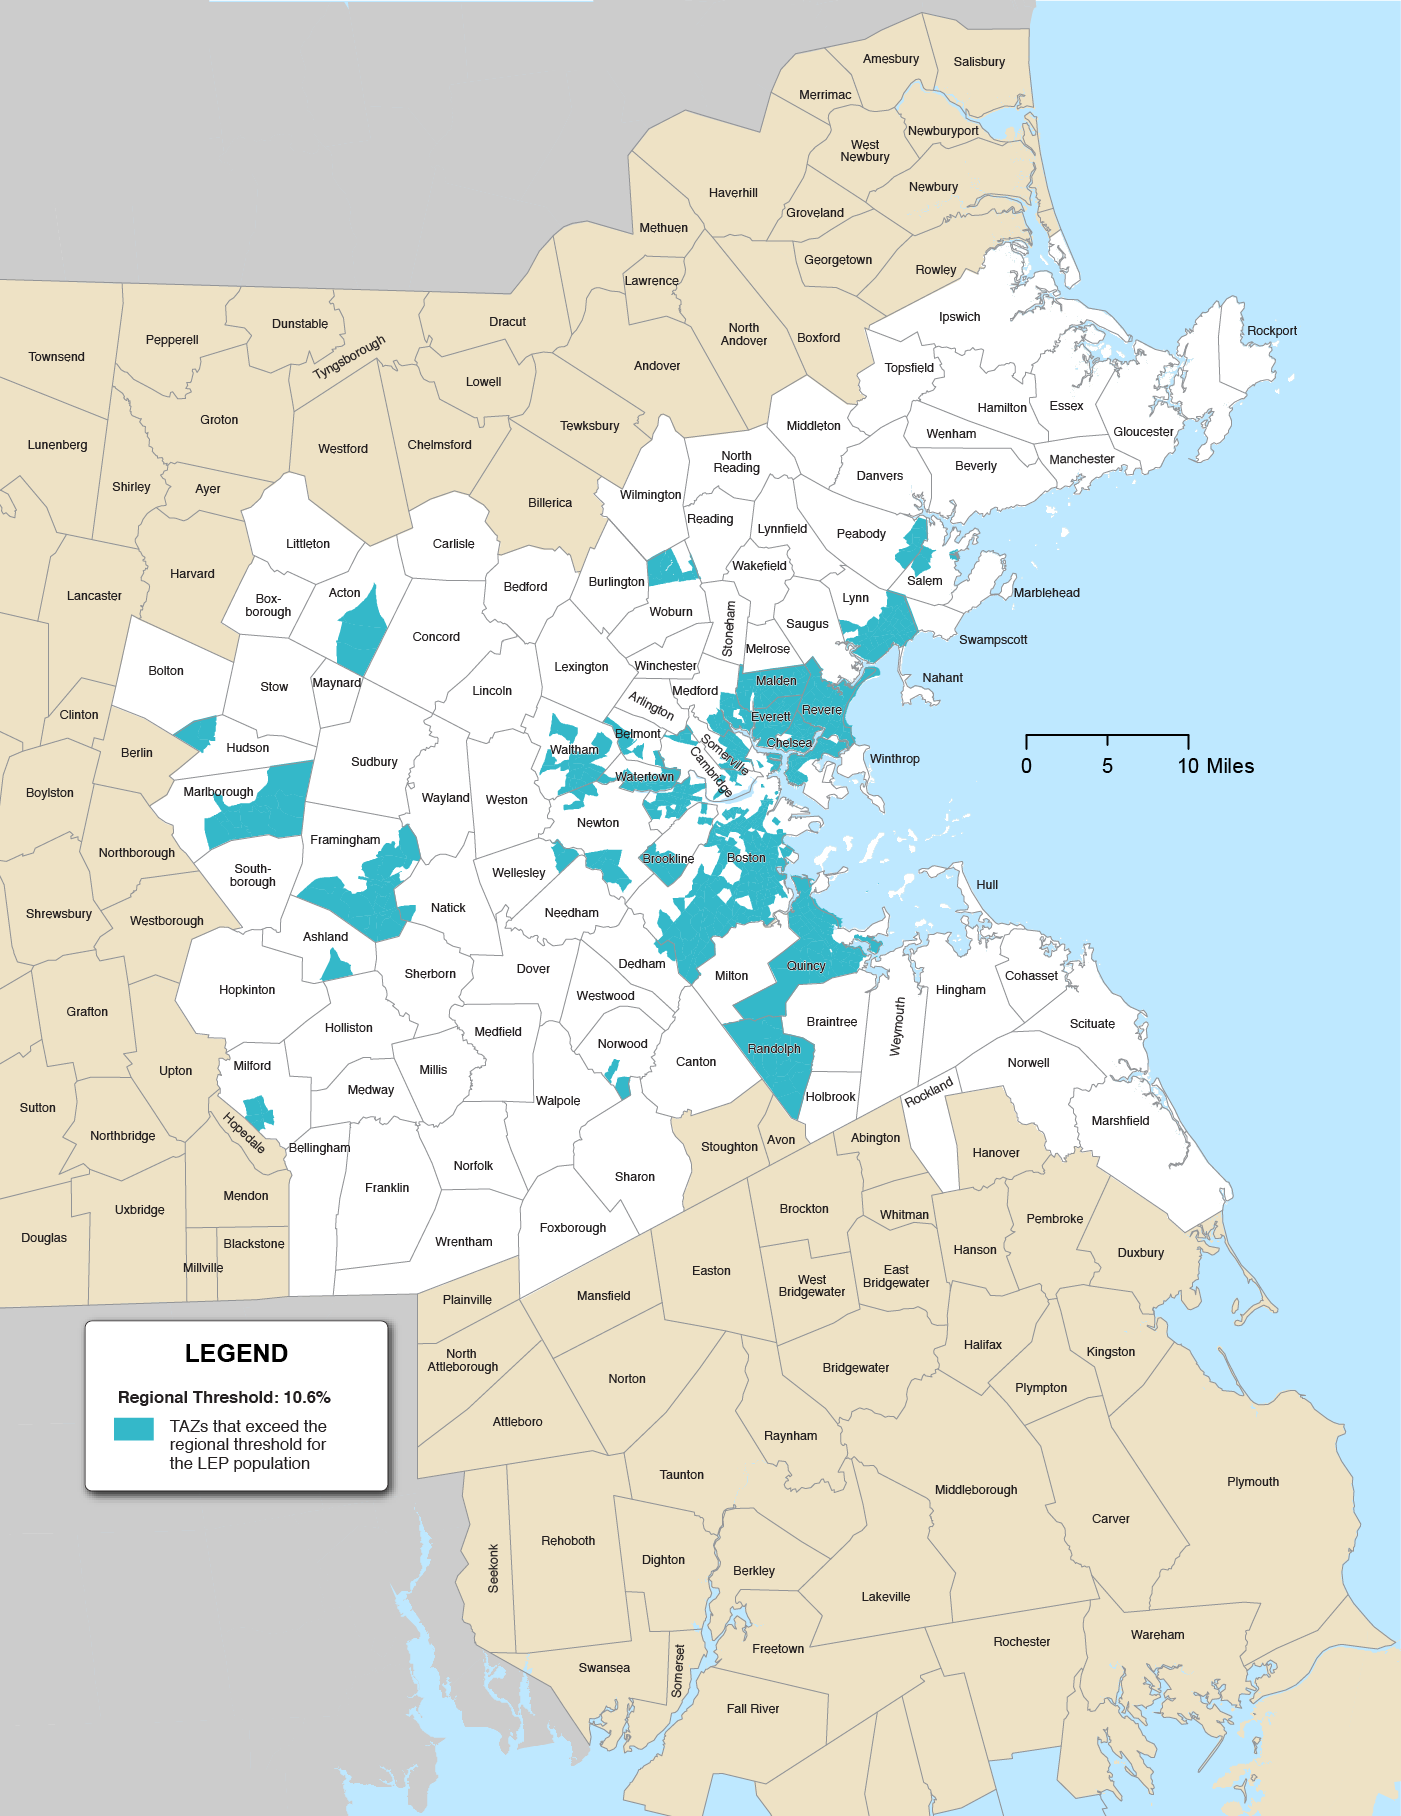
TAZ = transportation analysis zone.
Sources: 2010–14 American Community Survey and 2010 US Census.
Figure 8-4
Transportation Equity Zones: People with Disabilities
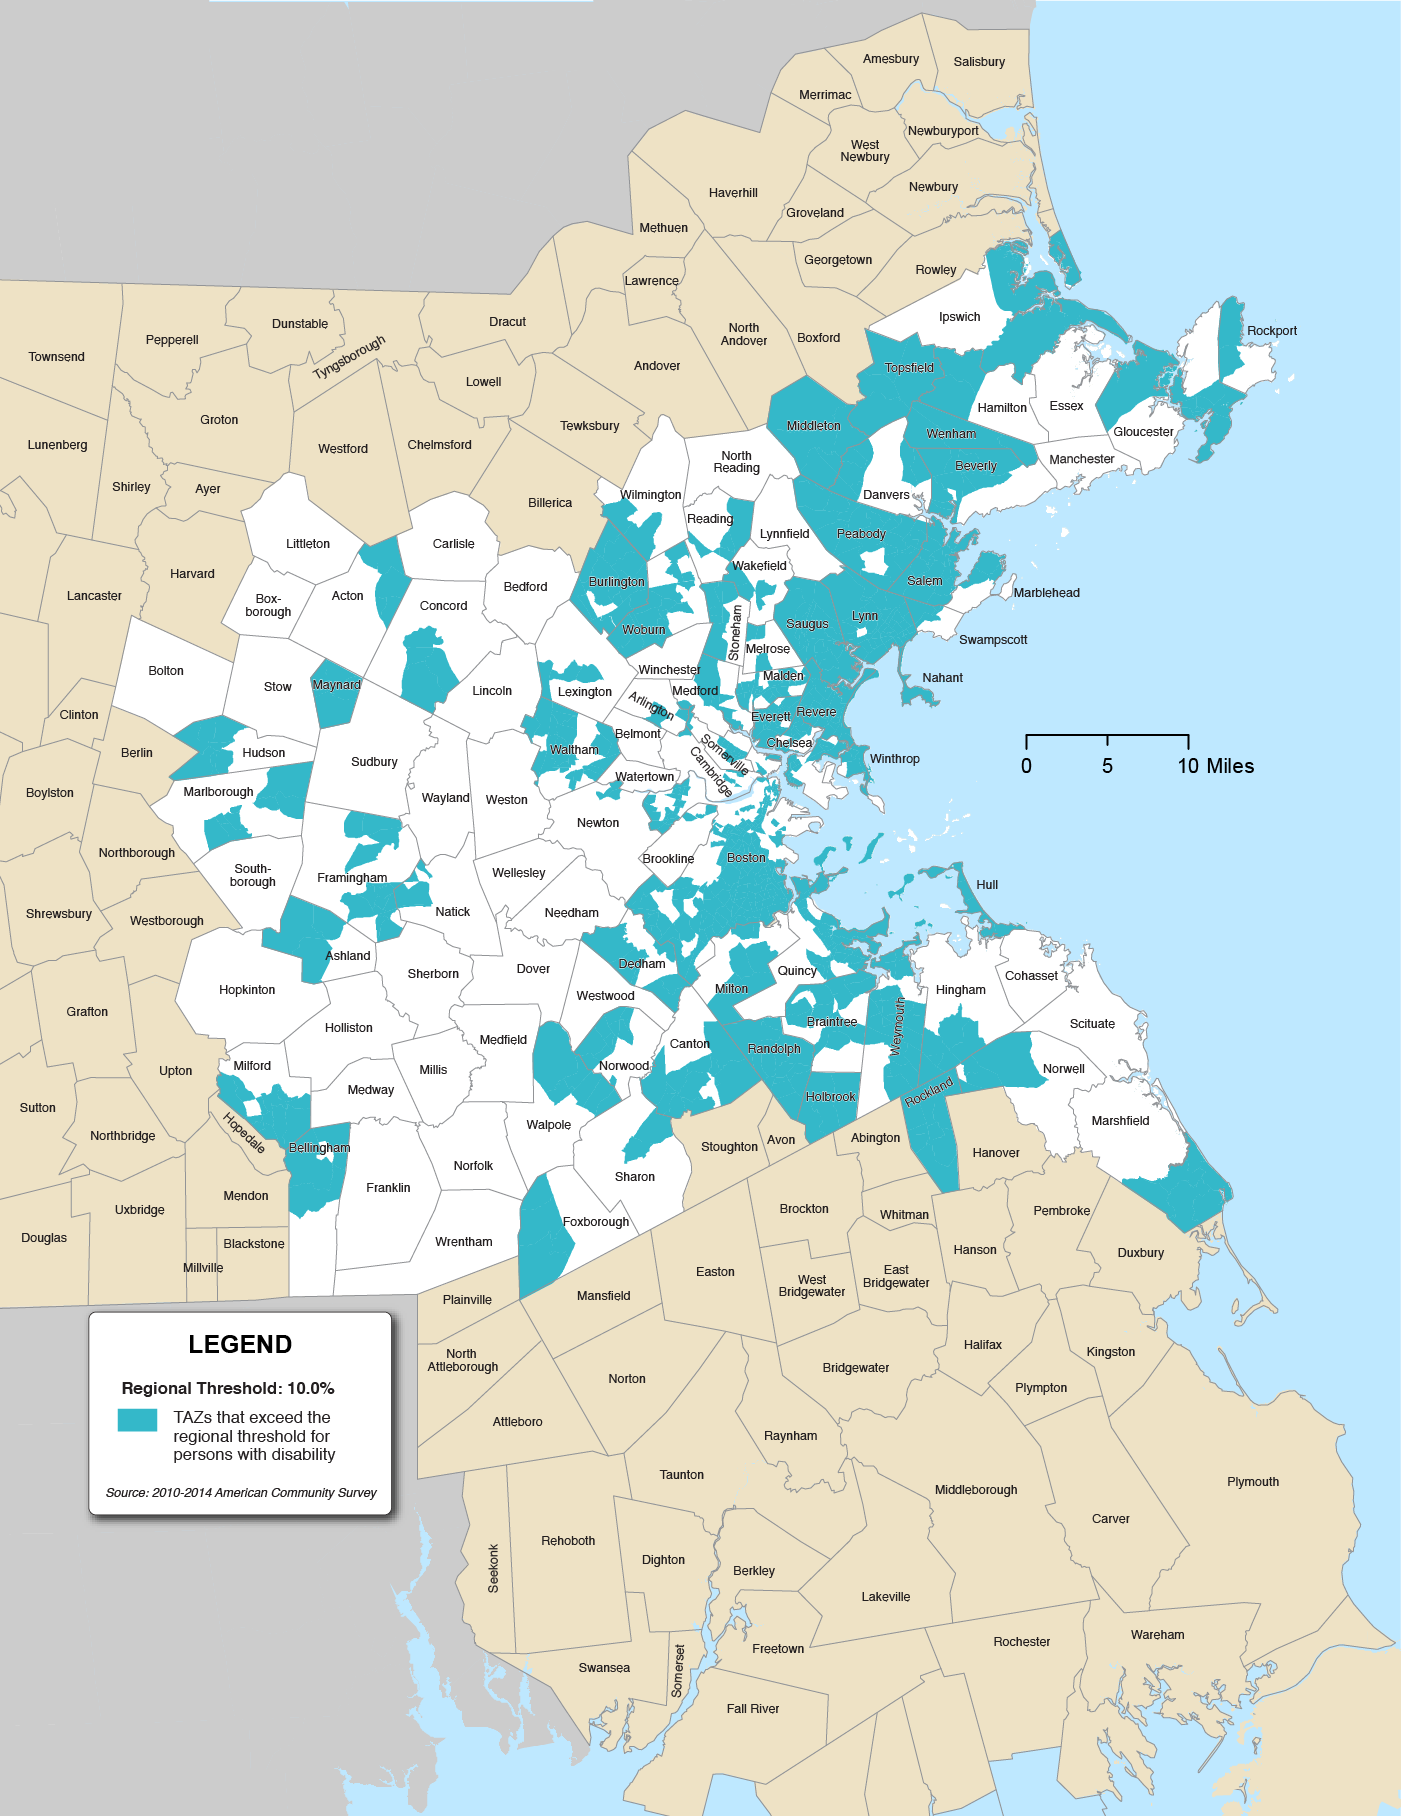
TAZ = transportation analysis zone.
Sources: 2010–14 American Community Survey and 2010 US Census.
Figure 8-5
Transportation Equity Zones: Elderly
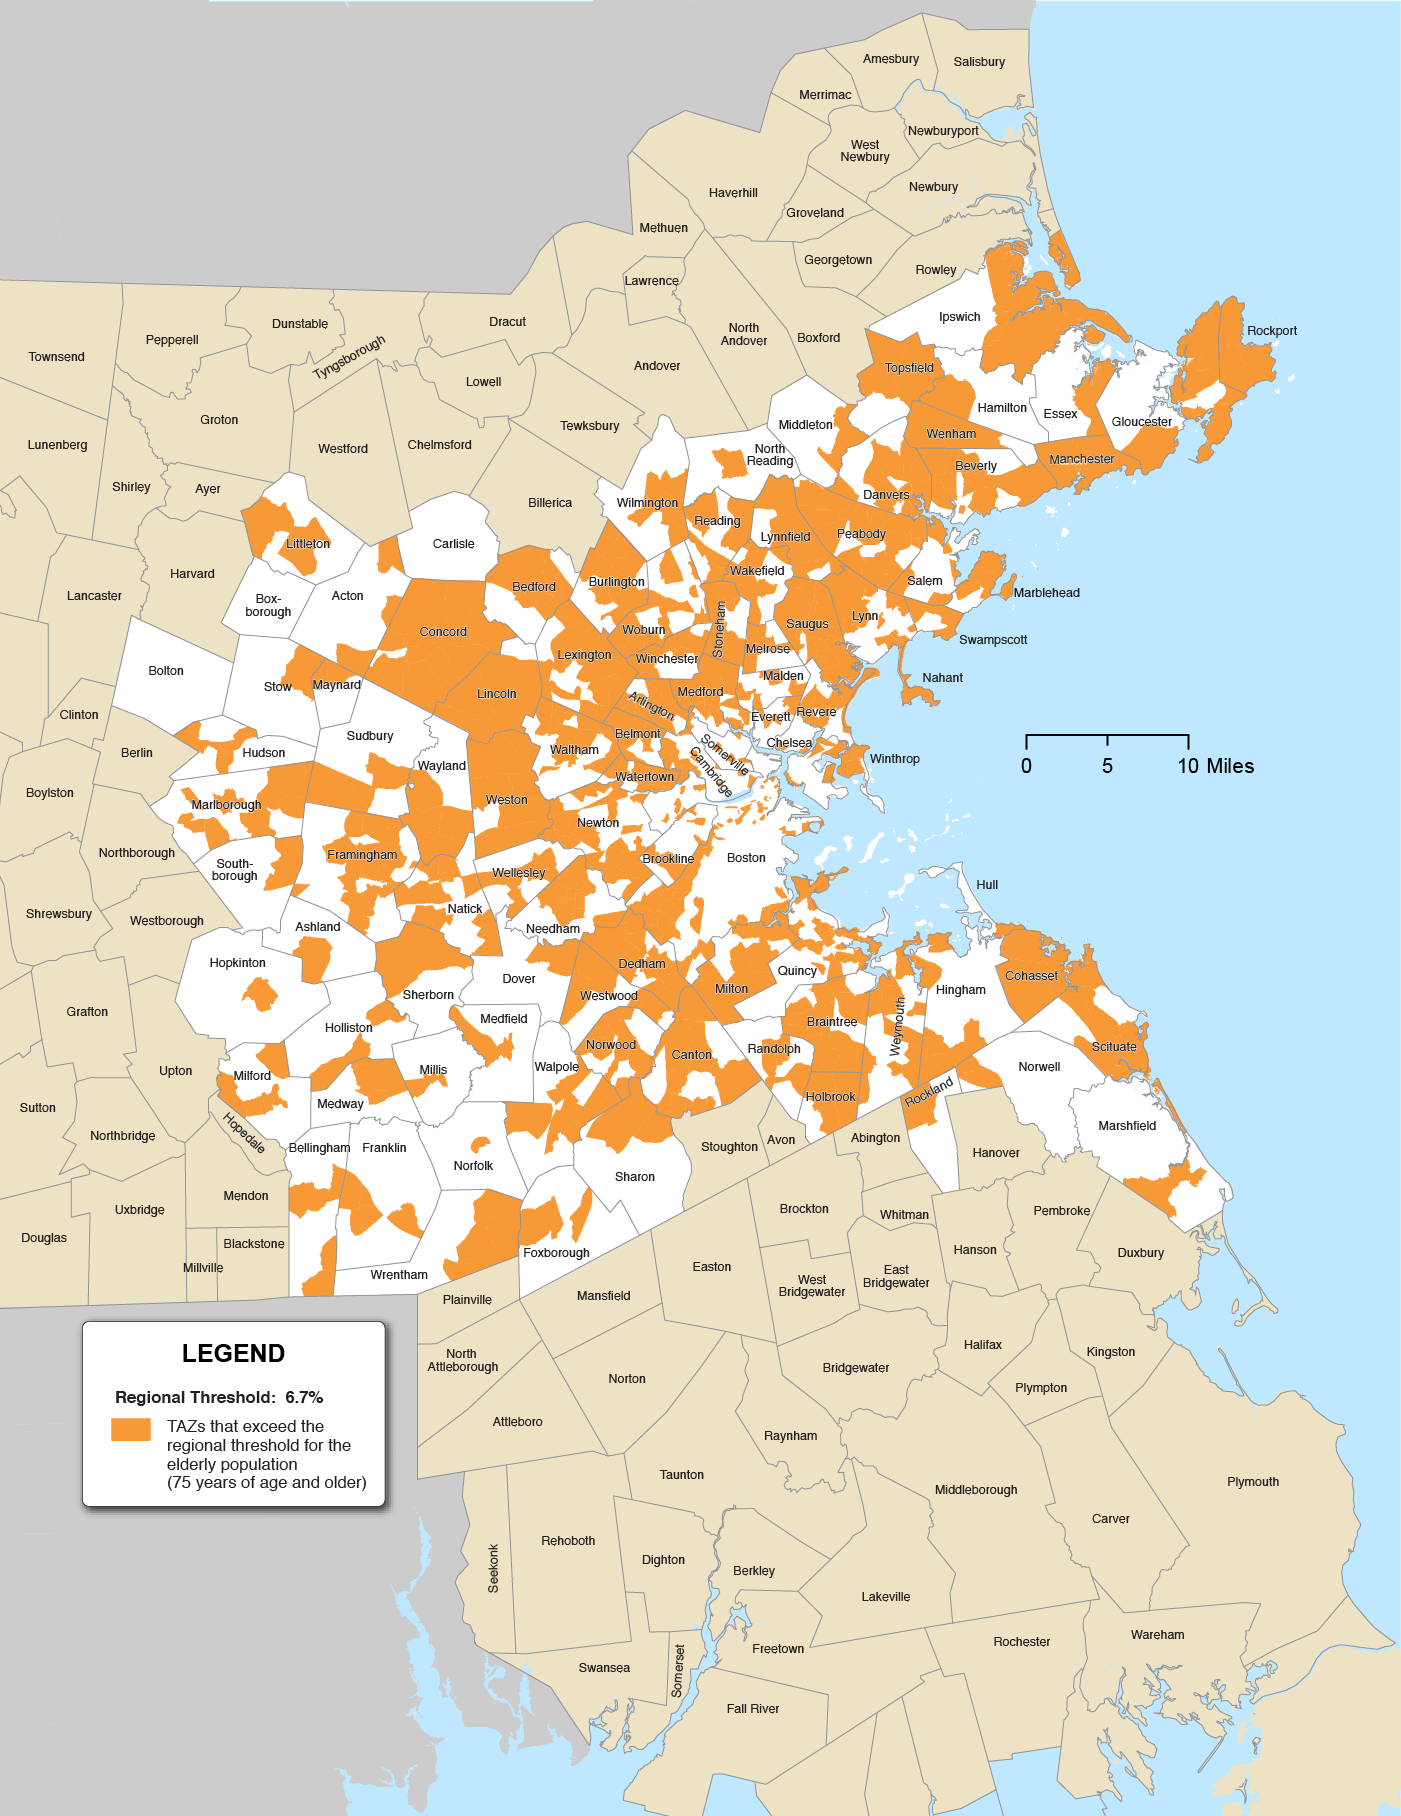
TAZ = transportation analysis zone.
Source: 2010 US Census.
Figure 8-6
Transportation Equity Zones: Youth
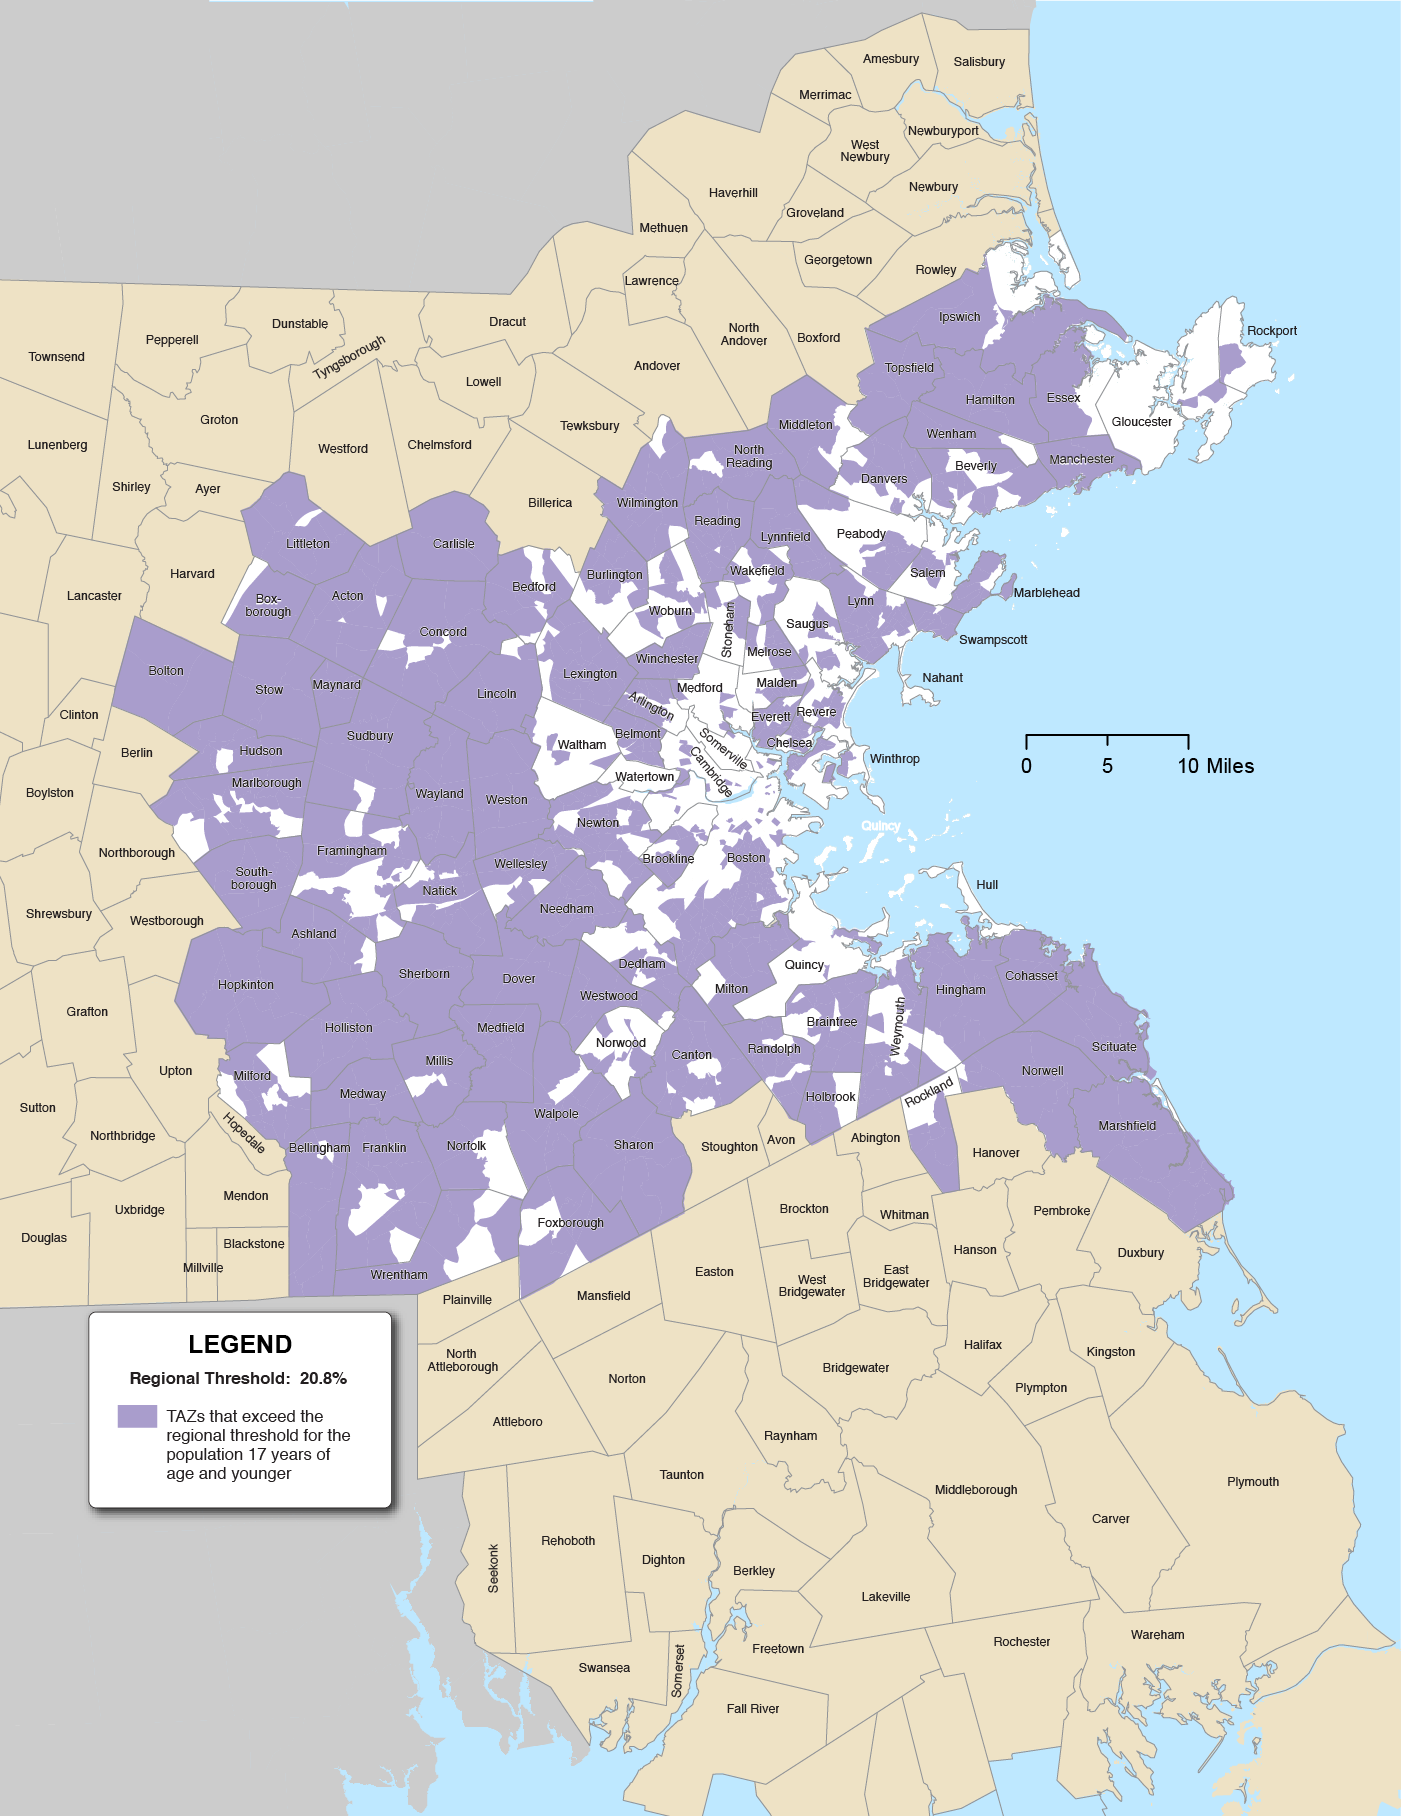
TAZ = transportation analysis zone.
Source: 2010 US Census.
Figure 8-7
Transportation Equity Zones: Transit-Dependent Households
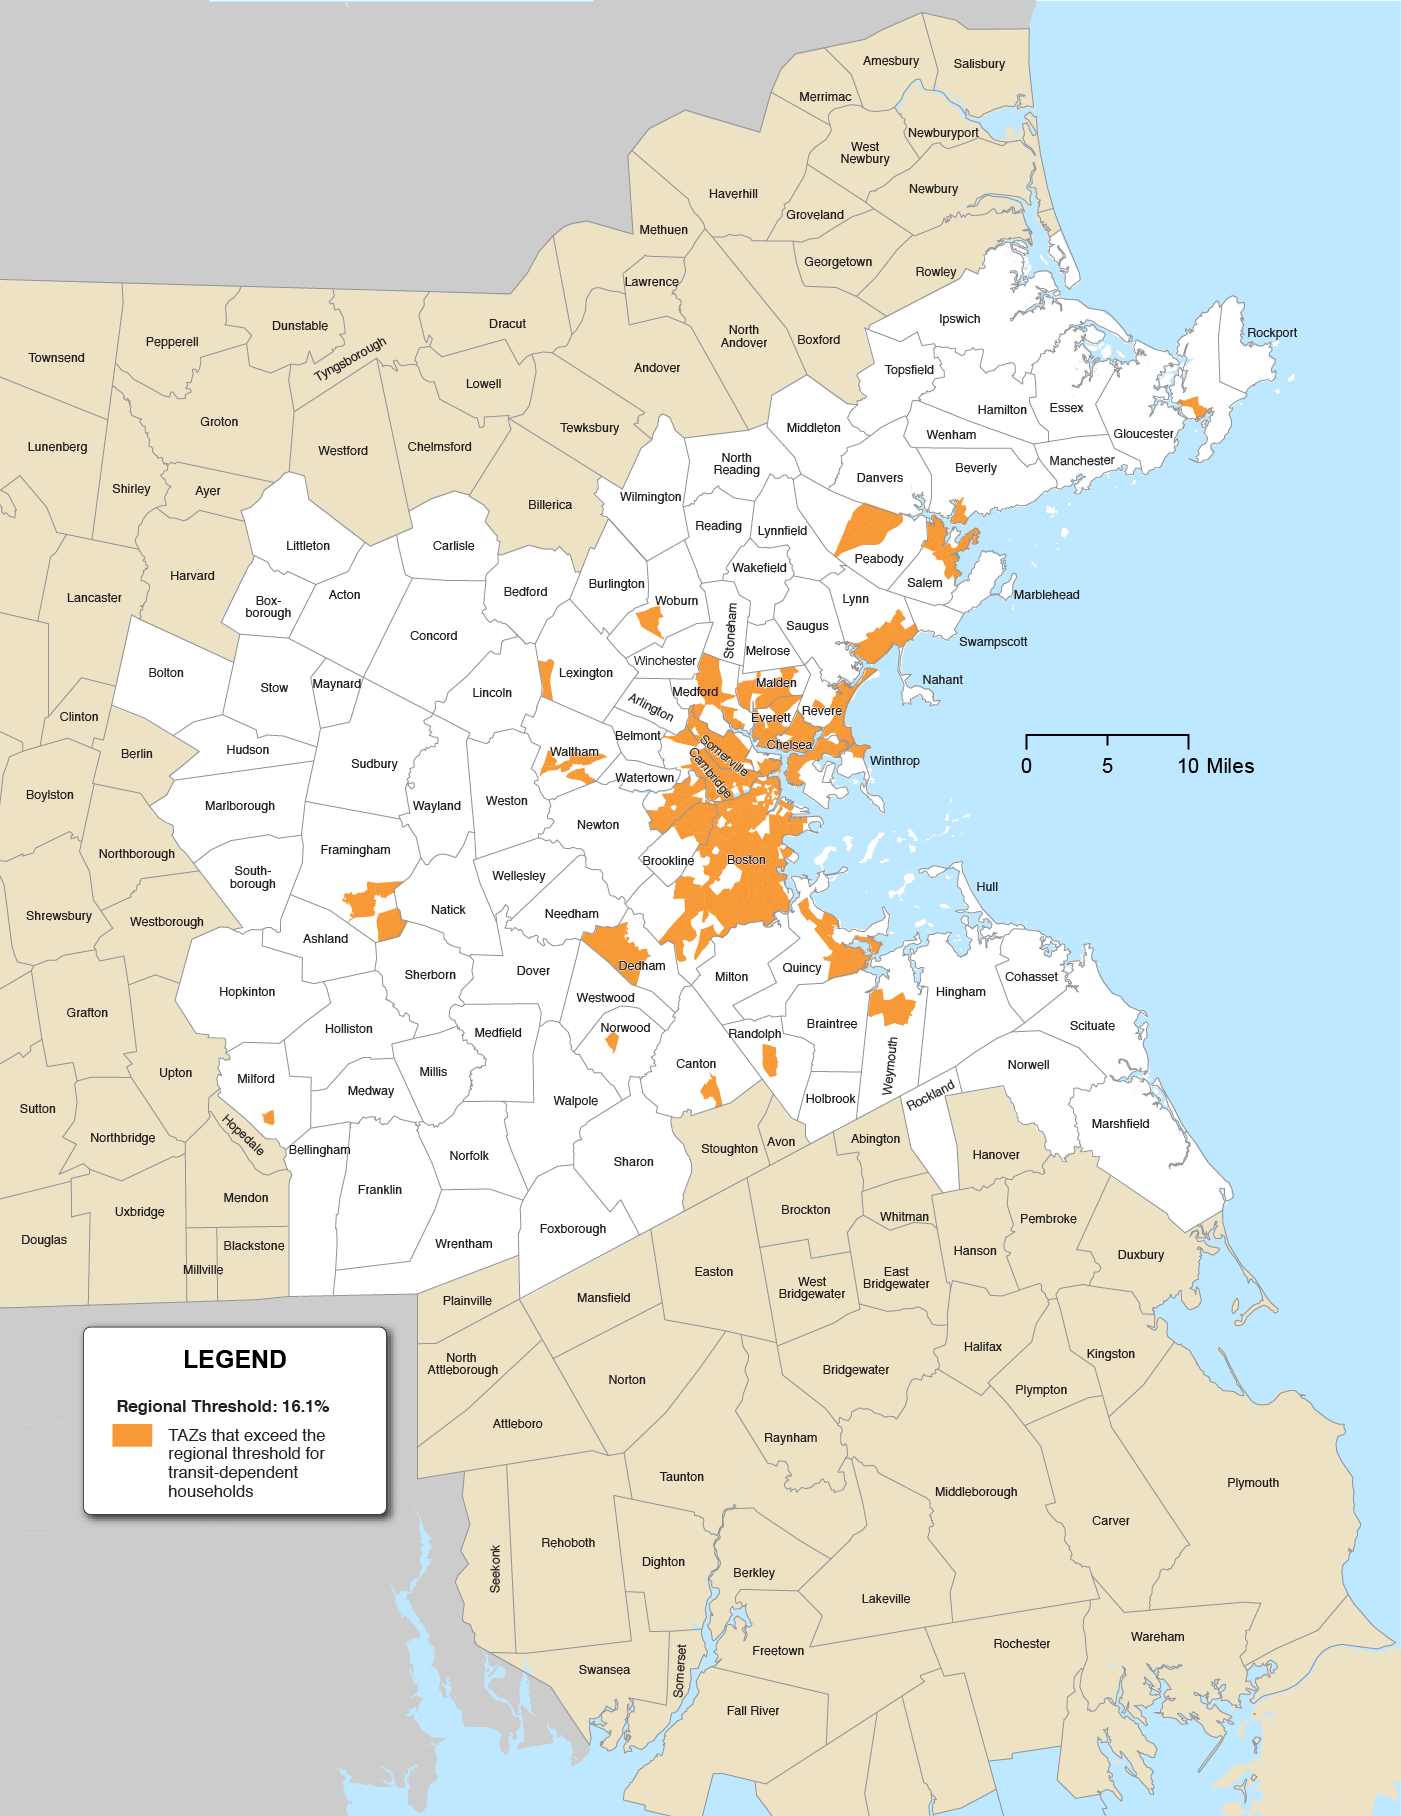
Table 8-2 shows the number of people or households that belong to each TE population, as well as the number of TAZs in which the regional thresholds are exceeded. (Thresholds for more than one TE population may be exceeded in a given TAZ.) If the regional threshold exceeds the percent of the TAZs that exceed the regional threshold, this indicates that the population is clustered geographically. Conversely, a bigger difference between the two columns indicates that the population is geographically dispersed throughout the region. Low-income households show the greatest clustering of all the TE populations, while the elderly population and people with disabilities are more evenly distributed throughout the region.
Table 8.2
Transportation Equity Populations in the Boston Region
| Transportation Equity Categorya |
Population or Households |
MPO Region Total Population or Households |
Regional Threshold |
Percent of TAZs that Exceed Regional Threshold (TEZs) |
|---|---|---|---|---|
Minority population |
870,459 |
3,087,796 |
28.2% |
33.5% |
Low-income households |
393,192 |
1,216,550 |
$45,392 |
10.1% |
People with LEP |
308,770 |
2,915,559 |
10.6% |
31.3% |
Elderly population (age 75 or older) |
206,578 |
3,087,795 |
6.7% |
38.4% |
Youth population (age 17 or younger) |
636,761 |
3,087,965 |
20.6% |
46.7% |
People with disabilities |
306,776 |
3,056,697 |
10.0% |
42.5% |
Transit-dependent households |
196,460 |
1,216,550 |
16.1% |
34.5% |
Note: Footnote 1 in this chapter describes the methods MPO staff uses to tabulate these transportation equity populations.
a For the minority, LEP, elderly, and people with disabilities categories, the amounts in the “Population or Households” and “MPO Region Total Population or Households” columns reflect numbers of people. For the low-income and transit-dependent households categories, the amount in these columns reflect numbers of households.
LEP = limited English proficiency. TAZ = transportation analysis zone. TEZ = transportation equity zone.
Sources: 2010 US Census and 2010–14 American Community Survey.
TAZ = transportation analysis zone.
Sources: 2010–14 American Community Survey and 2010 US Census.
In 2011, the Metropolitan Area Planning Council (MAPC) released its first The State of Equity in Metro Boston report, which contained a quantitative assessment of interdisciplinary equity indictors for the MAPC region (an area which covers 101 municipalities in eastern Massachusetts, including the 97 municipalities in the Boston Region MPO’s planning area). Subsequently, in 2017, MAPC published an updated report. The data in the report paint a broad picture of equity in the Boston region today, as pertains to transportation, housing, education, and employment.
The 2017 report’s transportation data show that minority and low-income populations are often at a disadvantage when it comes to transportation. Minority commuters as a whole spend more time commuting than nonminority commuters, whether traveling by bus, subway, or car. Additionally, low-income households and minority-headed households are less likely to own a vehicle. Black and Latino households have an average of 1.1 vehicles per household, Asian households have an average of 1.4 vehicles, and White households have an average of 1.7 vehicles.4
Transportation challenges that minority and low-income populations face may be compounded by other socioeconomic and demographic factors. Over the past decade, between 2000 and 2010, the share of the population in the region that identifies as minority increased from 21 percent to 28 percent. The percent of the population born outside of the United States increased about two percent during that time, with Latin American-born residents comprising the largest share of the immigrant population.5 Data also show that the number of elderly residents is increasing as the baby boomers age; this trend may also lead to an increase in the number of residents with disabilities, as people age 75 or older are the cohort most likely to have disabilities. While the region’s population age 75 and older will be mostly those who identify as racially white in the near future, the region’s younger residents are more racially and ethnically diverse which will eventually lead to a much more diverse elderly population.6
These demographic changes will affect the transportation needs of the region’s residents. Baby boomers choosing to age in place will need ways to get around other than by single occupancy vehicles. This challenge may be particularly acute in the suburbs, where transit service is limited. Younger residents will continue to require options for access to education, employment, and recreational opportunities.
MAPC’s report also shows that metropolitan Boston continues to have among the highest housing costs in the country, and that these costs are unevenly distributed among different demographic groups. About half of renters are considered housing cost-burdened, while about one-third of home owners are also considered housing cost-burdened. These rates are even higher for the elderly population. The burdens of housing costs are linked to transportation access and costs; the notion of “drive until you qualify” means that those who cannot afford housing near Boston look further out in the suburbs for affordable housing. This situation can impose significant travel times, induce stress, limit time available for other healthier activities (such as socialization with family or exercise), and inflict higher transportation costs on households.7
MAPC has produced demographic projections for age cohorts and household income. Consistent with recent trends, the share of the population age 75 and older is expected to increase. The number of people in the lowest household income category is expected to increase, while those in the higher household income categories are expected to decrease. The repercussions of these trends mean the transportation providers and those that program funding—including the MPO—may increasingly have to address the transportation needs of elderly and low-income populations. Chapter 2 discusses in detail projections to 2040; those findings relevant to transportation equity are discussed here.
Figure 8-8 shows the age cohort breakdowns of the population in households for the baseline year of 2010 and projections to 2040. Between 2010 and 2040, the cohort of people age 75 years and older is projected to increase from six percent to 11 percent of the region’s total population. The cohort between 20 and 74 years old is expected to decrease from 70 percent to 69 percent. And, the cohort of people age 19 years and younger is expected to decrease from 23 percent to 20 percent. All three age cohorts are projected to increase in total population size. In addition, average household size is expected to decline. The elderly population, in particular, is expected to experience a large increase in single person households. A smaller percentage of households are expected to have children, as well. The data suggest that the MPO will increasingly have to plan for the transportation needs of the elderly as they make up an increasing share of the region’s population.
Figure 8-8
Household Population Change in the Boston Region: 2010 to 2040
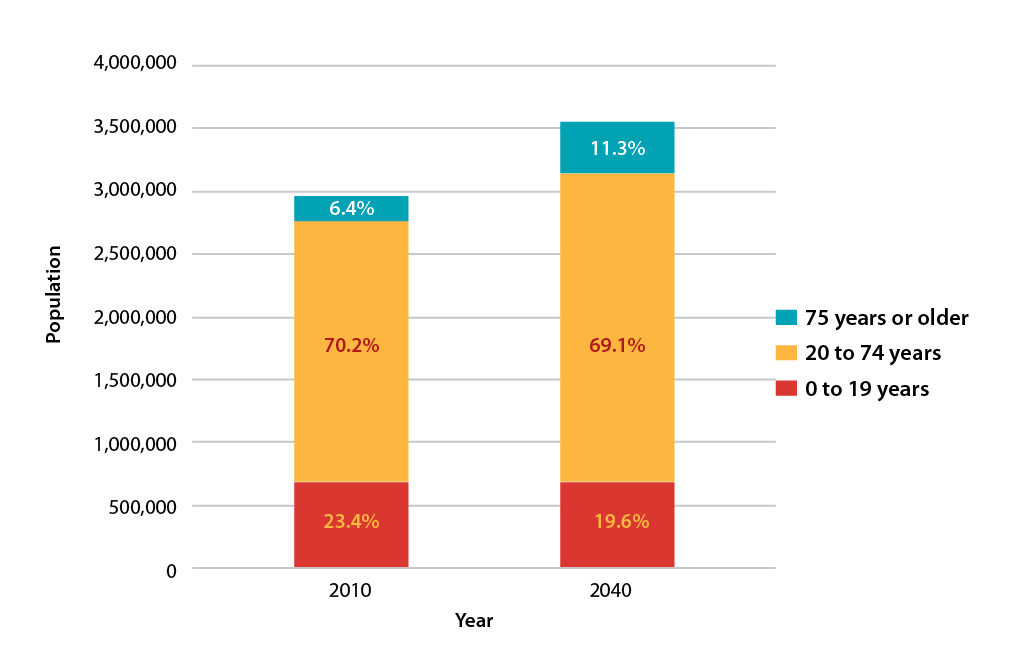
Note: These data include household population only; the group quarters population is excluded.
Source: Metropolitan Area Planning Council.
Figure 8-9 shows the number of households in 2010 and projections to 2040 broken out into four income groups: household income less than or equal to $35,000 (low); between $35,001 and $75,000 (medium-low); between $75,001 and $125,000 (medium-high); and greater than $125,000 (high). The number of households in all four categories is expected to increase. The percent of households in the lowest income category is expected to increase the most, by two percent. Households in the highest income category are projected to decrease the most, by one percent. These data show that the share of lower-income households is expected to increase.
Figure 8-9
Household Income in the Boston Region: 2010 and 2040
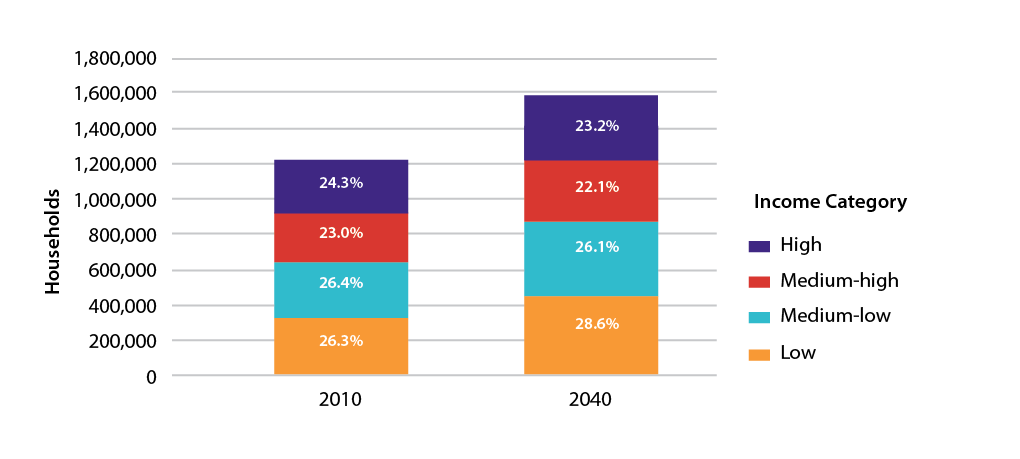
Note: Low: household income <=$35,000; Medium-low: household income $35,001 <=$75,000;
Medium-high: household income $75,001 <=$125,000; and High: household income >$125,000.
Source: Metropolitan Area Planning Council.
The MPO’s safety goal is to reduce the number and severity of crashes and safety incidents for all modes, reduce serious injuries and fatalities from transportation, and make investments and support initiatives that help protect transportation users, employees, and the public from safety and security threats. Safety of the users of the transportation network is a top priority for the MPO, as well as for the state and the federal government. The MPO’s effort to address safety issues has largely been focused on taking steps to reduce the number and severity of crashes through programming projects in the TIP and LRTP. With those aims in mind, the analyses in this section mirror the analyses completed in the Safety Needs chapter, analyzing the distribution of crash clusters in communities with high shares of TE populations. The results show how many crash clusters are in TAZs with high shares of TE populations.
To address crashes in the region, the MPO examines crash cluster locations, identified by the Massachusetts Department of Transportation (MassDOT). MPO staff considers the number of crash clusters within the project area when evaluating TIP and LRTP projects. These clusters are only those on roadways that are eligible for federal Highway Safety Improvement Program (HSIP) program funding, which supports roadway safety improvements.
MassDOT identifies locations that are high-priorities for safety improvements by using the Equivalent Property Damage Only (EPDO) index to assess the severity of crashes. Weighted values are assigned to each crash based on whether the crash resulted in property damage (unweighted), injury (weighted by 5), or a fatality (weighted by 10). Based on the EPDO values, MassDOT maps crash clusters and establishes the high-priority locations for safety improvements. These clusters represent crashes involving motor vehicles (“all-mode” crash clusters), bicycles, and pedestrians. These locations represent the top five percent of each crash cluster type in each regional planning agency’s (RPA) area. (A more detailed description of this method is described in the Safety Needs chapter.) As MassDOT does not identify crash clusters for crashes that involve trucks, MPO staff has developed a similar methodology to identify crash clusters for truck crashes in the Boston region. This section analyzes the distribution of each modal crash cluster in TEZs, as well as the locations of the top-ranked crash clusters. (Crash clusters can be viewed in the LRTP Needs Assessment application.)
All-mode crash clusters are those that involve a vehicle. The most recent set of crash cluster data from MassDOT is based on 2013–15 crash data. There are 993 crash cluster locations that are eligible for HSIP funding in the Boston region—which represent the top five percent of the all-mode crash clusters. Table 8-3 shows these 75 crash clusters with an EPDO index value of at least 150 and the location of those crashes. The table also identifies which types of TEZs the crash clusters are in. Of the 75 crash clusters, only one—Interstate 93 at the Leverett Connector in Boston—is not in a TEZ. None of the crash clusters are in all seven TEZ types. Five are in six TEZs types: Interstate 93 southbound near East Berkeley Street in Boston; Morton Street at Harvard Street in Boston; Interstate 93 at the ramps to Frontage Road (southbound) and Southhampton Street; Revere Beach Parkway at Webster Avenue in Chelsea; and Route 9 (Worcester Road) west of Caldor Road in Framingham.10
Table 8-3
Top-Ranked 2013–15 All-Mode Crash Clusters within Transportation Equity Zones
| Crash Cluster Location |
Municipality |
Cluster EPDO Value |
Within Minority TEZ(s) |
Within Low-income TEZ(s) |
Within LEP TEZ(s) |
Within Elderly TEZ(s) |
Within Youth TEZ(s) |
Within Transit- Dependent Household TEZ(s) |
Within Disability TEZ(s) |
Total TEZs Crash is Within |
|---|---|---|---|---|---|---|---|---|---|---|
Interstate 93 (southbound) at ramp to Columbia Road |
Boston |
638 |
X |
|
X |
|
|
X |
|
3 |
Middlesex Turnpike at Interstate 95 |
Burlington |
577 |
X |
|
|
|
|
|
X |
2 |
Interstate 93 at Interstate 95 |
Reading |
496 |
|
|
|
X |
X |
|
|
2 |
Interstate 93 at North Washington Street |
Boston |
491 |
X |
|
|
|
X |
X |
X |
4 |
Interstate 93 near ramps to Furnace Brook Parkway (north of Exit 8) |
Quincy |
405 |
|
|
X |
|
|
|
|
1 |
Interstate 95 at Route 4 (Bedford St) |
Lexington |
399 |
X |
|
|
X |
X |
|
|
3 |
Interstate 93 at Route 3A (Gallivan Boulevard/ |
Boston |
391 |
|
|
|
X |
|
X |
X |
3 |
Interstate 93 at Granite Ave (Exit 11) |
Milton |
391 |
|
|
|
X |
X |
|
|
2 |
Route 9 at Interstate 95 |
Wellesley |
374 |
X |
|
X |
|
X |
|
|
3 |
Interstate 93 (northbound) near Exit 23 (Government Center) |
Boston |
349 |
|
|
|
X |
|
X |
X |
3 |
Interstate 95 at ramps to Neponset Street |
Norwood |
348 |
|
|
|
X |
X |
|
|
2 |
Route 62 (Elliot Street) near Route 128 |
Danvers |
326 |
|
|
|
X |
X |
|
X |
3 |
Interstate 93 near ramps for Furnace Brook Parkway (south of Exit 8) |
Quincy |
315 |
X |
|
X |
|
|
|
|
2 |
Interstate 93 at Montvale Avenue |
Woburn, Stoneham |
310 |
|
|
|
X |
|
|
X |
2 |
Interstate 93 at ramps to Victory Road (south of Exit 13) |
Boston |
305 |
|
|
|
|
|
|
X |
1 |
East Street Rotary at East and Canton Streets |
Westwood |
294 |
|
|
|
X |
X |
|
|
2 |
Interstate 93 at Columbia Road (south of Exit 15) |
Boston |
290 |
X |
|
X |
|
|
X |
|
3 |
Interstate 93 (northbound) at ramp to Interstate 95 |
Stoneham |
281 |
|
|
|
X |
X |
|
X |
3 |
Route 3 at ramps to Route 18 (Main St) (Exit 16) |
Weymouth |
273 |
|
|
|
X |
|
|
X |
2 |
Interstate 93 at Morrissey Boulevard |
Boston |
266 |
X |
|
X |
|
|
X |
X |
4 |
Interstate 93 (northbound) at Route 37 (Granite Street) |
Braintree |
265 |
X |
|
|
|
X |
|
X |
3 |
Interstate 95 at Route 3 |
Burlington |
262 |
|
|
|
X |
|
|
X |
2 |
Interstate 93 (southbound) near East Berkeley Street |
Boston |
260 |
X |
X |
X |
X |
|
X |
X |
6 |
Interstate 93 at Leverett Connector |
Boston |
251 |
|
|
|
|
|
|
|
0 |
Interstate 93 (southbound) at Exit 23 (I-90 to Purchase Street) |
Boston |
240 |
|
|
X |
X |
|
X |
X |
4 |
Interstate 495 at Route 2 |
Littleton |
233 |
|
|
|
X |
X |
|
|
2 |
Route 18 (Main Street) at West St |
Weymouth |
229 |
|
|
|
|
X |
|
X |
2 |
Route 37 (Granite Street) at Forbes Road |
Braintree |
228 |
|
|
|
|
X |
|
|
1 |
Interstate 93 (northbound) at ramps to Route 3 |
Braintree |
227 |
X |
|
|
|
X |
|
X |
3 |
Interstate 93 (near ramps to Granite Avenue) |
Milton |
225 |
|
|
|
X |
X |
|
|
2 |
Route 28 at Route 3 (Leverett Circle) |
Boston |
221 |
X |
|
|
|
|
X |
X |
3 |
Route 28 at Route 16 |
Medford |
220 |
X |
|
X |
X |
|
X |
X |
5 |
Route 3A (Southern Artery) at Broad Street |
Quincy |
218 |
|
|
X |
X |
|
X |
X |
4 |
Interstate 93 south of Exit 20 (Massachusetts Avenue Connector) |
Boston |
218 |
X |
|
X |
|
|
|
X |
3 |
Route 28 (Embankment Road) at Route 3 (near Longfellow Bridge) |
Boston |
215 |
|
|
|
|
|
X |
|
1 |
Route 1 at Route 129 |
Lynnfield |
213 |
|
|
|
X |
X |
|
|
2 |
Interstate 95 at Route 30 (north of Exit 24) |
Weston |
203 |
|
|
|
X |
X |
|
|
2 |
Route 1 at Salem Street |
Malden, Revere |
200 |
X |
|
X |
|
X |
|
X |
4 |
Interstate 93 at Upton Street |
Quincy |
198 |
|
|
X |
|
|
|
|
1 |
Interstate 95 at Totten Pond Road |
Waltham |
198 |
X |
|
X |
X |
X |
|
X |
5 |
Interstate 93 (southbound) at Route 37 (Granite Street) |
Braintree |
197 |
X |
|
|
|
X |
|
X |
3 |
Morton Street at Harvard Street |
Boston |
195 |
X |
X |
X |
|
X |
X |
X |
6 |
Interstate 93 near Long Wharf |
Boston |
194 |
X |
|
|
|
|
X |
X |
3 |
Interstate 95 at Route 2 |
Lexington |
193 |
X |
|
|
X |
X |
X |
X |
5 |
Interstate 90 near Oak Street |
Weston |
191 |
|
|
|
X |
X |
|
|
2 |
Massachusetts Avenue near Memorial Drive |
Cambridge |
190 |
X |
|
|
|
|
X |
|
2 |
Route 1 (Newburyport Turnpike) at Route 1 Connector |
Peabody |
189 |
|
|
|
X |
|
X |
X |
3 |
Condon Circle at Salem Street |
Lynnfield, Lynn |
187 |
|
|
|
X |
X |
|
X |
3 |
Interstate 95 (northbound) at Route 20 |
Waltham |
185 |
|
|
|
|
|
|
X |
1 |
Route 85 (Cedar Street) at Fortune Boulevard |
Milford |
181 |
|
|
|
X |
X |
|
X |
3 |
Interstate 93 at Massachusetts Avenue Connector |
Boston |
180 |
X |
|
X |
|
|
|
X |
3 |
Interstate 93 (near Zakim Bridge) |
Boston, Cambridge |
179 |
X |
|
|
|
|
X |
X |
3 |
Interstate 95 at ramps to Route 16 |
Newton |
178 |
|
|
|
X |
X |
|
|
2 |
Interstate 95 (southbound) at Route 20 |
Waltham |
176 |
X |
|
X |
X |
|
X |
X |
5 |
Interstate 93 at Route 138 (Washington Street) |
Canton |
172 |
|
|
|
X |
X |
|
X |
3 |
Union Street Rotary at ramp to Route 3 (southbound) |
Braintree |
171 |
|
|
|
|
|
|
X |
1 |
Route 2 at Reformatory Circle |
Concord |
170 |
X |
|
|
X |
X |
|
|
3 |
Hammond Pond Parkway at Route 9 (Boylston Street) |
Newton |
167 |
|
|
|
X |
|
|
|
1 |
Route 126 (Hartford Avenue) at Deerfield Lane |
Bellingham |
166 |
|
|
|
|
X |
|
X |
2 |
Interstate 95 at Route 135 |
Dedham |
164 |
|
|
|
X |
|
X |
X |
3 |
Route 18 (Main Street) at Pond and Pleasant Streets |
Weymouth |
164 |
|
|
|
|
X |
|
X |
2 |
Interstate 93 at ramps to Frontage Rd (southbound)/Southhampton St |
Boston |
163 |
X |
X |
X |
|
X |
X |
X |
6 |
Revere Beach Parkway at Webster Avenue |
Chelsea |
162 |
X |
|
X |
|
X |
X |
X |
5 |
Interstate 95 (northbound) at ramps to East Street |
Westwood |
160 |
|
|
|
X |
X |
|
|
2 |
Interstate 93 northbound at ramp to South Main Street |
Foxborough |
159 |
|
|
|
X |
X |
|
|
2 |
Route 3 northbound at ramp to Derby Street |
Hingham |
158 |
|
|
|
X |
X |
|
X |
3 |
Broadway at Route 129 (Lynnfield Street) |
Lynn |
158 |
|
|
|
|
X |
|
X |
2 |
Route 3 southbound at ramp to Union Street |
Braintree |
158 |
|
|
|
X |
X |
|
X |
3 |
Route 9 (Worcester Road) at Cochituate Road |
Framingham |
155 |
X |
|
X |
X |
|
X |
X |
5 |
Interstate 95 northbound at ramp to Washington Street |
Woburn |
154 |
|
|
X |
|
|
|
X |
2 |
Interstate 90 at ramps to Interstate 95 |
Weston |
152 |
|
|
|
X |
X |
|
|
2 |
Soldiers Field Road at North Harvard Street |
Boston |
152 |
X |
X |
|
|
|
X |
|
3 |
Route 1A at Premium Outlets Boulevard |
Wrentham |
151 |
|
|
|
X |
|
|
|
1 |
Route 9 (Worcester Road) west of Caldor Road |
Framingham |
150 |
X |
|
X |
X |
X |
X |
X |
6 |
Interstate 93 at Derby Street |
Hingham |
150 |
|
|
|
X |
X |
|
X |
3 |
Note: Clusters were selected from Massachusetts 2013–15 HSIP-eligible all-mode crash cluster locations in the Boston region.
EPDO = equivalent property damage only. HSIP = Highway Safety Improvement Program. LEP = limited English proficiency. TEZ = transportation equity zone.
Sources: Massachusetts Department of Transportation; 2010 US Census; 2010–14 American Community Survey; and Boston Region MPO.
Pedestrian crash clusters involve at least one vehicle and one pedestrian. MassDOT has identified pedestrian crash clusters based on 2006–15 crash data and by mapping a 100-meter buffer around the crashes. Table 8-4 shows the top ranked pedestrian crash clusters in the Boston region—those with an EPDO index value of at least 100, of which there are 22—their locations, and the types of TEZs they are in. All of the clusters are within at least one TEZ. Three clusters are within all seven types of TEZs: Downtown Lynn (Essex, Union, Liberty, and Central Streets, and surrounding streets); Downtown Salem (Washington, New Derby, Lafayette, and surrounding streets); and Western Avenue (Mall Street to Franklin Street) in Lynn.
Table 8-4
Top-Ranked 2006–15 Pedestrian Crash Clusters within Transportation Equity Zones
| Crash Cluster Location |
Municipality |
Cluster EPDO Value |
Within Minority TEZ(s) |
Within Low-income TEZ(s) |
Within LEP TEZ(s) |
Within Elderly TEZ(s) |
Within Youth TEZ(s) |
Within Transit- Dependent Household TEZ(s) |
Within Disability TEZ(s) |
Total TEZs Crash is Within |
|
|
|---|---|---|---|---|---|---|---|---|---|---|---|---|
Downtown Chelsea (Broadway, Everett Avenue, and surrounding streets) |
Chelsea |
916 |
X |
X |
X |
|
X |
X |
X |
6 |
||
Downtown Lynn (Essex, Union, Liberty, and Central Streets, and surrounding streets) |
Lynn |
733 |
X |
X |
X |
X |
X |
X |
X |
7 |
||
Massachusetts Avenue (Hancock Street to Lansdowne Street, and neighboring streets, near Central Square) |
Cambridge |
432 |
X |
|
X |
X |
|
X |
|
4 |
||
Quincy Center (Hancock Street from Washington to School Streets) |
Quincy |
305 |
X |
|
X |
X |
|
X |
X |
5 |
||
Downtown Boston (near Court, Summer, Park and India Streets) |
Boston |
264 |
X |
|
X |
X |
X |
X |
X |
6 |
||
Davis Square |
Somerville, Cambridge |
257 |
|
|
|
|
|
X |
|
1 |
||
Downtown Framingham (Waverly, Concord, and Hollis Streets) |
Framingham |
219 |
X |
X |
X |
|
X |
X |
X |
6 |
||
Watertown Square (Main, Mount Auburn, North Beacon, and Galen Streets) |
Watertown |
209 |
|
|
X |
X |
|
|
|
2 |
||
Newton Centre (Beacon Street, Centre Street, and surrounding streets) |
Newton |
184 |
|
|
|
X |
X |
|
|
2 |
||
Downtown Salem (Washington, New Derby, Lafayette, and surrounding streets) |
Salem |
173 |
X |
X |
X |
X |
X |
X |
X |
7 |
||
Main Street (approximately Grant to Banks Streets) |
Waltham |
170 |
X |
|
X |
X |
|
X |
X |
5 |
||
Broadway (Mountain Avenue to Revere Beach Parkway) and Park Avenue |
Revere |
163 |
X |
|
X |
X |
X |
|
X |
5 |
||
Mt. Auburn Street and Massachusetts Avenue (Harvard Square) |
Cambridge |
158 |
X |
|
|
X |
|
X |
|
3 |
Boston Common and Downtown Crossing Areas (Tremont, Washington, Essex and Boylston Streets) |
Boston |
156 |
X |
X |
X |
X |
|
X |
X |
6 |
Prospect and Cambridge Streets (Inman Square) |
Cambridge |
126 |
X |
X |
X |
|
|
X |
X |
5 |
Central Square |
Waltham |
124 |
X |
|
X |
|
|
X |
X |
4 |
Cambridge Street (Sciarappa Street to East Street, near Route 28) |
Cambridge |
118 |
X |
|
X |
X |
|
X |
X |
5 |
Harvard Street (near Coolidge Corner) |
Brookline |
115 |
X |
|
X |
X |
|
X |
X |
5 |
Western Avenue (Mall Street to Franklin Street) |
Lynn |
113 |
X |
X |
X |
X |
X |
X |
X |
7 |
Hancock Street (Adams Street to Washington Street near Quincy Center) |
Quincy |
112 |
X |
|
X |
X |
|
X |
X |
5 |
Main Street (Harlow Court to Pleasant Street) |
Woburn |
101 |
|
|
|
X |
|
|
X |
2 |
Route 3A in Quincy (Sea Street to Brackett Street) |
Quincy |
100 |
X |
|
X |
X |
|
X |
X |
5 |
Note: Clusters were selected from Massachusetts 2006–15 HSIP-eligible pedestrian crash cluster locations in the Boston region.
EPDO = equivalent property damage only. HSIP = Highway Safety Improvement Program. LEP = limited English proficiency. TEZ = transportation equity zone.
Sources: Massachusetts Department of Transportation; 2010 US Census; 2010–14 American Community Survey; and Boston Region MPO.
Bicycle crash clusters involve at least one vehicle and one bicyclist. MassDOT has identified bicycle crash clusters based on 2006–15 crash data and by mapping a 100-meter buffer around the locations of these crashes. Table 8-5 shows the top-ranked bicycle crash clusters in the Boston region that have an EPDO index value greater than 100 (of which there are 10), the locations of these crash clusters, and which types of TEZs they are in. All of these crash clusters are within at least one type of TEZ. One is within all seven types of TEZs—Beacon and Hampshire Streets and Broadway (Park Street to Galileo Galilei Way) in Somerville and Cambridge.
Table 8-5
Top-Ranked 2006–15 Bicycle Crash Clusters within Transportation Equity Zones
| Crash Cluster Location |
Municipality |
Cluster EPDO Value |
Within Minority TEZ(s) |
Within Low Income TEZ(s) |
Within LEP TEZ(s) |
Within Elderly TEZ(s) |
Within Youth TEZ(s) |
Within Transit-Dependent Household TEZ(s) |
Within Disability TEZ(s)(s) |
Total TEZs Crash is Within |
|---|---|---|---|---|---|---|---|---|---|---|
Massachusetts Avenue (from Harvard Square to Memorial Drive) |
Cambridge |
989 |
X |
|
X |
X |
X |
X |
|
5 |
Beacon and Hampshire Streets and Broadway (Park Street to Galileo Galilei Way) |
Cambridge, Somerville |
942 |
X |
X |
X |
X |
X |
X |
X |
7 |
Massachusetts Avenue (near Porter Square) |
Cambridge, Somerville |
525 |
X |
|
X |
|
|
X |
|
2 |
Somerville Avenue, Summer Street, and Bow Street (near Union Square) |
Somerville |
213 |
X |
|
X |
X |
|
X |
X |
5 |
Cambridge Street (Quincy Street to Maple Avenue, near Harvard Square) |
Cambridge, Somerville |
139 |
X |
|
X |
X |
|
X |
|
4 |
Broadway and Inman Street (near Central Square) |
Cambridge |
125 |
X |
|
X |
|
|
X |
X |
4 |
Massachusetts Avenue near Cedar Street |
Cambridge |
123 |
X |
X |
X |
X |
|
X |
X |
6 |
Massachusetts Avenue at John F. Kennedy Street (near Harvard Square) |
Cambridge |
115 |
X |
|
|
X |
|
X |
|
3 |
Massachusetts Avenue near Commonwealth Avenue |
Boston |
114 |
X |
X |
X |
X |
|
X |
|
5 |
Cambridge Street and Broadway (near Harvard Square) |
Cambridge |
105 |
X |
|
|
|
|
X |
|
2 |
Note: Clusters were selected from Massachusetts 2006–15 HSIP-eligible bicycle crash cluster locations in the Boston region.
EPDO = equivalent property damage only. HSIP = Highway Safety Improvement Program. LEP = limited English proficiency. TEZ = transportation equity zone.
Sources: Massachusetts Department of Transportation; 2010 US Census; 2010–14 American Community Survey; and Boston Region Metropolitan Planning Organization.
Truck crash clusters represent crashes that involved at least one truck. MPO staff identified these crash clusters using MassDOT’s methodology for identifying all-mode crash clusters. These truck crash clusters are based on 2013–15 crash data. Table 8-6 shows the top-ranked truck crash clusters—those in the Boston region that have an EPDO index value greater than 30. The table also includes information about the locations of the crash clusters and which types of TEZs they are in. All of the crash clusters are within at least one TEZ. None are within all seven types of TEZs, but two are within six types of TEZs: Interstate 93 near the ramps to Albany Street in Boston and Kosciuszko Circle in Boston.
Table 8-6
Top-Ranked MPO-Identified Truck Crash Clusters within Transportation Equity Zones
| Crash Cluster Location |
Municipality |
Cluster EPDO Value |
Within Minority TEZ(s) |
Within Low-Income TEZ(s) |
Within LEP TEZ(s) |
Within Elderly TEZ(s) |
Within Youth TEZ(s) |
Within Transit- Dependent Household TEZ(s) |
Within Disability TEZ(s)(s) |
Total TEZs Crash is Within |
|---|---|---|---|---|---|---|---|---|---|---|
Interstate 93 at Columbia Road (north of Exit 15) |
Boston |
68 |
X |
|
X |
|
|
X |
|
3 |
Middlesex Turnpike at Interstate 95 |
Burlington |
65 |
X |
|
|
|
|
|
X |
2 |
Route 9 at Interstate 95 |
Wellesley |
53 |
X |
|
X |
|
X |
|
|
3 |
Interstate 93 near ramps for Furnace Brook Parkway (north of Exit 8) |
Quincy |
52 |
|
|
X |
|
|
|
|
1 |
Interstate 495 at Interstate 290 |
Marlborough |
48 |
X |
|
X |
|
|
|
|
2 |
Interstate 93 (northbound) near ramps for Furnace Brook Parkway (south of Exit 8) |
Quincy |
48 |
X |
|
|
X |
X |
|
|
3 |
Interstate 93 near ramps to Albany Street |
Boston |
39 |
X |
X |
X |
X |
|
X |
X |
6 |
Interstate 93 near Exit 20A (South Station) |
Boston |
38 |
|
|
X |
X |
|
X |
X |
4 |
Interstate 95 at ramps to Neponset Street |
Norwood |
36 |
|
|
|
X |
X |
|
|
2 |
Interstate 95 at Route 4 (Bedford Street) |
Lexington |
35 |
X |
|
|
X |
X |
|
|
3 |
Interstate 93 at North Washington Street |
Boston |
35 |
|
|
|
X |
X |
|
|
2 |
Interstate 93 at Interstate 95 |
Reading |
35 |
X |
|
|
|
X |
X |
X |
4 |
Kosciuszko Circle |
Boston |
34 |
X |
X |
X |
|
X |
X |
X |
6 |
Interstate 495 at Route 2 |
Littleton |
33 |
|
|
|
X |
X |
|
|
2 |
Interstate 95 at Route 20 |
Waltham |
32 |
|
|
|
|
|
|
X |
1 |
Interstate 90 at ramps to Interstate 95 (west of Exit 15) |
Weston |
31 |
|
|
|
X |
X |
|
|
2 |
Interstate 90 near Edgell Road |
Framingham |
30 |
|
|
|
|
X |
|
|
1 |
Interstate 90 near Wood Street |
Hopkinton |
30 |
|
|
|
X |
X |
|
X |
3 |
Note: Clusters were selected from 2013–15 data. Expressway and arterial routes are based on designations from the Boston Region MPO’s Congestion Management Process.
EPDO = equivalent property damage only. HSIP = Highway Safety Improvement Program. LEP = limited English proficiency. TEZ = transportation equity zone.
Sources: Massachusetts Department of Transportation; 2010 US Census; 2010–14 American Community Survey; and Boston Region MPO.
Table 8-7 shows, for each mode, the percent of crash clusters in the Boston region that are in TEZs, compared to the share of the TAZs in the region that belong to each TEZ type.
These data indicate that crash clusters are disproportionately more common in TEZs than in TAZs without TEZs. For all types of TEZs, the percent of all-mode crash clusters in TEZs exceed the percent of TEZs in the region. For example, minority TEZs represent approximately one-third of TAZs in the region, so one-third of crashes would be expected to occur in these areas; however, minority TEZs are the site of nearly 46 percent of all-mode crashes, a larger share of crashes than would be expected. TEZs also have a higher share of pedestrian and bicycle crash clusters, except for youth TEZs. Meanwhile, the percent of truck crash clusters in all TEZs types, except youth and transit-dependent TEZs, exceed the share of TEZs in the region. This indicates that most TEZ types bear a disproportionate share of crashes. This represents a potential safety need that could be addressed by MPO investments.
Table 8-7
Percent of Crash Clusters in Boston Region Transportation Equity Zones
Type of TAZ |
Percent of all TAZs |
Percent of All-mode Crash Clusters |
Percent of Bicycle Crash Clusters |
Percent of Pedestrian Crash Clusters |
Percent of Truck Crash Clusters |
Minority TEZs |
33.5% |
45.9% |
77.8% |
78.1% |
39.0% |
All other TAZs |
66.5% |
54.1% |
22.2% |
21.9% |
61.0% |
Low-income TEZs |
10.1% |
12.7% |
40.7% |
34.2% |
9.2% |
All other TAZs |
89.9% |
87.3% |
59.3% |
65.8% |
90.9% |
LEP TEZs |
31.3% |
42.7% |
63.0% |
72.6% |
32.9% |
All other TAZs |
68.7% |
57.3% |
37.0% |
27.4% |
67.1% |
Elderly TEZs |
38.4% |
57.2% |
51.9% |
63.0% |
53.6% |
All other TAZs |
61.6% |
42.8% |
48.1% |
37.0% |
46.3% |
Youth TEZs |
46.7% |
57.8% |
37.0% |
46.6% |
62.5% |
All other TAZs |
53.3% |
42.2% |
63.0% |
53.4% |
37.5% |
Disability TEZs |
42.5% |
58.2% |
53.7% |
76.7% |
51.8% |
All other TAZs |
57.5% |
41.8% |
46.3% |
23.3% |
48.2% |
Transit-dependent household TEZs |
34.5% |
35.6% |
88.9% |
80.8% |
29.9% |
All other TAZs |
65.5% |
64.4% |
11.1% |
19.2% |
70.1% |
Note: This table includes all HSIP-eligible crash clusters (all-mode, bicycle, and pedestrian) and all Boston Region Metropolitan Planning Organization-identified truck crash clusters in the Boston region. All-mode and truck crash clusters are based on 2013–15 crash data. HSIP bicycle and pedestrian crash clusters are based on 2006–15 crash data.
HSIP = Highway Safety Improvement Program. LEP = limited English proficiency. TAZ = transportation analysis zone. TEZ = transportation equity zone.
Sources: Massachusetts Department of Transportation; 2010 US Census; 2010–14 American Community Survey; and Boston Region MPO.
The crash analyses discussed above assesses the location of various modal types of crash clusters—all-mode, bicycle, pedestrian, and truck—in relation to TEZs. The crash cluster tables show which specific crash clusters are in multiple TEZs, indicating that they are in areas where residents have multiple indicators of potential disadvantage. In general, bicycle and pedestrian crash clusters tend to be in TEZs where multiple indicators of potential disadvantage are present. On average there are 4.7 bicycle crash clusters and 4.3 pedestrian crash clusters in TEZs, and an average of 2.8 all-mode and truck crash clusters. Table 8-7 shows the types of TEZs in which crash clusters are more numerous. The share in bicycle and pedestrian crash clusters are significantly more in most TEZ types. These data indicate that there is a need to address bicycle and pedestrian crashes in TEZs.
The MPO’s Capacity Management and Mobility goal aims to use existing facility capacity more efficiently and increase healthy transportation options, such as bicycling and walking, for people in the region. Mirroring analyses done in the Capacity Management and Mobility chapter, this section examines these aims through an equity lens and describes the mobility needs of TE populations in the Boston region. It examines their access to public transit, bicycle infrastructure, and shared mobility options. Results from similar analyses completed for the entire population in the region are in the Capacity Management and Mobility Needs chapter.
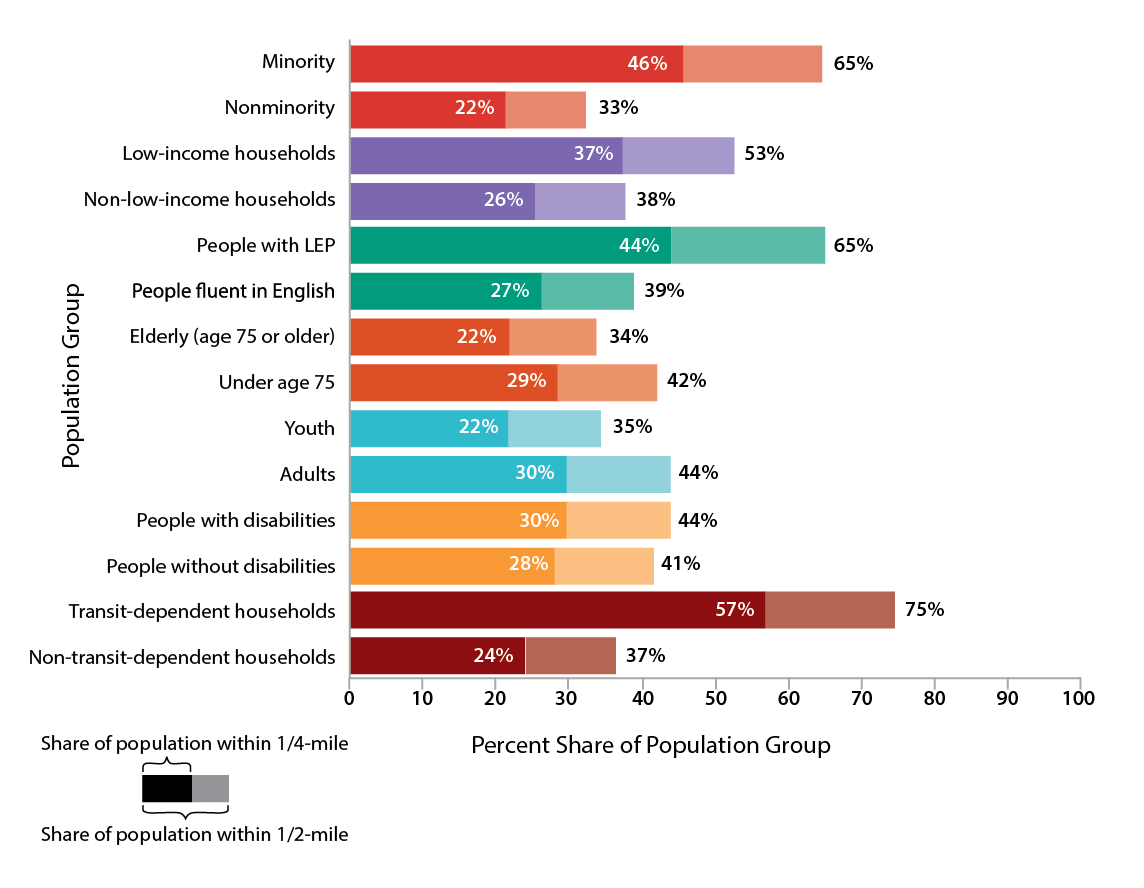
Figure 8-10 shows the percent of each TE population within one-half and one-quarter mile of all types of bicycle infrastructure in the Boston region—out of the total TE population within the region.11
Figure 8-10
Share of Transportation Equity Populations with Access to Bicycle Infrastructure
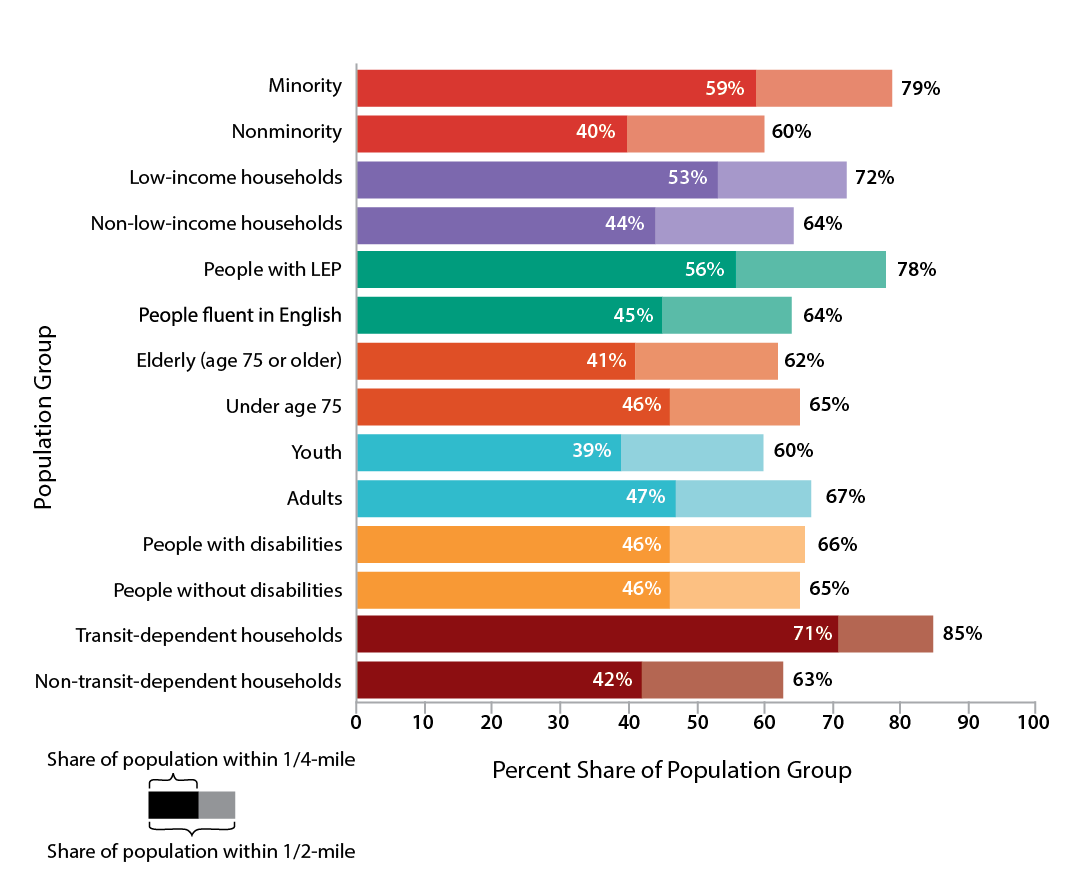
Note: Bicycle infrastructure includes facilities that provide bicyclists with their own space, including unprotected on-street bicycle lanes, on-street buffered bicycle lanes, and shared-use off-street paths. It does not include sharrows.
The share of the population group refers to the portion of the total TE or non-TE population living in the Boston region within one-quarter mile and one-half mile of the bicycle infrastructure.
LEP = limited English proficiency. TE = transportation equity.
Sources: 2010 US Census and 2010–14 American Community Survey; and Metropolitan Area Planning Council’s TrailMap.
Overall, TE populations appear to be well-served by bicycle infrastructure in the Boston region relative to their comparison populations. Over half of minority, low-income, people with LEP, and transit-dependent populations live within one-quarter mile of bicycle infrastructure, and about three-quarters live within one-half mile. Youth and elderly populations are the only TE populations where the share that is within one-quarter mile of bicycle facilities is less that their respective non-TE populations. For people with disabilities, the percent of the population within one-quarter or one-half mile of bicycle infrastructure is about the same as for people without disabilities. Future investments to the region’s bicycle network could focus on improving access for the youth population and elderly populations. However, this analysis does not account for whether the bicycle infrastructure connects residents to where they want to go or whether residents want to or can bicycle. These concerns should be addressed during project development and evaluation.
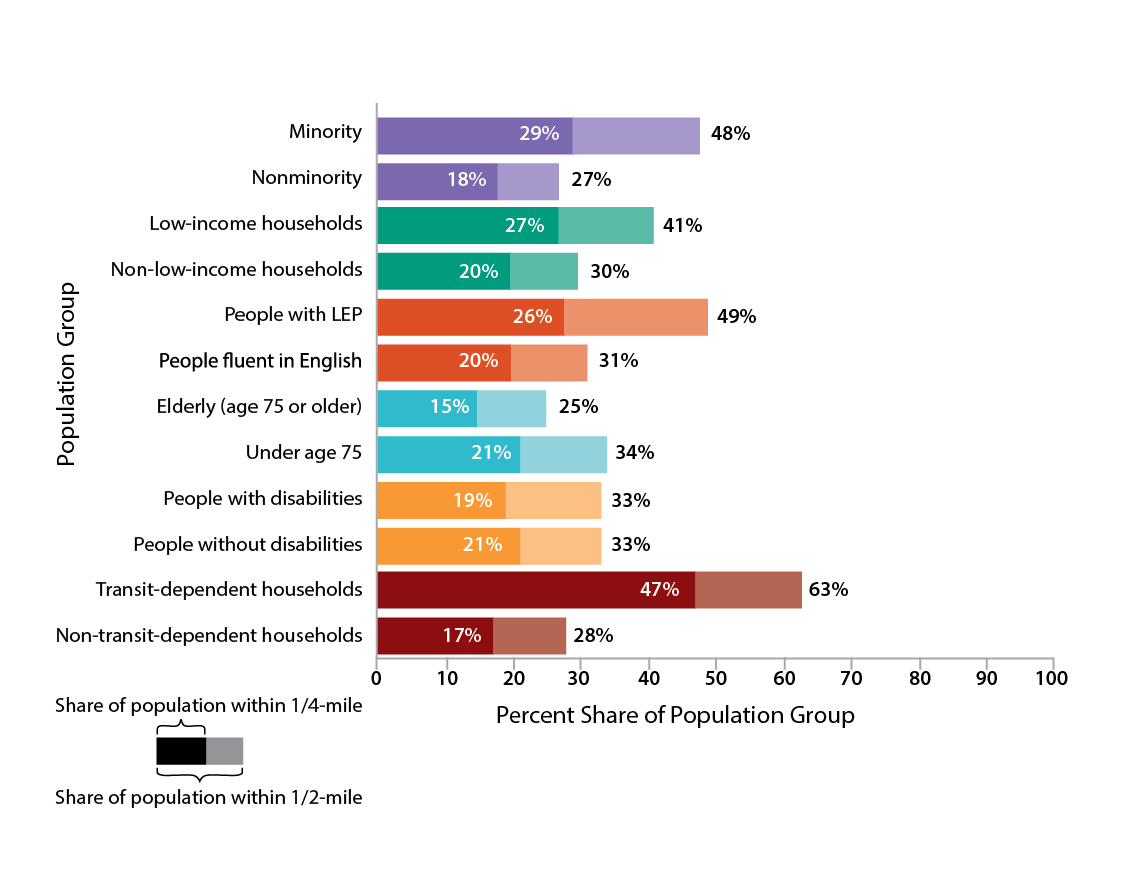
Access to the safest types of bicycle infrastructure—those physically separated by vertical or horizontal buffers—provide the safest bicycle routes for all riders. Youth and elderly populations may in particular benefit from this type of bicycle infrastructure. In this Needs Assessment, these are called “high-quality infrastructure” and “medium quality infrastructure.”11 Figure 8-11 shows the percent of each TE population within one-quarter mile and within one-half mile of high- and medium-quality bicycle infrastructure in the Boston MPO region.
Figure 8-11
Share of Transportation Equity Populations with Access to High- and Medium-Quality Bicycle Infrastructure
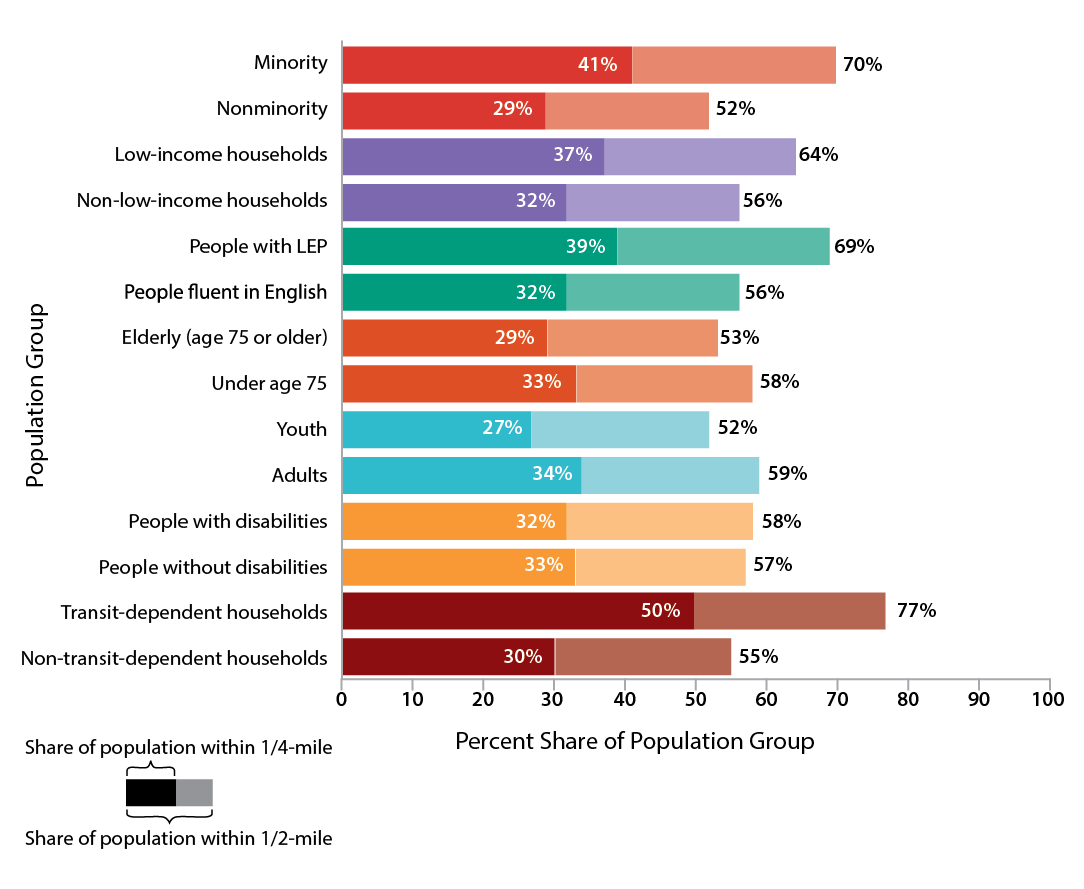
Note: The share of the population group refers to the portion of the total TE or non-TE population living in the Boston region within one-quarter mile and one-half mile of the bicycle infrastructure.
LEP = limited English proficiency. TE = transportation equity.
Sources: 2010 US Census; 2010–14 American Community Survey; and Metropolitan Area Planning Council’s TrailMap.
Across the region, TE populations have at least as good access to medium- and high-quality bicycle infrastructure within one-quarter or one-half mile of their homes compared to their respective non-TE populations. Transit-dependent households and low-income households—have among the best access. On the other hand, youth, many of whom cannot drive, have among the least access, indicating that neighborhoods with families are underserved by high- and medium-quality bicycle infrastructure. Similarly, the elderly population has less access than the population under the age of 75. Again, however, this analysis does not account for whether these populations can or want to bicycle, or whether the infrastructure provides access to places they want to go. It also does not measure the connectivity of bicycle networks, which likely plays a role in the utility of a given bicycle facility.
Figure 8-12 shows the percent of each TE population within one-quarter mile and one-half mile of Bluebikes stations, a bike share that operates within Boston, Brookline, Somerville, and Cambridge.12 The analysis does not indicate, however, whether Bluebikes stations are close to high- and medium-quality bicycle infrastructure. These percentages are out of the total TE population within these municipalities only. The analysis only includes docked bike share stations operated by Bluebikes. The docked bike share operated by Zagster in Marlborough and Salem was not included because data on the size and location of their fleet could not be found. Many other municipalities in the Boston MPO have dockless bike share (including Arlington, Bedford, Belmont, Chelsea, Everett, Malden, Medford, Melrose, Milton, Needham, Newton, Quincy, Revere, Swampscott, Waltham, Watertown, and Winthrop) that could not be tracked as the locations of bicycles is not fixed.
Figure 8-12
Share of Transportation Equity Populations with Access to Bluebikes Stations
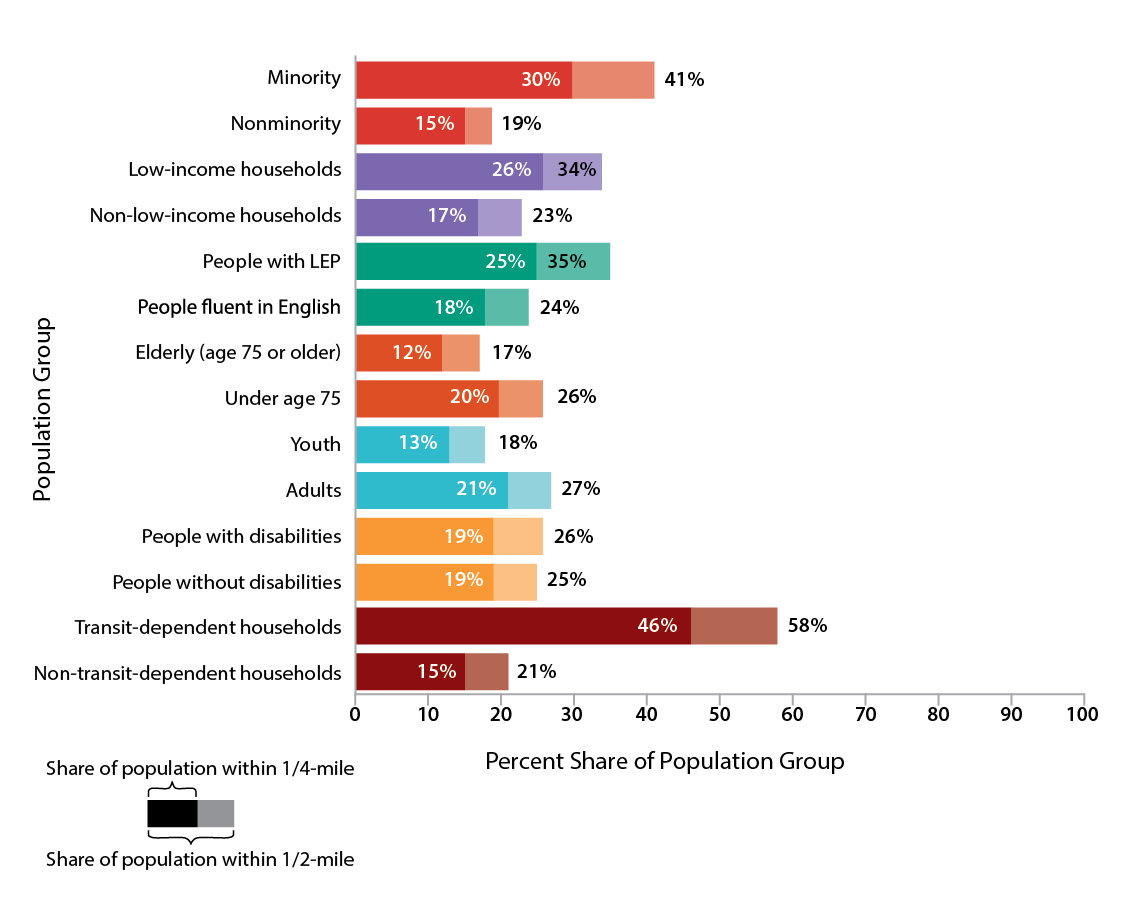
Note: The share of the population group refers to the portion of the total TE population living within the municipalities where Bluebikes operates (Cambridge, Somerville, Boston, and Brookline) within one-quarter mile and one-half mile of a Bluebikes station.
Sources: 2010 US Census; 2010–14 American Community Survey; and Bluebikes.
Most TE populations have greater or equal access to Bluebikes stations relative to their comparison non-TE populations, except for the youth and elderly populations. Transit-dependent households have the best access of any TE population, with 58 percent within one-half mile and 46 percent within one-quarter mile of a Bluebikes station. This compares with households that are not transit-dependent, of which 21 percent and 15 percent have access to a Bluebikes station, respectively. The elderly population has the least access to Bluebikes stations of any TE population, with 12 percent of that population within one-quarter mile of a station and 17 percent within one-half mile of a station. This analysis does not factor in whether these populations want to or can use Bluebikes, but it does suggest that elderly and youth populations have less access to Bluebike stations than other age groups in the Bluebike service area.
Census data show that, in general, TE populations in the Boston region rely on public transit to travel to work more than their non-TE population counterparts. Figure 8-13 shows the commute modes used by each population. (The youth population was omitted from this analysis; data for people with disabilities are not available.)
As expected, transit-dependent households have the highest public transit mode share, with 52 percent using this mode, followed by LEP and minority populations. (Because the ACS reports Journey to Work data for people who identify as a racial or ethnic minority but not for people who identify as both, mode shares for these two groups are reported separately here.) Transit-dependent households also have the highest walking mode share (22 percent) and the lowest driving mode share (17 percent).
These data show that TE populations generally rely on non-automobile transportation to get to work, especially walking and public transit. Therefore, these workers may most benefit from investments in transit, bicycle, and pedestrian infrastructure.
Figure 8-13
Commute Mode Share of Transportation Equity Populations
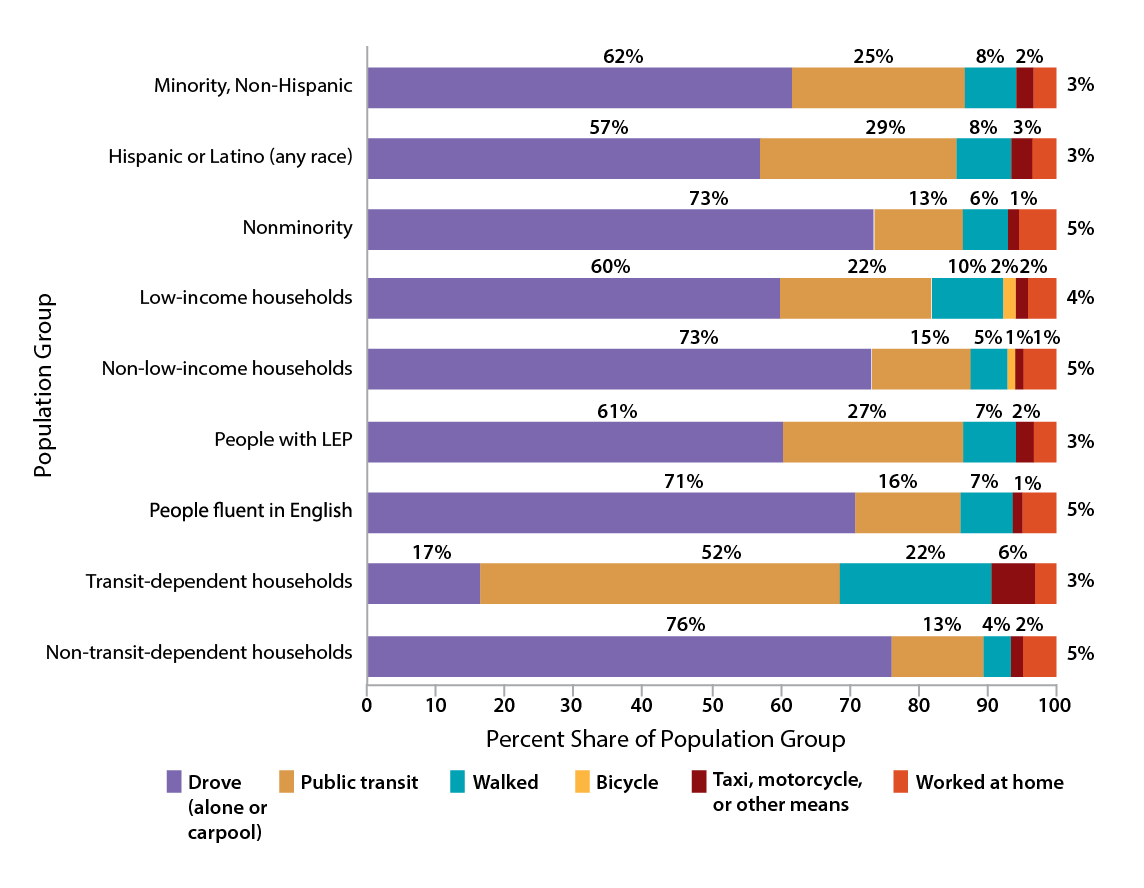
Note: The tabulation is for workers age 16 years and older. Journey to Work data collapses the bicycle mode with “motorcycle, taxi, or other means” for some populations due to the small sample sizes of those populations. The bicycle mode only is tabulated separately by income and sex. For all other TE populations, the “taxi, motorcycle, or other means” field includes the bicycle mode. The commute mode share data are available for people who identify as either a racial and ethnic minority, but not for people who identify as both.
LEP = limited English proficiency.
Source: 2010–14 American Community Survey.
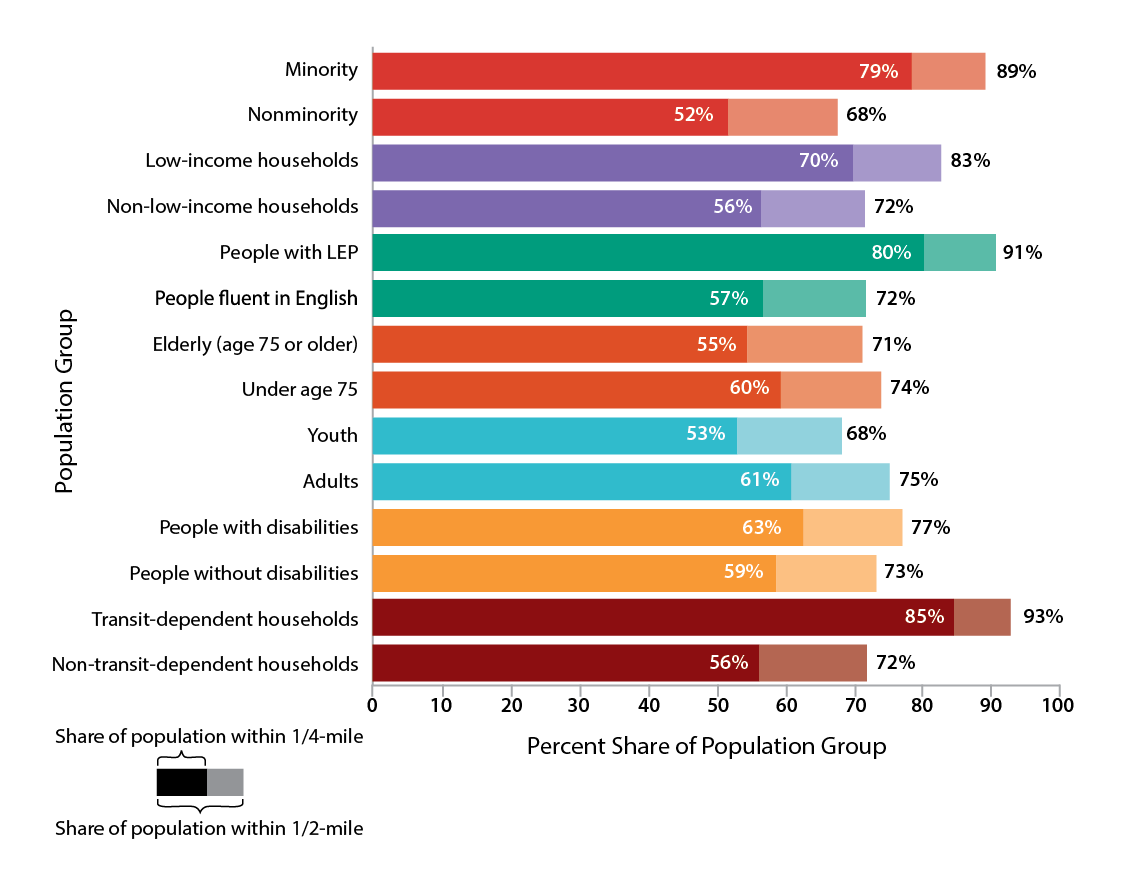
Figure 8-14 shows the share of each TE population within one-quarter and one-half mile of frequent transit service with average weekday headways of 15 minutes or less.14 Figure 8-15 shows the TE populations within one-quarter and one-half mile of any transit service in the Boston region, including service with longer wait times.15 Overall, the minority populations, low-income households, people with LEP, people with disabilities, and transit-dependent households have better access to transit service, including frequent service, when compared to their respective non-TE populations. However, the percent of elderly and youth populations that live within one-quarter mile of frequent transit is lower than their respective non-TE populations. This is also true for those living within one-half mile of public transit. As the demographic profiles show, minority populations, low-income households, people with LEP, people with disabilities, and transit-dependent households tend to live in urban areas that have the most developed transit systems. Thus, these populations are more likely to rely on public transit as their main form of transportation. Meanwhile, elderly and youth populations tend to be more evenly distributed geographically through the Boston region. The analysis of access to transit, however, did not assess other factors such as reliability and connectivity. As many commenters said during public outreach, these factors are very important.
Transit-dependent households have the highest share of all TE populations with respect to access to transit service, with about 93 percent of all households living within one-half mile of service and nearly 74 percent within one-half mile of frequent transit service. Meanwhile, youth and elderly populations have the lowest share. Seventy percent of the youth and elderly populations live within one-half mile of transit service, but only one-quarter of both populations live within one-quarter mile of frequent service.
Overall, these data suggest that most TE populations have comparable access to transit service, including frequent service, relative to their respective non-TE populations. However, this does not factor in the quality and reliability of the transportation. Additional future analyses could look more in-depth into these trip characteristics to better understand if TE populations have transit service that meets their needs.
Figure 8-14
Share of Transportation Equity Populations within One-Quarter and One-Half Mile of Frequent Transit Service
Note: Frequent service is defined as routes with an average weekday frequency of 15 minutes or less. Service includes all weekday public transit modes (bus, rapid transit, bus rapid transit, commuter rail, and ferry) operating within the Boston region. Operators include the BAT, CATA, GATRA, MBTA, MVRTA, and MWRTA. The share of transportation equity population refers to the portion of the total TE population living in the Boston region within one-quarter mile or one-half mile of bicycle infrastructure.
BAT = Brockton Area Transit. GATRA = Greater Attleboro Taunton Regional Transit Authority. LEP = limited English proficiency. MBTA = Massachusetts Bay Transit Authority. MVRTA = Merrimack Valley Regional Transit Authority. MWRTA = MetroWest Regional Transit Authority.
Sources: 2010 US Census; 2010–14 American Community Survey; Central Transportation Planning Staff; MBTA; CATA; BAT; GATRA; MVRTA; and MWRTA.
Figure 8-15
Share of Transportation Equity Populations within One-Quarter and One-Half Mile of Transit Service
Note: Service includes all weekday public transit modes (bus, rapid transit, bus rapid transit, commuter rail, and ferry) operating within the Boston region. Operators include BAT, CATA, GATRA, MBTA, MVRTA, and MWRTA.
The share of transportation equity population refers to the portion of the total equity population living within the MPO region—within one-quarter mile and one-half mile of bicycle infrastructure.
BAT = Brockton Area Transit. GATRA = Greater Attleboro Taunton Regional Transit Authority. LEP = limited English proficiency. MBTA = Massachusetts Bay Transit Authority. MVRTA = Merrimack Valley Regional Transit Authority. MWRTA = MetroWest Regional Transit Authority.
Sources: 2010 US Census; 2010–14 ACS; CTPS; MBTA; CATA; BAT; GATRA; MVRTA; and MWRTA.
In addition to bicycle sharing companies, the other shared mobility options include car sharing. Several of these companies operate within the Boston region; data were available for two of them, ZipCar and Maven. Figure 8-16 shows the percent of TE populations within one-quarter and one-half mile of stations of the two car-sharing companies with available station data, Zipcar and Maven. The analysis assumes that living near a car share station improves one’s transportation options and that all people are able and want to use a car share.
Figure 8-16
Share of Transportation Equity Populations with Access to Car Share Vehicles
Note: The youth population is not included in this table as the majority does not drive.
LEP = limited English proficiency.
Sources: 2010 US Census; 2010–14 American Community Survey; Zipcar; and Maven.
Most TE populations have a higher share that live within one-quarter or one-half mile of a Zipcar station than their respective non-TE populations. The exceptions are people with disabilities and elderly. Elderly populations have the lowest share of the population near car share vehicles, with 15 percent within one-quarter mile and 25 percent within one-half mile. (The youth population was not part of this analysis as most children under the age of 18 cannot drive.) These data reflect in part that the Zipcar stations tend to be located in denser areas, whereas the elderly and people with disabilities tend to be evenly distributed throughout the region. This analysis did not account for whether people can afford to use Zipcar or need to do so.
The analyses in this section describe some of the mobility needs of TE populations. Some of the differences regarding access to transit are due to differences in geographical distribution of populations—for example, as described in the section on demographics, elderly and youth populations are fairly evenly distributed across the region, whereas minority and low-income populations tend to be more concentrated in Boston and neighboring municipalities. As transit also tends to be concentrated in these areas, the latter TE populations have better access.
However, these analyses assume that living near a transit station or infrastructure improves one’s transportation options and that all people are able and want to use transit. They do not account for the ability of someone to access the infrastructure, whether someone has the need to use it, or the quality of the service or infrastructure. Future analyses could explore these questions.
The MPO’s Clean Air/Sustainable Communities goal focuses on creating an environmentally friendly transportation system by reducing greenhouse gases and other transportation-related pollutants, minimizing other negative environmental impacts of the transportation system, and supporting land use policies that are consistent with smart, healthy, and resilient growth. Identifying and addressing the human health and environmental effects of transportation is a key component of the EJ Executive Order, and subsequently of EJ guidance from the Federal Transit Administration (FTA) and Federal Highway Administration (FHWA). As such, this section discusses the MPO’s current and potential future work to identify transportation needs related to the environmental effects of transportation on TE populations.
The transportation sector is the leading cause of greenhouse gas emissions16—including methane, nitrous oxide, and hydrofluorocarbons, carbon dioxide (CO2)—which contribute to climate change.17 In Massachusetts in 2014, transportation was responsible for 39 percent of the state’s greenhouse gas emissions.18 Climate change affects human health and welfare directly as a result of more frequent and severe heat waves, extreme weather events, and sea-level rise. These events and related impacts are expected to affect certain vulnerable populations in the Boston region. Vulnerable populations are those that have comparatively few resources to cope with the stresses of climate change. In particular, children and the elderly are more susceptible to climate impacts, such as higher temperatures, while low-income communities near the coast may be vulnerable to the financial burdens associated with repeated flooding and stronger storms.19 Other populations vulnerable to climate change include people with disabilities and people with limited English proficiency. These socioeconomic vulnerabilities may be compounded depending on where vulnerable populations live. Those who live in neighborhoods most likely to be affected by rising sea levels, heat waves, or extreme weather events (such as hurricanes) may find it more difficult to adapt to changes in the climate.20
The Boston Region MPO has interactive maps that show potential impacts related to climate change. The All-Hazards Planning application contains maps that show areas at high risk for 100-year and 500-year floods; at risk for seawater inundation during Category 1 through Category 4 hurricanes; and at risk for sea level rise during this century based on the range of levels predicted. Currently, the maps do not show which communities with high shares of TE populations would be affected. Adding map layers to show these communities is a possible next step for the MPO to better understand the potential impact of climate change on TE populations in the region. Additionally, the MPO's Vehicle Miles Traveled and Emissions Data Browser shows CO2 emissions data for the cities and towns in the Boston region. In the future, these maps could be updated with layers that show communities with high shares of TE populations in the region to better understand where emissions are highest and therefore have the potential to cause the greatest health effects.
Particulate matter (PM2.5 and PM10), nitrogen oxide (NOx), carbon monoxide (CO), and volatile organic compounds (VOCs) are all emitted by vehicles and are harmful to human health. People who live near major roads have increased exposure to these pollutants; children, the elderly, people who have cardiopulmonary disease, and people with low incomes are especially vulnerable.21 Ozone, which is formed by NOx and VOC emissions in the presence of sunlight, can cause a variety of health problems. Ozone can make breathing more difficult, cause coughing, make the lungs more susceptible to infection, increase the frequency of asthma attacks, and cause chronic obstructive pulmonary disease.22 Meanwhile, particulate matter—caused when chemicals emitted by cars interact with the atmosphere—is associated with aggravated asthma, coughing, difficulty breathing, heart attacks, and premature death in people with heart or lung disease.23 The finer the particle—those less than 10 micrometers in diameter, such as PM2.5—pose the greatest risk as they can get deep in the lungs and in the bloodstream.24
Tracking and documenting data about exposure of TE populations that are particularly vulnerable to the effects of emissions is one strategy the MPO could take to better ensure that MPO investments do not aggravate the health effects of vehicle emissions in vulnerable neighborhoods—especially those near highways or arterials—and promote alternative forms of transportation to reduce vehicle use and thus emissions. The MPO has several data resources that show transportation-related emissions in the Boston region. The 2015 Arterial Highway and Express Highway Performance Dashboards show congested highway segments and arterial segments, respectively, during peak travel times. In addition, the Vehicle Miles Traveled and Emissions Data Browser directly show VOC and NOx emissions data. These maps do not currently provide information about the extent of congestion in TEZs, but they could be updated in the future to do so and to show where emissions are highest. High levels of congestion could indicate the presence of significant harmful pollutants caused by transportation.
Some people in TE populations are particularly vulnerable to the effects of climate change—whether because of their age, place of residence, income, or physical health. These effects may be compounded in communities where several of these demographic indicators overlap. Additionally, some populations, in particular youth and elderly, are more affected by transportation-related emissions, such as particulate matter. These factors should be taken into consideration in the MPO’s planning and programming process.
The MPO’s System Preservation goal focuses on maintaining the transportation system in a state of good repair, modernizing transportation infrastructure for all modes; prioritizing projects that support planned response capability to existing or future extreme conditions; and protecting freight network elements, such as port facilities, that are vulnerable to climate change impacts. Transportation infrastructure in the Boston region is aging and transportation agencies face a backlog of maintenance work for the highway and transit system. In addition, if climate change trends continue, the region can expect significant impacts to the transportation system due to rising sea levels, more frequent flooding, storm surges, and heat stress.
Climate change poses significant risks to the region’s transportation system. Impacts to the transportation network will also likely affect populations that rely on public transit. In the last few years, complete or partial shutdowns on the MBTA’s system have occurred due to severe weather events—including flooding and nor’easters—affecting, among others, hourly wage earners who depend on public transit to get to work. Public transit networks will continue to be vulnerable to the effects of stormwater flooding from precipitation, hurricanes, nor’easters, and damaging storm surges. Major routes susceptible to flooding include Tremont Street in Boston, portions of Interstate 90 and Interstate 93, and some portions of the MBTA’s subway lines in downtown Boston.25
The MPO’s All-Hazards Planning application could be updated to identify those public transit routes that are widely used by the various TE populations and that could be affected by climate change-related impacts, such as sea-level rise, storm surges, and flooding. This analysis could identify the transit passengers most likely to be affected by an interruption of service due to the effects of climate change.
The MPO’s Performance Dashboard shows pavement condition of interstates and MassDOT-owned non-interstate roads based on the present serviceability index (PSI), which is a measure of the road’s roughness. The dashboard documents the change to PSIs between 2007 and 2014. In the future, the MPO staff could calculate the miles of roads in TEZs for each TE population type and determine, based on PSI scores, whether roads in those communities are maintained as well as those outside TEZs.
The Performance Dashboard also shows the condition of the bridges in the region that are listed in the National Bridge Inventory, which includes all bridges that are more than 20 feet long. In 2016, there were 1,622 such bridges in the Boston region. The dashboard shows how the structural integrity of the bridges in the region has changed between 2007 and 2016, based on bridge health index scores. While the information is currently sorted by municipality, in the future the MPO staff could sort the information according to TEZs and non-TEZs to see whether bridges in communities with high shares of TE populations are more likely to be structurally deficient.
Some major transportation routes and transit lines in the Boston region are susceptible to flooding and storm surges from extreme weather events, such as hurricanes and nor’easters. Impacts to public transit, which TE populations often depend on more than non-TE populations, could adversely affect these populations in particular. These impacts are only expected to get worse as the effects of climate change intensify, leaving already vulnerable populations increasingly susceptible to the adverse effects of climate change.
The MPO’s Economic Vitality goal is to respond to the mobility needs of the workforce population; minimize the burden of housing and transportation costs for residents in the region; prioritize transportation investments that serve residential, commercial, and logistics targeted development sites and “Priority Places” identified in the MBTA’s Focus 40 plan; and prioritize transportation investments consistent with the compact-growth strategies of the regional land use plan. Over the past four years, the MPO’s work has largely focused on prioritizing transportation investments that support a changing economy, encourage mixed-used development, accommodate emerging transportation services and non-auto modes, and serve new or planned development.
Boston’s Go Boston 2030: Imagining Our Transportation Future identifies several emerging job centers that are currently underserved by public transportation. These include the Longwood Medical Center (LMA), Logan International Airport, and the Seaport. Boston neighborhoods with significant shares of TE populations—particularly low-income households and transit-dependent households—that could potentially benefit from improved or new transit service to these job centers include Roxbury, Mattapan, Dorchester, and Brighton. The report also identifies bicycle corridors that could improve access to jobs for these populations.26 Future MPO work could build on these efforts to identify job centers within the region for which there is limited or no transit access for TE populations.
As Boston area employment patterns change, transportation services and infrastructure must adapt. Job centers are becoming more spread out, with Boston neighborhoods outside of downtown emerging as job centers, as well suburban nodes. Additionally, more and more people are commuting between suburbs, instead of into and out of Boston, as well as commuting during off-peak hours. Many of these commuters who work in low wage jobs would benefit from transportation services geared to these non-traditional commutes. Also, increasingly services such as healthcare are being provided outside of Boston and a growing elderly population will necessitate improved transportation access to these services.
The MPO staff engaged local organizations who work with TE populations, which are the focus of federal Title VI, EJ, and other nondiscrimination laws, to gather input on the transportation needs and challenges of the people they represent. MPO staff also distributed a survey to organizations throughout the region to get greater input from TE populations for the Needs Assessment. The survey was also posted on the MPO’s website and distributed through the MPO’s regular email channels.
Many commenters who discussed safety focused on building safe bicycle and pedestrian facilities (such as protected or off-street bicycle lanes) for people of all ages and abilities. Specifically, they recognized the need for safe routes to schools, jobs, commercial developments, and public transit, as well as sidewalks that are ADA-compliant. Commenters also identified a need for high- and medium-quality bicycle lanes, especially along well-traveled streets, which would help people who travel to or from work when there is no transit service running to arrive safely. They also pointed to the need for safe bicycle facilities in low-income neighborhoods, especially on major thoroughfares that lack safe infrastructure and pose risk to pedestrians and bicyclists.
The transportation interests and needs of TE populations are largely focused on non-auto modes, especially public transit. Overall, commenters expressed interest in more frequent service during off-peak hours and extending service throughout the night. They also expressed interest in improving transit reliability, frequency, efficiency, accessibility, and connectivity.
Many commenters cited the need to provide late-night and/or 24-hour rapid transit service, and to increase the level of service on the commuter rail. Additionally, many saw the need for more off-peak bus service, including during the midday and on the weekends. These changes would particularly support those who do not have a standard nine-to-five workday. Commenters also saw a need for more reliable transit services, particularly for the Red Line, buses, and all services operating during rush hours.
Gaps in transit coverage were also cited. These gaps include transit from Boston to regional employment centers outside of the urban core, suburb-to-suburb service, service to healthcare facilities in Boston from the suburbs, east-west connections between Boston neighborhoods, service to Springfield, and service between outer suburbs and neighboring cities outside of the Boston region, such as Lowell.
Several commenters noted the slow transit service to some neighborhoods, such as Roxbury, Mattapan, and Hyde Park. Speeding up public transit service to these neighborhoods, to regional job centers, and for long-distance commuting could shorten commutes for lower-income individuals with non-traditional commutes.
Other commenters remarked on the need to improve connectivity of the sidewalk and bicycle networks and to provide better access to bike-sharing. Specifically, several commenters cited the need for bicycle and pedestrian infrastructure in low-income neighborhoods as this infrastructure would provide reliable, affordable, and healthy transportation options.
With regard to accessibility, commenters noted that many people with disabilities lack access to single occupancy vehicles, and therefore access to public transit is an essential for them. Several commenters also highlighted the importance of an accessible pedestrian environment with access to bus stops and rail stations. Also mentioned was the importance of investing in the public transit system—including bus routes—in outlying Boston neighborhoods and suburbs. Commenters also encouraged partnerships with transportation network companies, such as Uber and Lyft, in order to close the gaps in areas served by public transit.
Some commenters expressed concern about the impacts that climate change could have on the public transit system, especially the impacts that extreme weather and storms have had in the past and that could occur in the future. Some commenters expressed concern about the impacts of greenhouse gases and other pollutants at the local level on TE populations. Others brought up the importance of building non-motorized transportation infrastructure in TE neighborhoods along streets that are not major thoroughfares to help residents reduce their exposure to vehicle emissions.
Several commenters identified the need to improve sidewalk conditions. Poorly-maintained sidewalks can be especially problematic for elderly adults and people with disabilities, so these commenters wanted more sidewalks to be ADA-compliant. Poorly-maintained sidewalks can also be dangerous to young children who walk to school. Poor street-level lighting and faded crosswalks were also identified as safety issues. Others identified the need for better maintenance of elevators and escalators in public transit stations, as well as the need for to address the safety and cleanliness of stations in general.
Many commenters discussed the impacts that high housing prices have on commute times and on transportation costs as lower income individuals get pushed further from job centers in the urban core. Because of this trend, some commenters suggested improving connections by transit between low-income neighborhoods that are outside of the urban core and regional employment centers as a way to help reduce these burdens.
Many commenters said that current public transit schedules and routes—which largely serve traditional nine-to-five jobs and employees working in the urban core—do not serve commuting patterns of some low-income households and other TE populations. A lack of off-peak commute options—including overnight and early morning service—can make it challenging for some to get to work. People with LEP and low-income populations are particularly burdened. Commenters also identified the need for more reverse-commute options on public transit to job centers outside the urban core. Finally, others noted that long-distance commutes needed to be better accommodated with more direct express service and fewer transfers. Without these services, low-income households must invest in a car, adding to the financial burdens on these households.
In addition to schedule changes, some suggested that more first- and last-mile connections would help bridge transportation gaps between homes and workplaces and fixed-route transit stations. Others identified the need for new rapid transit lines in inner-core neighborhoods with limited or no fixed-route service, many of which have many low-income and other TE populations, including Roxbury, Mattapan, Hyde Park, and Roslindale, in order to connect them to job-rich neighborhoods, such as the Longwood Medical Area.
Beyond jobs, there was a desire for increased transit connectivity to schools, grocery stores, healthcare facilities, and amenities in lower-income communities. Commenters noted that elderly individuals and people with disabilities particularly need better and more affordable access to these locations. Safe, accessible bicycle and pedestrian connections were frequently cited as a way to improve connectivity within and between neighborhoods. These would also serve young people who cannot drive.
Beyond the transportation needs identified in the goal areas, two cross-cutting transportation needs emerged from public outreach. One was improving the coordination between transportation and land use planning. Implementing many of these suggestions would be outside the jurisdiction of the MPO—such as building more affordable housing near transit stations and updating zoning to allow more mixed-use development near train stations. However, the MPO would have the ability to support transportation investments where, for example, mixed-use development or low-income housing is planned.
Commenters also mentioned the lack of coordination between transportation services, especially between public transit services. Many saw the need for schedules between transit providers, such as regional transit authorities (RTAs), to match more closely. Integration of fares between providers was also noted as a strategy to make traveling easier. Some commenters noted that the artificial boundaries between transit providers, including RTAs, transportation management associations (TMAs), and local paratransit services, make traveling across borders unnecessarily time consuming. This can be particularly problematic for people who rely on public transit to get to work, such as low-income individuals and people without access to a vehicle, as well as for those who rely on transit to travel to medical appointments, such as elderly adults and people with disabilities.
The Transportation Equity section of the Destination 2040 Needs Assessment has been significantly updated since the Needs Assessment for the prior LRTP, Charting Progress to 2040, was produced. Additional TE populations have been analyzed and new analyses have been completed to identify transportation needs. More data and other relevant information were available to complete these analyses. These changes and new data sources include the following:
1 MPO staff uses 2010 United States Census and 2010–14 American Community Survey (ACS) data to identify TE populations as follows:
People considered as minorities are those who identify as Hispanic or Latino/a/x and/or Black or African American, Asian, American Indian or Alaska Native, or Native Hawaiian or other Pacific Islander.
LEP status is tabulated for the population aged five and older. A person with LEP is defined as a person who speaks English less than “very well,” as reported in the ACS.
Disability status is tabulated for the noninstitutionalized population.
The minority population, the population 75 years of age or older, and the population 17 years of age or younger are tabulated for the entire population.
The low-income population and transit-dependent households are tabulated for all households.
A low-income household is one whose annual household income is less than or equal to $45,392, which is 60 percent of the region’s median household income of $75,654.
A transit-dependent household is one that does not have access to any personal vehicle.
2 For people who identify as minority, have LEP, are 75 years old or older or 17 years old or younger, or who have a disability, the threshold is based on the number of people. For transit-dependent and low-income households, the threshold is based on the number of households.
3 A TAZ is a unit of geography used for travel demand modeling. The MPO region is divided into TAZs, which are approximately the size of census block groups; there are 1,901 TAZs in the region.
4 State of Equity in Metro Boston, MAPC Regional Indicators, Metropolitan Area Planning Council, accessed December 14, 2018,http://www.regionalindicators.org/topic_areas/7.
5 Ibid.
6 Ibid.
7 MAPC, “State of Equity in Metro Boston.”
8 These categories do not correspond with the MPO’s definition of “low-income households” described earlier in the chapter. They are the income categories used in the models employed by MAPC and Central Transportation Planning Staff (CTPS) to project transportation, demographic, and landuse trends. Income is reported in 2010 dollars.
9 MassDOT’s identifies crash clusters by merging crashes that are within a 25 meter radius of each other. If two distinct clusters are found to share a common crash, the two clusters are merged into a single cluster. The full methodology can be found in MassDOT’s 2015 Top Crash Location Report, March 2018, https://www.mass.gov/files/documents/2018/05/31/15TopCrashLocationsRpt.pdf, pg. 4-5
10 This does not necessarily mean the crash cluster is in one of each type of TEZ. It could be in one TAZ that exceeds that threshold for all seven TE populations.
11 The methodology involved calculating the TE population in each TAZ as a percentage of the population in each TAZ. For example, if a TAZ had 100 people and 30 percent were minority, then 30 people were considered minority in that TAZ. If a TAZ overlapped with the one-quarter or one-half mile buffer, the TE population was calculated based on the percentage of the TAZ within the buffer. For example, if 50 percent of a TAZ was within one-quarter mile of bicycle infrastructure, the calculations would be based on 50 percent of the total population of the TAZ. Using the example from above, this would mean that 15 people within one-quarter mile of bicycle infrastructure were considered minority.
The population of each TAZ was drawn from demographic projections produced by MPO staff for the year 2016. Because these projections do not include projections of each TE population, only of the total people and households, this methodology applies the share of each TE population as reported in the 2010 Census or 2010–14 ACS the MPO’s projections.
12 High-quality bicycle infrastructure is that which physically separates bicyclists from the street, such as a vertical barrier between bicyclists and motorists, bicycle facilities at the curb or sidewalk level that allow for the separation of bicyclists and pedestrians, or, in the case of shared-use paths, separate paths for bicyclists and pedestrians. Medium-quality bicycle infrastructure has a horizontal separation between motorists and bicyclists, facilities at curb level without a sidewalk buffer to separate bicyclists and pedestrians, or, in the case of shared-use paths, combined paths for bicyclists and pedestrians.
13 This includes the Bluebikes expansion in the summer and fall of 2018.
14 Frequent transit service is defined as routes with an average weekday frequency of 15 minutes or less. Service includes all weekday public transit modes—bus, rapid transit, bus rapid transit, commuter rail, and ferry—operating within the Boston region.
15 Service includes all weekday public transit modes that operate within the Boston region: bus, bus rapid transit, rapid transit, commuter rail, and ferry.
16 US EPA, Green Vehicle Guide, “Fast Facts on Transportation Greenhouse Gas Emissions,”
https://www.epa.gov/greenvehicles/fast-facts-transportation-greenhouse-gas-emissions
17 US EPA, Carbon Pollution from Transportation, “Transportation and Climate Change,”https://www.epa.gov/transportation-air-pollution-and-climate-change/carbon-pollution-transportation
18 State of Massachusetts, MA GHG Emission Trends,https://www.mass.gov/service-details/ma-ghg-emission-trends
19 Metropolitan Area Planning Council, 2014, Metro Boston Regional Climate Change Adaption Strategy Report.https://www.boston.gov/sites/default/files/metro_boston_regional_climate_adaptation_strategy_report.pdf
20 Schlegel, C., 2018, Climate Justice for the City of Boston: Visioning Policies and Processes, http://michelleforboston.com/wp-content/uploads/2018/02/CJ-Report.pdf
.
21 US EPA, How Mobile Source Pollution Affects Your Health, https://www.epa.gov/mobile-source-pollution/how-mobile-source-pollution-affects-your-health.
22 US EPA, How Mobile Source Pollution Affects Your Health, https://www.epa.gov/mobile-source-pollution/how-mobile-source-pollution-affects-your-health#smog.
23 US EPA, How Mobile Source Pollution Affects Your Health, https://www.epa.gov/mobile-source-pollution/how-mobile-source-pollution-affects-your-health.
24 US EPA, Particulate Matter (PM) Basics, https://www.epa.gov/pm-pollution/particulate-matter-pm-basics.
25 Schlegel, C., 2018, Climate Justice for the City of Boston: Visioning Policies and Processes,
http://michelleforboston.com/wp-content/uploads/2018/02/CJ-Report.pdf.
26 Boston Transportation Department, 2017, Go Boston 2030, https://www.boston.gov/sites/default/files/go_boston_2030_-_full_report_to_download.pdf.
< Chapter 7 - Clean Air and Sustainable Communities Needs | Chapter 9 - Economic Vitality Needs >