Technical Memorandum
DATE: April 25, 2019 (Updated May 6, 2019)
TO: Boston Region Metropolitan Planning Organization (MPO)
FROM: Michelle Scott and Matt Genova, Boston Region MPO Staff
RE: Performance Addendum to the FFYs 2019–23 Transportation Improvement Program
Proposed Amendment 3 to the Boston Region MPO’s federal fiscal years (FFY) 2019–23 Transportation Improvement Program (TIP) includes (1) updated TIP tables reflecting changes to projects and programs and (2) this addendum addressing federal performance management requirements. This addendum describes the MPO’s current set of performance targets for federally required performance measures and discusses how projects included in the FFYs 2019–23 TIP help support progress towards these measures and targets. MPO staff has prepared this information to ensure that the MPO’s active TIP includes performance management elements that must be phased into the MPO’s planning process by May 20, 2019.
MPO staff requests that the MPO include this addendum in the draft FFYs 2019–23 TIP Amendment 3 that is released for public review and comment, and that it include this addendum when adopting a final Amendment 3. Upon final endorsement by the MPO board, this addendum would be considered part of the MPO’s FFYs 2019–23 TIP document.
The Moving Ahead for Progress in the 21st Century Act (MAP-21) directs states, MPOs, and public transportation providers to carry out a performance- and outcome-based surface transportation program, and these requirements have been continued under the current federal transportation funding law, the Fixing America’s Surface Transportation (FAST) Act. Under these requirements, states, MPOs, and public transportation operators are required to track and establish targets for performance measures in key performance areas and report on performance in required planning documents. In particular, MPOs must adhere to the following conditions:
In recent years, the MPO has dedicated a chapter of its TIP documents to addressing federal performance requirements for TIPs. Chapter 4 of the FFYs
2019–23 TIP, titled TIP Performance Monitoring, provides an overview of federal performance-based planning and programming (PBPP) requirements and describes the MPO’s PBPP process. This chapter discusses how the MPO’s Regional Target projects may support performance improvements in the MPO’s six goal areas—Safety, System Preservation, Capacity Management and Mobility, Clean Air and Clean Communities, Transportation Equity, and Economic Vitality.3 This chapter includes two set of performance targets that the MPO had adopted when it endorsed the FFYs 2019–23 TIP in May 2018:
Both sections describe, to the extent practicable, how the MPO’s Regional Target projects address performance in these areas.
Since the MPO endorsed the FFYs 2019–23 TIP, it has updated its sets of roadway safety and TAM performance targets. It has also adopted targets for other federal performance areas, including National Highway System (NHS) bridge and pavement condition, travel time reliability on the NHS, truck travel time reliability on the Interstate Highway System, congestion reduction, non-single-occupant-vehicle (non-SOV) travel, and emissions reductions related to projects funded through the Congestion Mitigation and Air Quality Improvement (CMAQ) program.
The Federal Highway Administration and Federal Transit Administration require MPOs to reflect performance measures and targets in all of the aforementioned areas in its planning process by May 20, 2019. To respond to these requirements, the MPO has prepared this addendum to the FFYs 2019–23 TIP. It describes all the MPO’s current performance targets for federally required performance measures. Table 1 lists relevant federal performance areas for which the MPO has set targets, along with corresponding MPO goal areas.
Table 1
Federal Performance Areas Related to MPO Targets
Federal Performance Areas |
MPO Goal Area |
Roadway Safety |
Safety |
Transit Asset Condition |
System Preservation |
NHS Infrastructure Condition |
System Preservation |
System Reliability |
Capacity Management and Mobility |
System Reliability, Freight Movement and Economic Vitality |
Capacity Management and Mobility |
CMAQ—Congestion Reduction |
Capacity Management and Mobility |
CMAQ—Emissions Reduction |
Clean Air/Clean Communities |
Note: These MPO goal area titles are for the goals included in the MPO’s active LRTP, Charting Progress to 2040.
CMAQ = Congestion Mitigation and Air Quality. LRTP = Long-Range Transportation Plan. MPO = Metropolitan Planning Organization. NHS = National Highway System.
Source: Boston Region MPO.
In this addendum, MPO staff has updated sections of its existing FFYs 2019–23 TIP Performance Analysis in Chapter 4 that relate to the federal performance areas. These include the Safety, System Preservation, Capacity Management and Mobility, and Clean Air/Clean Communities sections of that existing analysis.
This addendum also includes descriptions of how FFYs 2019–23 TIP projects may affect these performance measures and targets, which link the MPO’s investment priorities to these performance targets. These descriptions generally focus on the MPO’s Regional Target-funded investments, although they also reference MassDOT or transit agency-funded investments, where applicable. They include MPO staff estimates for various metrics that are related to the effects that TIP projects are likely to have in each performance area, which are based on available data that MPO staff gather from project proponent materials, Massachusetts Department of Transportation (MassDOT) datasets, and other sources. The analysis in this addendum accounts for projects and programs included in the endorsed FFYs 2019–23 TIP in addition to changes included in Amendments 1 and 2 and in proposed Amendment 3.
This section summarizes these FFYs 2019−23 TIP investments to provide context for the relevant MPO-goal area discussions to follow. Chapters 2 and 4 of the FFYs 2019−23 TIP document describe the general processes that the MPO, MassDOT, the Massachusetts Bay Transportation Authority (MBTA), the Cape Ann Transportation Authority (CATA) and the MetroWest Regional Transit Authority (MWRTA) follow to allocate their funds to project and programs. The following tables account for projects, programs, and funding amounts included in the endorsed FFYs 2019–23 TIP in addition to changes included in Amendments 1 and 2 and in proposed Amendment 3.
Table 2 shows the Boston Region MPO’s investments with its Regional Target Funding—including both the number of projects and the dollar amount—by investment program.
Table 2
Boston Region MPO Regional Target Investment Summary
MPO Investment Program |
Number of Projects |
Regional Target Dollars Programmed |
Bicycle Network and Pedestrian Connections |
2 |
$17,569,083 |
Community Transportation/Parking/Clean Air and Mobilitya |
TBD |
$6,000,000 |
Complete Streetsb |
23 |
$205,364,489 |
Intersection Improvements |
9 |
$53,775,084 |
Major Infrastructure—Roadwayc |
5 |
$132,895,816 |
Major Infrastructure—Transit (Green Line Extension) |
1 |
$105,500,000 |
Middlesex 3 TMA Shuttle Supportd |
1 |
$415,000 |
Total |
40 |
$521,519,472 |
Note: Funding amounts in this table include both federal and nonfederal funds, including matching funds.
a The MPO has allocated $4 million for the Community Transportation/Parking/Clean Air and Mobility Program in the FFYs 2019–23 TIP, but has not yet allocated it to specific projects.
b The Union Street (Route 139) project in Holbrook will also receive $1,527,250 in federal earmark funds (not shown in this table), and the Boylston Street project in Boston will also receive $507,874 in federal earmark funds for design (not shown in this table).
c The Melnea Cass Boulevard project in Boston will also receive $17,444,340 in federal earmark funds for construction (not shown in this table), and the Rutherford Avenue project in Boston will also receive $8,578,930 in federal earmark funds for design (not shown in this table).
d As part of Amendment 1 to the FFYs 2019–23 TIP, the MPO allocated Regional Target funds to the Middlesex 3 TMA to support second shift and weekend shuttle service between Lowell and Burlington.
MPO = Metropolitan Planning Organization. TBD = to be determined. TIP = Transportation Improvement Program. TMA = Transportation Management Association.
Source: Boston Region MPO.
Table 3 shows MassDOT’s FFYs 2019–23 TIP investments with its federal and other funding —including both the number of projects or programs and the dollar amount—by MassDOT program.
Table 3
MassDOT Investment Summary
MassDOT Program |
Number of Projects |
MassDOT Dollars Programmed |
Bicycles and Pedestrians |
4 |
$25,722,568 |
Bridge Programs |
17 |
$439,295,440 |
Earmark or Discretionary Grant Funded Projectsa |
4 |
$85,695,897 |
Intersection Improvements |
12 |
$32,653,340 |
Interstate Pavement |
4 |
$57,652,534 |
Non-Interstate Pavement |
14 |
$110,677,382 |
Nonfederal Aidb |
n/a |
$36,224,966 |
Planning/Adjustment/Pass-through Projects |
1 |
$1,200,000 |
Roadway Improvements |
2 |
|
Roadway Reconstruction |
8 |
$106,870,488 |
Safety Improvements |
8 |
$35,395,847 |
Total |
74 |
$932,127,197 |
Note: Funding amounts in this table include both federal and nonfederal funds, including matching funds. Values have been rounded to the nearest dollar.
a This category includes $2,754,056 for the Deck Reconstruction over the SouthEast Expressway project in Milton and $76,916,431 for the Sumner Tunnel Improvements Project in Boston; both of these projects are counted in the Roadway Reconstruction program. It includes $751,106 for the Carlton Street Pedestrian Bridge project in Brookline, which is counted in the Bicycles and Pedestrians program. It also includes $1,049,659 for the Route 109 Resurfacing Project in Dedham, which is counted in the Non-Interstate Pavement program.
b This program includes $36,224,966 for the Interstate 90/I Interstate 495 Interchange Reconstruction project in Hopkinton and Westborough, which is counted under the Roadway Reconstruction program.
MassDOT = Massachusetts Department of Transportation. MPO = Metropolitan Planning Organization.
n/a = not applicable.
Sources: MassDOT and the Boston Region MPO.
Table 4 shows the MBTA’s programs and associated funding amounts.
Table 4
MBTA Investment Summary
FTA Program |
MBTA Program |
MBTA Dollars Programmed |
Section 5307: Urbanized Area Formula Grants |
Revenue Vehicle Program |
$853,375,938 |
Section 5307: Urbanized Area Formula Grants |
Signals/Systems Upgrade Program |
$209,910,637 |
Section 5307: Urbanized Area Formula Grants |
Stations and Facilities Program |
$67,883,999 |
Section 5309: Fixed Guideway Capital Improvement Grants |
Green Line Extension—New Starts (FFGA) |
$1,342,242,000 |
Section 5337: Fixed Guideway/Bus Funds |
Bridge and Tunnel Program |
$228,551,371 |
Section 5337: Fixed Guideway/Bus Funds |
Signals/Systems Upgrade Program |
$626,131,224 |
Section 5337: Fixed Guideway/Bus Funds |
Stations and Facilities Program |
$384,099,904 |
Section 5339: Bus and Bus Facilities Funds |
Bus Program |
$51,151,606 |
Other Federal Funding |
Positive Train Controla |
$477,500,000 |
Other Federal Funding |
Quincy Center Bus Terminal |
$5,342,214 |
Other Federal Funding |
Hingham Ferry Dock Modification |
$13,350,000 |
Other Federal Funding—FHWA Flex Funds |
MBTA Ferry Improvements |
$1,758,689 |
Total |
n/a |
$4,261,297,582 |
Note: Funding amounts in this table include both federal and nonfederal funds, including matching funds.
a Postive Train Control investments are funded by Federal Railroad Administration Railroad Rehabilitation and Improvement funds and Transportation Infrastructure Finance and Innovation Act funds.
FFGA = Full Funding Grant Agreement. FTA = Federal Transit Administration. MBTA = Massachusetts Bay Transportation Authority. MPO = Metropolitan Planning Organization. n/a = not applicable.
Sources: MBTA and the Boston Region MPO.
Table 5 summarizes MWRTA, CATA, and other transit provider investments.
Table 5
CATA, MWRTA, and Other Transit Provider Investment Summary
Transit Agency |
Program |
Dollars Programmed |
CATA |
Section 5307: Urbanized Area Formula Funding |
$3,011,250 |
CATA |
Other Nonfederal Funds |
$900,000 |
MWRTA |
Section 5307: Urbanized Area Formula Funding |
$10,771,345 |
MWRTA |
Section 5310: Enhanced Mobility of Seniors and Individuals with Disabilities Funding |
$2,105,700 |
MWRTA |
Other Nonfederal Funds |
$120,000 |
Other Transit Providers |
Section 5310: Enhanced Mobility of Seniors and Individuals with Disabilities Funding |
$2,105,700 |
Other Transit Providers |
Other Nonfederal Funds |
$644,300 |
Total |
n/a |
$19,658,295 |
Note: Funding amounts in this table include both federal and nonfederal funds, including matching funds. Other transit providers include municipalities and other non-RTA providers.
CATA = Cape Ann Transportation Authority. MPO = Metropolitan Planning Organization. MWRTA = MetroWest Regional Transit Authority. n/a = not applicable.
Sources: CATA, MWRTA, and the Boston Region MPO.
More detailed information about these projects and programs is included in Chapter 3 of the FFYs 2019–23 TIP document and in documentation associated with Amendments 1 and 2 and proposed Amendment 3.
For each relevant MPO goal area, this section identifies current MPO performance targets and provides information on relevant trends, performance measures, and PBPP activities. Then, using available data gathered for project evaluations and other activities, the MPO estimates the impacts that FFYs projects will have on various performance areas. As mentioned previously, these descriptions generally focus on the MPO’s Regional Target-funded investments, although they may also reference MassDOT or transit agency-funded estimates, where applicable.
One of the MPO’s goals is that transportation by all modes will be safe. The MPO has committed to investing in projects and programs that aim to reduce the number and severity of crashes for all modes, and to reducing serious injuries and fatalities occurring on the transportation system. Similarly, the Massachusetts SHSP includes a long-term goal to move “towards zero deaths” by eliminating fatalities and serious injuries on the Commonwealth’s roadways.4 In future years, the MPO will work more closely with the MBTA, CATA, and MWRTA to monitor transit safety, including by tracking federally required transit safety performance measures, which the region’s transit agencies will document in their forthcoming Public Transportation Agency Safety Plans. The material that follows focuses specifically on roadway safety performance.
The Commonwealth of Massachusetts and the MPO track traffic incidents, fatalities, and injuries involving motor vehicles using information from the Massachusetts Crash Data System and the Federal Highway Administration’s (FHWA) Fatality Analysis and Reporting System (FARS). These data inform the targets the Commonwealth and the MPO must set each calendar year for five federally required roadway safety performance measures, which are also listed in Table 4-3:
These measures pertain to fatalities and serious injuries from traffic incidents and apply to all public roads. Values for these measures are expressed as five-year rolling annual averages. When establishing targets for these measures, the MPO can elect to support statewide targets set by the Commonwealth or set separate targets for the MPO region. The Commonwealth set its current set of roadway safety performance targets to reflect a 2015–19 rolling annual average, as required by FHWA. When setting these targets, the Commonwealth considered the following:
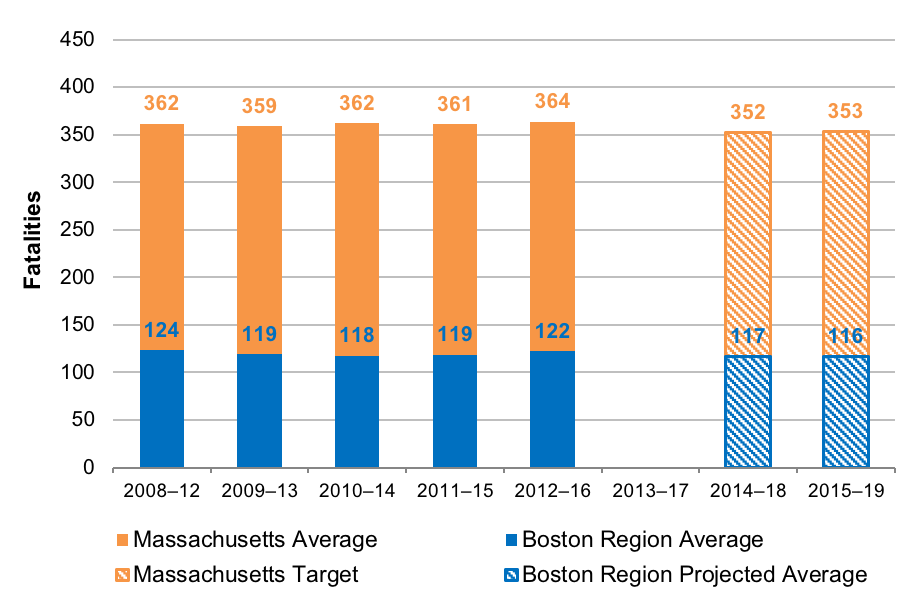
Figures 1 to 5 show statewide level trends for each performance measure along with the Commonwealth’s prior year (CY 2018) and current (CY 2019) performance targets. In February 2019, the MPO elected to support the Commonwealth’s CY 2019 roadway safety performance targets. For context, the figures also show Boston region-specific values for each measure, including projected values for future years.
Figure 1 shows historic and projected values for the number of fatalities resulting from motor vehicle crashes, while Figure 2 shows the fatality rate per 100 million VMT. Actual fatalities and fatality rates have declined slightly for Massachusetts and for the Boston region specifically, based on recent five-year rolling annual averages, and while CY 2016 fatality data showed an increase at both geographic scales, draft data for CY 2017 shows values closer to the lower CY 2015 values. The Commonwealth considered this information when setting targets for lowering the number of fatalities. Meanwhile, VMT has been gradually increasing for both the Boston region and Massachusetts as a whole, which also supports historic and projected decreases in the fatality rate.
Figure 1
Fatalities from Motor Vehicle Crashes
Notes: Values reflect five-year rolling annual averages and have been rounded to the nearest integer.
MPO staff developed projections for the Boston region using a linear trend line and a draft estimate of 103 fatalities for CY 2017.
CY = calendar year. MPO = Metropolitan Planning Organization.
Sources: National Highway Traffic Safety Administration Fatality Analysis and Reporting System, Massachusetts Department of Transportation, and the Boston Region MPO.
Figure 2
Fatality Rate per 100 Million Vehicle-Miles Traveled
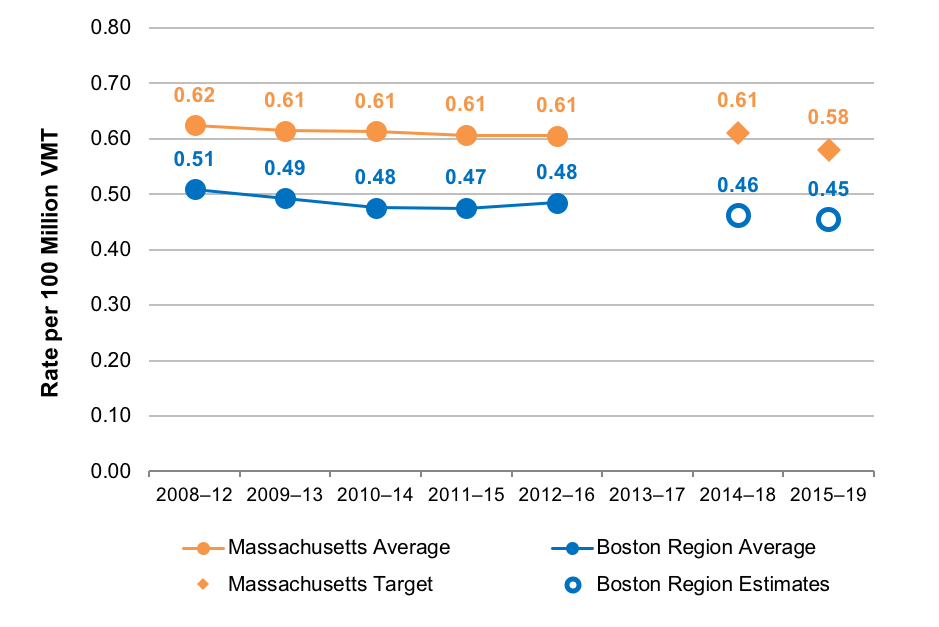
Values reflect five-year rolling annual averages and have been rounded to the hundredth decimal place. MPO staff developed projections for the Boston region using a linear trend line, a draft estimate of 103 fatalities for CY 2017, and an estimate of CY 2017 VMT from MassDOT (approximately 25.5 billion VMT).
CY = calendar year. MassDOT = Massachusetts Department of Transportation. MPO = Metropolitan Planning Organization. VMT = vehicle-miles traveled.
Sources: National Highway Traffic Safety Administration Fatality Analysis and Reporting System, Massachusetts Department of Transportation, and the Boston Region MPO.
Figure 3 shows historic and projected values for the number of serious injuries resulting from motor vehicle crashes, and Figure 4 shows the serious injury rate per 100 million VMT.5 For both the Boston region and Massachusetts as a whole, serious injuries and serious injury rates have been decreasing over time and are projected to continue to decrease.
Figure 3
Serious Injuries from Motor Vehicle Crashes
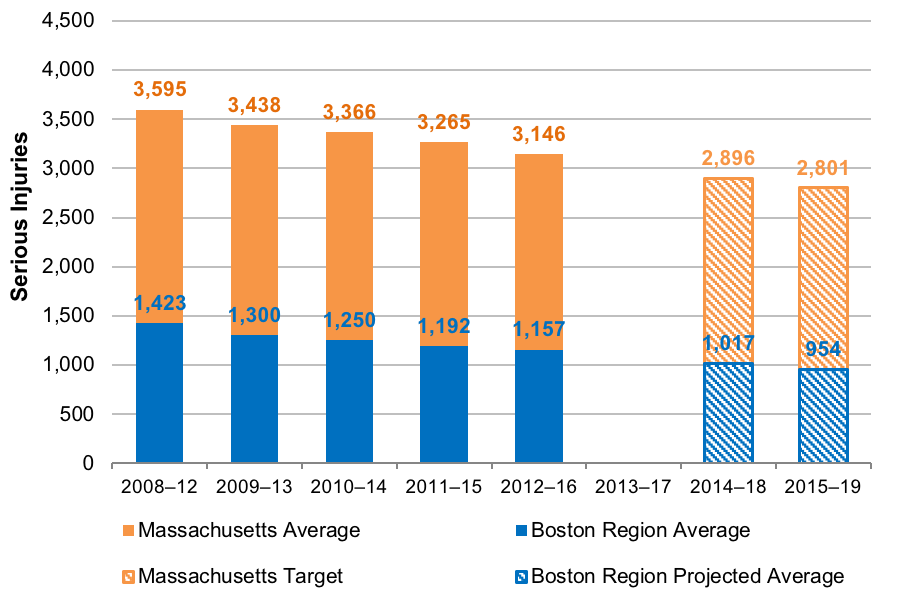
Notes: Values reflect five-year rolling annual averages and have been rounded to the nearest integer. MPO staff developed projections for the Boston region using a linear trend line and a draft estimate of 938 serious injuries for CY 2017.
CY = calendar year. MPO = Metropolitan Planning Organization.
Sources: Massachusetts Crash Data System, Massachusetts Department of Transportation, and the Boston Region MPO.
Figure 4
Serious Injury Rate per 100 Million Vehicle-Miles Traveled
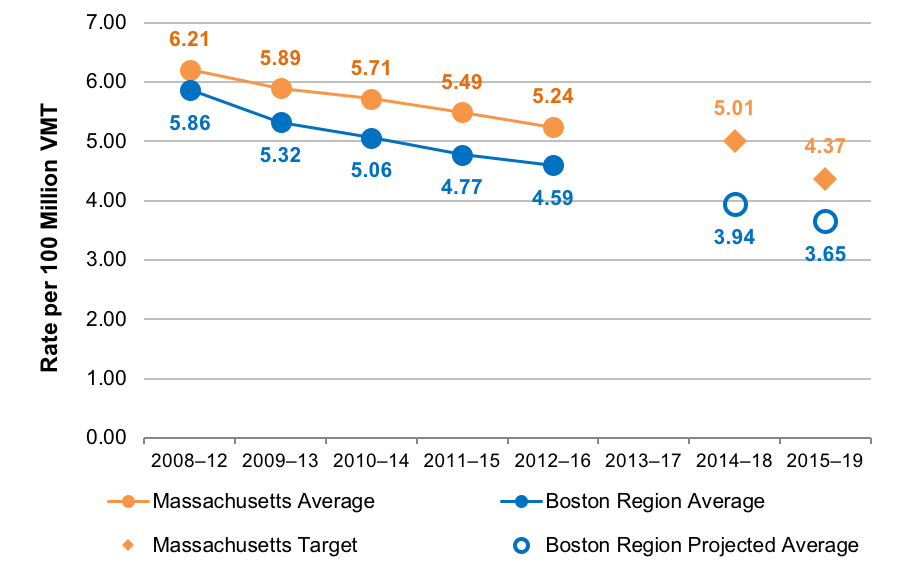
Notes: Values reflect five-year rolling annual averages and have been rounded to the hundredth decimal place. MPO staff developed projections for the Boston region using a linear trend line, a draft estimate of 938 serious injuries for CY 2017, and an estimate of CY 2017 VMT from MassDOT (approximately 25.5 billion VMT).
CY = calendar year. MassDOT = Massachusetts Department of Transportation. MPO = Metropolitan Planning Organization. VMT = vehicle-miles traveled.
Sources: Massachusetts Crash Data System, Massachusetts Department of Transportation, and the Boston Region MPO.
Figure 5 shows historic and projected values for the number of fatalities and serious injuries experienced by people traveling by nonmotorized means for the Boston region and Massachusetts as a whole. This category reflects bicyclist and pedestrian fatalities and serious injuries, as well as those experienced by others traveling by nonmotorized modes (such as skateboarders). Unlike the prior measures, values for this measure have been increasing over time for both the Boston region and Massachusetts overall.
Figure 5
Nonmotorized Fatalities and Serious Injuries
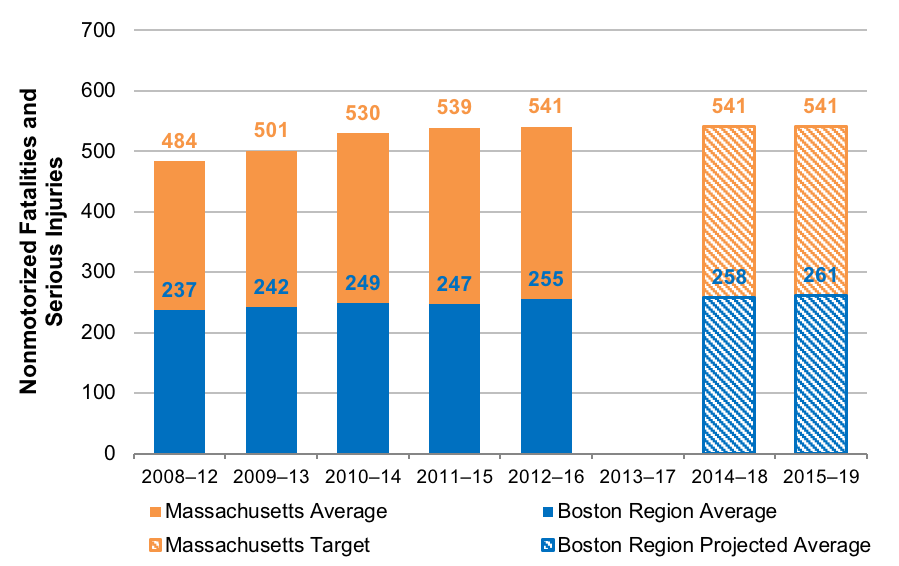
Notes: Values reflect five-year rolling annual averages and have been rounded to the nearest integer. MPO staff developed projections for the Boston region using a linear trend line, a draft estimate of 32 nonmotorized fatalities for CY 2017, and a draft estimate of 220 nonmotorized serious injuries for CY 2017.
CY = calendar year. MPO = Metropolitan Planning Organization.
Sources: National Highway Traffic Safety Administration Fatality Analysis and Reporting System, Massachusetts Crash Data System, Massachusetts Department of Transportation, and the Boston Region MPO.
MassDOT recognizes that its initiatives to increase nonmotorized travel throughout the Commonwealth have posed a challenge to concurrent activities to reduce nonmotorized fatalities and injuries. Rather than adopt a target that reflects an increased amount of nonmotorized fatalities and serious injuries, MassDOT has kept its nonmotorized performance targets to date approximately level with recent baselines. It plans to counter increasing trends in nonmotorized fatalities and serious injuries through investments and other initiatives that address safety for pedestrians, bicyclists, and others who travel by nonmotorized means.
Table 6 lists the Commonwealths’ 2012–16 rolling average values for the fatality and serious injury performance measures and summarizes CY 2019 targets for the federally required roadway safety performance measures. As previously mentioned, the MPO elected to support the Commonwealth’s CY 2019 roadway safety performance targets.
Table 6
Massachusetts Statewide Highway Safety
Performance Baselines and CY 2019 Targets
Highway Safety Performance Measure |
2016 Safety Measure Value (2012–16 Rolling Average) |
2019 Safety Measure Target (Expected 2015–19 Rolling Average) |
Number of fatalities |
363.80 |
353.00 |
Rate of fatalities per 100 million vehicle-miles traveled |
0.61 |
0.58 |
Number of serious injuries |
3145.80 |
2801.00 |
Rate of serious injuries per 100 million vehicle-miles traveled |
5.24 |
4.37 |
Number of nonmotorized fatalities and nonmotorized serious injuries |
540.80 |
541.00 |
Note: All values have been rounded to the hundredth place.
CY = calendar year. MassDOT = Massachusetts Department of Transportation.
Sources: National Highway Traffic Safety Administration Fatality Analysis Reporting System, Massachusetts Crash Data System, MassDOT, and the Boston Region MPO.
By electing to support the Commonwealth’s roadway safety targets, the MPO agreed to plan and program projects so that they contribute to achieving those targets. Anticipating the ability of transportation projects to reduce fatalities and serious injuries from motor vehicle crashes is a challenge, as these crashes may be a consequence of many factors other than infrastructure condition, such as driver behavior—including seatbelt use and driver distraction or intoxication—and weather conditions.
When investing its Regional Target funds, the MPO aims to identify projects likely to have maximum safety benefits by using its TIP project selection criteria, which account for crash activity within the project area and the types of safety countermeasures included in the proposed project. When conducting project evaluations, the MPO considers crash rates within the vicinity of projects and the Equivalent Property Damage Only (EPDO) value associated with those crashes. The EPDO index is used to assess the severity of crashes by assigning weighted values to crashes involving fatalities or injuries higher than those that only involve property damage.
All of the roadway projects included in the MPO’s FFYs 2019–23 TIP Regional Target Program include safety countermeasures or features that the MPO expects will improve safety for motorists, bicyclists, and pedestrians. The MPO’s investments in its Intersection Improvement, Complete Streets, and Major Infrastructure programs are expected to support safety improvements on roadways supporting multiple travel modes, while its Bicycle Network and Pedestrian Connections projects will support safety for those traveling by nonmotorized means by providing separated facilities for bicyclists and pedestrians.
The MPO also examines whether projects would improve safety at MassDOT-identified Highway Safety Improvement Program (HSIP) crash cluster locations. MassDOT identifies crash clusters using a procedure for processing, standardizing, matching, and aggregating crash locations and data.6 MassDOT’s HSIP clusters are those that rank in the top five percent of crash clusters within each regional planning agency area based on their EPDO value. MassDOT creates a set of HSIP clusters that include all motor vehicle crashes involving motor vehicles, as well as sets of clusters that reflect motor vehicle crashes that involved bicyclists or pedestrians. Locations with HSIP clusters are eligible for funding through MassDOT’s HSIP program.
Table 7 shows that many of these roadway projects are located in areas that overlap with HSIP clusters, and several are located in places that overlap HSIP Bicycle or Pedestrian clusters or where fatal or serious injury crashes have occurred between CY 2014 and 2016. The MPO expects that this combination of safety countermeasures and improvements focused in priority locations will help the MPO and the Commonwealth progress towards reducing fatalities and serious injuries on the roadway network.
Table 7
Regional Target Roadway Project Metrics Related to Safety Performance
Metric |
Value |
Regional Target projects that address all-mode HSIP clustersa |
16 projects |
All-mode HSIP cluster locations addressed by Regional Target projectsa |
23 locations |
Regional Target projects that address HSIP Pedestrian clustersb |
3 projects |
HSIP pedestrian cluster locations addressed by Regional Target projectsb |
7 locations |
Regional Target projects that address HSIP bicycle clustersb |
2 projects |
HSIP bicycle cluster locations addressed by Regional Target projectsb |
2 locations |
Project areas where fatal crashes have occurredc |
4 areas |
Project areas where crashes involving injuries have occurredc |
36 areas |
Project areas where crashes involving pedestrians have occurredc |
26 areas |
Project areas where crashes involving bicyclists have occurredc |
17 areas |
Note: The group of projects reflected in this table does not include the Green Line Extension, Community Transportation/Parking/Clean Air and Mobility investments, or Middlesex 3 TMA support.
a All-mode HSIP clusters are based on crash data from 2013 to 2015.
b HSIP bicycle clusters and HSIP pedestrian clusters are based on data from 2006 to 2015.
c Analyses of crashes in locations with projects funded by Regional Targets are based on crash data from 2014 to 2016.
HSIP = Highway Safety Improvement Program. MPO = Metropolitan Planning Organization. TMA = Transportation Management Association.
Sources: Massachusetts Crash Data System, the Massachusetts Department of Transportation, and the Boston Region MPO.
The FFYs 2019–23 TIP projects programmed by MassDOT will also support safety and are expected to reduce fatalities and serious injuries on the region’s roadways. The Reliability and Modernization programs included in MassDOT’s CIP are geared toward maintaining and upgrading infrastructure, which will help make travel safer on the region’s roadways. MassDOT’s Intersection Improvements, Roadway Improvements, Roadway Reconstruction, and Safety Improvements programs most directly address safety considerations, although its Bridge and Pavement Improvement programs may also support safety by supporting asset maintenance and state of good repair. Moreover, MassDOT’s Bicycle and Pedestrian projects may reduce nonmotorized fatalities and injuries by proving separated facilities for bicyclists and pedestrians.
The MPO’s goal for this area is to maintain the transportation system. System preservation policies for the region must encompass bridges, pavement, sidewalks, and transit system assets. They must address existing maintenance and state-of-good-repair needs, necessary updates to infrastructure to meet customer needs, and prepare for existing or future extreme conditions, such as sea level rise and flooding. The MPO’s Regional Target projects support asset condition improvements, which complement MassDOT and transit agencies’ more extensive state-of-good-repair and modernization projects. MassDOT uses information from its internal asset management systems to guide decisions about asset maintenance and modernization and considers investment priorities from its Transportation Asset Management Plan (TAMP).7 The TAMP is a federally required risk-based asset management plan that includes asset inventories, condition assessments, and investment strategies to improve the condition and performance of the National Highway System, particularly its bridges and pavements. Similarly, transit agencies that receive FTA funding must produce TAM plans that describe transit system assets and condition and the tools and investment strategies these agencies will use to improve them.
As of 2018, Massachusetts includes approximately 5,218 bridge structures, of which 1,613 (31 percent) are located within the Boston region.8 To meet federal performance monitoring requirements, states and MPOs must track and set performance targets for the condition of bridges on the NHS, a network that includes the Interstate Highway System and other roadways of importance to the nation’s economy, defense, and mobility. FHWA bridge condition performance measures include
These performance measures classify NHS bridge condition as good, fair, or poor based on the condition ratings of three bridge components: the deck, the superstructure, and the substructure.9 The lowest rating of the three components determines the overall bridge condition.10 The measures express the share of NHS bridges in a certain condition by deck area, divided by the total deck area of NHS bridges in the applicable geographic area (state or MPO).
Table 8 shows performance baselines for Massachusetts NHS bridge condition and Boston Region NHS bridge condition. As of 2017, Massachusetts had 2,246 NHS bridges, which MassDOT analyzed to understand their current condition with respect to the federal bridge condition performance measures. The Boston Region MPO performed a similar analysis on its 859 NHS bridges in 2018. According to these baseline values, the Boston region has a larger share of NHS bridge deck area considered to be in good condition, and a slightly smaller share of NHS bridge deck area considered to be in poor condition, compared to Massachusetts overall.
Table 8
Massachusetts and Boston Region NHS Bridge Condition Baselines
Geographic Area |
Federally Required Bridge Condition Performance Measure |
Total NHS Bridges |
Total NHS Bridge Deck Area (square feet) |
Percent of NHS Bridges in Good Condition |
Percent of NHS Bridges in Poor Condition |
Massachusettsa |
Percent of NHS Bridges [by deck area] that are in good condition |
2,246 |
29,457,351 |
15.2% |
12.4% |
Boston Regionb |
Percent of NHS Bridges [by deck area] that are in poor condition |
859 |
14,131,094 |
19.2% |
11.8% |
a Massachusetts baseline data is based on a MassDOT analysis conducted in 2018.
b Boston region comparison data is based on a Boston Region MPO analysis conducted in 2018.
MassDOT = Massachusets Department of Transportation. MPO = Metropolitan Planning Organization. NHS = National Highway System.
Sources: MassDOT and Boston Region MPO.
Federal regulation has established 10 percent as a threshold for bridges in poor condition, above which states must obligate a minimum amount of National Highway Performance Program (NHPP) funds to on-system bridges. USDOT has established 10 percent as a threshold for NHS bridge deck area that is in poor condition, and departments of transportation for states that exceed that threshold must direct a defined minimum amount of NHPP funding toward improving NHS bridges. Because more than 10 percent of Massachusetts NHS bridge deck area is in poor condition, MassDOT programs this minimum amount.
States must set performance targets for these measures at two-year and four-year intervals. Table 9 shows MassDOT’s NHS bridge performance targets, which it established in 2018. The two-year target reflects conditions as of the end of CY 2019, and the four-year target reflects conditions as of the end of CY 2021. These targets reflect MassDOT’s anticipated NHS bridge condition based on historic trends, as well as planned bridge investments. As shown in the table, MassDOT expects there will be a small increase in the share of NHS bridge deck area in good condition by the end of CY 2021, while it expects that the share of NHS bridge deck area in poor condition in CY 2021 will be slightly lower than the baseline.
Table 9
NHS Bridge Condition Targets
Federally Required Bridge Condition Performance Measure |
2018 Measure Value (Baseline) |
Two-Year Target |
Four-Year Target |
Percent of NHS Bridges [by deck area] that are in good condition |
15.2% |
15.0% |
16.0% |
Percent of NHS Bridges [by deck area] that are in poor condition |
12.4% |
13.0% |
12.0% |
CY = calendar year. MassDOT = Massachusetts Department of Transportation. NHS = National Highway System.
Source: MassDOT.
MPOs are required to set four-year bridge performance targets by either electing to support state targets or setting separate quantitative targets for the MPO area. The Boston Region MPO elected to support MassDOT’s four-year targets for these measures in November 2018. The MPO will work with MassDOT to meet these targets through its Regional Target investments.
As with NHS Bridges, USDOT’s performance management framework requires states and MPOs to monitor and set targets for the condition of pavement on NHS roadways. Massachusetts has 3,202 lane miles of Interstate roadways, 1,152 lane miles (or 36 percent) of which are in the Boston region.11 The state’s non-Interstate NHS network is made up of 7,319 lane-miles of roadways, and the Boston region contains 2,252 (or 35 percent) of those lane miles. Applicable federal performance measures include the following:
The Interstate performance measures classify Interstate pavements as in good, fair, or poor condition based on the pavements’ International Roughness Index (IRI) value and one or more pavement distress metrics (cracking and/or rutting and faulting) depending on the pavement type (asphalt, jointed concrete, or continuous concrete). FHWA sets thresholds for each metric that determine whether the metric value is good, fair, or poor, along with thresholds that determine whether the pavement segment as a whole is considered to be in good, fair, or poor condition. Non-Interstate NHS pavements are subject to the same thresholds for IRI values. States will be required to collect data for the complementary distress metrics starting in 2020, which will be incorporated into future performance monitoring.
MassDOT tracks the condition of Massachusetts’ roadways, including all of the Commonwealth’s NHS network, through its Pavement Management Program. In 2018, MassDOT established performance targets for these NHS pavement condition performance measures, which are shown along with baseline data in Table 10. As with the NHS bridge condition performance targets, the two-year target reflects conditions as of the end of CY 2019, and the four-year target reflects conditions as of the end of CY 2021. While MassDOT has collected IRI data in past years, these federally required performance measures also require other types of distress data that have not previously been required as part of pavement monitoring programs.12 MassDOT notes that setting targets for these pavement condition measures is challenging given the lack of complete historic data. MassDOT’s approach when setting target was to use past pavement indicators to identify trends and to set conservative targets, and to revisit its four-year target in in 2020, when more data is available.
Table 10
Massachusetts NHS Pavement Condition
Baselines and Performance Targets
Federally Required Pavement Condition Performance Measure |
2017 Measure Value (Baseline) |
Two-Year Target |
Four-Year Target |
Percent of Interstate Highway System pavements that are in good conditiona |
74.2% |
70.0% |
70.0% |
Percent of Interstate Highway System pavements that are in poor conditiona |
0.1% |
4.0% |
4.0% |
Percent of non-Interstate NHS pavements that are in good condition |
32.9% |
30.0% |
30.0% |
Percent of non-Interstate NHS pavements that are in poor condition |
31.4% |
30.0% |
30.0% |
a For the first federal performance monitoring period (2018–21), the Federal Highway Administration has only required states to report four-year targets for pavement condition on the Interstate Highway System. MassDOT has developed both two-year and four-year targets for internal consistency.
CY = calendar year. MassDOT = Massachusetts Department of Transportation. NHS = National Highway System.
Source: MassDOT.
As with NHS bridge condition performance measures, MPOs are required to set four-year Interstate pavement condition and non-Interstate NHS pavement condition performance targets by either supporting state targets or setting separate quantitative targets the MPO area. The Boston Region MPO elected to support MassDOT’s four-year targets for these NHS pavement condition measures in November 2018. The MPO will work with MassDOT to meet these targets through its Regional Target investments.
When prioritizing capital investments for the TIP, the MPO uses its project evaluation criteria to assess how well each project funded with Regional Target dollars may help maintain or modernize the MPO’s roadway infrastructure. The MPO’s policy has been to not use Regional Target funds for projects that only resurface pavement. However, the MPO does fund roadway reconstruction projects that include pavement improvements in addition to other design elements. The MPO uses IRI information and data provided by project proponents to identify substandard pavement and awards points to projects that will improve these pavements.13 Similarly, the MassDOT Bridge Program remains the primary funding source for replacement or rehabilitation of substandard bridges, but the MPO’s Regional Target investments also contribute modestly to bridge improvements. The MPO awards points to candidate TIP projects that include improvements for substandard bridges. Projects funded with Regional Target dollars also improve traffic signal equipment or sidewalk infrastructure; enable improved emergency response; or improve the resiliency of the transportation system to extreme weather conditions.
Table 11 displays metrics that describe how the MPO’s FFYs 2019–23 Regional Target projects are expected to improve infrastructure on the region’s roadways. MPO staff developed estimates for these metrics using available data from MassDOT Bridge Inventory and Road inventory files; project proponent information such as functional design reports (FDR); the MPO’s All-Hazards Planning Application; results from MPO TIP project evaluations; and other sources. Materials supporting the MPO’s project selection process included information on projects that address parts of the NHS system, and Table 11 includes measures specific to NHS pavement and bridges. The MPO expects that its FFYs 2019–23 investments will help make progress towards statewide NHS bridge and pavement condition targets and will help improve the overall condition of the region’s roadways and bridges.
Table 11
Regional Target Project Metrics Related to
Roadway System Preservation Performance
Metric |
Value |
Bridge structures improved |
8 structures |
NHS bridge structures improved |
4 structures |
New bridge structures to be constructed |
3 structures |
Lane miles of substandard pavement improveda |
86 lane miles |
Lane miles of substandard NHS pavement improveda |
55 lane miles |
Miles of substandard sidewalk improved |
49 miles |
Projects that improve emergency response |
25 projects |
Projects that improve the ability to respond to extreme conditionsb |
8 projects |
Note: The group of projects reflected in this table does not include the Green Line Extension, Community Transportation/Parking/Clean Air and Mobility investments, or Middlesex 3 TMA support.
a Substandard pavement designations are based on data provided by MassDOT and project proponents and on MPO assessments conducted for TIP evaluations. The estimated lane miles of substandard NHS improved is based on the pavement condition assessment for the project and the MPO’s assessment of the portion of the project on the NHS.
NHS = National Highway System. TMA = Transportation Management Association.
Source: MassDOT and Boston Region MPO.
Many of MassDOT’s FFYs 2019–23 TIP investments address bridge and pavement condition. MassDOT’s Bridge programs include 17 projects that will improve or replace 39 structures, 31 of which are NHS bridge structures. Its Interstate Pavement program will improve pavements on Interstate 93 in Boston, Milton, and Quincy; on Interstate 95 in Reading, Wakefield, Danvers, Topsfield, Boxford, and Rowley; and on Interstate 495 in Wrentham, Franklin, and Plainville. Meanwhile, MassDOT’s non-Interstate pavement program includes 14 projects that will improve pavements on MassDOT-owned NHS roadways in 25 Boston region municipalities. These projects are expected to help MassDOT make progress toward its NHS bridge and pavement performance targets. Projects in MassDOT’s other Reliability and Modernization programs—including its Intersection Improvements, Roadway Improvements, Roadway Reconstruction, and Safety Improvements programs—include elements that will improve pavement and roadway infrastructure condition in the Boston region.
The Boston region includes three transit agencies that regularly receive FTA funds to provide service—the MBTA, CATA and MWRTA. These agencies are responsible for meeting planning and performance-monitoring requirements under FTA’s TAM rule, which is focuses on achieving and maintaining a state of good repair for the nation’s transit systems. Each year, they must submit progress reports and updated performance targets for TAM performance measures, which relate to transit rolling stock, nonrevenue service vehicles, facilities, and rail fixed guideway infrastructure. Transit agencies develop these performance targets based on their most recent asset inventories and condition assessments, along with their capital investment and procurement expectations, which are informed by their TAM Plans. MBTA, MWRTA, and CATA share their asset inventory and condition data and their performance targets with the Boston Region MPO, so that the MPO can monitor and set TAM targets for the Boston region.
The following subsections discuss the MPO’s current performance targets (adopted in March 2019) for each TAM performance measure. These performance targets reflect MBTA, CATA, and MWRTA SFY 2019 TAM performance targets (for July 2018 through June 2019). MPO staff has aggregated some information for asset subgroups. These tables highlight whether transit agencies expect to see performance for specific asset subgroups get better or worse compared to the SFY 2018 baseline (June 30, 2018).
FTA’s TAM performance measure for the state of good repair for rolling stock and equipment vehicles (service support, maintenance, and other nonrevenue vehicles) is the percent of vehicles that meet or exceed their useful life benchmark (ULB). This performance measure uses vehicle age as a proxy for state of good repair (which may not necessarily reflect condition or performance), with the goal being to bring this value as close to zero as possible. FTA defines ULB as “the expected lifecycle of a capital asset for a particular transit provider’s operating environment, or the acceptable period of use in service for a particular transit provider’s operating environment.” For example, FTA’s default ULB value for a bus is 14 years. When setting targets, each agency has discretion to use FTA-identified default ULBs for vehicles or to adjust ULBs with approval from FTA. The MBTA has used FTA default ULBs for its rolling stock targets and uses MBTA-defined ULBs, which are based on agency-specific usage and experience, for its equipment targets. CATA and MWRTA have selected ULBs from other sources.14
Table 12 describes SFY 2018 baselines and the MPO’s SFY 2019 targets for rolling stock, which refers to vehicles that carry passengers. As shown below, the MBTA, CATA, and MWRTA are improving performance for a number of rolling stock vehicle classes. Transit agencies can make improvements on this measure by expanding their rolling stock fleets or replacing vehicles within those fleets.
Table 12
SFY 2018 Measures and SFY 2019 Targets
for Transit Rolling Stock
| Agency | Asset Type | SFY 2018 Baseline (as of June 30, 2018): Number of Vehicles | SFY 2018 Baseline (as of June 30, 2018): Percent of Vehicles ≥ ULB | SFY 2019 Targets (as of June 30, 2019): Number of Vehicles | SFY 2019 Targets (as of June 30, 2019): Percent of Vehicles ≥ ULB |
| MBTA | Buses | 1,022 | 25% | 1,028 | 25% |
| MBTA | Light Rail Vehicles | 205 | 46% | 229 | 41% |
| MBTA | Heavy Rail Vehicles | 432 | 58% | 450 | 56% |
| MBTA | Commuter Rail Locomotives | 94 | 27% | 104 | 24% |
| MBTA | Commuter Rail Coaches | 426 | 0% | 429 | 0% |
| MBTA | Ferry Boats | 4 | 0% | 4 | 0% |
| MBTA | THE RIDE Paratransit Vehiclesa | 763 | 35% | 763 | 9% |
| CATA | Buses | 9 | 11% | 8 | 0% |
| CATA | Cutaway Vehiclesb | 23 | 13% | 23 | 0% |
| CATA | Trolleys (simulated)c | 2 | 100% | 2 | 100% |
| MWRTA | Cutaway Vehiclesb,d | 89 | 6% | 93 | 0% |
| MWRTA | Automobilesd | 9 | 0% | 9 | 0% |
a The MBTA’s THE RIDE paratransit vehicles data and targets reflect automobiles, vans, and minivans.
b The National Transit Database defines a cutaway vehicle as a vehicle in which a bus body is mounted on a van or light-duty truck chassis, which may be reinforced or extended. CATA uses nine of these vehicles to provide fixed-route services, and 14 of these vehicles to provide demand-response service.
c Simulated trolleys, also known as trolley-replica buses, have rubber tires and internal combustion engines, as opposed to steel-wheeled trolley vehicles or rubber-tire trolley buses that draw power from overhead wires.
d MWRTA uses cutaway vehicles to provide fixed-route and demand-response service, and uses autos to provide demand response service.
CATA = Cape Ann Transportation Authority. MBTA = Massachusetts Bay Transportation Authority.
MWRTA = MetroWest Regional Transit Authority. SFY = State Fiscal Year. ULB = Useful Life Benchmark.
Sources: CATA, MBTA, MWRTA and the Boston Region MPO.
Table 13 shows SFY 2018 baselines and the MPO’s SFY 2019 targets for transit equipment vehicles. MPO staff has aggregated targets for nonrevenue vehicle subtypes for each of the three transit agencies. Similar to transit rolling stock, transit agencies can make improvements on these measures by expanding their fleets or replacing vehicles within those fleets.
Table 13
SFY 2018 Measures and SFY 2019 Targets for Transit Equipment Vehicles
| Agency | SFY 2018 Baseline (as of June 30, 2018): Number of Vehicles | SFY 2018 Baseline (as of June 30, 2018): Percent of Vehicles ≥ ULB | SFY 2019 Targets (as of June 30, 2019): Number of Vehicles | SFY 2019 Targets (as of June 30, 2019): Percent of Vehicles ≥ ULB |
| MBTAa | 1,676 | 20% | 1,676 | 22% |
| CATA | 4 | 25% | 3 | 0% |
| MWRTA | 12 | 50% | 12 | 50% |
a MBTA equipment includes both commuter rail and transit system nonrevenue service vehicles.
CATA = Cape Ann Transportation Authority. MBTA = Massachusetts Bay Transportation Authority.
MWRTA = MetroWest Regional Transit Authority. SFY = State Fiscal Year. ULB = Useful Life Benchmark.
Sources: CATA, MBTA, MWRTA and the Boston Region MPO.
FTA assesses the state-of-good-repair condition for passenger stations, parking facilities, and administrative and maintenance facilities using the FTA Transit Economic Requirements Model (TERM) scale, which generates a composite score based on assessments of facility components. Facilities with scores below three are considered to be in marginal or poor condition (though this score is not a measure of facility safety or performance). The goal is to bring the share of facilities that meet this criterion to zero. Infrastructure projects focused on individual systems may improve performance gradually, while more extensive facility improvement projects may have a more dramatic effect on a facility’s TERM scale score.
Table 14 shows SFY 2018 measures and the MPO’s SFY 2019 targets for MBTA, CATA, and MWRTA facilities. The MBTA measures and targets only reflect those facilities that have undergone a recent on-site condition assessment. The number of facilities that the MBTA has not yet assessed is shown to provide a more comprehensive count of the MBTA’s assets.
Table 14
SFY 2018 Measures and SFY 2019 Targets for Transit Facilities
| Agency | Facility Type | SFY 2018 Baseline (as of June 30, 2018): Number of Facilities | SFY 2018 Baseline (as of June 30, 2018): Percent of Facilities < 3 | SFY 2019 Baseline (as of June 30, 2019): Number of Facilities | SFY 2019 Baseline (as of June 30, 2019): Percent of Facilities < 3 |
| MBTA | Passenger–Assesseda | 96 | 13% | 96 | 11% |
| MBTA | Passenger– Not Assesseda | 285 | In progress | 286 | TBD |
| MBTA | Administrative/ | 156 | 68% | 156 | 63% |
| MBTA | Maintenance–Assessed | 38 | In progress | 38 | TBD |
| CATA | Administrative/ | 1 | 0% | 1 | 0% |
| MWRTA | Maintenance–Not Assessed | 1 | 0% | 1 | 0% |
a Passenger facilities include stations and parking facilities.
CATA = Cape Ann Transportation Authority. MBTA = Massachusetts Bay Transportation Authority.
MWRTA = MetroWest Regional Transit Authority. N/A = Not applicable. TBD = To be determined.
Sources: CATA, MWRTA, MBTA, and theBoston Region MPO.
Table 15 describes SFY 2018 baselines and SFY 2019 targets for infrastructure condition, specifically rail fixed guideway condition. The MBTA is the only transit agency in the Boston region with this asset type. The performance measure that applies to these assets is the percentage of track that is subject to performance, or speed, restrictions. The MBTA samples the share of track segments with speed restrictions throughout the year. These performance restrictions may reflect not only the condition of track, signal, and other supporting systems, which the MBTA can improve through maintenance, upgrade, and replacement and renewal projects. Again, the goal is to bring the share of MBTA track systems subject to performance restrictions to zero.
Table 15
SFY 2018 Measures and SFY 2019 Targets for MBTA Transit Fixed Guideway Infrastructure
| Agency | Track Type | SFY 2018 Baseline (as of June 30, 2018): Directional Route Miles | SFY 2018 Baseline (as of June 30, 2018): Percent of Miles with Speed Restrictions | SFY 2019 Baseline (as of June 30, 2019): Directional Route Miles | SFY 2019 Baseline (as of June 30, 2019): Percent of Miles with Speed Restrictions |
| MBTA | Transit Fixed Guidewaya | 130.23 | 11% | 130.23 | 10% |
| MBTA | Commuter Rail Fixed Guideway | 663.84 | 1% | 663.84 | 1% |
Note: The term “directional track miles” represents the miles managed and maintained by the MBTA with respect to each direction of travel (for example, northbound and southbound), and excludes nonrevenue tracks such as yards, turnarounds, and storage tracks. The baseline and target percentages represent the annual average number of miles meeting this criterion over the 12-month reporting period.
a The MBTA’s Transit Fixed Guideway information reflects light rail and heavy rail fixed guideway networks.
MBTA = Massachusetts Bay Transportation Authority. SFY = State Fiscal Year.
Sources: CATA, MWRTA, MBTA, and theBoston Region MPO.
Many different types of transit investments may affect the TAM vehicles, facilities, or fixed guideway performance measures described in the previous section, because these investments may either improve or replace assets already included in transit agency inventories, or because they may expand those inventories. These investments may improve assets gradually over time by upgrading specific asset subsystems, or they may generate more dramatic changes in performance by overhauling or replacing assets. The sections that follow describe how the MBTA, CATA, and MWRTA are investing in their transit systems through the FFYs 2019–23 TIP to improve transit asset condition and make progress toward TAM targets.
During FFYs 2019–23, the MBTA will be investing in vehicles to replace or expand its fleets through its Revenue Vehicles and Bus programs. Examples of planned investments made through these programs include the procurement of buses and Green Line light rail vehicles. Also, the Green Line Extension project, which the MPO will help support with its Regional Target funds, will include investments in vehicles to support the new service. Meanwhile, MWRTA and CATA will be replacing several of their revenue vehicles. Collectively, these investments will help improve the state-of-good-repair condition of transit fleets.
During FFYs 2019–23, the MBTA’s Stations and Facilities program will improve facility conditions in various locations throughout the system. Examples of projects include improvements to elevators at Oak Grove station and repairs to the Harvard Square busway. Other federal funds will support Hingham Ferry Dock modification. In addition, as with revenue vehicles, the Green Line Extension project will include investment in new stations as part of the expansion of service. During the same period, MWRTA and CATA will be making investments to improve their respective administrative and maintenance facilities.
The MBTA’s Signals and System Upgrade Program will support improvements to rail system signals, track, and communication systems during FFYs 2019–23. Examples of projects include upgrades to Red and Orange Line signals and Green Line D Branch track and signal replacement. These types of improvements may ultimately help reduce performance restrictions on MBTA fixed guideways. The installation of new track and systems as part of the Green Line Extension project will also affect fixed guideway infrastructure performance measures in the future.
The MPO’s capacity management and mobility goal focuses on using existing facility capacity more efficiently and increasing healthy transportation options.
The MPO’s objectives in this area encompass a variety of modes and aspects of mobility, including access to and the accessibility of different transportation modes, connectivity between modes and systems, and support for reliable travel and congestion mitigation. Much of the Boston region is densely developed, which creates challenges to addressing these types access, reliability, and congestion mitigation needs.
A number of different planning processes come together to address capacity management and mobility performance, issues, and needs. Through its Congestion Management Process, the MPO does extensive analysis of congestion and mobility constraints in the region, and it also produces periodic CMAQ Program performance plans that describe other congestion-oriented measures and targets. The MPO combines this work with ongoing system-level analyses that support its long-range planning, which are documented in its Long-Range Transportation Plan Needs Assessment.
MassDOT conducts its own analyses of mobility performance and needs, which it documents in modal plans such as its Freight Plan, Bicycle Plan, and Pedestrian Plan, its own CMAQ Performance Plan, and its MassDOT Performance Management Tracker tool. Meanwhile, the MBTA tracks and analyzes mobility metrics and uses these to support planning processes, such as Focus40, its current long-term investment plan. The exchange and integration of these plans help agencies in the Boston region coordinate to improve mobility across modes.
The MPO examines a number of different metrics to understand congestion and mobility issues. The sections below focus on federally required performance measures that relate to this MPO goal area.
FHWA requires states and MPOs to monitor and set targets for two performance measures that pertain to all travelers on NHS roadways:
These measure captures (1) whether travel times on an NHS segment are consistent (reliability); and (2) the extent to which NHS users’ travel may be affected by those conditions (percent of person miles). Several component metrics make up this measure:
States or MPOs identify the person-miles of travel for each NHS segment and divide the total person-miles on the relevant NHS network that are reliable by the total person-miles on the relevant NHS network. To support this analysis, FHWA provides travel-time and traffic-volume data as part of the National Performance Management Research Data Set (NPRMDS), in which travel time data is reported by traffic messaging channel (TMC) segments.
States are required to set two-year and four-year targets for these measures. In 2018, MassDOT calculated baselines and established targets for these measures for the Massachusetts Interstate and non-Interstate NHS networks. When establishing baseline values, MassDOT only examined NPMRDS travel-time data from CY 2017 because the NPMRDS from prior years was assembled using different data collection methods and has some different features. Because historic data was limited, MassDOT considered FHWA guidance and recommendations for establishing initial targets with this limited historic data, and set its initial targets equal to CY 2017 baseline values.16
Table 16 shows MassDOT’s CY 2017 baselines and two-year and four-year targets for these measures. The Boston Region MPO, like all MPOs, was required to establish four-year targets for these measures by either supporting state targets or setting its own quantitative targets for the Boston region. In 2018, the MPO board voted to support the state’s four-year targets. Table 16 also shows CY 2017 baselines for the Boston region’s Interstate and non-Interstate NHS networks as a basis for comparison. As the table shows, the Boston region’s share of reliable person-miles traveled on its Interstate and non-Interstate NHS networks is lower than those values for Massachusetts as a whole.
Table 16
Travel Time Reliability Baselines and Performance Targets
Network |
Measure |
Cumulative Traffic |
2017 Measure |
Two-Year Target |
Four-Year Target |
Massachusetts—Interstate Highway System |
Percent of person-miles on the |
1,150 |
68.0% |
68.0% |
68.0% |
Massachusetts—Non-Interstate NHS System |
Percent of person-miles on the |
5,257 |
80.0% |
80.0% |
80.0% |
Boston Region—Interstate Highway System |
Percent of person-miles on the |
354 |
47.2% |
n/a |
n/a |
Boston Region—Non-Interstate NHS System |
Percent of person-miles on the |
1,799 |
69.0% |
n/a |
n/a |
aThe two-year target reflects conditions as of the end of CY 2019, and the four-year target reflects conditions as of the end of CY 2021.
CY = calendar year. n/a = not applicable. NHS = National Highway System.
Sources: National Performance Management Research Data Set, Cambridge Systematics, MassDOT, and the Boston Region MPO.
FHWA requires states and MPOs to track truck travel reliability on the Interstate system to better understand performance of the nation’s freight system. The applicable measure in this case is the Truck Travel Time Reliability Index (TTTR). Like the LOTTR, this measure compares longer (95th percentile) truck travel times to average (50th percentile) truck travel times. The greater the difference between these two travel times is on an Interstate segment the less reliable truck travel on that segment is considered to be. For each Interstate segment, states and MPOs calculate TTTR values for different day-and-time periods and weight the segment length by the maximum applicable TTTR value.17 They then sum these weighted segment lengths for all Interstate segments and divide that total value by length of the full Interstate network for the applicable geographic area. Like segment-specific TTTR values, the greater this aggregate value is, the more unreliable the network is with respect to truck travel.
In 2018, MassDOT has calculated baseline TTTR Index values and established performance targets using CY 2017 truck travel time data included in the NPMRDS. As with the all-passenger travel time reliability targets, MassDOT set its two-year and four-year targets equal to the CY 2017 baseline. Table 4-20 displays these values. The MPO board voted to support MassDOT’s four-year TTTR Index target in 2018. Table 17 also includes the Boston region’s CY 2017 baseline index value. As the table shows, the Boston region’s TTTR baseline value is higher than the one for Massachusetts, indicating that truck travel on the region’s Interstate network is generally less reliable than on Massachusetts’s Interstates as a whole.
Table 17
Truck Travel Time Reliability Performance Targets
Network |
Measure |
Cumulative Traffic |
2017 Measure |
Two-Year Target |
Four-Year Target |
Massachusetts—Interstate Highway System |
Truck Travel Time Reliability Index |
1,150 |
1.85 |
1.85 |
1.85 |
Boston Region—Interstate Highway System |
Truck Travel Time Reliability Index |
354 |
2.55 |
n/a |
n/a |
aThe two-year target reflects conditions as of the end of CY 2019, and the four-year target reflects conditions as of the end of CY 2021.
CY = calendar year. n/a = not applicable. NHS = National Highway System.
Sources: National Performance Management Research Data Set, Cambridge Systematics, MassDOT, and the Boston Region MPO.
MassDOT and the Boston Region MPO examine mobility using measures they must monitor to meet CMAQ program requirements. These measures are designed to help FHWA, states, and MPOs better understand the impacts of CMAQ investments, which are intended to contribute to air quality improvements and provide congestion relief. CMAQ traffic-congestion-related performance measures apply to urbanized areas (UZAs) that contain geographic areas designated as not attaining US Environmental Protection Agency (EPA) standards for criteria air pollutants and precursors from mobile sources (also known as nonattainment areas). The measures also apply to geographic areas that have a history of being in nonattainment and are thus required to maintain air quality monitoring and standard conformity processes (also known as maintenance areas).18
States must be involved in setting targets for CMAQ traffic performance measures if (1) they have mainline highways on the NHS that cross part of a UZA with a population of more than one million; and (2) that UZA contains part of a nonattainment or maintenance area for relevant criteria pollutants. Similarly, MPOs must participate in target setting for the traffic congestion measures if (1) the region contains mainline highways on the NHS that cross part of a UZA with a population of more than one million; and (2) the part of the MPO area that overlaps the UZA contains part of a nonattainment or maintenance area for relevant criteria pollutants. Massachusetts and the Boston Region MPO each meet these respective criteria and, therefore, must be involved in monitoring and setting targets for traffic congestion performance measures for the Boston UZA, which encompasses several MPO areas in eastern Massachusetts, New Hampshire, and Rhode Island.
The first of these CMAQ traffic congestion measures is annual hours of peak hour excessive delay (PHED) per capita, which estimates the excessive delay experienced by a UZA’s population from travel on the NHS during peak periods. States and MPOs calculate this measure using several component metrics:
The PHED per capita measure is calculated at the Boston UZA level by multiplying the hours of excessive delay during peak periods by the number of travelers during peak periods, and then dividing that total by the UZA population.
To understand baseline performance and set targets for this measure, MassDOT and NH DOT worked with analysts at Cambridge Systematics and, using 2017 NPMRDS data, calculated annual hours of PHED per capita for travel on the NHS in their respective portions of the Boston UZA.21 In 2018, the agencies in the Boston UZA that are subject to CMAQ performance monitoring requirements—MassDOT, the New Hampshire Department of Transportation (NH DOT), the Boston Region MPO, and the Northern Middlesex Council of Governments (NMCOG)—established two-year and four-year targets that maintain this 2017 baseline value for the annual hours of PHED per capita measure, as shown in Table 18.
Table 18
Boston UZA Baseline and Performance Targets for Annual Hours of Peak Hour Excessive Delay Per Capita
Geographic Area |
MA and NH Annual PHED |
Boston UZA Population (MA and NH only)a |
2017 Measure Value (Baseline) |
Two-Year Target |
Four-Year Target |
Boston Urbanized Area |
80,053,183 |
4,371,476 |
18.30 |
18.30 |
18.30 |
a Cambridge Systematics aggregated 2012-16 American Community Survey population estimates from the US Census Bureau at the block group level to estimate the population for the portion of the UZA in Massachusetts and New Hampshire, and then inflated this estimate for 2017 by applying information on expected population growth in the Boston Metropolitan Statistical area between 2016 and 2017.
b The two-year target reflects conditions as of the end of CY 2019, and the four-year target reflects conditions as of the end of CY 2021.
CY =calendar year. MA = Massachusetts. NH = New Hampshire. PHED = peak hours of excessive delay. UZA = urbanized area.
Sources: National Performance Management Research Data Set, US Census Bureau, Federal Highway Administration, MassDOT, the New Hampshire Department of Transportation, and Cambridge Systematics.
States and MPOs that meet applicability criteria for CMAQ performance requirements must also monitor and set targets for the share of non-SOV travel in their respective states or regions. This measure is calculated at the UZA level. The percent of non-SOV travel performance measure describes the extent to which people are using alternatives to single-occupancy vehicles to travel and, thus, helping to reduce traffic congestion and air pollution from mobile sources.
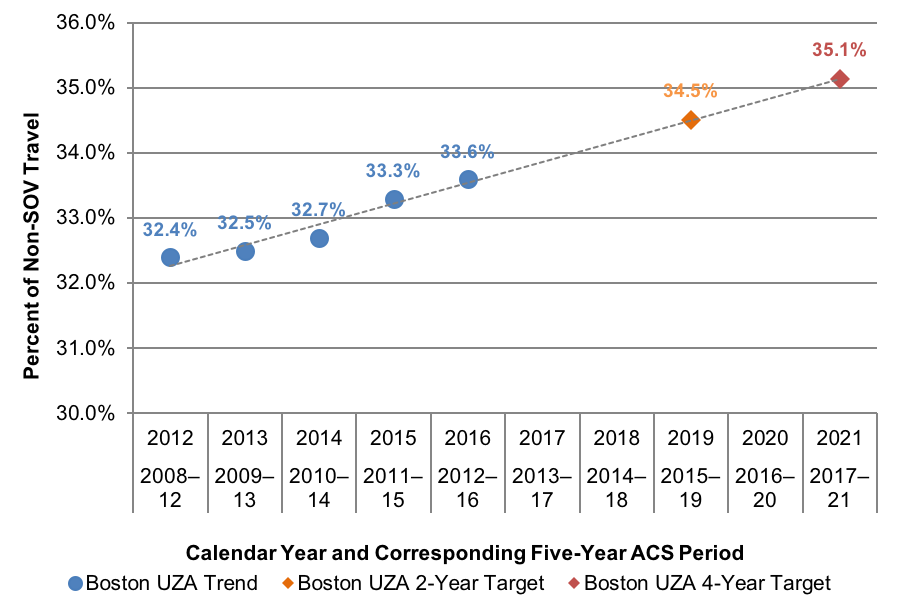
Collectively, MassDOT, NH DOT, the Boston Region MPO, and NMCOG used American Community Survey (ACS) data from the US Census Bureau to estimate the percent of workers age 16 and older who commuted to work using an option other than driving alone.22 These ACS five-year period estimates are rolling annual averages. Figure 4-8 shows how the percentage of workers using non-SOV commuting options in the Boston UZA has increased between 2012 (2008–12 ACS estimate) and 2016 (2012–16 ACS estimate). MassDOT calculated a linear trend line using these values for the Boston UZA and used that trend line to project expected values as of the end of CY 2019 (the expected 2015–19 ACS estimate) and CY 2021 (the expected 2017–21 ACS estimate). The agencies established these projected values as the Boston UZA targets for the percent of non-SOV travel. As Figure 6 shows, the share of non-SOV travel in the Boston region has been increasing steadily over time.
Figure 6
Historic Values and Performance Targets
for the Percent of Non-SOV Travel in the Boston UZA
Note: The two-year target reflects conditions as of the end of CY 2019, and the four-year target reflects conditions as of the end of CY 2021.
ACS = US American Community Survey. SOV = single-occupant vehicle. UZA = urbanized area.
Sources: US Census Bureau, 2012-16 American Community Survey Five-Year Estimates; MassDOT; and NH DOT.
Table 19 lists the recent baseline and performance target for this measure. It also includes a baseline value for non-SOV travel that is specific to the Boston region, which is a larger percentage than for the Boston UZA.
Table 19
Boston UZA Baseline and Performance Targets
for Percent of Non-SOV Travel
Geographic Area |
2012-16 Measure Value (Baseline) |
Two-Year Target |
Four-Year Target |
Boston UZA |
33.6% |
34.5% |
35.1% |
Boston region (97 municipalities) |
38.4% |
n/a |
n/a |
a The two-year target reflects conditions as of the end of CY 2019, and the four-year target reflects conditions as of the end of CY 2021.
CY = calendar year. n/a = not applicable. SOV = single-occupancy vehicle. UZA = urbanized area.
Sources: MassDOT, NH DOT, and the US Census American Community Survey.
The MPO seeks to make investments that help manage capacity on the transportation network and improve mobility for travelers in a variety of ways, including the following:
When prioritizing projects funded with Regional Target dollars, the MPO uses evaluation criteria to assess how well each project expands transportation options (and mode choice) by enhancing bicycle and pedestrian accommodations and connections to transit, and how well each project helps reduce congestion and delay for passenger vehicles (including transit vehicles) and trucks. MPO staff also gathered information about the relationship between TIP projects and the NHS, including unreliable segments on the NHS, based on 2017 NPMRDS data and federal travel time reliability performance thresholds.
By electing to support the Commonwealth’s targets for federally required reliability measures and agreeing to the UZA targets for the federally required annual hours of PHED per capita and non-SOV travel, the MPO agrees to plan and program projects so that they contribute to achieving those targets. It can be challenging to anticipate how transportation projects may affect these performance measures, as they track outcomes that are not only affected by transportation investments but also traveler choices and demand, among other factors. The MPO developed estimates for project-related metrics to see how its Regional Target roadway projects could improve the transportation system in ways that contribute to more reliable, less congested travel on the NHS or encourage more non-SOV travel:
Table 20 summarizes these estimates for Regional Target Roadway projects. MPO staff developed estimated values for these metrics using available data from FDRs and other materials provided by project proponents, results from MPO TIP evaluations, 2017 NPMRDS data, and other sources. Staff estimates aggregate TIP changes in vehicle hours of delay using project-level information on vehicle volumes and changes in delay times at intersections from project improvements.
Table 20
Regional Target-Funded Roadway Project Metrics Related to
Capacity Management and Mobility Performance
Metric |
Value |
Projects that overlap unreliable NHS segments and that will improve roadway signalization or geometrya |
9 projects |
Projects that overlap any NHS segments and that will improve roadway signalization or geometrya |
19 projects |
Net reduction in vehicle hours of delay per dayb |
14,800 hours reduced per day |
Net reduction in vehicle hours of delay per day for projects that overlap the NHSb |
11,900 hours reduced per day |
Miles of new sidewalks added |
18 miles |
Lane miles of new bicycle accommodations and shared-use paths |
66 lane miles |
Projects that improve intermodal connections or access to transit |
31 projects |
Note: The group of projects reflected in this table does not include the Green Line Extension, Community Transportation/Parking/Clean Air and Mobility investments, or Middlesex 3 TMA support.
a The MPO identified reliable and unreliable segments on the NHS using the 2017 NPMRDS federal travel time reliability performance thresholds.
b Calculations for reduced daily vehicle delay were conducted for a set of projects that exclude two Major Infrastructure roadway projects that were included in the air quality modeling results in Charting Progress to 2040: Project 604996–Bridge Replacement on New Boston Street in Woburn and Project 606226–Reconstruction of Rutherford Avenue in Boston.This aggregate estimate is based on projected future conditions for project locations and has been rounded to the nearest hundred.
MPO = Metropolitan Planning Organziation. NHS = National Highway System. TMA = Transportation Management Association
Source: Boston Region MPO.
Other Regional Target investments not mentioned in Table 20 will also support the availability of non-SOV options. By contributing to the Green Line Extension project, the MPO supports the expansion of light-rail service to more areas within the Boston region. In addition, through its Community Transportation program and its support for Middlesex 3 TMA shuttle service, the MPO expects to support projects that will enhance first- and last-mile connections to transit or address needs not covered by existing transit service. If these investments encourage people to take transit or nonmotorized alternatives instead of traveling alone in their cars, those on the region’s roadways may in turn experience less congestion and better reliability.
MassDOT, MBTA, and Regional Transit Authority (RTA) projects programmed in FFYs 2019–23 also address capacity management and mobility in the Boston region and may support improvements on federally required reliability, congestion, and non-SOV travel performance measures. In particular, MassDOT’s Bicycle and Pedestrian projects expand the region’s bicycle and pedestrian networks, which support non-SOV travel. Its Intersection Improvements program includes 12 projects on the NHS, which may address delay and congestion. One of its Roadway Reconstruction projects addresses a freight bottleneck identified in the state’s Freight Plan: the Interstate 90/Interstate 495 interchange in Hopkinton and Westborough, which will likely improve truck travel time reliability. Other MassDOT Roadway Reconstruction projects address pedestrian improvements, including amenities to support safe travel to schools. Meanwhile, MBTA and RTA investments enhance the region’s transit system and make it an attractive alternative to SOV travel.
The MPO aims to support clean air and sustainable communities in the Boston region by creating an environmentally friendly transportation system, which it pursues by investing in projects that reduce greenhouse gases (GHGs) and other transportation-related pollutants, and otherwise minimize negative environmental impacts.
The MPO agrees that GHG emissions contribute to climate change. If climate change trends continue as projected, the conditions in the Boston region will include a rise in sea level coupled with storm-induced flooding, and warmer temperatures that would affect the region’s infrastructure, economy, human health, and natural resources. Massachusetts is responding to this challenge by taking action to reduce the GHGs produced in the state, including those generated by the transportation sector. To that end, Massachusetts passed its Global Warming Solutions Act (GWSA), which requires reductions of GHGs by 2020, and further reductions by 2050, relative to 1990 baseline conditions. To meet GWSA requirements, the MPO works with MassDOT and other stakeholders to anticipate the GHG impacts of projects included in the TIP, specifically by examining additions or reductions in carbon dioxide (CO2). More details on the MPO’s GHG tracking and evaluation processes are included in Appendix B of the FFYs 2019–23 TIP document.
Transportation projects may also help reduce other air quality pollutants and precursors and can support reductions in CO2, volatile organic compounds (VOCs), nitrogen oxides (NOx) and carbon monoxide (CO) by improving traffic flow and bicycle and pedestrian travel. The Boston Region MPO contains a maintenance area for CO in Waltham, and is required to track VOCs and NOx to meet EPA requirements. (More detailed information about the MPO’s air quality status and related requirements is available in Chapter 5 in the FFYs 2019–23 TIP document.) The MPO tracks the air quality benefits of transportation projects to identify projects that may be eligible for CMAQ funds. FHWA also requires the Boston Region MPO to produce a CMAQ Performance Plan, which includes performance targets for both the annual PHED per capita and share of non-SOV travel measures described in the previous section. This plan includes targets for the amount of emissions the MPO expects will be reduced because of CMAQ-funded projects in the region. As part of its CMAQ Performance Plans, the MPO must note how it expects its CMAQ-funded projects to support improvements in these performance measures, which reinforces the connection between planning, investments, and expected performance outcomes.
The federally required CMAQ emissions reduction measure is the total emissions reduction for applicable pollutants and precursors for CMAQ-funded projects in designated nonattainment and maintenance areas. FHWA requires states and MPOs subject to these CMAQ performance management requirements to establish a baseline for this measure by identifying emissions reductions associated with any CMAQ-funded projects programmed in air quality nonattainment or maintenance areas between FFY 2014 and FFY 2017. These states and MPOs were also required to set two-year and four-year targets for the emissions reductions expected from CMAQ-funded projects programmed in nonattainment or maintenance areas.
In the Boston Region MPO’s case, this CMAQ emissions performance measure would capture the anticipated carbon monoxide emissions reductions from any CMAQ-funded projects that the MPO has programmed specifically in the carbon monoxide maintenance area in Waltham.23 Table 21 shows the Boston Region MPO’s baseline and target values for this measure. Neither the MPO nor MassDOT programmed any CMAQ-funded projects in Waltham during FFYs 2014 to 2017, and at the time of target setting, the MPO’s TIP did not reflect any CMAQ-funded projects programmed in Waltham from FFY 2018 to 2021. Neither the FFYs 2019–23 TIP nor its adopted or proposed amendments include any CMAQ-funded projects in Waltham.
Table 21
Boston Region MPO CMAQ Emissions Reduction Baseline and Performance Targets
Performance Measure |
FFYs 2014–17 Measure Value (Baseline) |
Two-Year Target |
Four-Year Target |
Daily kilograms of CO emissions reduction from CMAQ projects in Boston region nonattainment or maintenance areas |
0 |
0 |
0 |
CMAQ = Congestion Mitigation and Air Quality. CO = carbon monoxide. FFY = federal fiscal year. MPO = Metropolitan Planning Organization.
Source: Boston Region MPO.
The MPO uses evaluation criteria to assess the projected transportation-related emissions of each project that is a candidate for Regional Target funding, both for CO2 and other air quality pollutants and precursors, among other environmental considerations. Transportation projects can support reductions in CO2, volatile organize compounds, nitrogen oxides and carbon monoxide by improving traffic flow and bicycle and pedestrian travel. Table 22 displays the CO2 and other emissions reductions the MPO expects from projects it has programmed using its Regional Target funds. MPO staff estimates emissions for projects using MassDOT’s air quality analysis worksheets for each project type and the Environmental Protection Agency’s MObile Source Emission Simulator (MOVES) emission factors.
Table 22
Regional Target-Funded Roadway Project Metrics Related to
Clean Air/Clean Communities Performance
Metric |
Value |
Annual kilograms of CO2 reduced |
1,3724,400 kilograms |
Annual kilograms of other emissions (VOCs, NOx, and CO) reduced |
22,200 kilograms |
Note: The group of projects reflected in this table does not include the Green Line Extension, Community Transportation/Parking/Clean Air and Mobility investments, or Middlesex 3 TMA support. It also excludes the two Major Infrastructure roadway projects that were included in the air quality modeling results in Charting Progress to 2040: Project 604996–Bridge Replacement on New Boston Street in Woburn and Project 606226–Reconstruction of Rutherford Avenue in Boston. These aggregate estimates is based on projected future conditions for project locations and has been rounded to the nearest hundred.
CO = carbon monoxide. CO2 = carbon dioxide. MPO = Metropolitan Planning Organization.NOx = nitrogen oxide. VOCs = Volatile organic compounds.
Source: Boston Region MPO.
MassDOT, MBTA, and RTA projects and programs also support improvements to air quality and the environment. Appendix B of the FFYs 2019–23 TIP document provides more detailed information and assessments of the GHG impacts of MassDOT, MBTA, CATA, and MWRTA projects and programs. MassDOT maintains an independent statewide CMAQ Performance Plan and tracks the relationship between its projects and its CMAQ emissions reduction performance targets.
MPO staff requests that the MPO board approve this performance addendum to the FFYs 2019–23 TIP document for inclusion in the draft FFYs 2019–23 TIP Amendment 3 that will be released for public review and comment. Staff also requests that this addendum be included in the final FFYs 2019–23 TIP Amendment 3 adopted by the MPO board. Upon final endorsement of Amendment 3 by the MPO board, this addendum would be considered part of the MPO’s FFYS 2019–23 TIP document and support any future FFYs 2019–23 TIP amendment reviews by FHWA and FTA.
1Title 23 Code of Federal Regulations (CFR) 450.324(f)
2 23 CFR 450.326(d)
3These goal area titles are for the goals included in the MPO’s active LRTP, Charting Progress to 2040.
4 Massachusetts Strategic Highway Safety Plan, 2018, pg. I, available at https://www.mass.gov/files/documents/2019/01/18/dot_SHSP_2018.pdf
5 MassDOT defines serious injuries as incapacitating injuries, which it identifies through incident reporting by police and vehicle operators using the Commonwealth of Massachusetts Motor Vehicle Crash Operator Report.
6 For more information, see MassDOT, 2015 Top Crash Location Report, March 2018,
https://www.mass.gov/files/documents/2018/05/31/15TopCrashLocationsRpt.pdf, pg. 4-5.
7 MassDOT’s TAMP is scheduled to be finalized in July 2019.
8 These 2018 values are based on bridge inventory data provided by MassDOT on December 31, 2018. Multiple bridge structures may serve a particular crossing.
9 National Bridge Inventory data is used to rate these components on a scale of zero (worst) to nine (best). The FHWA has classified these bridge ratings into good (seven, eight, or nine on the scale), fair (five or six), or poor (four or less).
10 Culverts are assigned an overall condition rating.
11 This data is based on city-or-town-accepted lane mileage as reflected in the 2017 MassDOT Roadway Inventory file.
12 MassDOT continues to measure pavement quality and to set statewide short-term and long-term targets in the MassDOT Performance Management Tracker using the Pavement Serviceability Index (PSI), which is a different index than IRI.
13 According to the MPO’s TIP criteria, pavement is considered to be in good condition if its IRI rating is 190 or less, in fair condition if its IRI rating is 190 to 320, and in poor condition if its IRI rating is greater than 320. These thresholds differ from the IRI thresholds that FHWA has set for National Highway System pavement performance monitoring (good if IRI is 95 or less, fair if IRI is 95 to 170, and poor if IRI is greater than 170).
14 CATA used useful life criteria as defined in FTA Circular 5010.1E (Award Management Requirements) for ULB values. MWRTA used useful life criteria as defined in MassDOT’s Fully Accessible Vehicle Guide and in FTA Circular 5010.1E for ULB values.
15 States and MPOs must calculate LOTTR values for four time periods: weekdays from 6:00 AM to 10:00 AM, weekdays from 10:00 AM to 4:00 PM, weekdays from 4:00 PM to 8:00 PM, and weekend days from 6:00 AM to 8:00 PM.
16 FHWA, “Frequently Asked Questions: Target Setting,” https://www.fhwa.dot.gov/tpm/faq.cfm#targ, accessed September 14, 2018.
17 States and MPOs must calculate TTTR Index Values for five time periods: weekdays from 6:00 AM to 10:00 AM, weekdays from 10:00 AM to 4:00 PM, weekdays from 4:00 PM to 8:00 PM, and weekend days from 6:00 AM to 8:00 PM, and all days from 8:00 PM to 6:00 AM.
18 A precursor is a chemical compound that reacts with other chemical compounds in the presence of solar radiation to form pollutants.
19 FHWA requires state DOTs and MPOs to use 60 percent of the posted speed limit for the segment or 20 miles per hour, whichever is greater.
20 FHWA requires states and MPOs to use the period from 6:00 AM to 10:00 AM to represent the morning peak period, but allows these agencies to choose either 3:00 PM to 7:00 PM or 4:00 PM to 8:00 PM to represent the evening peak period. MassDOT and NH DOT selected the period from 3:00 PM to 7:00 PM to represent the evening peak period for the Boston UZA.
21 Rhode Island was not included in the calculation of this measure because it does not include any portion of the Boston UZA’s NHS network. See FHWA’s Applicability Determination:
CMAQ Traffic Congestion and CMAQ On-Road Mobile Source Emissions Measures (23 CFR
490.707 and 490.807), and Change Log: Applicability Determination for CMAQ Measures,” May 22, 2018.
22 US American Community Survey, “Commuting Characteristics by Sex,” American Community Survey Five-Year Estimates, https://factfinder.census.gov/faces/tableservices/jsf/pages/productview.xhtml?pid=ACS_16_5YR_S0801&prodType=table, accessed September 2, 2018.
FHWA allows States and MPOs to measure non-SOV travel using US Census American Community Survey estimates of the percentage of workers who commute to work using modes other than driving alone (such as taking a carpool, vanpool, or public transit; bicycling; walking; or telecommuting); travel surveys that reveal mode choices; or sample or continuous counts of travelers using different modes.
23FHWA assesses the CMAQ performance management requirements that apply to states and MPOs every two years. FHWA conducted its most recent assessment in August 2017, at which time the MPO was only subject to emissions performance management requirements for its carbon monoxide maintenance area in Waltham. FHWA will conduct its next assessment by October 1, 2019, after which the MPO may be subject to requirements for other pollutants or precursors.