mEMORANDUM
Date May 1, 2014
To Congestion Management Committee
From Hiral Gandhi and Ryan Hicks
MPO Staff
Re 2012 Inventory of Bicycle Parking Spaces and Number of Parked Bicycles at MBTA Stations
The purpose of this memo is to present the results of the 2012 inventory of bicycle parking spaces and the numbers of parked bicycles at Massachusetts Bay Transportation Authority (MBTA) commuter rail stations, commuter boat terminals, and rapid transit stations, including surface rapid transit stations and some bus stops. (For the purposes of this memo, the term "stations" includes bus stops.) This periodic monitoring is part of the Congestion Management Process (CMP), which is carried out in accordance with federal regulations to help determine the Boston region’s transportation investments.
MPO staff inventoried MBTA and municipal bicycle racks at each of the 134 rapid transit stations, 122 commuter rail stations, and six commuter boat terminals in the MBTA’s system, and at three of the major bus stops. Overall, when staff compared the results of the 2009–11 inventory to those of the 2012 inventory, they noted a 48 percent increase in parked bicycles and a 30 percent increase in parking spaces. As discussed later in this memo, the factors contributing to the increase include seasonal variations, the construction of additional bicycle cages since the earlier inventory, and surveying stations that had not been monitored in the earlier inventory.
The CMP is an ongoing MPO program for collecting and gathering performance data about the region’s transportation systems. As part of the CMP, data are analyzed, and the results of the analysis are used to provide planners and MPO members with tools to help prioritize transportation projects and to program funds. For example, this inventory of bicycle racks could be used to help determine the number and type of bicycle racks needed at each station. Some stations may need additional bicycle racks, while others may need to have a bicycle cage installed. For other stations, additional surveys may need to be conducted to identify the key users of the bicycle racks.
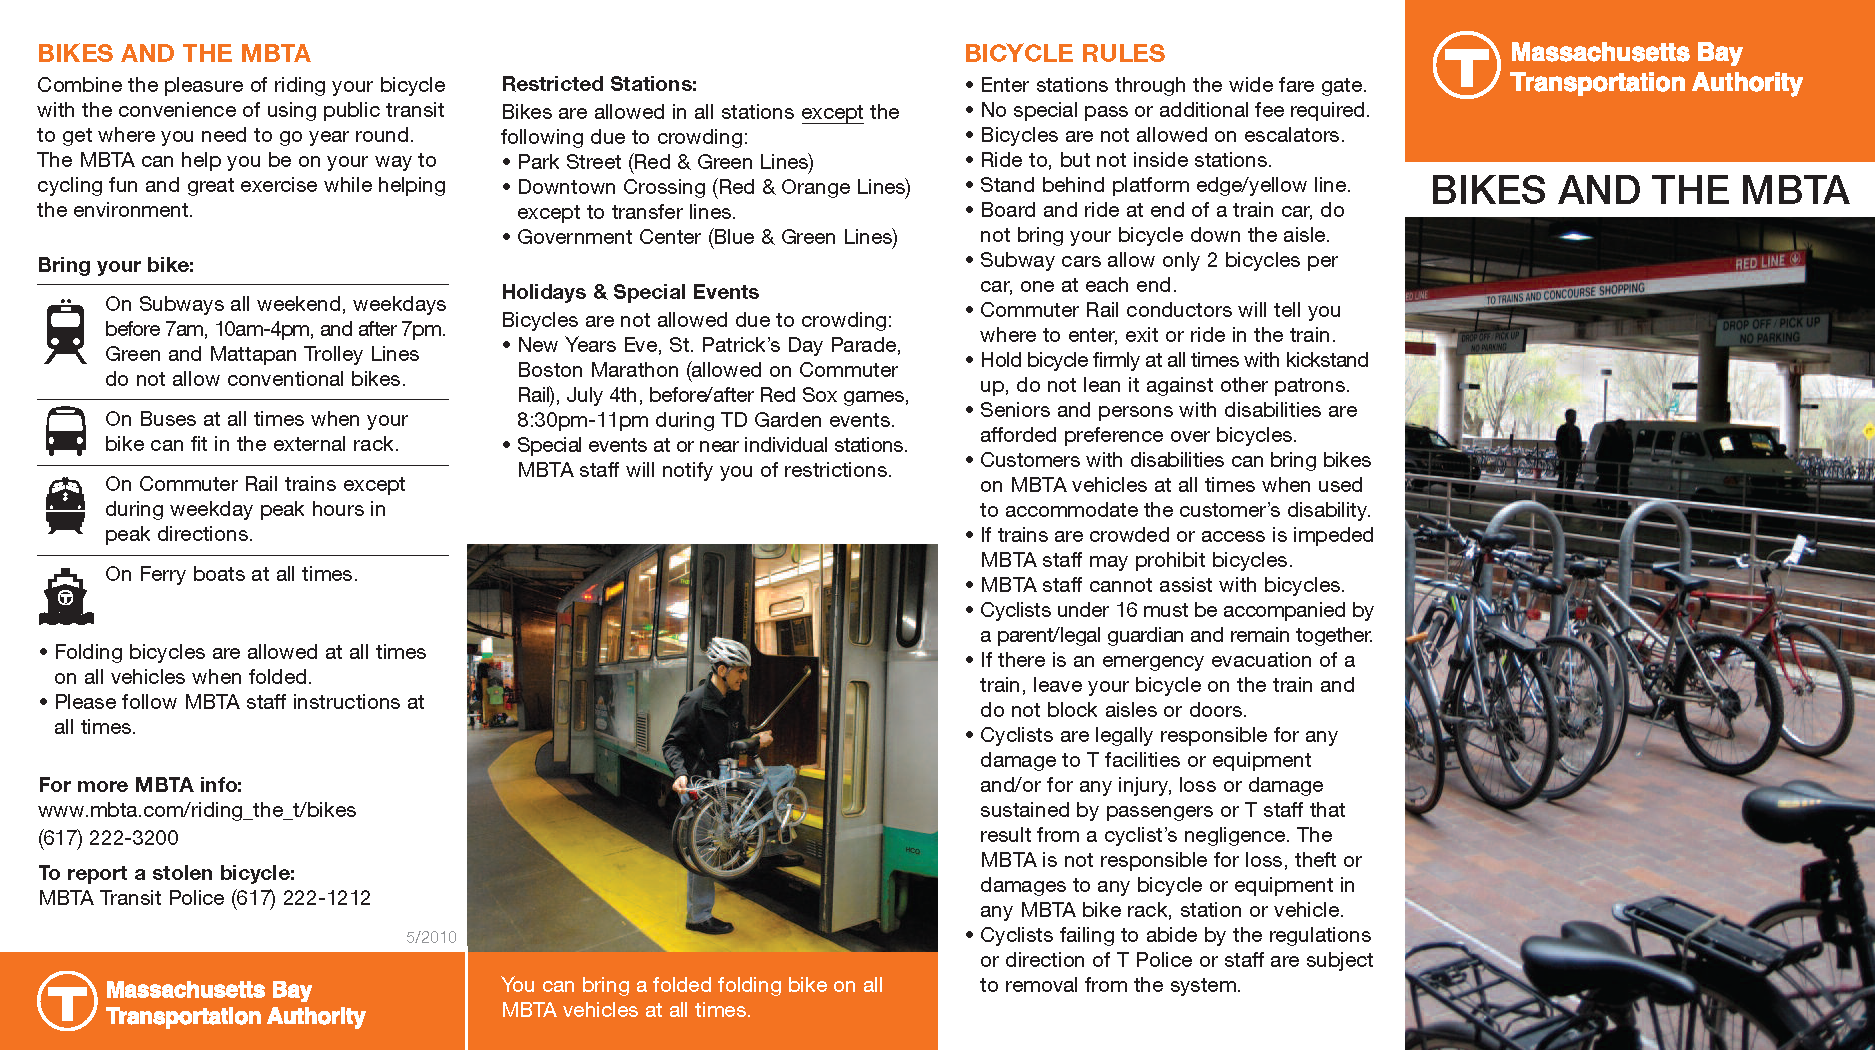
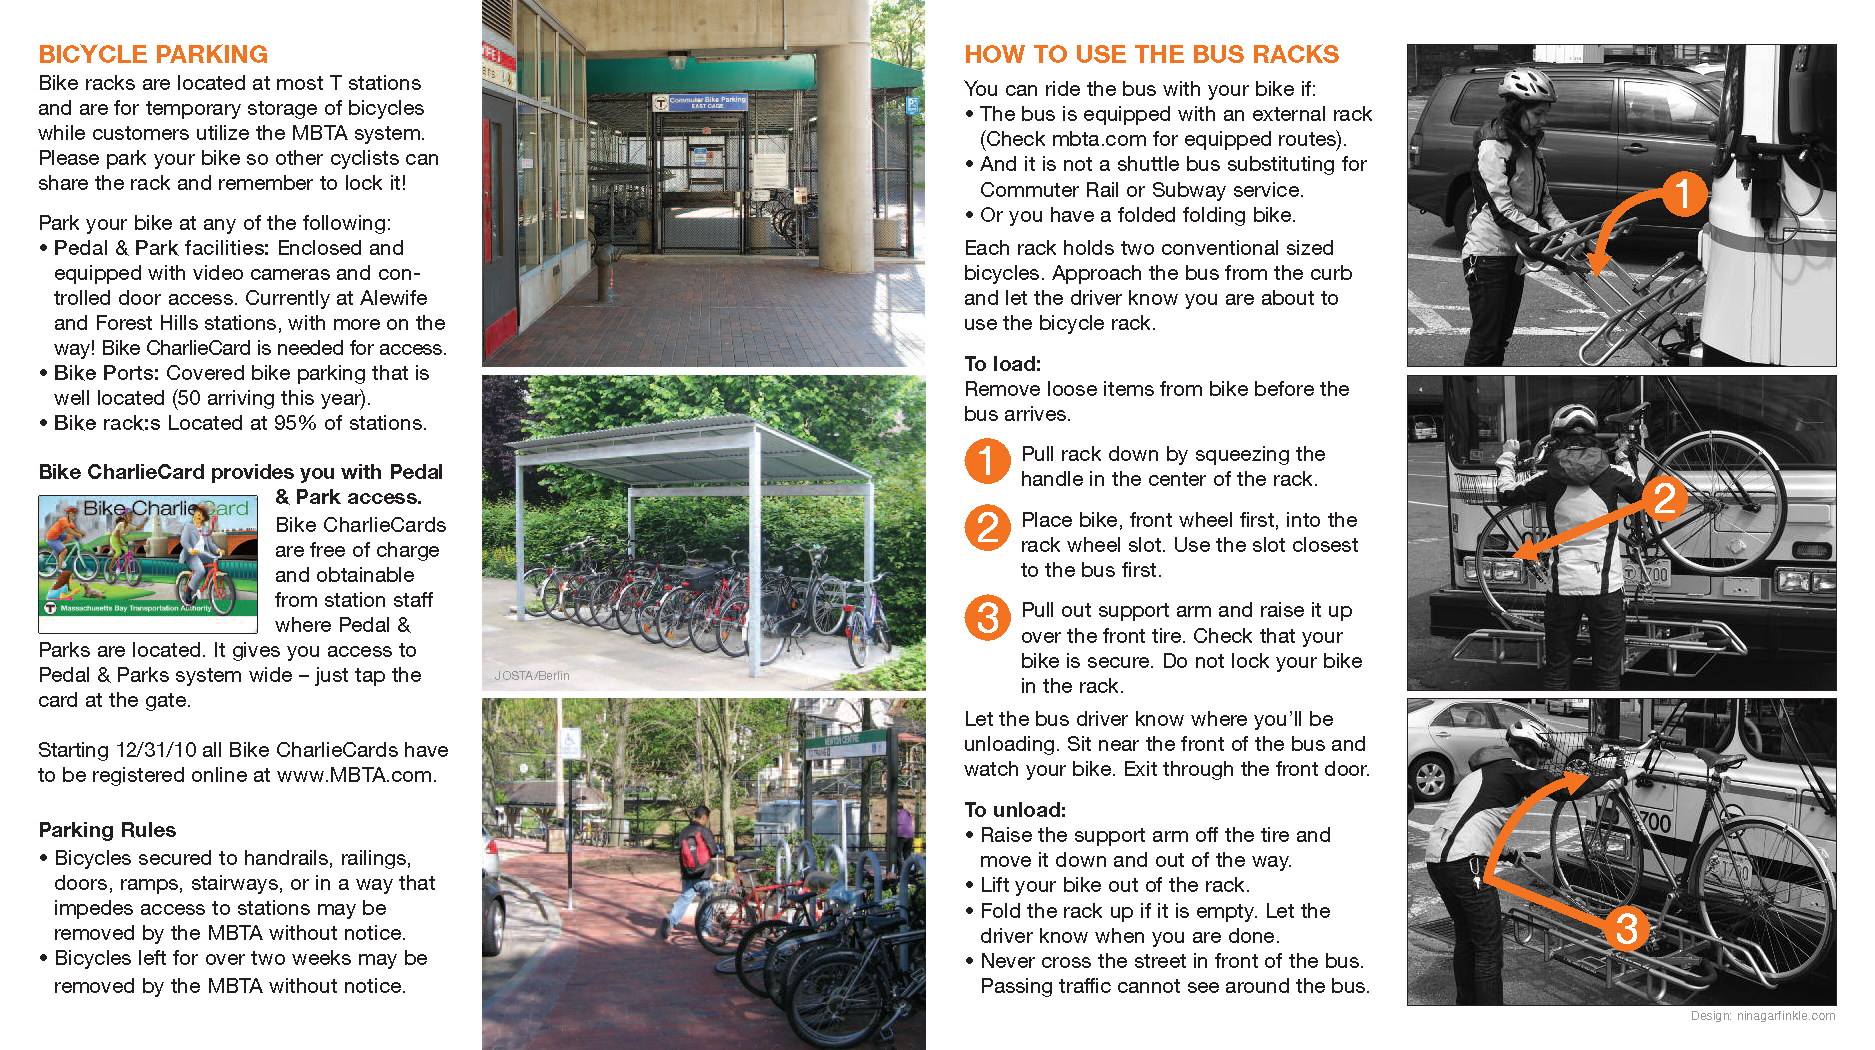
While bicycle racks at transit stations allow users to use their bicycles at one end of a transit trip, bicycle racks on buses allow customers to use their bicycles at both ends of a trip. The MBTA began the process of outfitting their bus fleet with bicycle racks in 2006 and made significant strides with the help of a grant in 2010 through the MPO’s Clean Air and Mobility Program. As of December 2012, 95 percent of the MBTA’s bus fleet had been equipped with bicycle racks; buses that use overhead electrical lines were not included with racks because of safety concerns1.
The MBTA has also been expanding bicycle access to rapid transit vehicles. Its Blue Line Pilot Program became permanent in December of 2012. The purpose of this program is to expand bicycle connections between East Boston and downtown Boston, which are separated by Boston Harbor. The program adds an hour of bicycle access on the Blue Line in the peak direction and eliminates the restrictions entirely in the nonpeak direction.
For information about the MBTA’s rules for parking bicycles and bringing bicycles on MBTA vehicles, please see Appendix C, “Bikes and the MBTA,” a pamphlet that was published by the MBTA in May 2010. However, the MBTA’s website has the most up‑to‑date information (mbta.com/riding_the_t/bikes/).
In 2009, the MBTA was awarded federal stimulus funds to improve bicycle facilities. By the fall of 2013, the MBTA will have installed 14 Pedal & Park bicycle cages at selected stations using this funding, and an additional cage is expected to open in 2014. The MBTA was expected to also use this funding to install 50 bicycle ports and canopies (sheltered bicycle parking) at selected locations by October 2013. See Table A2.2 in Appendix A for a detailed list of the stations that will be or have been equipped with these amenities. Some Pedal & Park facilities and bicycle ports and canopies were being installed during the time this inventory was conducted, in 2012.
Inventories were conducted on typical fair-weather weekdays from July through October 2012. Commuter rail stations were inventoried during the summer months, while rapid transit stations were inventoried in the fall to account for student activity near the colleges. A nearly identical methodology was used to conduct inventories in 2005–06 and in 2009–11. These data were compared to the current data and are presented in the tables in Appendix A.
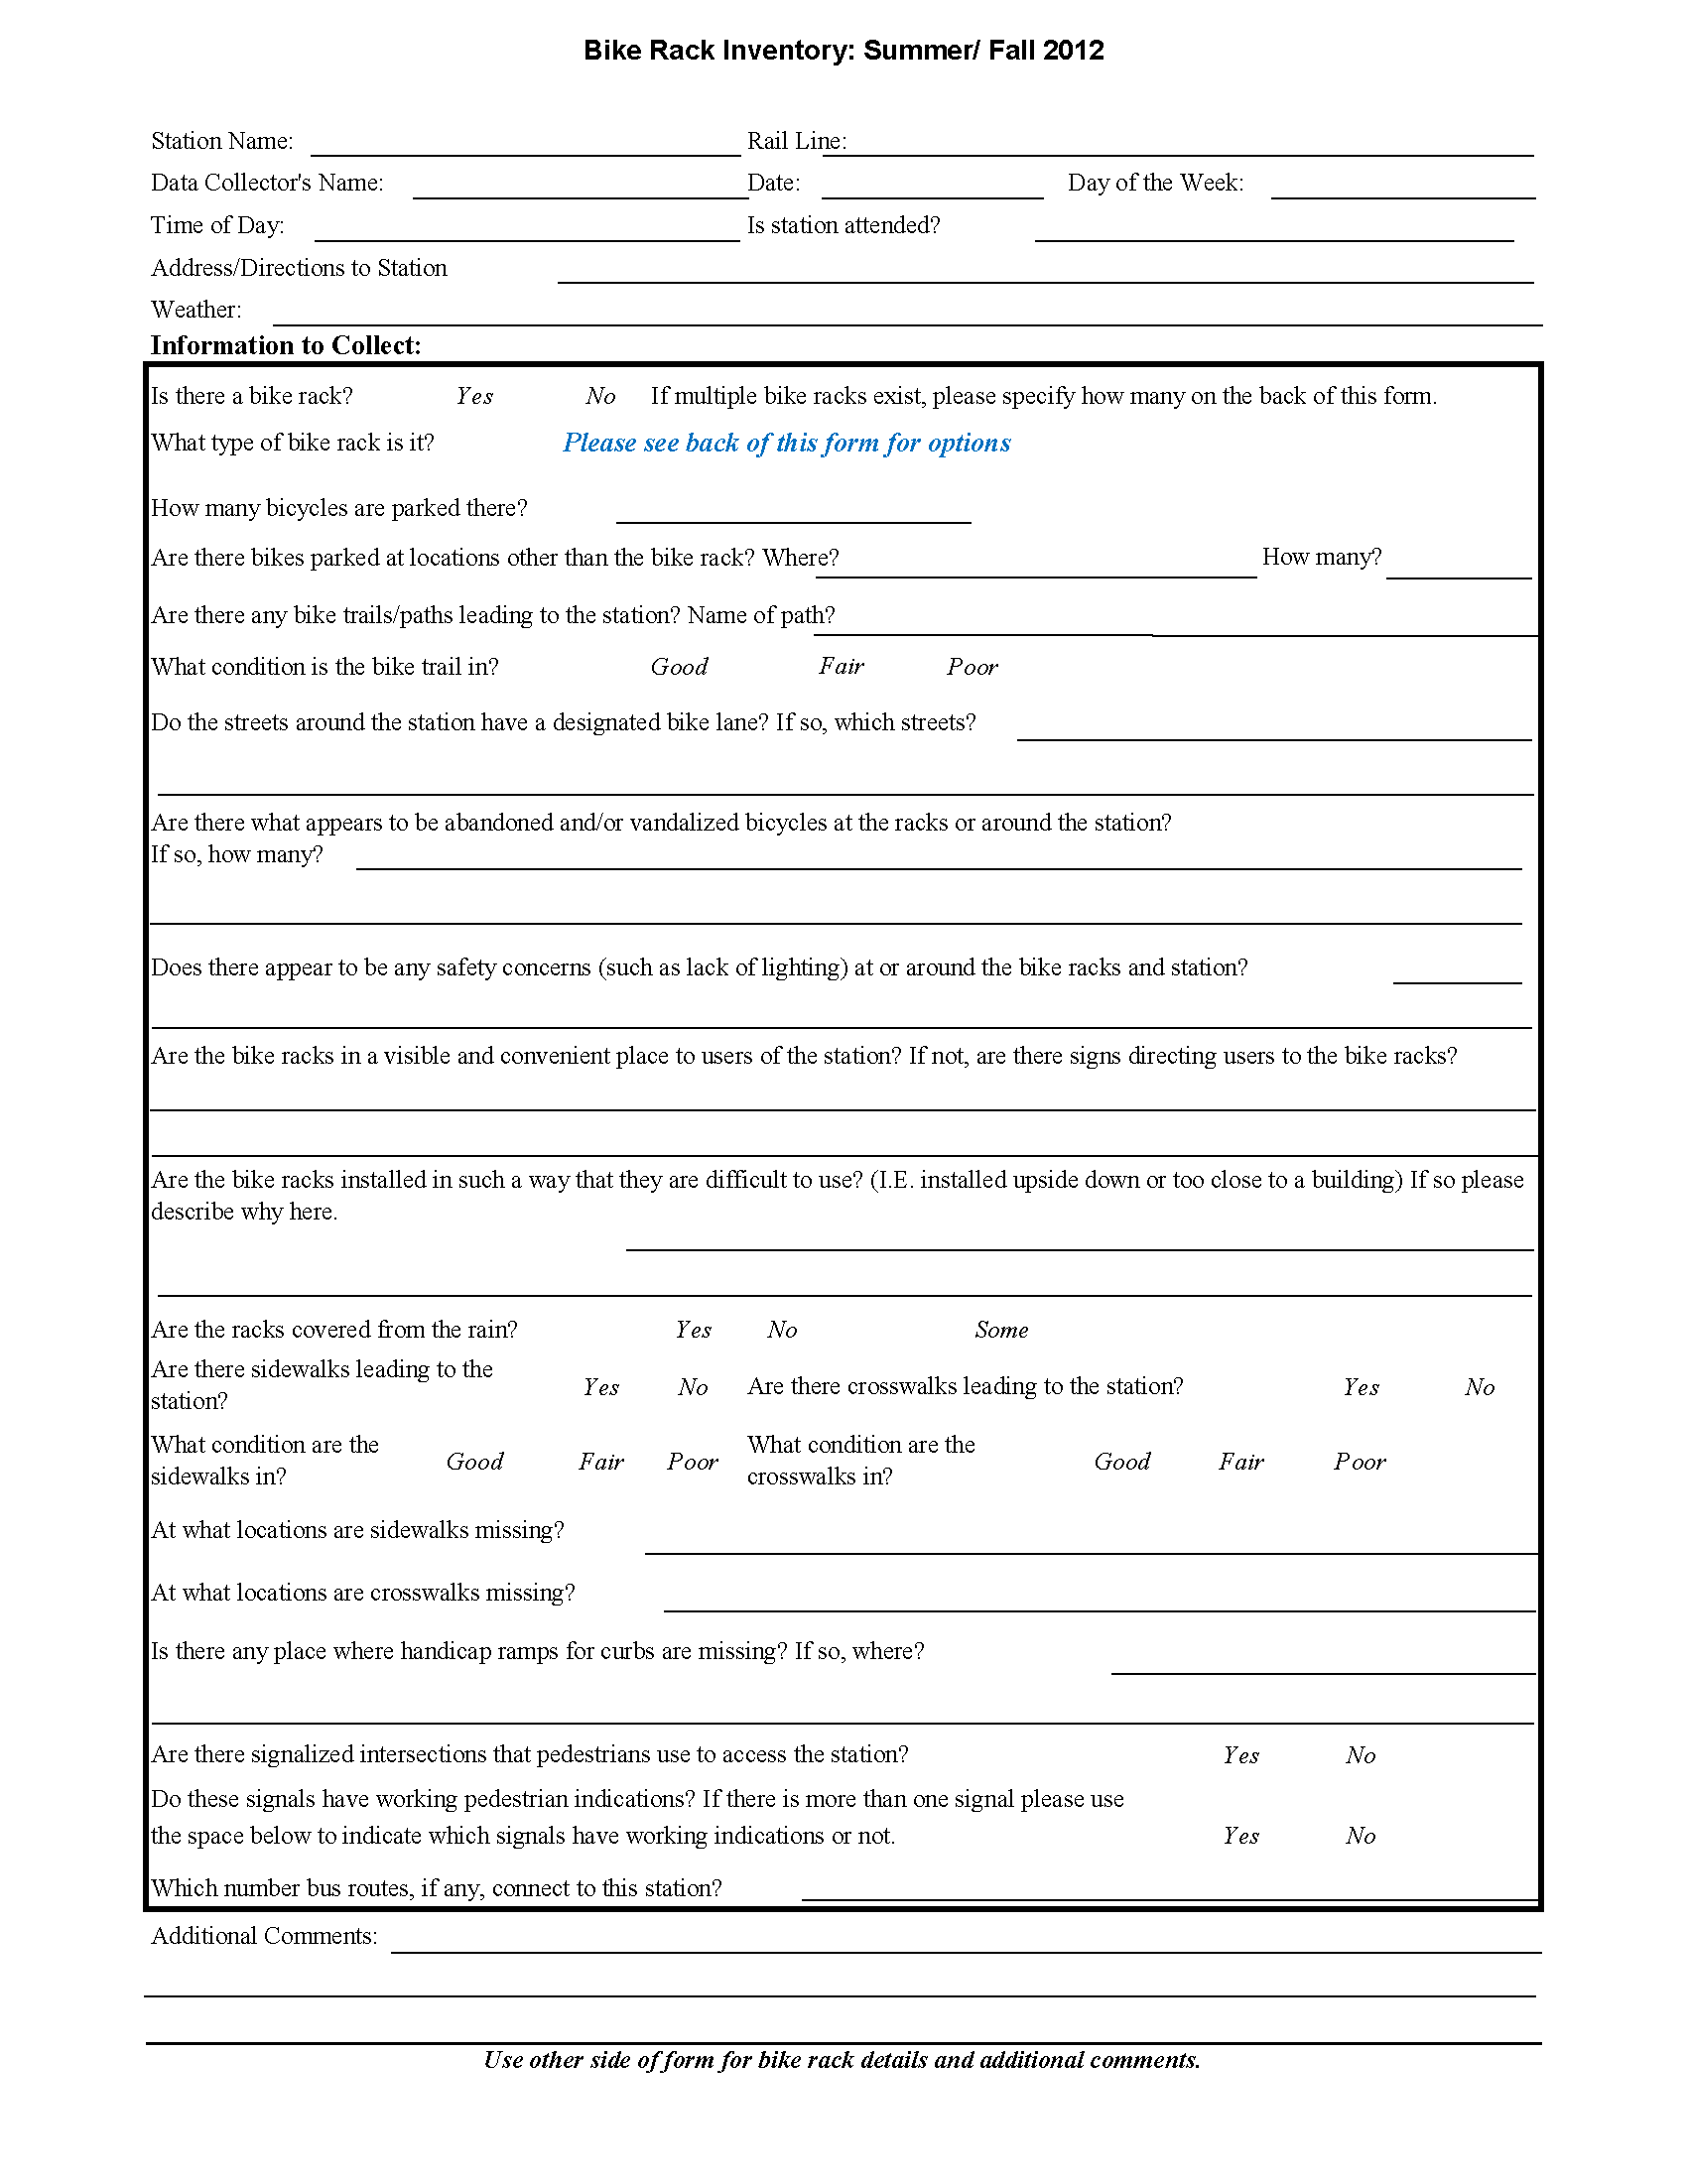
In general, MPO staff inventoried each station once. Data were collected using the survey form shown in Appendix B. The number, location, and condition of bicycle racks were recorded, as well as the number of bicycles parked in the racks and elsewhere at the station. Data on amenities and other characteristics of the station and its vicinity were also collected, including lighting, security, and the presence or absence of bicycle paths (trails) and bicycle lanes near the station.
At many of the MBTA stations that lack bicycle parking, there are bicycle racks near the station on municipal property or along the sidewalks. These bicycle racks were included in the inventory if there was no bicycle parking at the nearby transit station or if it appeared likely that the municipal bicycle racks would be convenient for transit riders. If bicycle racks were located nearby but were very inconvenient for transit riders, they were not included in the inventory.
The observed utilization of the bicycle racks is assumed to be typical for the station. Detailed observations over time—an effort beyond the scope of this project—would be necessary to gather a more accurate bicycle rack utilization percentage because of the fluctuation of weather and work schedules, among other factors.
The total number of bicycle parking spaces on rapid transit lines increased by 39 percent between the 2009–11 and the 2012 inventories, during which time there was a 51 percent increase in the number of bicycles parked at rapid transit stations. This led to an increase in the bicycle parking space utilization rate, from 43 percent in the 2009–11 inventory to 47 percent in the 2012 inventory. Table 1 shows the number of bicycles parked, the number of bicycle parking spaces, and the percentage of bicycle parking space utilization in the rapid transit system, by line, for the two inventory periods.
In Table 1, bicycle racks located at transfer stations (stations serving more than one line) were included in the data for all of the lines at a given station. For example, if there were 12 bicycle parking spaces at Downtown Crossing, those 12 spaces were included in the total for “Red Line” and in the total for “Orange Line.” For the stations that serve more than one line, the total number of bike racks at the station is used for each line at that station. However, the total is the actual number of bicycle spaces at the stations, not a summation of the "duplicate" numbers used for the lines serving that station.
At an individual station, the number of parking spaces may differ between the two surveys for a variety of reasons: because the number of parking spaces changed, because the parking spaces were counted differently, or because field staff did not find all of the parking during one of the inventories. While the number of bicycle parking spaces is mostly independent of seasonal variation, the number of parked bicycles does vary seasonally; therefore most of the data for the 2012 inventory were collected in fairly favorable bicycling weather, in the summer and fall. A cursory inspection of the previous inventories indicates that most of the data were collected during the same time of year and under similar conditions as in the 2012 inventory.
TABLE 1
Bicycle Parking Inventory and Percentage of Spaces Utilized:
Rapid Transit Stations
Line and Branch |
2009–11 Bicycles Parked |
2009–11 Parking Spaces |
2009–11 Percent Utilization |
2012 Bicycles Parked |
2012 Parking Spaces |
2012 Percent Utilization |
|---|---|---|---|---|---|---|
Red Line |
773 |
1,202 |
45 |
1,004 |
1,553 |
65 |
Mattapan High-Speed Line |
2 |
75 |
3 |
5 |
90 |
6 |
Blue Line |
72 |
240 |
30 |
92 |
409 |
22 |
Orange Line |
219 |
700 |
31 |
374 |
941 |
40 |
Green Line Subway |
58 |
142 |
41 |
82 |
207 |
40 |
Green Line B Branch |
34 |
91 |
37 |
145 |
224 |
65 |
Green Line C Branch |
20 |
137 |
15 |
34 |
187 |
18 |
Green Line D Branch |
71 |
191 |
37 |
95 |
207 |
46 |
Green Line E Branch |
12 |
51 |
24 |
17 |
45 |
38 |
Silver Line Washington Street |
25 |
118 |
21 |
37 |
125 |
30 |
Silver Line Waterfront |
28 |
115 |
24 |
77 |
230 |
33 |
Total |
1,223 |
2,830 |
43% |
1,841 |
3,929 |
47% |
Notes: “Bicycles Parked” and “Percent Utilization” do not include bicycles locked to objects other than bicycle racks. “Percent Utilization” is the percentage of the bicycle rack spaces filled by bicycles. For stations that serve more than one line, the total number of bike racks at the station is used for each line at that station. However, the grand total is the actual number of bicycle spaces at the station, not a summation of the "duplicate" numbers used for the lines serving that station.
Of the rapid transit stations that had bicycle racks in the previous inventory (2009–11), the Green Line B Branch had the greatest percentage increase in bicycle parking spaces, from 91 to 224 spaces in 2012. The Red Line had the largest absolute gain in the number of spaces, with 351 spaces added; this is attributable to the installation of new Pedal & Park bike cages at some Red Line stations that had been installed just before the 2012 inventory. The number of bicycle parking spaces on the Blue, Orange, and Red lines increased by 70 percent, 34 percent, and 29 percent, respectively.
The Red Line had the greatest number of bicycles parked at bicycle racks in both the 2009–11 and 2012 inventories. This is due in part to the high number of bicycles parked at racks at Alewife and Davis stations, and to a lesser extent, at Central Station. Alewife and Davis stations are both located on heavily traveled bicycle and pedestrian paths and have a large number of bicycle parking spaces to accommodate the demand. However, all of the rapid transit lines saw a substantial increase in the number of bicycles parked at racks. Nearly 150 more bicycles were observed at Orange Line stations, and more than 200 more bicycles were observed at Red Line stations.
Chinatown, Hynes Convention, BU Central, and Chestnut Hill stations were at 100 percent of their capacity during the 2012 inventory. Kendall/MIT and Sullivan Square stations each had 117 percent utilization. At these two stations, bicyclists were able to fit more bicycles on racks than the racks were intended to store. It was observed that people attach their bicycles to signs, benches, railings, and trees once the bicycle racks are full.
The Red Line and Green Line B Branch were the only lines observed during the 2012 inventory to have more than 100 bicycles parked in areas other than the bicycle racks provided at the time of observation. This may be an indication that the existing racks are not located in areas that are perceived as safe; the racks are located in an inconvenient location; or the rack utilization is at, near, or exceeding the design capacity. This can also indicate that local retail shops and other commercial establishments need to provide additional bicycle racks for their patrons. For example, at Central and Harvard stations, many of the bicycles were parked at places such as trees, sign posts, and meters. A secondary survey could determine the destination of the bicycle riders, whether it is an MBTA service or a nearby commercial establishment. The survey would help determine who would be responsible for installing additional racks.
Thirty of the 134 rapid transit stations observed in the most recent inventory did not have bicycle racks. Those stations are listed below.
Red Line
Mattapan High-Speed Line
Blue Line
Green Line Subway
Green Line B Branch
Green Line C Branch
Green Line D Branch
Green Line E Branch
Silver Line Washington Street (SL4 and SL5)
Silver Line Waterfront (SL1 and SL2)
Seventy-eight percent of the 134 stations in the rapid transit system had bicycle racks when the 2012 survey was conducted. See Table A1.1 in Appendix A for rapid-transit, station-specific data on bicycle parking and utilization. Table A1.1 also indicates the number of bicycles that were locked to objects other than bicycle racks (such as poles, trees, and railings) at each station.
The total number of bicycle parking spaces in the commuter rail system increased by 12 percent from the 2009–11 inventory to the 2012 inventory, and the utilization rate increased from 20 percent to 25 percent. Table 2 shows the number of bicycle parking spaces in the commuter rail system, by line, for the two inventory periods, the number of bicycles parked, and the percentage of bicycle parking space utilization for each inventory period.
TABLE 2
Bicycle Parking Inventory and Percentage of Spaces Utilized:
Commuter Rail Stations
| Commuter Rail Line |
2009–11 Bicycles Parked |
2009–11 Parking Spaces |
2009–11 Percent Utilization |
2012 Bicycles Parked |
2012 Parking Spaces |
2012 Percent Utilization |
|---|---|---|---|---|---|---|
North Side |
blank |
blank |
blank |
blank |
blank |
blank |
Newburyport/Rockport Line |
43 |
230 |
19 |
90 |
272 |
33 |
Haverhill Line |
38 |
232 |
16 |
36 |
244 |
15 |
Lowell Line |
48 |
153 |
31 |
61 |
137 |
45 |
Fitchburg Line |
49 |
205 |
24 |
90 |
260 |
35 |
Framingham/Worcester Line |
35 |
224 |
16 |
74 |
272 |
27 |
North Side total |
213 |
1,044 |
20% |
351 |
1,185 |
30% |
South Side |
blank |
blank |
blank |
blank |
blank |
blank |
Needham Line |
20 |
101 |
20 |
16 |
104 |
15 |
Franklin Line |
21 |
163 |
13 |
25 |
162 |
15 |
Fairmount Line |
3 |
76 |
4 |
1 |
84 |
1 |
Providence/Stoughton Line |
71 |
296 |
24 |
81 |
309 |
26 |
Middleborough/Lakeville Line |
17 |
79 |
22 |
12 |
81 |
15 |
Kingston/Plymouth Line |
8 |
79 |
10 |
19 |
84 |
23 |
Greenbush Line |
18 |
57 |
32 |
25 |
109 |
23 |
South Side total |
57 |
805 |
19% |
176 |
891 |
20% |
Grand total |
370 |
1,849 |
20% |
527 |
2076 |
25% |
Notes: “Bicycles parked” and “Percent Utilization” do not include bicycles locked to objects other than bicycle racks. “Percent Utilization” is the percentage of the bicycle rack spaces filled by bicycles. As in Table 1, duplicate numbers of bicycles and racks are included at stations that serve more than one line. However, in each of the totals, these spaces are counted only once.
Ninety-seven percent of the stations in the commuter rail system have bicycle racks. One new station was added to the 2012 inventory: Wickford Junction, on the Providence Line. This station has 22 bicycle spaces, with one bicycle parked there at the time of observation. See Table A2.1, in Appendix A, for commuter rail station-specific data on bicycle parking and utilization. Table A2.1 also indicates the number of bicycles locked to objects other than bicycle racks (for example, poles, trees, or railings) at each station.
Except for the Lowell and Franklin lines, the number of bicycle parking spaces had increased on every commuter rail line after the 2009–11 inventory. The decrease in the number of bicycle parking spaces on the Lowell Line is due to the removal of bicycle racks at North Billerica and West Medford stations. The greatest percentage increase was on the Greenbush Line, which increased from 57 spaces in 2009–11 to 109 spaces in the more recent inventory.
The Newburyport/Rockport and Fitchburg lines had the highest number of parked bicycles, with 90 bicycles parked at the racks for each line. The Lowell Line had the highest bicycle rack utilization, with 45 percent of bicycle rack spaces occupied. The Fairmount Line had the lowest bicycle rack utilization, with 1 percent. In all, 23 of the commuter rail stations that had racks were observed to have no parked bicycles. In the most recent inventory (2012), 5 of the 122 commuter rail stations observed did not have bicycle racks. These stations are:
During the 2012 inventory, staff observed 139 bicycles locked to objects other than the bicycle racks provided at the commuter rail stations. Newburyport, Hamilton/Wenham, Swampscott, Natick, and Providence stations each had 10 or more bicycles locked to objects other than bicycle racks. This may be an indication that the existing racks are not located in areas that are perceived as safe; the racks are located in an inconvenient location; or the rack utilization is at, near, or exceeding the design capacity.
The utilization of bicycle racks at selected major bus stops increased from 71 percent during the 2009–11 inventory to 75 percent in the 2012 inventory.3 All six of the MBTA’s commuter boat facilities were monitored in the 2012 inventory. Bicycle parking utilization at those locations in the most recent inventory was relatively low, at 14 percent. The number of bicycles parked at the terminal in Hingham remained the same, while the number of parking spaces increased. Table 3 shows the number of bicycles parked, the number of bicycle parking spaces, and the percentage of bicycle parking space utilization at the commuter boat terminals and major bus stops for the two most recent inventory periods. Please see Table A3.1, in Appendix A, for more detailed information on these locations.
The Hingham commuter boat terminal has racks that accommodate 24 bicycles, and in the 2012 inventory, 9 were parked there. During the 2009–11 inventory, the Fore River Shipyard Ferry Terminal, in Quincy, had no bicycle racks, but by the 2012 inventory it had received one new bicycle rack, with eight spaces; one bicycle was parked at the rack. The Charlestown Navy Yard commuter boat terminal also acquired new bicycle racks, increasing its capacity from 2 to 28 spaces. Bicycles are allowed on MBTA commuter boats at all times, making it a viable option for bicyclists to bring bicycles on the boat and lock or ride them upon arrival at their destination.
TABLE 3
Bicycle Parking Inventory and Percentage of Spaces Utilized:
Commuter Boat Terminals and Major Bus Stops
Transit Mode |
2009–11 Bicycles Parked |
2009–11 Parking Spaces |
2009–11 Percent Utilization |
2012 Bicycles Parked |
2012 Parking Spaces |
2012 Percent Utilization |
|---|---|---|---|---|---|---|
Commuter boat |
11 |
26 |
42% |
10 |
70 |
14% |
Major bus stops |
12 |
17 |
71% |
12 |
16 |
75% |
In the 2012 inventory, the two Boston boat terminals were examined, as had been done in the previous inventory. Neither Rowe’s Wharf nor Long Wharf had any bicycle parking. Bicyclists could park their bicycles at Aquarium Station, but this is not the most convenient place to park. Installing a few bicycle parking spaces near the dock would give people a better place to park.
Watertown Yard (park-and-ride lot), Watertown Square, and the Woburn park-and-ride lot were the only major bus stops monitored in the 2012 inventory. Watertown Yard had four spaces with two bicycles parked in those spaces; seven bicycles were parked near the bus shelter (which is several hundred feet away from the rack). Installing sheltered parking closer to the bus shelter, or adding signs directing bicyclists to the rack, would encourage more bicyclists to use access bus service here. Watertown Square had 12 spaces, and 10 parked bicycles were observed in those spaces during the 2012 inventory, with no parked bicycles observed nearby. There were no parking spaces at the Woburn park-and-ride lot, nor were any bicycles parked in the area.
As part of the 2012 inventory, staff recorded information on amenities and other characteristics of each station and its vicinity that are pertinent to bicyclists. These include the types of bicycle racks, whether the racks are sheltered, if there is a bicycle path or trail nearby, and whether there are bus routes that connect to the station. These data are included in Appendix A, in Tables A2, A4, and A6, and are discussed below. In addition, also discussed below, staff recorded data on roadways with bike lanes that connect to MBTA stations.
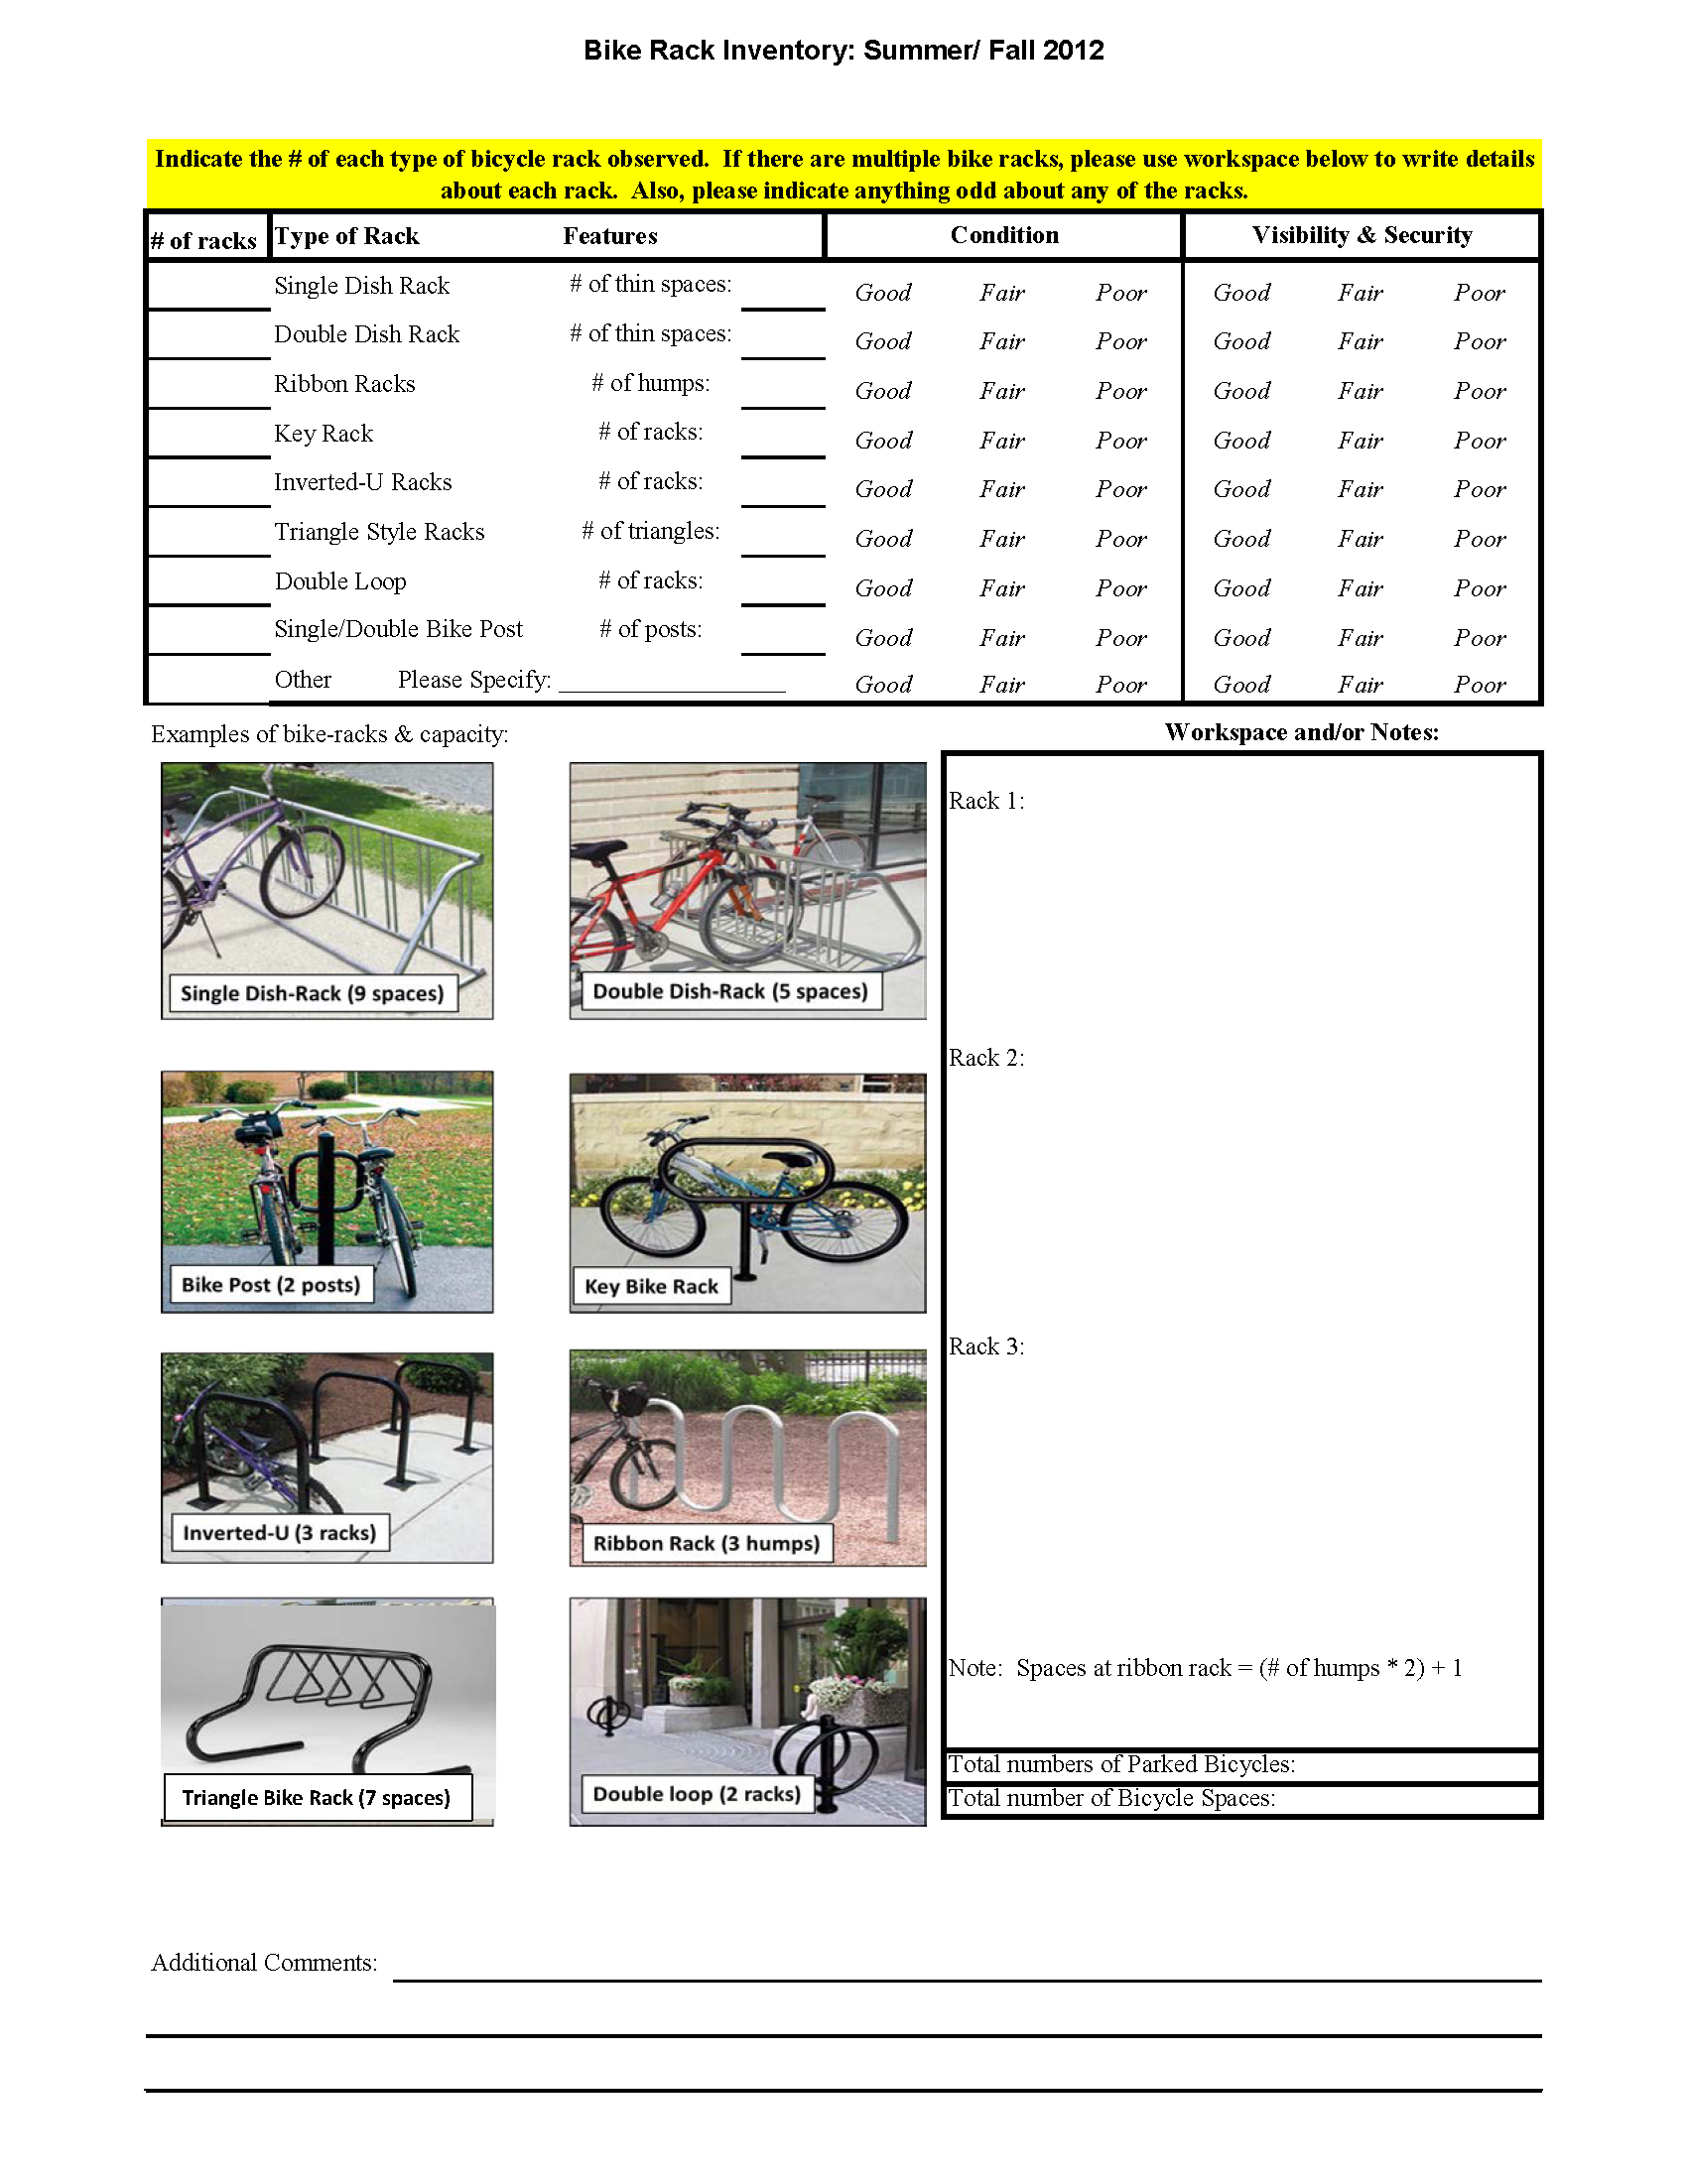
Tables A1.2, 2.2, and 3.2, in Appendix A, list in detail the amenities at each station. Some styles of bicycle racks are better than others. The inverted-U-style and post-and-loop-style racks support a bicycle in two places, keeping it from falling and being damaged. Also, they make it easy for a bicyclist to lock the bicycle frame and front or rear wheel to the rack to prevent theft. Other rack styles, such as dish-rack and ribbon, support bicycles in only one place, making it more likely for the bicycle to fall. Locking both the bicycle frame and wheel to dish-rack and ribbon-style racks is difficult.
At the stations inventoried, the ribbon and inverted-U styles were the most common types of bicycle racks. While the post-and-loop is also a commonly used style, it was observed mostly on sidewalks in the proximity of stations, and rarely at the stations themselves. The newly installed bike ports consist of inverted-U-style racks.
Bicyclists may be deterred from bicycling to a transit station by inclement weather, in part because of a lack of covered bicycle parking. However, while sheltered bicycle racks protect bicycles from the elements and provide a sense of security, it is not feasible to install them at all stations. Of the 134 rapid transit stations, only 14 stations provide at least some covered bicycle parking; two of them are South Station and Back Bay Station. These major stations have commuter rail, rapid transit, and bus connections. Tables A1.2, A2.2, and A3.2, in Appendix A, provide detailed information on all of the MBTA stations.
Between the 2009–11 inventory and the 2012 inventory, the number of commuter rail stations that have covered bicycle parking almost tripled, from 12to 34 stations. As more bike ports and Pedal & Park facilities are installed, more stations will have sheltered parking spaces. The South Acton commuter rail station has individual bicycle lockers for rent in addition to unsheltered bicycle racks. The bicycle lockers were installed by, and are operated by, the Town of Acton.
The American Recovery and Reinvestment Act (ARRA), enacted in 2009, has provided the MBTA with $4.8 million for a variety of programs to enhance and expand MBTA bicycle parking facilities. This program is funding the construction of 12 new Pedal & Park facilities. These fully enclosed facilities have video camera surveillance and controlled access to increase safety and security. [As of April 16, 2013, five of the facilities had been completed and were operating at Alewife, Forest Hills, South Station, Braintree, and Oak Grove. By September 2013, the remaining seven facilities were scheduled to open, at Ashmont, Davis, Malden, Back Bay, Dudley, Alewife, and Wonderland stations.4] The program is also funding the installation of up to 50 covered bike shelters, or bike ports, at MBTA stations; 18 bike ports had been installed as of October 2012 and the remainder will be completed incrementally by the end of 2013.5
Bicycle thefts were analyzed using the online dataset provided by the MBTA Transit Police, which includes the number of crimes that were reported at each station. Bicycle thefts are reported separately from other types of theft. The online data currently show the number of reported bicycle thefts at MBTA stations for all of 2012. Data for the number of bicycle thefts reported in 2010 and 2011 are no longer available on the website, but these values were obtained from a previous bicycle inventory memo. Tables A1.3 and A2.3, in Appendix A, show the bicycle theft values for those three years.
At all of the rapid transit stations combined, the number of bicycles stolen in 2012 increased by six percent since 2011, and by 27 percent since 2010, to 182 bicycles.
The stations with the highest number or reported bicycle thefts in 2012 were:
In order to calculate the rate of bicycle theft at a station, the number of bicycles stolen per day is divided by the number of bicycles per day that park at the station. Because thefts are relatively rare occurrences, the values can be scaled up to show the number of reported thefts expected per 1,000 parked bicycles. This calculation of the rate does not take into account the variations between weekdays and weekends or the variations between seasons.
The top bicycle theft locations, as defined by the number of thefts for every 1,000 parked bicycles, are:
Ranking the stations using this formula looks at the rate of theft instead of the number of bicycles stolen, a more significant figure than the raw number of bikes stolen, since some stations have a lot more bike racks than others, and some stations have a much higher utilization rate than others. While Davis and Alewife stations have the highest number of thefts per year, they are not among the 10 rapid transit stations that have the highest theft rates, which is a more important factor in deciding where to allocate resources for improvements.
Bicycle paths located near transit stations provide safe and convenient access to transit for bicyclists. Many stations are located near a bicycle path, and most of those stations were observed to have many parked bicycles. There are several bicycle paths in Boston, as well as its surroundings, including the Dr. Paul Dudley White Charles River Bike Path, which runs along the Charles River between Boston and Watertown, and the Pierre Lallement Southwest Corridor Bike Path, which runs along the Orange Line between Forest Hills Station and Back Bay Station.
The MBTA bus system covers a large portion of the Boston region. Many of the rapid transit and commuter rail stations that were inventoried have bus connections, either to MBTA bus routes or bus routes operated by other regional transit authorities. As the MBTA continues to outfit its buses with bicycle racks, bus connectivity is becoming a very important factor for bicyclists using transit. To meet the needs of cyclists who use transit, the MBTA equipped most of its buses with bicycle racks. According to MassBike, 95 percent of MBTA’s nonelectric buses were equipped with racks as of December 2012.
Several MBTA stations are made more accessible to bicyclists by bike lanes on roads leading to the stations. Porter, Harvard, Central, and Kendall stations, on the Red Line, are served by bike lanes on Main Street and portions of Massachusetts Avenue in Cambridge. There are also bicycle lanes on Beacon Street in Brighton, which improve bicycle access to all of the stations on the C Branch of the Green Line. The eastern portion of Commonwealth Avenue, which the B Branch of the Green Line follows, also has bicycle lanes. While these streets in Cambridge and Brighton are the major streets that have bicycle lanes, there are many minor streets that have sharrows (shared-lane arrows) or bicycle lanes located near other MBTA stations
Hubway is a bike-sharing program that was implemented in the Boston region in 2011 as a collective effort between the City of Boston and the Metropolitan Area Planning Council. During the 2012 monitoring period, Hubway had stations in Brookline, Cambridge, and Somerville, in addition to Boston, with more than 60 Hubway stations operating in the Boston region, and more stations expected to be operational soon thereafter. [Note: as of November 2013, there were more than 100 Hubway stations in these four cities.] Of the MBTA stations that were monitored in this data collection effort, 71 were in close proximity to a Hubway station. It is yet to be seen if the presence of a nearby Hubway station will have an effect on the bicycle parking utilization rates at MBTA stations.
Bicycle racks promote bicycle access to MBTA stations by providing a safe and convenient place to lock a bicycle. There was a 29 percent increase in the number of bicycle parking spaces throughout the entire MBTA system between the 2009–11 inventory and the 2012 inventory; 62 MBTA stations that did not have bicycle parking during the 2005–06 inventory had acquired bicycle racks by the time of the 2012 inventory. During that time, there was also a 48 percent increase in the number of bicycles parked at racks. The increase in the number of spaces, coupled with the larger increase in usage, indicates an overall increase in the percentage of utilization.
All of the rapid transit lines experienced at least a 25 percent increase in the number of parked bicycles. On the commuter rail lines, the number and percentage of parked bicycles varied from line to line. Some lines had decreases in the number of parked bicycles, while others had increases.
Bicycles were parked at locations other than bicycle facilities at 92 rapid transit stations, 31 commuter rail stations, and two major bus stops (see Appendix A for station-specific data on bicycles locked to things other than bike racks). The presence of bicycles parked in areas other than bicycle facilities might be an indication that bicycle racks are not fully serving their intended purpose—to provide a safe and convenient place to park a bicycle—but could also indicate that there is insufficient bicycle parking for the demand at some stations. Many MBTA rail stations—41 rapid transit stations and 23 commuter rail stations—are at 50 percent capacity or higher, including 16 rapid transit stations and 4 commuter rail stations that are at 85 percent capacity. Two of the three major bus stops that were monitored in 2012 were at 50 percent or greater capacity.
Table A4, in Appendix A, lists the MBTA stations where parked bicycles were observed in locations other than bicycle facilities. It identifies the locations of those bicycles, as well as the number of bicycle parking spaces provided by the station’s racks and the number of bicycles parked in them. It also presents one or more recommendations developed by staff for each station based on the locations and utilization of bicycle racks, the locations of the bicycles parked in other areas, and station characteristics.
The key recommendations are:
The MBTA should continue to add bicycle parking at stations where the existing racks are near, at, or over capacity; where there are a significant number of bicycles locked to objects other than bicycle racks; and where there are currently no bicycle racks. Also, as mentioned previously, an additional survey should be conducted at stations that have bicycles parked at locations other than bicycle facilities to determine if the users are MBTA riders or if they are patrons of businesses near the station.
The most frequent recommendation is to install additional bicycle racks at some stations. Sheltered racks are preferred, but space is not always available for a covered rack.
MPO staff developed an Excel analysis tool that is useful in prioritizing bicycle parking for stations based on population, bicycle parking utilization, if a station is a terminus or a hub, and motor vehicle parking utilization, but for commuter rail stations, the variable “commuters to Boston” was used in the tool instead of population because it more accurately reflects the number of people who might consider using the commuter rail system on a regular basis. A station’s scores for all of the variables were summed and the totals were sorted in descending order to determine which stations have the highest scores, which indicate the greatest need for bicycle parking improvements. This tool should be used, in conjunction with the data from this memo, as part of the 2014 UPWP’s Bicycle/Pedestrian Support Activities Program for further analysis.
HHG/hhg
1 Article on MassBike’s website, “Two Major Victories For Bikes On The MBTA,” http://massbike.org/blog/2012/12/11/two-major-victories-with-the-mbta/ (accessed January 2013).
2 In this memo, “rapid transit” refers to the Red, Orange, Blue, Green, Silver, and Mattapan High-Speed lines.
3 Data for the Woburn park-and-ride parking lot were collected as part of the park-and-ride data collection effort. Watertown Square and Watertown Yard (which is now a park-and-ride lot) were inventoried as part of the data collection effort for this task because of the high number of buses traversing Watertown Square.
4 Source: http://www.mbta.com/riding_the_t/bikes/, last accessed July 17, 2013.
5 Source: http://massbike.org/blog/2013/03/20/mbta-improves-security-at-pedal-parks/, last accessed July 17, 2013.
|
Table Name |
Table Number |
|---|---|
Bicycle Space Capacity and Utilization: Rapid Transit Stations |
A1.1 |
Bicycle Space Amenities: Rapid Transit Stations, 2012 |
A1.2 |
Bicycle Theft Analysis: Rapid Transit Stations |
A1.3 |
Bicycle Space Capacity and Utilization: Commuter Rail Stations |
A2.1 |
Bicycle Space Amenities: Commuter Rail Stations, 2012 |
A2.2 |
Bicycle Theft Analysis: Commuter Rail Stations |
A2.3 |
Bicycle Space Capacity and Utilization: Commuter Boat and Bus Facilities |
A3.1 |
Bicycle Space Amenities: Commuter Boat and Bus Facilities, 2012 |
A3.2 |
Bicycles Parked at Locations Other than Racks & Recommended Improvements, 2012 |
A4 |
| Station by Line | Bicycles Parked 2005–06 | Bicycles Parked 2009–11 | Bicycles Parked 2012 | Bicycles Parked Percentage Change |
Bicycle Rack Spaces 2005–06 | Bicycle Rack Spaces 2009–11 | Bicycle Rack Spaces 2012 | Bicycle Rack Spaces Percentage Change | Percent Bicycle Rack Spaces Utilized 2005–06 | Percent Bicycle Rack Spaces Utilized 2009–11 | Percent Bicycle Rack Spaces Utilized 2012 | Bicycles Parked in Other Areas in 2012 |
|---|---|---|---|---|---|---|---|---|---|---|---|---|
| Red Line | blank | blank | blank | blank | blank | blank | blank | blank | blank | blank | blank | blank |
| Alewife1 | 92 | 273 | 341 | 25 | 260 | 372 | 387 | 4 | 35 | 73 | 88 | 24 |
| Davis1 | 117 | 154 | 186 | 21 | 161 | 213 | 262 | 23 | 73 | 72 | 71 | 10 |
| Porter (under construction) | 19 | 42 | 41 | -2 | 62 | 58 | 58 | 0 | 31 | 72 | 71 | 8 |
| Harvard | 45 | 32 | 34 | 6 | 53 | 27 | 42 | 56 | 85 | 119 | 81 | 26 |
| Central2 | 47 | 75 | 104 | 39 | 114 | 105 | 140 | 33 | 41 | 71 | 74 | 19 |
| Kendall/MIT | 47 | 42 | 66 | 57 | 74 | 52 | 64 | 23 | 64 | 81 | 103 | 19 |
| Charles/MGH | N/A | 3 | 6 | 100 | 8 | 8 | 8 | 0 | N/A | 38 | 75 | 2 |
| Park Street2 | 3 | 5 | 2 | -60 | 6 | 8 | 6 | -25 | 50 | 63 | 33 | 3 |
| Downtown Crossing2 | 5 | 10 | 7 | -30 | 22 | 12 | 8 | -33 | 23 | 83 | 88 | 2 |
| South Station (new bicycle cage) | 12 | 24 | 48 | 100 | 45 | 80 | 139 | 74 | 27 | 30 | 35 | 6 |
| Broadway | 0 | 0 | 1 | N/A | 0 | 2 | 6 | 200 | N/A | 0 | 17 | 0 |
| Andrew | 0 | 5 | 6 | 20 | 0 | 9 | 14 | 56 | N/A | 56 | 43 | 2 |
| JFK/UMass | 2 | 8 | 14 | 75 | 22 | 12 | 20 | 67 | 9 | 67 | 70 | 0 |
| North Quincy | 22 | 13 | 40 | 208 | 52 | 38 | 42 | 11 | 42 | 34 | 95 | 0 |
| Wollaston1 | 30 | 25 | 38 | 52 | 30 | 30 | 40 | 33 | 100 | 83 | 95 | 2 |
| Quincy Center | 6 | 13 | 17 | 31 | 34 | 19 | 40 | 111 | 18 | 68 | 43 | 6 |
| Quincy Adams | 7 | 19 | 24 | 26 | 64 | 64 | 64 | 0 | 11 | 30 | 38 | 0 |
| Braintree (new bicycle cage) | 10 | 21 | 21 | 0 | 30 | 30 | 136 | 353 | 33 | 70 | 15 | 5 |
| Savin Hill | 0 | 0 | 0 | N/A | 0 | 0 | 10 | NEW | N/A | N/A | 0 | 0 |
| Fields Corner | N/A | 4 | 4 | 0 | N/A | 35 | 39 | 11 | N/A | 11 | 10 | 0 |
| Shawmut | 0 | 2 | 2 | 0 | 0 | 21 | 21 | 0 | N/A | 10 | 10 | 0 |
| Ashmont1 | N/A | 3 | 2 | -33 | N/A | 7 | 7 | 0 | N/A | 43 | 29 | 2 |
| Red Line Summary | 464 | 773 | 1,004 | 30% | 1,037 | 1,202 | 1,553 | 29% | 45% | 64% | 65% | 136 |
| Mattapan High-Speed Line | blank | blank | blank | blank | blank | blank | blank | blank | blank | blank | blank | blank |
| Cedar Grove | 0 | 0 | 0 | N/A | 0 | 0 | 0 | N/A | N/A | N/A | N/A | 0 |
| Butler | 0 | 0 | 1 | N/A | 0 | 28 | 40 | 43 | N/A | 0 | 3 | 0 |
| Milton | 0 | 0 | 1 | N/A | 8 | 12 | 26 | 117 | 0 | 0 | 4 | 0 |
| Central Avenue | 0 | 0 | 0 | N/A | 0 | 11 | 0 | -100 | N/A | 0 | N/A | 0 |
| Valley Road | 0 | 0 | 0 | N/A | 0 | 0 | 0 | N/A | N/A | N/A | N/A | 0 |
| Capen Street | 0 | 2 | 1 | -50 | 0 | 16 | 20 | 25 | N/A | 13 | 5 | 0 |
| Mattapan | 2 | 0 | 2 | N/A | 8 | 8 | 4 | -50 | 25 | 0 | 50 | 0 |
| Mattapan High-Speed Line Summary | 2 | 2 | 5 | 150% | 16 | 75 | 90 | 20% | 13% | 3% | 6% | 0 |
| Blue Line | blank | blank | blank | blank | blank | blank | blank | blank | blank | blank | blank | blank |
| Wonderland (new bicycle cage) | 5 | 6 | 23 | 283 | 26 | 14 | 140 | 900 | 19 | 43 | 16 | 2 |
| Revere Beach | 4 | 4 | 2 | -50 | 16 | 20 | 20 | 0 | 25 | 20 | 10 | 1 |
| Beachmont | 8 | 12 | 9 | -25 | 36 | 15 | 39 | 160 | 22 | 80 | 23 | 0 |
| Suffolk Downs | 0 | 0 | 0 | N/A | 12 | 14 | 34 | 143 | 0 | 0 | 0 | 0 |
| Orient Heights | 3 | 5 | 10 | 100 | 8 | 9 | 19 | 111 | 38 | 56 | 53 | 4 |
| Wood Island | 6 | 5 | 5 | 0 | 10 | 11 | 10 | -9 | 60 | 45 | 50 | 4 |
| Airport | 0 | 12 | 23 | 92 | 0 | 39 | 51 | 31 | N/A | 31 | 45 | 1 |
| Maverick | 1 | 14 | 4 | -71 | 8 | 48 | 48 | 0 | 13 | 29 | 8 | 6 |
| Aquarium | 6 | 9 | 11 | 22 | 16 | 30 | 30 | 0 | 38 | 30 | 37 | 0 |
| State | 0 | 5 | 4 | -20 | 0 | 36 | 14 | -61 | N/A | 14 | 29 | 5 |
| Government Center | 0 | 0 | 0 | N/A | 0 | 0 | 0 | N/A | N/A | N/A | N/A | 5 |
| Bowdoin | 0 | 0 | 1 | N/A | 0 | 4 | 4 | 0 | N/A | 0 | 25 | 4 |
| Blue Line Summary | 33 | 72 | 92 | 28% | 132 | 240 | 409 | 70% | 25% | 30% | 22% | 32 |
| Orange Line | blank | blank | blank | blank | blank | blank | blank | blank | blank | blank | blank | blank |
| Oak Grove (new bicycle cage) | 36 | 33 | 81 | 145 | 76 | 103 | 210 | 104 | 47 | 32 | 39 | 10 |
| Malden (new bicycle cage) | 13 | 24 | 48 | 100 | 152 | 66 | 162 | 145 | 9 | 36 | 30 | 16 |
| Wellington | 3 | 0 | 4 | N/A | 16 | 9 | 9 | 0 | 19 | 0 | 44 | 0 |
| Sullivan Square | 9 | 10 | 21 | 110 | 16 | 18 | 18 | 0 | 56 | 56 | 117 | 7 |
| Community College | 1 | 3 | 8 | 167 | 5 | 21 | 30 | 43 | 20 | 14 | 27 | 0 |
| North Station | 17 | 23 | 23 | 0 | 28 | 56 | 70 | 25 | 61 | 41 | 33 | 0 |
| Haymarket | 0 | 2 | 1 | -50 | 0 | 2 | 2 | 0 | N/A | 100 | 50 | 0 |
| State | 0 | 5 | 4 | -20 | 0 | 36 | 14 | -61 | N/A | 14 | 29 | 5 |
| Downtown Crossing2 | 5 | 10 | 7 | -30 | 22 | 12 | 8 | -33 | 23 | 83 | 88 | 2 |
| Chinatown | 0 | 2 | 4 | 100 | 4 | 4 | 4 | 0 | 0 | 50 | 100 | 2 |
| Tufts Medical Center | 2 | 4 | 3 | -25 | 15 | 8 | 10 | 25 | 13 | 50 | 30 | 0 |
| Back Bay1 | 10 | 18 | 35 | 94 | 46 | 71 | 72 | 1 | 22 | 25 | 49 | 5 |
| Massachusetts Avenue | 2 | 4 | 2 | -50 | 24 | 27 | 41 | 52 | 8 | 15 | 5 | 0 |
| Ruggles | 1 | 20 | 69 | 245 | 20 | 102 | 98 | -4 | 5 | 20 | 70 | 12 |
| Roxbury Crossing | 0 | 2 | 2 | 0 | 16 | 17 | 18 | 6 | 0 | 12 | 11 | 0 |
| Jackson Square | 0 | 1 | 3 | 200 | 8 | 6 | 9 | 50 | 0 | 17 | 33 | 0 |
| Stony Brook | 3 | 4 | 6 | 50 | 16 | 12 | 9 | -25 | 19 | 33 | 67 | 0 |
| Green Street | 9 | 3 | 18 | 500 | 24 | 7 | 29 | 314 | 38 | 43 | 62 | 1 |
| Forest Hills1 | 14 | 51 | 35 | -31 | 32 | 123 | 128 | 4 | 44 | 41 | 27 | 0 |
| Orange Line Summary | 125 | 219 | 374 | 71% | 520 | 700 | 941 | 34% | 24% | 31% | 40% | 60 |
| Green Line Subway | blank | blank | blank | blank | blank | blank | blank | blank | blank | blank | blank | blank |
| Lechmere | 0 | 0 | 3 | NEW | 6 | 0 | 30 | NEW | 0 | N/A | 10 | 4 |
| Science Park | 0 | N/A | 1 | NEW | 0 | N/A | 7 | NEW | N/A | N/A | 14 | 0 |
| North Station | 17 | 23 | 23 | 0 | 28 | 56 | 70 | 25 | 61 | 41 | 33 | 0 |
| Haymarket | 0 | 2 | 1 | -50 | 0 | 2 | 2 | 0 | N/A | 100 | 50 | 0 |
| Government Center | 0 | 0 | 0 | N/A | 0 | 0 | 0 | N/A | N/A | N/A | N/A | 5 |
| Park Street2 | 3 | 5 | 2 | -60 | 6 | 8 | 6 | -25 | 50 | 63 | 33 | 3 |
| Boylston2 | 9 | 6 | 22 | 267 | 18 | 14 | 28 | 100 | 50 | 43 | 79 | 5 |
| Arlington | 0 | 4 | 8 | 100 | 0 | 10 | 10 | 0 | N/A | 40 | 80 | 5 |
| Copley | 0 | 0 | 0 | N/A | 0 | 0 | 0 | N/A | N/A | N/A | N/A | 5 |
| Hynes Convention Center | 0 | 2 | 4 | 100 | 0 | 14 | 4 | -71 | N/A | 14 | 100 | 4 |
| Kenmore | N/A | 7 | 10 | 43 | 0 | 16 | 30 | 88 | N/A | 44 | 33 | 5 |
| Prudential | 0 | 8 | 8 | 0 | 0 | 14 | 14 | 0 | N/A | 57 | 57 | 0 |
| Symphony | 0 | 1 | 0 | -100 | 0 | 8 | 6 | -25 | N/A | 13 | 0 | 0 |
| Green Line Subway Summary | 29 | 58 | 82 | 41% | 58 | 142 | 207 | 46% | 50% | 41% | 40% | 36 |
| Green Line B Branch | blank | blank | blank | blank | blank | blank | blank | blank | blank | blank | blank | blank |
| Boston College | N/A | 2 | 2 | 0 | 0 | 11 | 18 | 64 | N/A | 18 | 11 | 0 |
| South Street | N/A | N/A | N/A | N/A | 0 | 0 | 0 | N/A | N/A | N/A | N/A | 0 |
| Chestnut Hill Avenue | N/A | N/A | N/A | N/A | 0 | 0 | 0 | N/A | N/A | N/A | N/A | 1 |
| Chiswick Road | N/A | N/A | N/A | N/A | 0 | 0 | 0 | N/A | N/A | N/A | N/A | 2 |
| Sutherland Road | N/A | N/A | N/A | N/A | 0 | 0 | 0 | N/A | N/A | N/A | N/A | 3 |
| Washington Street | N/A | N/A | 0 | N/A | 0 | 0 | 4 | NEW | N/A | N/A | 0 | 4 |
| Warren Street | N/A | N/A | N/A | N/A | 0 | 0 | 0 | N/A | N/A | N/A | N/A | 4 |
| Allston Street | N/A | N/A | N/A | N/A | 0 | 0 | 0 | N/A | N/A | N/A | N/A | 3 |
| Griggs Street | N/A | N/A | N/A | N/A | 0 | 0 | 0 | N/A | N/A | N/A | N/A | 5 |
| Harvard Avenue | N/A | N/A | N/A | N/A | 0 | 0 | 0 | N/A | N/A | N/A | N/A | 19 |
| Packards Corner | N/A | N/A | N/A | N/A | 0 | 0 | 0 | N/A | N/A | N/A | N/A | 16 |
| Babcock Street | N/A | N/A | 1 | NEW | 0 | 0 | 14 | NEW | N/A | N/A | 7 | 10 |
| Pleasant Street | N/A | N/A | 1 | NEW | 0 | 0 | 2 | NEW | N/A | N/A | 50 | 8 |
| St. Paul Street | N/A | N/A | 3 | NEW | 0 | 0 | 8 | NEW | N/A | N/A | 38 | 15 |
| Boston University West | N/A | N/A | 7 | NEW | 0 | 0 | 14 | NEW | N/A | N/A | 50 | 12 |
| Boston University Central | N/A | 6 | 20 | 233 | 0 | 10 | 20 | 100 | N/A | 60 | 100 | 49 |
| Boston University East | N/A | 26 | 106 | 308 | 0 | 70 | 136 | 94 | N/A | 37 | 78 | 14 |
| Blandford Street | N/A | 0 | 5 | N/A | 0 | 0 | 8 | NEW | N/A | N/A | 63 | 16 |
| Green Line B Branch Summary | 0 | 34 | 145 | 326% | 0 | 91 | 224 | 146% | N/A | 37% | 65% | 181 |
| Green Line C Branch | blank | blank | blank | blank | blank | blank | blank | blank | blank | blank | blank | blank |
| Cleveland Circle | 0 | 0 | 1 | N/A | 20 | 22 | 22 | 0 | 0 | 0 | 5 | 1 |
| Englewood Avenue | 0 | 0 | N/A | N/A | 0 | 0 | 0 | N/A | N/A | N/A | N/A | 2 |
| Dean Road | 0 | 0 | N/A | N/A | 0 | 0 | 0 | N/A | N/A | N/A | N/A | 1 |
| Tappan Street | 0 | 0 | 1 | N/A | 0 | 10 | 10 | 0 | N/A | 0 | 10 | 0 |
| Washington Square | 2 | 0 | 1 | N/A | 20 | 22 | 22 | 0 | 10 | 0 | 5 | 0 |
| Fairbanks Street | 0 | 0 | N/A | N/A | 0 | 0 | 0 | N/A | N/A | N/A | N/A | 1 |
| Brandon Hall | 0 | 0 | N/A | N/A | 0 | 0 | 0 | N/A | N/A | N/A | N/A | 3 |
| Summit Avenue | 0 | 1 | 4 | 300 | 0 | 4 | 12 | 200 | N/A | 25 | 33 | 4 |
| Coolidge Corner | 4 | 13 | 25 | 92 | 20 | 52 | 82 | 58 | 20 | 25 | 30 | 6 |
| St. Paul Street | 0 | 0 | N/A | N/A | 0 | 0 | 0 | N/A | N/A | N/A | N/A | 4 |
| Kent Street | 0 | 0 | N/A | N/A | 0 | 0 | 0 | N/A | N/A | N/A | N/A | 3 |
| Hawes Street | 0 | 0 | N/A | N/A | 0 | 0 | 0 | N/A | N/A | N/A | N/A | 9 |
| St. Mary's Street | 0 | 6 | 2 | -67 | 10 | 27 | 39 | 44 | 0 | 22 | 5 | 3 |
| Green Line C Branch Summary | 6 | 20 | 34 | 70% | 70 | 137 | 187 | 36% | 9% | 15% | 18% | 37 |
| Green Line D Branch | blank | blank | blank | blank | blank | blank | blank | blank | blank | blank | blank | blank |
| Riverside | 6 | 8 | 9 | 13 | 48 | 35 | 36 | 3 | 13 | 23 | 25 | 2 |
| Woodland | 1 | 3 | 6 | 100 | 14 | 16 | 9 | -44 | 7 | 19 | 67 | 4 |
| Waban | 4 | 2 | 5 | 150 | 10 | 11 | 11 | 0 | 40 | 18 | 45 | 1 |
| Eliot | 1 | 0 | 1 | N/A | 8 | 9 | 9 | 0 | 13 | 0 | 11 | 10 |
| Newton Highlands | 0 | 4 | 2 | -50 | 0 | 7 | 7 | 0 | N/A | 57 | 29 | 0 |
| Newton Center | 9 | 17 | 16 | -6 | 16 | 18 | 18 | 0 | 56 | 94 | 89 | 12 |
| Chestnut Hill | 5 | 7 | 9 | 29 | 8 | 9 | 9 | 0 | 63 | 78 | 100 | 1 |
| Reservoir | 6 | 8 | 4 | -50 | 11 | 19 | 19 | 0 | 55 | 42 | 21 | 1 |
| Beaconsfield | 2 | 0 | N/A | N/A | 8 | 0 | 0 | N/A | 25 | N/A | N/A | 1 |
| Brookline Hills | 2 | 5 | 8 | 60 | 8 | 9 | 9 | 0 | 25 | 56 | 89 | 0 |
| Brookline Village | 3 | 15 | 15 | 0 | 6 | 32 | 26 | -19 | 50 | 47 | 58 | 1 |
| Longwood | 1 | 2 | 7 | 250 | 19 | 26 | 26 | 0 | 5 | 8 | 27 | 0 |
| Fenway | 1 | 0 | 13 | N/A | 26 | 0 | 28 | N/A | 4 | N/A | 46 | 0 |
| Green Line D Branch Summary | 41 | 71 | 95 | 34% | 182 | 191 | 207 | 8% | 23% | 37% | 46% | 33 |
| Green Line E Branch | blank | blank | blank | blank | blank | blank | blank | blank | blank | blank | blank | |
| Heath | 0 | 0 | N/A | N/A | 0 | 0 | 0 | N/A | N/A | N/A | N/A | 0 |
| Back of the Hill | 0 | 0 | N/A | N/A | 0 | 0 | 0 | N/A | N/A | N/A | N/A | 0 |
| Riverway | 0 | 0 | N/A | N/A | 0 | 0 | 0 | N/A | N/A | N/A | N/A | 2 |
| Mission Park | 0 | 0 | N/A | N/A | 0 | 0 | 0 | N/A | N/A | N/A | N/A | 0 |
| Fenwood Road | 0 | 0 | N/A | N/A | 0 | 0 | 0 | N/A | N/A | N/A | N/A | 0 |
| Brigham Circle | 0 | 3 | 4 | 33 | 0 | 11 | 11 | 0 | N/A | 27 | 36 | 2 |
| Longwood Medical Area | 0 | 2 | 12 | 500 | 0 | 14 | 14 | 0 | N/A | 14 | 86 | 3 |
| Museum of Fine Arts | 0 | 0 | 0 | N/A | 0 | 8 | 8 | 0 | N/A | 0 | 0 | 1 |
| Northeastern | 0 | 7 | 1 | -86 | 0 | 18 | 12 | -33 | N/A | 39 | 8 | 2 |
| Green Line E Branch Summary | 0 | 12 | 17 | 42% | 0 | 51 | 45 | -12% | N/A | 24% | 38% | 10 |
| Silver Line Washington Street | blank | blank | blank | blank | blank | blank | blank | blank | blank | blank | blank | blank |
| Dudley Square | 0 | 0 | 0 | N/A | 0 | 0 | 0 | N/A | N/A | N/A | N/A | 0 |
| Melnea Cass Boulevard | 0 | 0 | 0 | N/A | 4 | 10 | 10 | 0 | 0 | 0 | 0 | 0 |
| Lenox Street | 0 | 1 | 0 | -100 | 4 | 10 | 10 | 0 | 0 | 10 | 0 | 0 |
| Massachusetts Avenue | 0 | 1 | 0 | -100 | 4 | 10 | 5 | -50 | 0 | 10 | 0 | 0 |
| Worcester Square | 0 | 1 | 1 | 0 | 4 | 10 | 10 | 0 | 0 | 10 | 10 | 1 |
| Newton Street | 0 | 0 | 0 | N/A | 4 | 10 | 10 | 0 | 0 | 0 | 0 | 0 |
| Union Park Street | 0 | 0 | 0 | N/A | 4 | 10 | 10 | 0 | 0 | 0 | 0 | 0 |
| East Berkeley Street | 0 | 0 | 0 | N/A | 4 | 10 | 10 | 0 | 0 | 0 | 0 | 0 |
| Herald Street | 0 | 0 | 0 | N/A | 4 | 10 | 10 | 0 | 0 | 0 | 0 | 0 |
| Tufts Medical Center | 2 | 4 | 3 | -25 | 15 | 8 | 10 | 25 | 13 | 50 | 30 | 0 |
| Chinatown | 0 | 2 | 4 | 100 | 4 | 4 | 4 | 0 | 0 | 50 | 100 | 2 |
| Downtown Crossing2 | 5 | 10 | 7 | -30 | 22 | 12 | 8 | -33 | 23 | 83 | 88 | 2 |
| Boylston2 | 9 | 6 | 22 | 267 | 18 | 14 | 28 | 100 | 50 | 43 | 79 | 5 |
| Silver Line Washington St. Summary | 16 | 25 | 37 | 48% | 91 | 118 | 125 | 6% | 18% | 21% | 30% | 10 |
| Silver Line Waterfront | blank | blank | blank | blank | blank | blank | blank | blank | blank | blank | blank | blank |
| Airport Terminals (SL1)2 | 0 | 2 | 7 | 250 | 0 | 24 | 28 | 17 | N/A | 8 | 25 | 2 |
| Design Center2 | N/A | N/A | 4 | N/A | 0 | 0 | 7 | NEW | N/A | N/A | 57 | 1 |
| 21/25 Dry Dock Avenue2 | N/A | N/A | 14 | N/A | 0 | 0 | 39 | NEW | N/A | N/A | 36 | 10 |
| Tide Street/Northern Avenue | N/A | 0 | 0 | N/A | 0 | 4 | 4 | 0 | N/A | 0 | 0 | 0 |
| Silver Line Way2 | 0 | 2 | 3 | 50 | 8 | 7 | 7 | 0 | 0 | 29 | 43 | 1 |
| World Trade Center | 0 | 0 | 1 | N/A | 0 | 0 | 6 | N/A | N/A | N/A | 17 | 1 |
| Courthouse | 0 | 0 | 0 | N/A | 0 | 0 | 0 | N/A | N/A | N/A | N/A | 0 |
| South Station | 12 | 24 | 48 | 100 | 45 | 80 | 139 | 74 | 27 | 30 | 35 | 6 |
| Silver Line Waterfront Summary | 12 | 28 | 77 | 175% | 53 | 115 | 230 | 100% | 23% | 24% | 33% | 21 |
| Grand Total | 675 | 1,223 | 1,841 | 51% | 1,999 | 2,830 | 3,929 | 39% | 34% | 43% | 47% | 526 |
Note: Percentage change refers to the change from the 2009-11 survey to the 2012 survey.
1 These stations had received or were due to receive new amenities as of October 2013. At the time of observation, some of these new amenities were being installed. Therefore, the total capacity is now higher than reported.
2 Bicycle racks that are most likely provided by local retail shops or colleges, not by the MBTA.
N/A = not applicable
NEW = new bicycle capacity as of the 2012 survey
| Rapid Transit Line | Station Name | Type of Bicycle Rack | Covered Bicycle Rack | Bicycle Trail/Path | Condition of Trail/Path | Connecting Bus Route | Bicycle Cage (P&P) or Port (BP) Proposed or Installed2 |
|---|---|---|---|---|---|---|---|
| Red | Alewife | R, U, H, P&P | Some | Yes | Good | Yes | P&P |
| Red | Davis | R, U, H | None | Yes | Good | Yes | P&P, BP |
| Red | Porter | P, H | None | No | N/A | Yes | N/A |
| Red | Harvard | P | None | No | N/A | Yes | N/A |
| Red | Central1 | U, P | None | No | N/A | Yes | BP |
| Red | Kendall/MIT | U, P | None | No | N/A | Yes | N/A |
| Red | Charles/MGH | U | None | Yes | Good | No | N/A |
| Red | Park Street1 | U | None | No | N/A | Yes | N/A |
| Red | Downtown Crossing1 | P | None | No | N/A | Yes | N/A |
| Red | South Station | H, P&P, D, P | Some | No | N/A | Yes | P&P |
| Red | Broadway | P | None | No | N/A | Yes | N/A |
| Red | Andrew | P, H | Some | No | N/A | Yes | N/A |
| Red | JFK/UMass | H | All | No | N/A | Yes | BP |
| Red | North Quincy | R, H | None | No | N/A | No | BP |
| Red | Wollaston | D, H | None | No | N/A | No | P&P |
| Red | Quincy Center | U, H | None | No | N/A | No | N/A |
| Red | Quincy Adams | U | All | No | N/A | Yes | N/A |
| Red | Braintree | U, P, P&P | All | No | N/A | No | P&P |
| Red | Savin Hill | H | None | No | N/A | No | N/A |
| Red | Fields Corner | R, U | Some | No | N/A | Yes | BP |
| Red | Shawmut | R | None | No | N/A | No | N/A |
| Red | Ashmont | R | None | No | N/A | No | P&P |
| Mattapan High-Speed | Cedar Grove | None | None | No | N/A | No | N/A |
| Mattapan High-Speed | Butler | H | None | Yes | Good | No | N/A |
| Mattapan High-Speed | Milton | R, H | None | Yes | Good | Yes | N/A |
| Mattapan High-Speed | Central Avenue | R | None | Yes | Good | Yes | N/A |
| Mattapan High-Speed | Valley Road | None | None | No | N/A | No | N/A |
| Mattapan High-Speed | Capen Street | H | None | No | N/A | No | N/A |
| Mattapan High-Speed | Mattapan | U | None | No | N/A | Yes | N/A |
| Blue | Wonderland (under construction) | R, P&P | Some | No | N/A | Yes | P&P |
| Blue | Revere Beach | R | None | No | N/A | Yes | N/A |
| Blue | Beachmont | R | None | No | N/A | Yes | N/A |
| Blue | Suffolk Downs | R, U | None | No | N/A | No | BP |
| Blue | Orient Heights | H | None | No | N/A | Yes | BP |
| Blue | Wood Island | H | None | No | N/A | No | BP |
| Blue | Airport | R, H | None | No | N/A | Shuttles | N/A |
| Blue | Maverick | U, R | Some | No | N/A | Yes | BP |
| Blue | Aquarium | R | None | No | N/A | Yes | N/A |
| Blue | State | U, D | None | No | N/A | Yes | N/A |
| Blue | Government Center | None | None | No | N/A | No | N/A |
| Blue | Bowdoin | U | None | No | N/A | No | N/A |
| Orange | Oak Grove | R, P&P, U | None | No | N/A | Yes | P&P |
| Orange | Malden | U, R | None | No | N/A | Yes | P&P |
| Orange | Wellington | R | None | No | N/A | Yes | BP |
| Orange | Sullivan Square | R | None | No | N/A | Yes | BP |
| Orange | Community College | H | None | No | N/A | No | N/A |
| Orange | North Station | D, H | None | No | N/A | Yes | N/A |
| Orange | Haymarket | P | None | No | N/A | Yes | N/A |
| Orange | State | D, U | None | No | N/A | Yes | N/A |
| Orange | Downtown Crossing1 | U | None | No | N/A | Yes | N/A |
| Orange | Chinatown | U | None | No | N/A | Yes | N/A |
| Orange | Tufts Medical Center | H | All | No | N/A | Yes | N/A |
| Orange | Back Bay | R, U, H | Some | Yes | Good | Yes | P&P |
| Orange | Massachusetts Avenue | R, P&P, U | None | Yes | Good | Yes | N/A |
| Orange | Ruggles | D, U | None | Yes | Good | Yes | N/A |
| Orange | Roxbury Crossing | R | None | Yes | Good | Yes | BP |
| Orange | Jackson Square | R | All | Yes | Good | Yes | N/A |
| Orange | Stony Brook | H | None | Yes | Good | Yes | BP |
| Orange | Green Street | H | None | Yes | Good | Yes | BP |
| Orange | Forest Hills | R, H, P&P | Most | Yes | Good | Yes | P&P, BP |
| Green - Subway | Lechmere | P | None | No | N/A | Yes | N/A |
| Green - Subway | Science Park | P | None | No | N/A | No | N/A |
| Green - Subway | North Station | D, H | None | No | N/A | Yes | N/A |
| Green - Subway | Haymarket | P | None | No | N/A | Yes | N/A |
| Green - Subway | Government Center | None | None | No | N/A | No | N/A |
| Green - Subway | Park Street1 | Modified-U | None | No | N/A | Yes | N/A |
| Green - Subway | Boylston | U, P | None | No | N/A | No | N/A |
| Green - Subway | Arlington | U, P | None | No | N/A | Yes | N/A |
| Green - Subway | Copley | None | None | No | N/A | Yes | N/A |
| Green - Subway | Hynes Convention Center | P | None | No | N/A | Yes | N/A |
| Green - Subway | Kenmore | U, P | None | No | N/A | Yes | N/A |
| Green - Subway | Prudential | R | None | No | N/A | Yes | N/A |
| Green - Subway | Symphony | P | None | No | N/A | Yes | N/A |
| Green B Branch | Boston College | R | None | No | N/A | No | N/A |
| Green B Branch | South Street | None | None | No | N/A | No | N/A |
| Green B Branch | Chestnut Hill Avenue | None | None | No | N/A | Yes | N/A |
| Green B Branch | Chiswick Road | None | None | No | N/A | No | N/A |
| Green B Branch | Sutherland Road | None | None | No | N/A | No | N/A |
| Green B Branch | Washington Street | P | None | No | N/A | Yes | N/A |
| Green B Branch | Warren Street | None | None | No | N/A | No | N/A |
| Green B Branch | Allston Street | None | None | No | N/A | No | N/A |
| Green B Branch | Griggs Street | None | None | No | N/A | No | N/A |
| Green B Branch | Harvard Avenue | None | None | No | N/A | Yes | N/A |
| Green B Branch | Packards Corner | None | None | No | N/A | Yes | N/A |
| Green B Branch | Babcock Street | U, P | None | No | N/A | No | N/A |
| Green B Branch | Pleasant Street | P | None | No | N/A | No | N/A |
| Green B Branch | St. Paul Street | P | None | No | N/A | Yes | N/A |
| Green B Branch | Boston University West | U | None | No | N/A | Yes | N/A |
| Green B Branch | Boston University Central | U | None | No | N/A | Yes | N/A |
| Green B Branch | Boston University East | U, H | None | No | N/A | No | N/A |
| Green B Branch | Blandford Street | U | None | No | N/A | No | N/A |
| Green C Branch | Cleveland Circle | R | None | No | N/A | Yes | N/A |
| Green C Branch | Englewood Avenue | None | None | No | N/A | No | N/A |
| Green C Branch | Dean Road | None | None | No | N/A | No | N/A |
| Green C Branch | Tappan Street | P | None | No | N/A | No | N/A |
| Green C Branch | Washington Square | R | None | No | N/A | Yes | N/A |
| Green C Branch | Fairbanks Street | None | None | No | N/A | No | N/A |
| Green C Branch | Brandon Hall | None | None | No | N/A | No | N/A |
| Green C Branch | Summit Avenue | U | None | No | N/A | No | N/A |
| Green C Branch | Coolidge Corner | R, U, P | None | No | N/A | Yes | N/A |
| Green C Branch | St. Paul Street | None | None | No | N/A | No | N/A |
| Green C Branch | Kent Street | None | None | No | N/A | No | N/A |
| Green C Branch | Hawes Street | None | None | No | N/A | No | N/A |
| Green C Branch | St. Mary's Street | R, U | None | No | N/A | Yes | N/A |
| Green D Branch | Riverside | R, U | Some | No | N/A | Yes | BP |
| Green D Branch | Woodland | R | None | No | N/A | No | N/A |
| Green D Branch | Waban | R | None | No | N/A | No | BP |
| Green D Branch | Eliot | R | None | No | N/A | Yes | BP |
| Green D Branch | Newton Highlands | R | None | Yes | Fair | Yes | BP |
| Green D Branch | Newton Center | R | None | No | N/A | Yes | N/A |
| Green D Branch | Chestnut Hill | R | None | No | N/A | No | BP |
| Green D Branch | Reservoir | R, U | None | No | N/A | Yes | BP |
| Green D Branch | Beaconsfield | None | None | Yes | Fair | No | N/A |
| Green D Branch | Brookline Hills | R | None | No | N/A | Yes | N/A |
| Green D Branch | Brookline Village | R | None | No | N/A | Yes | BP |
| Green D Branch | Longwood | R | None | Yes | Good | No | N/A |
| Green D Branch | Fenway | H, U | None | No | N/A | Yes | N/A |
| Green E Branch | Heath | None | None | No | N/A | Yes | N/A |
| Green E Branch | Back of the Hill | None | None | No | N/A | Yes | N/A |
| Green E Branch | Riverway | None | None | No | N/A | Yes | N/A |
| Green E Branch | Mission Park | None | None | No | N/A | Yes | N/A |
| Green E Branch | Fenwood Road | None | None | No | N/A | Yes | N/A |
| Green E Branch | Brigham Circle | U | None | No | N/A | Yes | N/A |
| Green E Branch | Longwood Medical Area | U, P | None | No | N/A | Yes | N/A |
| Green E Branch | Museum of Fine Arts | U | None | No | N/A | Yes | N/A |
| Green E Branch | Northeastern | U | None | No | N/A | Yes | N/A |
| Sliver Line Washington Street | Dudley Square | None | None | No | N/A | Yes | N/A |
| Silver Line Washington Street | Melnea Cass Boulevard | R | None | Yes | Fair | Yes | N/A |
| Silver Line Washington Street | Lenox Street | R | None | No | N/A | Yes | N/A |
| Silver Line Washington Street | Massachusetts Avenue | R | None | No | N/A | Yes | N/A |
| Silver Line Washington Street | Worcester Square | R | None | No | N/A | Yes | N/A |
| Silver Line Washington Street | Newton Street | R | None | No | N/A | Yes | N/A |
| Silver Line Washington Street | Union Park Street | R | None | No | N/A | No | N/A |
| Silver Line Washington Street | East Berkeley Street | R | None | No | N/A | Yes | N/A |
| Silver Line Washington Street | Herald Street | R | None | No | N/A | Yes | N/A |
| Silver Line Washington Street | Tufts Medical Center | H | None | No | N/A | Yes | N/A |
| Silver Line Washington Street | Chinatown | U | None | No | N/A | Yes | N/A |
| Silver Line Washington Street | Downtown Crossing1 | U | None | No | N/A | Yes | N/A |
| Silver Line Washington Street | Boylston1 | U, P | None | No | N/A | Yes | N/A |
| Silver Line Waterfront | Airport Terminals (SL1) | U | None | No | N/A | Shuttles | N/A |
| Silver Line Waterfront | Boston Marine Ind. Park (SL2)1 | P | None | No | N/A | Yes | N/A |
| Silver Line Waterfront | Silver Line Way1 | R | None | No | N/A | No | N/A |
| Silver Line Waterfront | World Trade Center | P | None | No | N/A | Yes | N/A |
| Silver Line Waterfront | Courthouse | None | None | No | N/A | Yes | N/A |
| Silver Line Waterfront | South Station | R, H, P&P | None | No | N/A | Yes | P&P |
1 Bicycle rack ownership unknown. They may be provided by local establishments, municipalities, and/or the MBTA.
2 By the MBTA as of September 2013.
U = inverted-U
R = ribbon
P&P = Pedal & Park (bicycle cage)
D = dish rack
P = post (double or single)
N/A = not applicable
| Station by Line | Bicycles Parked 2012 | Bicycle Rack Spaces 2012 | Bicycle Thefts 2010 | Bicycle Thefts 2011 | Bicycle Thefts 2012 | Bicycles Stolen per 1,000 Parked2 |
|---|---|---|---|---|---|---|
| Red Line | blank | blank | blank | blank | blank | blank |
| Alewife | 341 | 387 | 29 | 14 | 28 | 0.19 |
| Davis | 186 | 262 | 11 | 21 | 32 | 0.31 |
| Porter (under construction) | 41 | 58 | 4 | 6 | 1 | 0.25 |
| Harvard | 34 | 42 | 0 | 0 | 0 | N/A |
| Central1 | 104 | 140 | 0 | 0 | 0 | N/A |
| Kendall/MIT | 66 | 64 | 1 | 0 | 0 | 0.01 |
| Charles/MGH | 6 | 8 | 0 | 0 | 0 | N/A |
| Park Street1 | 2 | 6 | 0 | 0 | 0 | N/A |
| Downtown Crossing1 | 7 | 8 | 0 | 0 | 0 | N/A |
| South Station | 48 | 139 | 16 | 13 | 0 | 0.55 |
| Broadway | 1 | 6 | 0 | 0 | 0 | N/A |
| Andrew | 6 | 14 | 1 | 3 | 2 | 0.91 |
| JFK/UMass | 14 | 20 | 10 | 6 | 3 | 1.24 |
| North Quincy | 40 | 42 | 4 | 8 | 6 | 0.41 |
| Wollaston | 38 | 40 | 3 | 8 | 5 | 0.38 |
| Quincy Center | 17 | 40 | 6 | 5 | 7 | 0.97 |
| Quincy Adams | 24 | 64 | 3 | 5 | 5 | 0.49 |
| Braintree (new bicycle cage) | 21 | 136 | 1 | 4 | 5 | 0.43 |
| Savin Hill | 0 | 10 | 3 | 1 | 0 | N/A |
| Fields Corner | 4 | 39 | 1 | 3 | 3 | 1.60 |
| Shawmut | 2 | 21 | 3 | 1 | 1 | 2.28 |
| Ashmont | 2 | 7 | 1 | 6 | 3 | 4.57 |
| Red Line Totals | 1,004 | 1,553 | 97 | 104 | 101 | 0.27 |
| Mattapan High-Speed Line | blank | blank | blank | blank | blank | blank |
| Cedar Grove | 0 | 0 | 0 | 0 | 0 | N/A |
| Butler | 1 | 40 | 0 | 0 | 0 | N/A |
| Milton | 1 | 26 | 0 | 1 | 0 | 0.91 |
| Central Avenue | 0 | 0 | 0 | 0 | 0 | N/A |
| Valley Road | 0 | 0 | 0 | 0 | 0 | N/A |
| Capen Street | 1 | 20 | 0 | 0 | 0 | N/A |
| Mattapan | 2 | 4 | 0 | 0 | 0 | N/A |
| Mattapan High-Speed Line Totals | 5 | 90 | 0 | 1 | 0 | 0.18 |
| Blue Line | blank | blank | blank | blank | blank | blank |
| Wonderland (new bicycle cage) | 23 | 140 | 1 | 2 | 3 | 0.24 |
| Revere Beach | 2 | 20 | 0 | 0 | 0 | N/A |
| Beachmont | 9 | 39 | 2 | 0 | 3 | 0.51 |
| Suffolk Downs | 0 | 34 | 0 | 0 | 0 | N/A |
| Orient Heights | 10 | 19 | 0 | 4 | 2 | 0.55 |
| Wood Island | 5 | 10 | 0 | 1 | 2 | 0.55 |
| Airport | 23 | 51 | 1 | 3 | 1 | 0.20 |
| Maverick | 4 | 48 | 0 | 1 | 2 | 0.68 |
| Aquarium | 11 | 30 | 0 | 0 | 0 | N/A |
| State | 4 | 14 | 0 | 0 | 0 | N/A |
| Government Center | 0 | 0 | 0 | 0 | 0 | N/A |
| Bowdoin | 1 | 4 | 0 | 0 | 0 | N/A |
| Blue Line Totals | 92 | 409 | 4 | 11 | 13 | 0.28 |
| Orange Line | blank | blank | blank | blank | blank | blank |
| Oak Grove (new bicycle cage) | 81 | 210 | 9 | 13 | 16 | 0.43 |
| Malden | 48 | 162 | 5 | 9 | 10 | 0.46 |
| Wellington | 4 | 9 | 1 | 1 | 0 | 0.46 |
| Sullivan Square | 21 | 18 | 1 | 3 | 2 | 0.26 |
| Community College | 8 | 30 | 2 | 0 | 0 | 0.23 |
| North Station | 23 | 70 | 0 | 0 | 0 | N/A |
| Haymarket | 1 | 2 | 1 | 0 | 0 | 0.91 |
| State | 4 | 14 | 0 | 0 | 0 | N/A |
| Downtown Crossing1 | 7 | 8 | 0 | 0 | 0 | N/A |
| Chinatown | 4 | 4 | 0 | 0 | 0 | N/A |
| Tufts Medical Center | 3 | 10 | 0 | 0 | 1 | 0.30 |
| Back Bay | 35 | 72 | 5 | 14 | 3 | 0.57 |
| Massachusetts Avenue | 2 | 41 | 2 | 0 | 4 | 2.74 |
| Ruggles | 69 | 98 | 0 | 0 | 0 | N/A |
| Roxbury Crossing | 2 | 18 | 0 | 1 | 2 | 1.37 |
| Jackson Square | 3 | 9 | 0 | 1 | 3 | 1.22 |
| Stony Brook | 6 | 9 | 0 | 2 | 3 | 0.76 |
| Green Street | 18 | 29 | 2 | 2 | 4 | 0.41 |
| Forest Hills | 35 | 128 | 3 | 4 | 16 | 0.60 |
| Orange Line Totals | 374 | 941 | 31 | 50 | 64 | 0.35 |
| Green Line Subway | blank | blank | blank | blank | blank | blank |
| Lechmere | 3 | 30 | 0 | 1 | 0 | 0.30 |
| Science Park | 1 | 7 | 0 | 0 | 0 | N/A |
| North Station | 23 | 70 | 0 | 0 | 0 | N/A |
| Haymarket | 1 | 2 | 1 | 0 | 0 | 0.91 |
| Government Center | 0 | 0 | 0 | 0 | 0 | N/A |
| Park Street1 | 2 | 6 | 0 | 0 | 0 | N/A |
| Boylston1 | 22 | 28 | 0 | 0 | 0 | N/A |
| Arlington | 8 | 10 | 0 | 0 | 0 | N/A |
| Copley | 0 | 0 | 0 | 0 | 0 | N/A |
| Hynes Convention Center | 4 | 4 | 0 | 0 | 0 | N/A |
| Kenmore | 10 | 30 | 0 | 0 | 0 | N/A |
| Prudential | 8 | 14 | 0 | 0 | 0 | N/A |
| Symphony | 0 | 6 | 0 | 0 | 0 | N/A |
| Green Line Subway Totals | 82 | 207 | 1 | 1 | 0 | 0.02 |
| Green Line B Branch | blank | blank | blank | blank | blank | blank |
| Boston College | 2 | 18 | 0 | 0 | 0 | N/A |
| South Street | N/A | 0 | 0 | 0 | 0 | N/A |
| Chestnut Hill Avenue | N/A | 0 | 0 | 0 | 0 | N/A |
| Chiswick Road | N/A | 0 | 0 | 0 | 0 | N/A |
| Sutherland Road | N/A | 0 | 0 | 0 | 0 | N/A |
| Washington Street | 0 | 4 | 0 | 0 | 0 | N/A |
| Warren Street | N/A | 0 | 0 | 0 | 0 | N/A |
| Allston Street | N/A | 0 | 0 | 0 | 0 | N/A |
| Griggs Street | N/A | 0 | 0 | 0 | 0 | N/A |
| Harvard Avenue | N/A | 0 | 0 | 0 | 0 | N/A |
| Packards Corner | N/A | 0 | 0 | 0 | 0 | N/A |
| Babcock Street | 1 | 14 | 0 | 0 | 0 | N/A |
| Pleasant Street | 1 | 2 | 0 | 0 | 0 | N/A |
| St. Paul Street | 3 | 8 | 0 | 0 | 0 | N/A |
| Boston University West | 7 | 14 | 0 | 0 | 0 | N/A |
| Boston University Central | 20 | 20 | 0 | 0 | 0 | N/A |
| Boston University East | 106 | 136 | 0 | 0 | 0 | N/A |
| Blandford Street | 5 | 8 | 0 | 0 | 0 | N/A |
| Green Line B Branch Totals | 145 | 224 | 0 | 0 | 0 | N/A |
| Green Line C Branch | blank | blank | blank | blank | blank | blank |
| Cleveland Circle | 1 | 22 | 0 | 0 | 0 | N/A |
| Englewood Avenue | N/A | 0 | 0 | 0 | 0 | N/A |
| Dean Road | N/A | 0 | 0 | 0 | 0 | N/A |
| Tappan Street | 1 | 10 | 0 | 0 | 0 | N/A |
| Washington Square | 1 | 22 | 0 | 0 | 0 | N/A |
| Fairbanks Street | N/A | 0 | 0 | 0 | 0 | N/A |
| Brandon Hall | N/A | 0 | 0 | 0 | 0 | N/A |
| Summit Avenue | 4 | 12 | 0 | 0 | 0 | N/A |
| Coolidge Corner | 25 | 82 | 0 | 0 | 0 | N/A |
| St. Paul Street | N/A | 0 | 0 | 0 | 0 | N/A |
| Kent Street | N/A | 0 | 0 | 0 | 0 | N/A |
| Hawes Street | N/A | 0 | 0 | 0 | 0 | N/A |
| St. Mary's Street | 2 | 39 | 0 | 0 | 0 | N/A |
| Green Line C Branch Totals | 34 | 187 | 0 | 0 | 0 | N/A |
| Green Line D Branch | blank | blank | blank | blank | blank | blank |
| Riverside | 9 | 36 | 0 | 2 | 1 | 0.30 |
| Woodland | 6 | 9 | 1 | 0 | 0 | 0.15 |
| Waban | 5 | 11 | 0 | 0 | 1 | 0.18 |
| Eliot | 1 | 9 | 1 | 0 | 0 | 0.91 |
| Newton Highlands | 2 | 7 | 1 | 1 | 1 | 1.37 |
| Newton Center | 16 | 18 | 2 | 0 | 0 | 0.11 |
| Chestnut Hill | 9 | 9 | 4 | 0 | 0 | 0.41 |
| Reservoir | 4 | 19 | 0 | 1 | 0 | 0.23 |
| Beaconsfield | N/A | 0 | 0 | 0 | 0 | N/A |
| Brookline Hills | 8 | 9 | 1 | 0 | 0 | 0.11 |
| Brookline Village | 15 | 26 | 0 | 0 | 1 | 0.06 |
| Longwood | 7 | 26 | 0 | 0 | 0 | N/A |
| Fenway | 13 | 28 | 0 | 0 | 0 | N/A |
| Green Line D Branch Totals | 95 | 207 | 10 | 4 | 4 | 0.17 |
| Green Line E Branch | blank | blank | blank | blank | blank | blank |
| Heath | N/A | 0 | 0 | 0 | 0 | N/A |
| Back of the Hill | N/A | 0 | 0 | 0 | 0 | N/A |
| Riverway | N/A | 0 | 0 | 0 | 0 | N/A |
| Mission Park | N/A | 0 | 0 | 0 | 0 | N/A |
| Fenwood Road | N/A | 0 | 0 | 0 | 0 | N/A |
| Brigham Circle | 4 | 11 | 0 | 0 | 0 | N/A |
| Longwood Medical Area | 12 | 14 | 0 | 0 | 0 | N/A |
| Museum of Fine Arts | 0 | 8 | 0 | 0 | 0 | N/A |
| Northeastern | 1 | 12 | 0 | 0 | 0 | N/A |
| Green Line E Branch Totals | 17 | 45 | 0 | 0 | 0 | N/A |
| Silver Line Washington Street | blank | blank | blank | blank | blank | blank |
| Dudley Square | 0 | 0 | 1 | 0 | 0 | N/A |
| Melnea Cass Boulevard | 0 | 10 | 0 | 0 | 0 | N/A |
| Lenox Street | 0 | 10 | 0 | 0 | 0 | N/A |
| Massachusetts Avenue | 0 | 5 | 0 | 0 | 0 | N/A |
| Worcester Square | 1 | 10 | 0 | 0 | 0 | N/A |
| Newton Street | 0 | 10 | 0 | 0 | 0 | N/A |
| Union Park Street | 0 | 10 | 0 | 0 | 0 | N/A |
| East Berkeley Street | 0 | 10 | 0 | 0 | 0 | N/A |
| Herald Street | 0 | 10 | 0 | 0 | 0 | N/A |
| Tufts Medical Center | 3 | 10 | 0 | 0 | 1 | 0.30 |
| Chinatown | 4 | 4 | 0 | 0 | 0 | N/A |
| Downtown Crossing1 | 7 | 8 | 0 | 0 | 0 | N/A |
| Boylston1 | 22 | 28 | 0 | 0 | 0 | N/A |
| Silver Line Washington St. Totals | 37 | 125 | 1 | 0 | 1 | 0.05 |
| Silver Line Waterfront | blank | blank | blank | blank | blank | blank |
| Airport Terminals (SL1)1 | 7 | 28 | 0 | 0 | 0 | N/A |
| Design Center1 | 4 | 7 | 0 | 0 | 0 | N/A |
| 21-25 Dry Dock Avenue1 | 14 | 39 | 0 | 0 | 0 | N/A |
| Tide Street/Northern Avenue | 0 | 4 | 0 | 0 | 0 | N/A |
| Silver Line Way1 | 3 | 7 | 0 | 0 | 0 | N/A |
| World Trade Center | 1 | 6 | 0 | 0 | 0 | N/A |
| Courthouse | 0 | 0 | 0 | 0 | 0 | N/A |
| South Station | 48 | 139 | 16 | 13 | 0 | 0.55 |
| Silver Line Waterfront Totals | 77 | 230 | 16 | 13 | 0 | 0.34 |
| Grand Total | 1,841 | 3,929 | 143 | 171 | 182 | 0.25 |
1 Bicycle rack ownership unknown. They may be provided by local establishments, municipalities, and/or the MBTA.
2 Theft rate per 1,000 parked bicycles = (Average of number of bicycle thefts per year over three years × 1,000) / (Number of bicycles parked per day × 365 days)
N/A = not applicable
| Station by Line | Bicycles Parked 2005–06 | Bicycles Parked 2009–11 | Bicycles Parked 2012 |
Bicycles Parked Percentage Change |
Bicycle Rack Spaces 2005–06 | Bicycle Rack Spaces 2009–11 | Bicycle Rack Spaces 2012 | Bicycle Rack Spaces Percentage Change |
Percent Bicycle Rack Spaces Utilized 2005–06 | Percent Bicycle Rack Spaces Utilized 2009–11 | Percent Bicycle Rack Spaces Utilized 2012 | Bicycles Parked in Other Areas in 2012 |
|---|---|---|---|---|---|---|---|---|---|---|---|---|
| Newburyport/Rockport Line | blank | blank | blank | blank | blank | blank | blank | blank | blank | blank | blank | blank |
| Rockport | 1 | 3 | 5 | 67 | 8 | 9 | 9 | 0 | 13 | 33 | 56 | 0 |
| Gloucester | 0 | 0 | 3 | N/A | 12 | 5 | 12 | 140 | 0 | 0 | 25 | 0 |
| West Gloucester | 0 | 0 | 0 | N/A | 8 | 8 | 8 | 0 | 0 | 0 | 0 | 0 |
| Manchester | 1 | 0 | 4 | N/A | 8 | 0 | 8 | N/A | 13 | N/A | 50 | 1 |
| Beverly Farms | 0 | 1 | 1 | 0 | 16 | 16 | 16 | 0 | 0 | 6 | 6 | 0 |
| Prides Crossing | 0 | 0 | 0 | N/A | 0 | 16 | 16 | 0 | N/A | 0 | 0 | 0 |
| Montserrat | 0 | 2 | 7 | 250 | 8 | 9 | 9 | 0 | 0 | 22 | 78 | 0 |
| Newburyport | 6 | 5 | 9 | 80 | 36 | 39 | 39 | 0 | 17 | 13 | 23 | 22 |
| Rowley | 1 | 0 | 2 | N/A | 12 | 13 | 13 | 0 | 8 | 0 | 15 | 0 |
| Ipswich | 0 | 9 | 2 | -78 | 16 | 9 | 9 | 0 | 0 | 100 | 22 | 1 |
| Hamilton/Wenham | 3 | 5 | 4 | -20 | 6 | 7 | 7 | 0 | 50 | 71 | 57 | 11 |
| North Beverly | 2 | 0 | 0 | N/A | 16 | 15 | 16 | 7 | 13 | 0 | 0 | 0 |
| Beverly Depot (under construction) | 2 | 2 | 5 | 150 | 16 | 12 | 12 | 0 | 13 | 17 | 42 | 3 |
| Salem | 8 | 13 | 38 | 192 | 20 | 26 | 58 | 123 | 40 | 50 | 66 | 3 |
| Swampscott | 0 | 1 | 7 | 600 | 16 | 16 | 10 | -38 | 0 | 6 | 70 | 10 |
| Lynn | 7 | 2 | 3 | 50 | 14 | 14 | 14 | 0 | 50 | 14 | 21 | 0 |
| Chelsea | 0 | 0 | 0 | N/A | 0 | 16 | 16 | 0 | N/A | 0 | 0 | 0 |
| Newburyport/Rockport Line Summary | 31 | 43 | 90 | 109% | 212 | 230 | 272 | 18% | 15% | 19% | 33% | 51 |
| Haverhill Line | blank | blank | blank | blank | blank | blank | blank | blank | blank | blank | blank | blank |
| Haverhill | 2 | 1 | 2 | 100 | 16 | 19 | 30 | 58 | 13 | 5 | 7 | 0 |
| Bradford | 2 | 1 | 3 | 200 | 12 | 16 | 17 | 6 | 17 | 6 | 18 | 0 |
| Lawrence | 6 | 7 | 3 | -57 | 12 | 10 | 18 | 80 | 50 | 70 | 17 | 0 |
| Andover | 6 | 13 | 9 | -31 | 6 | 49 | 49 | 0 | 100 | 27 | 18 | 0 |
| Ballardvale | 0 | 1 | 3 | 200 | 0 | 32 | 32 | 0 | N/A | 3 | 9 | 0 |
| North Wilmington | 0 | 2 | 4 | 100 | 0 | 16 | 16 | 0 | N/A | 13 | 25 | 0 |
| Reading | 4 | 6 | 5 | -17 | 13 | 12 | 12 | 0 | 31 | 50 | 42 | 0 |
| Wakefield | 0 | 4 | 2 | -50 | 6 | 21 | 23 | 10 | 0 | 19 | 9 | 0 |
| Greenwood | 0 | 0 | 0 | N/A | 6 | 7 | 7 | 0 | 0 | 0 | 0 | 0 |
| Melrose Highlands | 1 | 2 | 3 | 50 | 18 | 10 | 10 | 0 | 6 | 20 | 30 | 0 |
| Melrose/Cedar Park | 0 | 0 | 0 | N/A | 0 | 18 | 8 | -56 | N/A | 0 | 0 | 0 |
| Wyoming Hill | 0 | 1 | 2 | 100 | 0 | 22 | 22 | 0 | N/A | 5 | 9 | 0 |
| Haverhill Line Summary | 21 | 38 | 36 | -5% | 89 | 232 | 244 | 5% | 24% | 16% | 15% | 0 |
| Lowell Line | blank | blank | blank | blank | blank | blank | blank | blank | blank | blank | blank | blank |
| Lowell | 13 | 22 | 19 | -14 | 24 | 24 | 24 | 0 | 54 | 92 | 79 | 0 |
| North Billerica | 2 | 5 | 9 | 80 | 16 | 28 | 21 | -25 | 13 | 18 | 43 | 0 |
| Wilmington | 2 | 8 | 13 | 63 | 24 | 24 | 26 | 8 | 8 | 33 | 50 | 0 |
| Anderson RTC | 6 | 4 | 4 | 0 | 14 | 14 | 14 | 0 | 43 | 29 | 29 | 0 |
| Mishawum | N/A | N/A | 0 | N/A | N/A | N/A | 0 | N/A | N/A | N/A | N/A | 0 |
| Winchester Center | 4 | 5 | 5 | 0 | 30 | 27 | 24 | -11 | 13 | 19 | 21 | 0 |
| Wedgemere | 0 | 2 | 7 | 250 | 0 | 18 | 18 | 0 | N/A | 11 | 39 | 0 |
| West Medford | 0 | 2 | 4 | 100 | 16 | 18 | 10 | -44 | 0 | 11 | 40 | 0 |
| Lowell Line Summary | 27 | 48 | 61 | 27% | 124 | 153 | 137 | -10% | 22% | 31% | 45% | 0 |
| Fitchburg Line | blank | blank | blank | blank | blank | blank | blank | blank | blank | blank | blank | blank |
| Fitchburg | 1 | 1 | 4 | 300 | 24 | 8 | 20 | 150 | 4 | 13 | 20 | 0 |
| North Leominster | 0 | 4 | 4 | 0 | 0 | 16 | 16 | 0 | N/A | 25 | 25 | 0 |
| Shirley | 0 | 0 | 0 | N/A | 0 | 8 | 8 | 0 | N/A | 0 | 0 | 0 |
| Ayer | 0 | 2 | 3 | 50 | 12 | 28 | 34 | 21 | 0 | 7 | 9 | 0 |
| Littleton/495 | 2 | 4 | 4 | 0 | 12 | 13 | 12 | -8 | 17 | 31 | 33 | 0 |
| South Acton | 18 | 8 | 22 | 175 | 44 | 44 | 44 | 0 | 41 | 18 | 50 | 0 |
| West Concord | 1 | 3 | 5 | 67 | 18 | 10 | 10 | 0 | 6 | 30 | 50 | 5 |
| Concord | 6 | 7 | 11 | 57 | 12 | 10 | 12 | 20 | 50 | 70 | 92 | 4 |
| Lincoln | 5 | 4 | 6 | 50 | 8 | 7 | 9 | 29 | 63 | 57 | 67 | 0 |
| Silver Hill | 0 | 0 | 0 | N/A | 0 | 8 | 8 | 0 | N/A | 0 | 0 | 0 |
| Hastings | 0 | 0 | 0 | N/A | 0 | 0 | 0 | N/A | N/A | N/A | N/A | 0 |
| Kendal Green | 0 | 3 | 4 | 33 | 0 | 8 | 8 | 0 | N/A | 38 | 50 | 0 |
| Brandeis/Roberts | 0 | 0 | 0 | N/A | 24 | 16 | 24 | 50 | 0 | 0 | 0 | 0 |
| Waltham | 4 | 7 | 17 | 143 | 8 | 8 | 34 | 325 | 50 | 88 | 50 | 1 |
| Waverly | 1 | 6 | 5 | -17 | 10 | 12 | 12 | 0 | 10 | 50 | 42 | 0 |
| Belmont Center | 1 | 0 | 5 | N/A | 8 | 9 | 9 | 0 | 13 | 0 | 56 | 0 |
| Fitchburg Line Summary | 39 | 49 | 90 | 84% | 180 | 205 | 260 | 27% | 22% | 24% | 35% | 10 |
| Framingham/Worcester Line | blank | blank | blank | blank | blank | blank | BP | blank | blank | blank | blank | blank |
| Worcester | 2 | 2 | 8 | 300 | 15 | 23 | 30 | 30 | 13 | 9 | 27 | 1 |
| Grafton | 0 | 3 | 2 | -33 | 8 | 8 | 8 | 0 | 0 | 38 | 25 | 0 |
| Westborough | 1 | 3 | 6 | 100 | 8 | 24 | 20 | -17 | 13 | 13 | 30 | 4 |
| Southborough | 0 | 1 | 0 | -100 | 8 | 8 | 8 | 0 | 0 | 13 | 0 | 2 |
| Ashland | 0 | 6 | 5 | -17 | 16 | 16 | 14 | -13 | 0 | 38 | 36 | 0 |
| Framingham | 14 | 8 | 15 | 88 | 28 | 18 | 45 | 150 | 50 | 44 | 33 | 0 |
| West Natick | 8 | 4 | 12 | 200 | 16 | 23 | 23 | 0 | 50 | 17 | 52 | 0 |
| Natick | 4 | 0 | 12 | N/A | 9 | 0 | 12 | N/A | 44 | N/A | 100 | 14 |
| Wellesley Square | 7 | 0 | 6 | N/A | 48 | 16 | 12 | -25 | 15 | 0 | 50 | 2 |
| Wellesley Hills | 0 | 2 | 5 | 150 | 0 | 16 | 12 | -25 | N/A | 13 | 42 | 0 |
| Wellesley Farms | 0 | 6 | 3 | -50 | 33 | 24 | 24 | 0 | 0 | 25 | 13 | 0 |
| Auburndale | 0 | 0 | 0 | N/A | 0 | 16 | 16 | 0 | N/A | 0 | 0 | 0 |
| West Newton | 0 | 0 | 0 | N/A | 0 | 0 | 16 | N/A | N/A | N/A | 0 | 1 |
| Newtonville | 0 | 0 | 0 | N/A | 0 | 16 | 16 | 0 | N/A | 0 | 0 | 0 |
| Yawkey (under construction) | 0 | 0 | 0 | N/A | 0 | 16 | 16 | 0 | N/A | 0 | 0 | 0 |
| Framingham/Worcester Line Summary | 36 | 35 | 74 | 111% | 189 | 224 | 272 | 21% | 19% | 16% | 27% | 24 |
| Needham Line | blank | blank | blank | blank | blank | blank | blank | blank | blank | blank | blank | blank |
| Needham Heights | 0 | 3 | 0 | -100 | 6 | 7 | 7 | 0 | 0 | 43 | 0 | 0 |
| Needham Center | 2 | 4 | 0 | -100 | 6 | 7 | 7 | 0 | 33 | 57 | 0 | 1 |
| Needham Junction | 0 | 1 | 5 | 400 | 6 | 7 | 7 | 0 | 0 | 14 | 71 | 1 |
| Hersey | 4 | 11 | 8 | -27 | 12 | 26 | 26 | 0 | 33 | 42 | 31 | 0 |
| West Roxbury | 1 | 0 | 1 | N/A | 8 | 9 | 12 | 33 | 13 | 0 | 8 | 0 |
| Highland | 0 | 1 | 1 | 0 | 0 | 20 | 20 | 0 | N/A | 5 | 5 | 0 |
| Bellevue | 0 | 0 | 0 | N/A | 8 | 9 | 9 | 0 | 0 | 0 | 0 | 0 |
| Roslindale Village | 0 | 0 | 1 | N/A | 0 | 16 | 16 | 0 | N/A | 0 | 6 | 0 |
| Needham Line Summary | 7 | 20 | 16 | -20% | 46 | 101 | 104 | 3% | 15% | 20% | 15% | 2 |
| Franklin Line | blank | blank | blank | blank | blank | blank | blank | blank | blank | blank | blank | blank |
| Forge Park/495 | 0 | 0 | 1 | N/A | 17 | 7 | 14 | 100 | 0 | 0 | 7 | 4 |
| Franklin | 0 | 0 | 5 | N/A | 7 | 16 | 18 | 13 | 0 | 0 | 28 | 0 |
| Norfolk | 0 | 10 | 4 | -60 | 8 | 15 | 15 | 0 | 0 | 67 | 27 | 0 |
| Walpole | 3 | 7 | 4 | -43 | 6 | 7 | 7 | 0 | 50 | 100 | 57 | 1 |
| Plimptonville | 0 | 0 | 0 | N/A | 0 | 16 | 0 | -100 | N/A | 0 | N/A | 0 |
| Windsor Gardens | 0 | 0 | 0 | N/A | 0 | 0 | 0 | N/A | N/A | N/A | N/A | 1 |
| Norwood Central | 2 | 2 | 1 | -50 | 20 | 12 | 11 | -8 | 10 | 17 | 9 | 1 |
| Norwood Depot | 0 | 0 | 1 | N/A | 0 | 16 | 14 | -13 | N/A | 0 | 7 | 3 |
| Islington | 0 | 0 | 0 | N/A | 0 | 14 | 8 | -43 | N/A | 0 | 0 | 0 |
| Dedham Corporate Center | 0 | 1 | 1 | 0 | 0 | 14 | 16 | 14 | N/A | 7 | 6 | 0 |
| Endicott | 0 | 0 | 5 | N/A | 0 | 0 | 17 | N/A | N/A | N/A | 29 | 6 |
| Readville | 2 | 1 | 1 | 0 | 12 | 36 | 32 | -11 | 17 | 3 | 3 | 0 |
| Hyde Park | 0 | 0 | 2 | N/A | 10 | 10 | 10 | 0 | 0 | 0 | 20 | 0 |
| Franklin Line Summary | 7 | 21 | 25 | 19% | 80 | 163 | 162 | -1% | 9% | 13% | 15% | 16 |
| Fairmount Line | blank | blank | blank | blank | blank | blank | blank | blank | blank | blank | blank | blank |
| Readville | 2 | 1 | 1 | 0 | 12 | 36 | 32 | -11 | 17 | 3 | 3 | 0 |
| Fairmount | 1 | 0 | 0 | N/A | 20 | 10 | 22 | 120 | 5 | 0 | 0 | 0 |
| Morton Street | N/A | 0 | 0 | N/A | N/A | 20 | 20 | 0 | N/A | 0 | 0 | 0 |
| Uphams Corner | N/A | 2 | 0 | -100 | N/A | 10 | 10 | 0 | N/A | 20 | 0 | 0 |
| Fairmount Line Summary | 3 | 3 | 1 | -67% | 32 | 76 | 84 | 11% | 9% | 4% | 1% | 0 |
| Providence/Stoughton Line | blank | blank | blank | blank | blank | blank | BP | blank | blank | blank | blank | blank |
| Wickford Junction (New station) | N/A | N/A | 1 | NEW | N/A | N/A | 22 | NEW | N/A | N/A | 5 | 0 |
| T.F. Green Airport | N/A | 2 | 2 | 0 | N/A | 10 | 8 | -20 | N/A | 20 | 25 | 0 |
| Providence | 28 | 26 | 26 | 0 | 28 | 26 | 26 | 0 | 100 | 100 | 100 | 16 |
| South Attleboro | 0 | 0 | 1 | N/A | 10 | 16 | 26 | 63 | 0 | 0 | 4 | 0 |
| Attleboro | 4 | 3 | 9 | 200 | 15 | 16 | 17 | 6 | 27 | 19 | 53 | 6 |
| Mansfield | 3 | 20 | 4 | -80 | 9 | 25 | 33 | 32 | 33 | 80 | 12 | 3 |
| Sharon | 14 | 8 | 17 | 113 | 35 | 48 | 64 | 33 | 40 | 17 | 27 | 0 |
| Stoughton | 3 | 7 | 3 | -57 | 16 | 15 | 15 | 0 | 19 | 47 | 20 | 0 |
| Canton Center | 4 | 5 | 4 | -20 | 6 | 6 | 5 | -17 | 67 | 83 | 80 | 0 |
| Canton Junction | 3 | 0 | 7 | N/A | 48 | 64 | 57 | -11 | 6 | 0 | 12 | 2 |
| Route 128 | 4 | 0 | 6 | N/A | 63 | 60 | 48 | -20 | 6 | 0 | 13 | 0 |
| Hyde Park | 0 | 0 | 2 | N/A | 10 | 10 | 10 | 0 | 0 | 0 | 20 | 0 |
| Providence/Stoughton Line Summary | 63 | 71 | 81 | 14% | 240 | 296 | 309 | 4% | 26% | 24% | 26% | 27 |
| Middleborough/Lakeville Line | blank | blank | blank | blank | blank | blank | blank | blank | blank | blank | blank | blank |
| Middleborough/ Lakeville | 0 | 3 | 4 | 33 | 12 | 8 | 9 | 13 | 0 | 38 | 44 | 0 |
| Bridgewater | 6 | 6 | 4 | -33 | 24 | 27 | 26 | -4 | 25 | 22 | 15 | 0 |
| Campello | 0 | 1 | 0 | -100 | 8 | 8 | 9 | 13 | 0 | 13 | 0 | 1 |
| Brockton | 2 | 0 | 0 | N/A | 16 | 4 | 9 | 125 | 13 | 0 | 0 | 5 |
| Montello | 1 | 1 | 2 | 100 | 18 | 16 | 19 | 19 | 6 | 6 | 11 | 0 |
| Holbrook/ Randolph | 1 | 6 | 2 | -67 | 12 | 16 | 9 | -44 | 8 | 38 | 22 | 1 |
| Middleborough/Lakeville Line Summary | 10 | 17 | 12 | -29% | 90 | 79 | 81 | 3% | 11% | 22% | 15% | 7 |
| Kingston/Plymouth Line | blank | blank | blank | blank | blank | blank | blank | blank | blank | blank | blank | blank |
| Plymouth | 0 | 0 | 0 | N/A | 16 | 0 | 0 | N/A | 0 | N/A | N/A | 0 |
| Kingston | 1 | 0 | 2 | N/A | 36 | 32 | -11 | N/A | 0 | 6 | 0 | |
| Halifax | 3 | 3 | 3 | 0 | 20 | 8 | 18 | 125 | 15 | 38 | 17 | 0 |
| Hanson | 2 | 1 | 2 | 100 | 16 | 8 | 8 | 0 | 13 | 13 | 25 | 0 |
| Whitman | 2 | 0 | 8 | N/A | 12 | 8 | 8 | 0 | 17 | 0 | 100 | 0 |
| Abington | 3 | 3 | 3 | 0 | 12 | 5 | 8 | 60 | 25 | 60 | 38 | 0 |
| South Weymouth | 2 | 1 | 1 | 0 | 14 | 14 | 10 | -29 | 14 | 7 | 10 | 0 |
| Kingston/Plymouth Line Summary | 13 | 8 | 19 | 138% | 98 | 79 | 84 | 6% | 13% | 10% | 23% | 0 |
| Greenbush Line | blank | blank | blank | blank | blank | blank | blank | blank | blank | blank | blank | blank |
| Greenbush | N/A | 2 | 7 | 250 | N/A | 15 | 17 | 13 | N/A | 13 | 41 | 0 |
| North Scituate | N/A | 3 | 3 | 0 | N/A | 7 | 7 | 0 | N/A | 43 | 43 | 2 |
| Cohasset | N/A | 2 | 6 | 200 | N/A | 7 | 17 | 143 | N/A | 29 | 35 | 0 |
| Nantasket Junction | N/A | 2 | 1 | -50 | N/A | 7 | 17 | 143 | N/A | 29 | 6 | 0 |
| West Hingham | N/A | 5 | 4 | -20 | N/A | 7 | 17 | 143 | N/A | 71 | 24 | 0 |
| East Weymouth | N/A | 1 | 2 | 100 | N/A | 7 | 17 | 143 | N/A | 14 | 12 | 0 |
| Weymouth Landing/East Braintree | N/A | 3 | 2 | -33 | N/A | 7 | 17 | 143 | N/A | 43 | 12 | 0 |
| Greenbush Line Summary | N/A | 18 | 25 | 39% | 0 | 57 | 109 | 91% | N/A | 32% | 23% | 2 |
| Grand Total | 255 | 370 | 527 | 42% | 1,358 | 1,849 | 2,076 | 12% | 19% | 20% | 25% | 139 |
| Commuter Rail Line | Station Name | Type of Bicycle Rack | Covered Bicycle Rack | Bicycle Trail/Path | Condition of Trail/Path | Connecting Bus Route | Bicycle Cage (P&P) or Port (BP) Proposed or Installed1 |
|---|---|---|---|---|---|---|---|
| Newburyport/Rockport | Rockport | R | None | None | N/A | Yes | N/A |
| Newburyport/Rockport | Gloucester | U | None | None | N/A | Yes | N/A |
| Newburyport/Rockport | West Gloucester | R | None | None | N/A | NO | N/A |
| Newburyport/Rockport | Manchester | R | None | None | N/A | NO | N/A |
| Newburyport/Rockport | Beverly Farms | D | None | None | N/A | No | N/A |
| Newburyport/Rockport | Prides Crossing | D | None | None | N/A | No | N/A |
| Newburyport/Rockport | Montserrat | R | None | None | N/A | No | N/A |
| Newburyport/Rockport | Newburyport | R | None | None | N/A | No | N/A |
| Newburyport/Rockport | Rowley | R | None | None | N/A | No | N/A |
| Newburyport/Rockport | Ipswich | R | None | None | N/A | No | N/A |
| Newburyport/Rockport | Hamilton/Wenham | R | None | Yes | Good | No | N/A |
| Newburyport/Rockport | North Beverly | D | None | None | N/A | No | N/A |
| Newburyport/Rockport | Beverly Depot | D | All | None | N/A | Yes | P&P |
| Newburyport/Rockport | Salem | R, U, H | None | None | N/A | Yes | BP |
| Newburyport/Rockport | Swampscott | H | None | None | N/A | Yes | N/A |
| Newburyport/Rockport | Lynn | U | None | None | N/A | Yes | N/A |
| Newburyport/Rockport | Chelsea | D | None | None | N/A | Yes | N/A |
| Haverhill | Haverhill | R, U | Some | None | N/A | Yes | BP |
| Haverhill | Bradford | R, H | None | None | N/A | Yes | N/A |
| Haverhill | Lawrence | Spiral | None | None | N/A | No | N/A |
| Haverhill | Andover | D, R, U | Some | None | N/A | Yes | BP |
| Haverhill | Ballardvale | D | None | None | N/A | No | N/A |
| Haverhill | North Wilmington | D | None | None | N/A | No | N/A |
| Haverhill | Reading | D | None | None | N/A | Yes | N/A |
| Haverhill | Wakefield | D, R | None | None | N/A | Yes | N/A |
| Haverhill | Greenwood | R | None | None | N/A | Yes | N/A |
| Haverhill | Melrose Highlands | H | None | None | N/A | Yes | N/A |
| Haverhill | Melrose/Cedar Park | D | None | None | N/A | Yes | N/A |
| Haverhill | Wyoming Hill | U, H | Some | None | N/A | Yes | BP |
| Lowell | Lowell | U, R | All | None | N/A | Yes | N/A |
| Lowell | North Billerica | U, R | Some | None | N/A | No | BP |
| Lowell | Wilmington | R | None | None | N/A | No | N/A |
| Lowell | Anderson RTC | U | All | None | N/A | Yes | N/A |
| Lowell | Mishawum | None | None | None | N/A | No | N/A |
| Lowell | Winchester Center | D, U | Some | Yes | Good | Yes | N/A |
| Lowell | Wedgemere | D | All | Yes | Good | No | N/A |
| Lowell | West Medford | H | None | None | N/A | Yes | N/A |
| Fitchburg | Fitchburg | D | None | None | N/A | No | N/A |
| Fitchburg | North Leominster | D | None | None | N/A | No | N/A |
| Fitchburg | Shirley | D | None | None | N/A | No | N/A |
| Fitchburg | Ayer | U, D | Some | Yes | Good | No | N/A |
| Fitchburg | Littleton/495 | D | None | None | N/A | No | N/A |
| Fitchburg | South Acton | U, Lockers | Some | Yes | Good | No | N/A |
| Fitchburg | West Concord | U | None | None | N/A | No | N/A |
| Fitchburg | Concord | U | None | None | N/A | No | N/A |
| Fitchburg | Lincoln | R | None | None | N/A | No | N/A |
| Fitchburg | Silver Hill | H | None | None | N/A | No | N/A |
| Fitchburg | Hastings | None | None | None | N/A | No | N/A |
| Fitchburg | Kendal Green | H | All | None | N/A | No | N/A |
| Fitchburg | Brandeis/Roberts | D, U | None | None | N/A | No | N/A |
| Fitchburg | Waltham | D, U | Some | None | N/A | Yes | BP |
| Fitchburg | Waverly | U | All | None | N/A | Yes | BP |
| Fitchburg | Belmont Center | R | None | None | N/A | Yes | N/A |
| Framingham/Worcester | Worcester | R, U | All | None | N/A | Yes | BP |
| Framingham/Worcester | Grafton | U | None | None | N/A | No | N/A |
| Framingham/Worcester | Westborough | D | None | None | N/A | No | N/A |
| Framingham/Worcester | Southborough | U | None | Yes | N/A | No | N/A |
| Framingham/Worcester | Ashland | U | None | None | N/A | No | N/A |
| Framingham/Worcester | Framingham | R, D | Some | None | N/A | No | N/A |
| Framingham/Worcester | West Natick | D, R | None | None | N/A | Yes | N/A |
| Framingham/Worcester | Natick | P, U | None | None | N/A | Yes | N/A |
| Framingham/Worcester | Wellesley Square | U | All | None | N/A | No | BP |
| Framingham/Worcester | Wellesley Hills | U | All | None | N/A | No | BP |
| Framingham/Worcester | Wellesley Farms | D | Some | None | N/A | No | N/A |
| Framingham/Worcester | Auburndale | D | None | None | N/A | Yes | N/A |
| Framingham/Worcester | West Newton | D | None | None | N/A | Yes | N/A |
| Framingham/Worcester | Newtonville | D | None | None | N/A | Yes | N/A |
| Framingham/Worcester | Yawkey (under construction) | D | None | None | N/A | Yes | N/A |
| Needham | Needham Heights | R | None | None | N/A | Yes | N/A |
| Needham | Needham Center | R | None | None | N/A | Yes | N/A |
| Needham | Needham Junction | R | None | None | N/A | Yes | N/A |
| Needham | Hersey | D, R, U | Some | None | N/A | No | BP |
| Needham | West Roxbury | U | All | None | N/A | Yes | BP |
| Needham | Highland | D, U | None | None | N/A | Yes | BP |
| Needham | Bellevue | R | None | None | N/A | Yes | N/A |
| Needham | Roslindale Village | D | None | None | N/A | Yes | N/A |
| Franklin | Forge Park/495 | U | None | None | N/A | No | N/A |
| Franklin | Franklin | D, U | None | None | N/A | No | N/A |
| Franklin | Norfolk | R, U | None | None | N/A | No | N/A |
| Franklin | Walpole | R | All | None | N/A | Yes | N/A |
| Franklin | Plimptonville | None | None | None | N/A | No | N/A |
| Franklin | Windsor Gardens | None | None | None | N/A | No | N/A |
| Franklin | Norwood Central | R | None | None | N/A | Yes | N/A |
| Franklin | Norwood Depot | H | None | None | N/A | Yes | N/A |
| Franklin | Islington | U | Some | None | N/A | No | N/A |
| Franklin | Dedham Corporate Center | D | All | None | N/A | No | N/A |
| Franklin | Endicott | H | None | None | N/A | No | N/A |
| Franklin | Readville | U | None | None | N/A | Yes | N/A |
| Franklin | Hyde Park | U | None | None | N/A | Yes | N/A |
| Fairmount | Readville | U | None | None | N/A | Yes | N/A |
| Fairmount | Fairmount | R | None | None | N/A | Yes | BP |
| Fairmount | Morton Street | U | Some | None | N/A | Yes | BP |
| Fairmount | Uphams Corner | U | None | None | N/A | Yes | N/A |
| Providence/Stoughton | Wickford Junction (new station) | U | All | None | N/A | No | N/A |
| Providence/Stoughton | T.F. Green Airport | D | All | None | N/A | Yes | N/A |
| Providence/Stoughton | Providence | L | Some | None | N/A | Yes | N/A |
| Providence/Stoughton | South Attleboro | D | None | None | N/A | Yes | N/A |
| Providence/Stoughton | Attleboro | R, D | Some | None | N/A | Yes | N/A |
| Providence/Stoughton | Mansfield | R, H | None | Yes | Good | Yes | N/A |
| Providence/Stoughton | Sharon | U, H | None | None | N/A | No | N/A |
| Providence/Stoughton | Stoughton | D, U | All | None | N/A | Yes | N/A |
| Providence/Stoughton | Canton Center | D | None | None | N/A | Yes | N/A |
| Providence/Stoughton | Canton Junction | D, R | Some | None | N/A | No | N/A |
| Providence/Stoughton | Route 128 | D | All | None | N/A | No | N/A |
| Providence/Stoughton | Hyde Park | U | None | None | N/A | Yes | N/A |
| Middleborough/Lakeville | Middleborough/Lakeville | R | None | None | N/A | No | N/A |
| Middleborough/Lakeville | Bridgewater | U | None | None | N/A | No | N/A |
| Middleborough/Lakeville | Campello | R | None | None | N/A | No | N/A |
| Middleborough/Lakeville | Brockton | R | None | None | N/A | Yes | N/A |
| Middleborough/Lakeville | Montello | U, R | All | None | N/A | Yes | BP |
| Middleborough/Lakeville | Holbrook/Randolph | R | None | None | N/A | Yes | BP |
| Kingston/Plymouth | Plymouth | None | None | None | N/A | Yes | N/A |
| Kingston/Plymouth | Kingston | D | None | None | N/A | Yes | N/A |
| Kingston/Plymouth | Halifax | U, H | None | None | N/A | No | N/A |
| Kingston/Plymouth | Hanson | U | None | None | N/A | No | N/A |
| Kingston/Plymouth | Whitman | U | None | None | N/A | No | N/A |
| Kingston/Plymouth | Abington | U | None | None | N/A | No | N/A |
| Kingston/Plymouth | South Weymouth | U | None | None | N/A | No | BP |
| Greenbush | Greenbush | R, H | None | None | N/A | No | N/A |
| Greenbush | North Scituate | R | None | None | N/A | No | N/A |
| Greenbush | Cohasset | R, H | None | None | N/A | No | N/A |
| Greenbush | Nantasket Junction | R, H | None | None | N/A | No | N/A |
| Greenbush | West Hingham | D, H | Some | None | N/A | No | N/A |
| Greenbush | East Weymouth | R, H | None | None | N/A | Yes | N/A |
| Greenbush | Weymouth Landing/E. Braintree | R, H | None | None | N/A | Yes | BP |
1 By MBTA as of September 2013.
U = inverted-U
R = ribbon
P&P = Pedal & Park (bicycle cage)
D = dish rack
P = post (double or single)
N/A = not applicable
| Station by Line | Bicycles Parked 2012 |
Bicycle Rack Spaces 2012 | Bicycle Thefts 2010 | Bicycle Thefts 2011 | Bicycle Thefts 2012 | Bikes Stolen per 1,000 Parked1 |
|---|---|---|---|---|---|---|
| Newburyport/Rockport Line | blank | blank | blank | blank | blank | blank |
| Rockport | 5 | 9 | 0 | 0 | 0 | N/A |
| Gloucester | 3 | 12 | 0 | 0 | 0 | N/A |
| West Gloucester | 0 | 8 | 0 | 0 | 0 | N/A |
| Manchester | 4 | 8 | 0 | 0 | 0 | N/A |
| Beverly Farms | 1 | 16 | 0 | 0 | 0 | N/A |
| Prides Crossing | 0 | 16 | 0 | 0 | 0 | N/A |
| Montserrat | 7 | 9 | 0 | 0 | 0 | N/A |
| Newburyport | 9 | 39 | 0 | 1 | 0 | 0.10 |
| Rowley | 2 | 13 | 0 | 0 | 0 | N/A |
| Ipswich | 2 | 9 | 0 | 0 | 0 | N/A |
| Hamilton/Wenham | 4 | 7 | 0 | 0 | 0 | N/A |
| North Beverly | 0 | 16 | 0 | 0 | 0 | N/A |
| Beverly Depot | 5 | 12 | 0 | 0 | 0 | N/A |
| Salem | 38 | 58 | 3 | 10 | 0 | 0.31 |
| Swampscott | 7 | 10 | 1 | 0 | 1 | 0.26 |
| Lynn | 3 | 14 | 1 | 0 | 0 | 0.30 |
| Chelsea | 0 | BP | 0 | 0 | 0 | N/A |
| Newburyport/Rockport Line Totals | 90 | 272 | 5 | 11 | 1 | 0.17 |
| Haverhill Line | blank | blank | blank | blank | blank | blank |
| Haverhill | 2 | 30 | 0 | 0 | 0 | N/A |
| Bradford | 3 | 17 | 0 | 0 | 0 | N/A |
| Lawrence | 3 | 18 | 0 | 0 | 0 | N/A |
| Andover | 9 | 49 | 0 | 0 | 0 | N/A |
| Ballardvale | 3 | 32 | 0 | 0 | 0 | N/A |
| North Wilmington | 4 | 16 | 0 | 0 | 0 | N/A |
| Reading | 5 | 12 | 0 | 0 | 0 | N/A |
| Wakefield | 2 | 23 | 0 | 0 | 0 | N/A |
| Greenwood | 0 | 7 | 0 | 0 | 0 | N/A |
| Melrose Highlands | 3 | 10 | 0 | 0 | 0 | N/A |
| Melrose/Cedar Park | 0 | 8 | 0 | 0 | 0 | N/A |
| Wyoming Hill | 2 | 22 | 0 | 0 | 0 | N/A |
| Haverhill Line Totals | 36 | 244 | 0 | 0 | 0 | N/A |
| Lowell Line | blank | blank | blank | blank | blank | blank |
| Lowell | 19 | 24 | 0 | 0 | 0 | N/A |
| North Billerica | 9 | 21 | 0 | 0 | 0 | N/A |
| Wilmington | 13 | 26 | 0 | 1 | 0 | 0.07 |
| Anderson RTC | 4 | 14 | 0 | 0 | 0 | N/A |
| Mishawum | 0 | 0 | 0 | 0 | 0 | N/A |
| Winchester Center | 5 | 24 | 0 | 0 | 0 | N/A |
| Wedgemere | 7 | 18 | 0 | 0 | 0 | N/A |
| West Medford | 4 | 10 | 1 | 0 | 0 | 0.23 |
| Lowell Line Totals | 61 | 137 | 1 | 1 | 0 | 0.03 |
| Fitchburg Line | blank | blank | blank | blank | blank | blank |
| Fitchburg | 4 | 20 | 0 | 0 | 0 | N/A |
| North Leominster | 4 | 16 | 0 | 0 | 0 | N/A |
| Shirley | 0 | 8 | 0 | 0 | 0 | N/A |
| Ayer | 3 | 34 | 0 | 0 | 0 | N/A |
| Littleton/495 | 4 | 12 | 0 | 0 | 0 | N/A |
| South Acton | 22 | 44 | 0 | 0 | 1 | 0.04 |
| West Concord | 5 | 10 | 0 | 0 | 0 | N/A |
| Concord | 11 | 12 | 0 | 0 | 0 | N/A |
| Lincoln | 6 | 9 | 0 | 0 | 0 | N/A |
| Silver Hill | 0 | 8 | 0 | 0 | 0 | N/A |
| Hastings | 0 | 0 | 0 | 0 | 0 | N/A |
| Kendal Green | 4 | 8 | 0 | 0 | 0 | N/A |
| Brandeis/Roberts | 0 | 24 | 0 | 0 | 0 | N/A |
| Waltham | 17 | 34 | 1 | 1 | 0 | 0.11 |
| Waverly | 5 | 12 | 0 | 0 | 0 | N/A |
| Belmont Center | 5 | 9 | 0 | 0 | 0 | N/A |
| Fitchburg Line Totals | 90 | 260 | 1 | 1 | 1 | 0.03 |
| Framingham/Worcester Line | blank | blank | blank | blank | blank | blank |
| Worcester | 8 | 30 | 0 | 0 | 0 | N/A |
| Grafton | 2 | 8 | 0 | 0 | 0 | N/A |
| Westborough | 6 | 20 | 0 | 0 | 0 | N/A |
| Southborough | 0 | 8 | 0 | 0 | 0 | N/A |
| Ashland | 5 | 14 | 0 | 0 | 0 | N/A |
| Framingham | 15 | 45 | 0 | 0 | 0 | N/A |
| West Natick | 12 | 23 | 0 | 0 | 1 | 0.08 |
| Natick | 12 | 12 | 0 | 0 | 0 | N/A |
| Wellesley Square | 6 | 12 | 0 | 0 | 0 | N/A |
| Wellesley Hills | 5 | 12 | 0 | 0 | 0 | N/A |
| Wellesley Farms | 3 | 24 | 0 | 0 | 0 | N/A |
| Auburndale | 0 | 16 | 0 | 0 | 0 | N/A |
| West Newton | 0 | 16 | 0 | 0 | 0 | N/A |
| Newtonville | 0 | 16 | 0 | 0 | 0 | N/A |
| Yawkey | 0 | 16 | 0 | 0 | 0 | N/A |
| Framingham/Worcester Line Totals | 74 | 272 | 0 | 0 | 1 | 0.01 |
| Needham Line | blank | blank | blank | blank | blank | blank |
| Needham Heights | 0 | 7 | 0 | 0 | 0 | N/A |
| Needham Center | 0 | 7 | 0 | 0 | 0 | N/A |
| Needham Junction | 5 | 7 | 0 | 0 | 0 | N/A |
| Hersey | 8 | 26 | 0 | 0 | 0 | N/A |
| West Roxbury | 1 | 12 | 0 | 0 | 0 | N/A |
| Highland | 1 | 20 | 0 | 0 | 0 | N/A |
| Bellevue | 0 | 9 | 1 | 0 | 0 | N/A |
| Roslindale Village | 1 | 16 | 0 | 0 | 0 | N/A |
| Needham Line Totals | 16 | 104 | 1 | 0 | 0 | 0.06 |
| Franklin Line | blank | blank | blank | blank | blank | blank |
| Forge Park/495 | 1 | 14 | 0 | 0 | 0 | N/A |
| Franklin | 5 | 18 | 0 | 0 | 0 | N/A |
| Norfolk | 4 | 15 | 0 | 0 | 0 | N/A |
| Walpole | 4 | 7 | 0 | 0 | 1 | 0.23 |
| Plimptonville | 0 | 0 | 0 | 0 | 0 | N/A |
| Windsor Gardens | 0 | 0 | 0 | 0 | 0 | N/A |
| Norwood Central | 1 | 11 | 0 | 0 | 0 | N/A |
| Norwood Depot | 1 | 14 | 0 | 0 | 0 | N/A |
| Islington | 0 | 8 | 0 | 0 | 0 | N/A |
| Dedham Corporate Center | 1 | 16 | 0 | 0 | 0 | N/A |
| Endicott | 5 | 17 | 0 | 0 | 0 | N/A |
| Readville | 1 | 32 | 0 | 1 | 0 | 0.91 |
| Hyde Park | 2 | 10 | 0 | 0 | 0 | N/A |
| Franklin Line Totals | 25 | 162 | 0 | 1 | 1 | 0.07 |
| Fairmount Line | blank | blank | blank | blank | blank | blank |
| Readville | 1 | 32 | 0 | 1 | 0 | 0.91 |
| Fairmount | 0 | 22 | 0 | 0 | 0 | N/A |
| Morton Street | 0 | 20 | 0 | 0 | 0 | N/A |
| Uphams Corner | 0 | 10 | 0 | 0 | 0 | N/A |
| Fairmount Line Totals | 1 | 84 | 0 | 1 | 0 | 0.91 |
| Providence/Stoughton Line | blank | blank | blank | blank | blank | blank |
| Wickford Junction (new station) | 1 | 22 | N/A | N/A | N/A | N/A |
| T.F. Green Airport | 2 | 8 | N/A | N/A | N/A | N/A |
| Providence | 26 | 26 | 0 | 0 | 0 | N/A |
| South Attleboro | 1 | 26 | 0 | 0 | 0 | N/A |
| Attleboro | 9 | 17 | 0 | 0 | 1 | 0.10 |
| Mansfield | 4 | 33 | 0 | 0 | 0 | N/A |
| Sharon | 17 | 64 | 0 | 0 | 0 | N/A |
| Stoughton | 3 | 15 | 0 | 0 | 0 | N/A |
| Canton Center | 4 | 5 | 0 | 0 | 0 | N/A |
| Canton Junction | 7 | 57 | 0 | 0 | 0 | N/A |
| Route 128 | 6 | 48 | 0 | 0 | 0 | N/A |
| Hyde Park | 2 | 10 | 0 | 0 | 0 | N/A |
| Providence/Stoughton Line Totals | 81 | 309 | 0 | 0 | 1 | 0.0 |
| Middleborough/Lakeville Line | blank | blank | blank | blank | blank | blank |
| Middleborough/Lakeville | 4 | 9 | 0 | 0 | 0 | N/A |
| Bridgewater | 4 | 26 | 0 | 0 | 0 | N/A |
| Campello | 0 | 9 | 0 | 0 | 0 | N/A |
| Brockton | 0 | 9 | 0 | 0 | 0 | N/A |
| Montello | 2 | 19 | 0 | 1 | 0 | 0.46 |
| Holbrook/Randolph | 2 | 9 | 1 | 0 | 1 | 0.91 |
| Middleborough/Lakeville Line Totals | 12 | 81 | 1 | 1 | 1 | 0.23 |
| Kingston/Plymouth Line | blank | blank | blank | blank | blank | blank |
| Plymouth | 0 | 0 | 0 | 0 | 0 | N/A |
| Kingston | 2 | 32 | 0 | 0 | 0 | N/A |
| Halifax | 3 | 18 | 0 | 1 | 0 | 0.30 |
| Hanson | 2 | 8 | 0 | 1 | 0 | 0.46 |
| Whitman | 8 | 8 | 0 | 1 | 2 | 0.34 |
| Abington | 3 | 8 | 1 | 0 | 1 | 0.61 |
| South Weymouth | 1 | 10 | 0 | 4 | 3 | 6.39 |
| Kingston/Plymouth Line Totals | 19 | 84 | 1 | 7 | 6 | 0.67 |
| Greenbush Line | blank | blank | blank | blank | blank | blank |
| Greenbush | 7 | 17 | 1 | 0 | 0 | 0.13 |
| North Scituate | 3 | 7 | 1 | 1 | 0 | 0.61 |
| Cohasset | 6 | 17 | 0 | 1 | 0 | 0.15 |
| Nantasket Junction | 1 | 17 | 1 | 0 | 0 | 0.91 |
| West Hingham | 4 | 17 | 0 | 0 | 0 | N/A |
| East Weymouth | 2 | 17 | 0 | 2 | 0 | 0.91 |
| Weymouth Landing/E. Braintree | 2 | 17 | 0 | 0 | 0 | N/A |
| Greenbush Line Totals | 25 | 109 | 3 | 4 | 0 | 0.26 |
| Grand total | 527 | 2,076 | 13 | 26 | 12 | 0.09 |
1 Theft rate per 1,000 parked bicycles = (Average of number of bicycle thefts per year over three years × 1,000) / (Number of bicycles parked per day × 365 days)
N/A = not applicable
| Station by Line | Bicycles Parked 2005–06 | Bicycles Parked 2009–11 | Bicycles Parked 2012 |
Bicycles Parked Percentage Change |
Bicycle Rack Spaces 2005–06 | Bicycle Rack Spaces 2009–11 | Bicycle Rack Spaces 2012 | Bicycle Rack Spaces Percentage Change |
Percent Bicycle Rack Spaces Utilized 2005–06 | Percent Bicycle Rack Spaces Utilized 2009–11 | Percent Bicycle Rack Spaces Utilized 2012 | Bicycles Parked in Other Areas in 2012 |
|---|---|---|---|---|---|---|---|---|---|---|---|---|
| Commuter Boat Totals | blank | blank | blank | blank | blank | blank | blank | blank | blank | blank | blank | blank |
| Hull | 0 | 2 | 0 | NEW | 0 | 8 | 10 | 25 | N/A | 25 | 0 | 0 |
| Hingham | 4 | 9 | 9 | 0 | 20 | 16 | 24 | 50 | 20 | 56 | 38 | 0 |
| Quincy/Fore River | 0 | 0 | 1 | N/A | 0 | 0 | 8 | N/A | N/A | N/A | 13 | 0 |
| Charlestown Navy Yard | 0 | 0 | 0 | NEW | 0 | 2 | 28 | 1300 | N/A | 0 | 0 | 0 |
| Rowes Wharf | N/A | 0 | 0 | N/A | N/A | 0 | 0 | N/A | N/A | N/A | N/A | 0 |
| Long Wharf | N/A | 0 | 0 | N/A | N/A | 0 | 0 | N/A | N/A | N/A | N/A | 0 |
| Commuter Boat Totals | 4 | 11 | 10 | -9% | 20 | 26 | 70 | 169% | 20% | 42% | 14% | 0 |
| Bus Facilities Totals | blank | blank | blank | blank | blank | blank | blank | blank | blank | blank | blank | blank |
| Watertown Square | 6 | 11 | 10 | -9 | 10 | 12 | 12 | 0 | 0 | 60 | 83 | 1 |
| Watertown Yard | 0 | 1 | 2 | 100 | 4 | 5 | 4 | -20 | 0 | 0 | 50 | 7 |
| Woburn Yard | 0 | 0 | 0 | N/A | 0 | 0 | 0 | N/A | 0 | 0 | N/A | 0 |
| Bus Facilities Totals | 6 | 12 | 12 | 0% | 14 | 17 | 16 | -6% | N/A | 71% | 75% | 8 |
Note: Percentage change refers to the change from the 2009-11 survey to the 2012 survey.
N/A = not applicable
NEW = new bicycle capacity as of the 2012 survey
| Facility | Station Name | Type of Bicycle Rack | Covered Bicycle Racks | Bicycle Trails/ Paths | Condition of Trails/Paths | Connecting Bus Routes | Bicycle Cage (P&P) or Port (BP) Proposed or Installed1 |
|---|---|---|---|---|---|---|---|
| Commuter Boat | Hull | U | None | No | N/A | No | N/A |
| Commuter Boat | Hingham | U | None | No | N/A | No | N/A |
| Commuter Boat | Quincy/Fore River | U | None | No | N/A | No | N/A |
| Commuter Boat | Charlestown Navy Yard | P | None | No | N/A | Yes | N/A |
| Commuter Boat | Rowes Wharf | None | None | No | N/A | Yes | N/A |
| Commuter Boat | Long Wharf | None | None | No | N/A | Yes | N/A |
| Bus Facilities | Watertown Square | D | None | Yes | Good | Yes | BP |
| Bus Facilities | Watertown Yard | R | None | Yes | Good | Yes | N/A |
| Bus Facilities | Woburn Yard | None | None | No | N/A | No | N/A |
1 By MBTA as of September 2013.
U = inverted-U
R = ribbon
P&P = Pedal & Park (bicycle cage)
D = dish rack
P = post (double or single)
N/A = not applicable
| Station | Line | Bicycles Not Parked at Racks | Bicycles Parked at Racks | Total of Bicycles Parked at Racks and Bicycles Not Parked at Racks |
Bicycle Parking Spaces at or near Station |
Utilization if All Bicycles Where Parked at Racks at Bicycle Racks |
Locations of Bicycles Not Parked at Racks |
P&P or BP Already Planned? |
Recommended Improvement |
|---|---|---|---|---|---|---|---|---|---|
| Alewife | Red | 24 | 341 | 365 | 387 | 94% | Railing, tree | Yes | Install the planned bicycle ports near existing bicycle racks. |
| Davis | Red | 10 | 186 | 196 | 262 | 75% | Poles, fences | Yes | No additional recommendation. |
| Porter | Red | 8 | 41 | 49 | 140 | 35% | Poles, fences | Yes | No recommendation. |
| Harvard | Red | 26 | 34 | 60 | 42 | 143% | Poles, fences | No | Install additional racks (possibly City of Cambridge racks). Install a Pedal & Park facility. |
| Central | Red | 19 | 104 | 123 | 140 | 88% | Poles, fences | No | Install additional racks (near capacity). |
| Kendall/MIT | Red | 19 | 66 | 85 | 64 | 133% | Poles, fences | No | Install additional racks (possibly City of Boston racks). |
| Charles/MGH | Red | 2 | 6 | 8 | 8 | 100% | Fence by hotel | No | Install additional bicycle racks (at capacity). |
| Park Street | Red | 3 | 2 | 5 | 6 | 83% | Poles | No | Install additional bicycle racks (near capacity). |
| Downtown Crossing | Red | 2 | 7 | 9 | 8 | 113% | Station furniture | No | Install additional bicycle racks on the corner of Washington Street and Temple Place. |
| South Station | Red | 6 | 48 | 54 | 139 | 39% | None | No | Add signage directing bicyclists to Pedal & Park facility. Install bicycle racks near recurring non-rack parking. |
| Andrew | Red | 2 | 6 | 8 | 14 | 57% | Fences | Yes | Consider installing Pedal & Park facility instead of bicycle ports (high theft rate). |
| Quincy Center | Red | 6 | 17 | 23 | 40 | 58% | None | No | Install Pedal & Park (high theft rate and many parked bicycles). |
| Wollaston | Red | 2 | 38 | 40 | 40 | 100% | Post | No | Install additional bicycle racks (at capacity). |
| Braintree | Red | 5 | 21 | 26 | 136 | 19% | Poles, railing | Yes | Install signage directing bicyclists to bicycle cage. |
| Ashmont | Red | 2 | 2 | 4 | 7 | 57% | Fence | No | Install additional bicycle racks (near capacity). |
| Wonderland | Blue | 2 | 23 | 25 | 140 | 18% | Poles, fences | Yes | Add additional signage directing bicyclists to parking. |
| Revere Beach | Blue | 1 | 2 | 3 | 20 | 15% | Fence | Yes | No recommendation. |
| Orient Heights | Blue | 4 | 10 | 14 | 19 | 74% | Fence | No | Install sheltered bicycle racks on Bennington Street side of station. |
| Wood Island | Blue | 4 | 5 | 9 | 10 | 90% | Posts | No | Install additional bicycle racks (near capacity). |
| Maverick | Blue | 6 | 4 | 10 | 48 | 21% | Posts | No | Add signage directing bicyclists to bicycle racks. |
| Government Center | Blue | 5 | 0 | 5 | 0 | NP | Near Planet Fitness | No | Install sheltered bicycle racks (no bicycle parking). |
| Bowdoin | Blue | 4 | 1 | 5 | 4 | 125% | Fences near entrance | No | Install additional bicycle racks (over capacity). |
| Oak Grove | Orange | 10 | 81 | 91 | 210 | 43% | Fence | Yes | No recommendation. Pedal & Park facility installed in October 2012. |
| Malden | Orange | 16 | 48 | 64 | 162 | 40% | Fence near bus connection | No | Install signs directing users to existing racks or install new bicycle racks at the bus connection. |
| Sullivan Square | Orange | 7 | 21 | 28 | 18 | 156% | Posts | Yes | No additional recommendation. New bicycle ports should take care of the issue. |
| State Street | Orange | 5 | 4 | 9 | 14 | 64% | Poles | No | Install signage directing users to existing racks. |
| Downtown Crossing | Orange | 2 | 7 | 9 | 8 | 113% | Poles | No | Install additional bicycle racks (over capacity). |
| Chinatown | Orange | 2 | 4 | 6 | 4 | 150% | Poles | No | Install additional bicycle racks (over capacity). |
| Back Bay | Orange | 5 | 35 | 40 | 72 | 56% | Poles | Yes | Install Pedal & Park facility (high theft rate and many parked bicycles). |
| Ruggles | Orange | 12 | 69 | 81 | 98 | 83% | Poles, fences | No | Install signage directing users to existing racks. |
| Green Street | Orange | 1 | 18 | 19 | 29 | 66% | Tree | Yes | Install the new bicycle port close to the west side of the station. |
| Lechmere | Green - Subway | 4 | 3 | 7 | 30 | 23% | Posts | No | No recommendations. |
| Government Center | Green - Subway | 5 | 0 | 5 | 0 | NP | Near Planet Fitness | No | Install sheltered bicycle racks (no bicycle parking). |
| Park Street | Green - Subway | 3 | 2 | 5 | 6 | 83% | Poles, fences | No | Install additional bicycle racks (near capacity). |
| Boylston | Green - Subway | 5 | 22 | 27 | 28 | 96% | Posts | No | Install additional bicycle racks (near capacity) and replace or repair existing bicycle racks. |
| Arlington | Green - Subway | 5 | 8 | 13 | 10 | 130% | Fence near Public Garden | No | Install additional bicycle racks (over capacity). |
| Hynes Convention Center | Green - Subway | 4 | 4 | 8 | 4 | 200% | Poles, fences | No | Install bicycle racks on the northeast corner of Boylston St. and Mass. Ave. (over capacity). |
| Kenmore | Green - Subway | 5 | 10 | 15 | 30 | 50% | Poles at Beacon Street exit | No | Install additional bicycle racks at Beacon Street exit. |
| Copley | Green - Subway | 0 | 0 | 1 | 0 | NP | Near entrance | No | Install bicycle racks (no bicycle parking). |
| Blandford Street | Green - B Branch | 16 | 5 | 21 | 8 | 262% | Across street | No | Install additional bicycle racks (over capacity). |
| Boston University East | Green - B Branch | 14 | 106 | 120 | 136 | 88% | Across street | No | Install additional bicycle racks (near capacity). |
| Boston University Central | Green - B Branch | 49 | 20 | 69 | 20 | 345% | Across street | No | Install additional bicycle racks close to station entrances (over capacity) |
| Boston University West | Green - B Branch | 12 | 7 | 19 | 14 | 136% | Across street | No | Install additional bicycle racks (over capacity). |
| St. Paul Street | Green - B Branch | 15 | 3 | 18 | 8 | 225% | Parking meters, posts | No | Install additional bicycle racks (over capacity). |
| Pleasant Street | Green - B Branch | 8 | 1 | 9 | 2 | 450% | Parking meters, posts | No | Install additional bicycle racks (over capacity). |
| Babcock Street | Green - B Branch | 10 | 1 | 11 | 14 | 79% | Parking meters | No | Install additional bicycle racks (near capacity). |
| Packards Corner | Green - B Branch | 16 | 0 | 16 | 0 | NP | Parking meters | No | Install bicycle racks on each side of the station. |
| Harvard Avenue | Green - B Branch | 19 | 0 | 19 | 0 | NP | Parking meters | No | Install bicycle racks on each intersection corner and in parking area (no bicycle parking). |
| Griggs Street | Green - B Branch | 5 | 0 | 5 | 0 | NP | Posts | No | Install bicycle racks on southern median near station (no bicycle parking). |
| Allston Street | Green - B Branch | 3 | 0 | 3 | 0 | NP | Pole | No | Install bicycle racks on southern median near station (no bicycle parking). |
| Warren Street | Green - B Branch | 4 | 0 | 4 | 0 | NP | Pole | No | Install bicycles racks on each intersection corner (no bicycle parking). |
| Washington Street | Green - B Branch | 4 | 0 | 4 | 4 | 100% | Posts | No | Install additional bicycle racks (over capacity). |
| Sutherland Road | Green - B Branch | 3 | 0 | 3 | 0 | NP | Fence | No | Install bicycle racks in front of Beacon Hill Athletic Club (no bicycle parking). |
| Chiswick Road | Green - B Branch | 2 | 0 | 2 | 0 | NP | Pole | No | Install bicycle racks on the north and south sides of Comm. Ave. (no bicycle parking). |
| Chestnut Hill Avenue | Green - B Branch | 1 | 0 | 1 | 0 | NP | Tree | No | Install bicycle racks on either southeast corner of intersection or on Comm. Ave. median (no bicycle parking). |
| St. Mary's Street | Green - C Branch | 1 | 2 | 3 | 39 | 8% | Poles | No | No recommendation. |
| Hawes Street | Green - C Branch | 3 | 0 | 3 | 0 | NP | Poles, fences | No | Install bicycle racks near outbound shelter. |
| Kent Street | Green - C Branch | 3 | 0 | 0 | 0 | NP | Poles | No | Install bicycle racks near shelter (no bicycle parking). |
| St. Paul Street | Green - C Branch | 4 | 0 | 4 | 0 | NP | Poles | No | Install bicycle racks near shelter (no bicycle parking). |
| Coolidge Corner | Green - C Branch | 6 | 25 | 31 | 82 | 38% | Pole | No | Replace or repair existing bicycle racks. |
| Summit Ave./Winchester St. | Green - C Branch | 4 | 4 | 8 | 12 | 67% | Poles | No | Install additional bicycle racks on each side of the street or near shelter (near capacity). |
| Brandon Hall | Green - C Branch | 3 | 0 | 3 | 0 | NP | Poles | No | Install bicycle racks at the shelter near station and at westbound Beacon Street near pedestrian signal. |
| Dean Road | Green - C Branch | 1 | 0 | 1 | 0 | NP | Posts | No | Install bicycle racks near shelter (no bicycle parking). |
| Englewood Avenue | Green - C Branch | 2 | 0 | 2 | 0 | NP | Posts | No | Install bicycle racks near shelter (no bicycle parking). |
| Cleveland Circle | Green - C Branch | 1 | 1 | 2 | 22 | 9% | Pole | No | No recommendation. |
| Brookline Village | Green - D Branch | 1 | 15 | 16 | 26 | 62% | Fences, parking meters | No | No recommendation. |
| Beaconsfield | Green - D Branch | 1 | 0 | 1 | 0 | NP | Fence posts | No | Install a bicycle rack (no bicycle parking). |
| Chestnut Hill | Green - D Branch | 1 | 9 | 10 | 9 | 111% | Fence | No | Install additional racks at station (over capacity). |
| Reservoir | Green - D Branch | 1 | 4 | 5 | 19 | 26% | Fence | Yes | No recommendation. |
| Newton Center | Green - D Branch | 12 | 16 | 28 | 18 | 156% | Fence | No | Install additional bicycle racks on both sides of the station. |
| Eliot | Green - D Branch | 10 | 1 | 11 | 9 | 122% | Railing | No | Move existing bicycle racks closer to the platform or install a new rack on the inbound side of platform. |
| Waban | Green - D Branch | 1 | 5 | 6 | 11 | 55% | Post | No | No recommendation. |
| Woodland | Green - D Branch | 4 | 6 | 10 | 9 | 111% | Fence | No | Move existing bicycle racks closer to the platform or install additional racks closer to platform. |
| Riverside | Green - D Branch | 2 | 9 | 11 | 36 | 31% | Fence, platform | Yes | No additional recommendation. |
| Northeastern | Green - E Branch | 2 | 1 | 3 | 12 | 25% | Fence | No | No recommendation. |
| Museum of Fine Arts | Green - E Branch | 1 | 0 | 1 | 8 | 13% | Tree | No | No recommendation. |
| Longwood Medical Area | Green - E Branch | 3 | 12 | 15 | 14 | 107% | Fence, tree | No | Install additional bicycle racks. |
| Brigham Circle | Green - E Branch | 2 | 4 | 6 | 11 | 55% | Poles | No | No recommendation. |
| Riverway | Green - E Branch | 2 | 0 | 2 | 0 | NP | Poles | No | Install at least one inverted-U on each side of the street (no bicycle parking). |
| Boylston | Silver Washington St. | 5 | 22 | 27 | 28 | 96% | Posts | No | Install additional bicycle racks (near capacity). Install signs directing riders to bicycle racks. |
| Downtown Crossing | Silver Washington St. | 2 | 7 | 9 | 8 | 113% | Poles | No | Install additional bicycle racks (over capacity). |
| Chinatown | Silver Washington St. | 2 | 4 | 6 | 4 | 150% | Poles | No | Install additional bicycle racks (over capacity). |
| Manchester | Newburyport/Rockport | 1 | 4 | 5 | 8 | 63% | Post | No | Install sheltered bicycle racks. |
| Newburyport | Newburyport/Rockport | 22 | 9 | 31 | 39 | 79% | Platform | Yes | Move existing racks closer to platform or install signs encouraging riders to utilize existing racks. |
| Ipswich | Newburyport/Rockport | 1 | 2 | 3 | 9 | 33% | Platform | No | No recommendation. |
| Hamilton/Wenham | Newburyport/Rockport | 11 | 4 | 15 | 7 | 214% | Fence | No | Move existing bicycle racks closer to platform. Install additional bicycle racks (over capacity). |
| Beverly Depot | Newburyport/Rockport | 3 | 5 | 8 | 12 | 67% | Parking lot, station shelter | No | Install sheltered bicycle racks (near capacity). |
| Salem | Newburyport/Rockport | 3 | 38 | 41 | 58 | 71% | Fence | Yes | No additional recommendation. |
| Swampscott | Newburyport/Rockport | 10 | 7 | 17 | 10 | 170% | Ramp to station | No | Install additional bicycle racks (over capacity). |
| West Concord | Fitchburg | 5 | 5 | 10 | 10 | 100% | Trash can, posts | No | Install additional bicycle racks, preferably sheltered (at capacity). |
| Concord | Fitchburg | 4 | 11 | 15 | 12 | 125% | Station building, gutters | No | Install additional bicycle racks, preferably sheltered (over capacity). |
| Waltham | Fitchburg | 1 | 17 | 18 | 34 | 53% | Pole | Yes | Install a couple of inverted-U bicycle racks on the outbound side of the station. |
| Worcester | Framingham/Worcester | 1 | 8 | 9 | 30 | 30% | Under viaduct | No | Install signs or install racks in front of the station. |
| Westborough | Framingham/Worcester | 4 | 6 | 10 | 20 | 50% | Inside WB (OB) shelter | No | Install sheltered bicycle racks on outbound side. Replace or repair existing bicycle racks. |
| Southborough | Framingham/Worcester | 2 | 0 | 2 | 8 | 25% | Platform | No | Install a rack on the outbound side of station. |
| Natick | Framingham/Worcester | 14 | 12 | 26 | 12 | 217% | Fence | No | Install additional bicycle racks on Main Street (preferably sheltered). |
| Wellesley Square | Framingham/Worcester | 2 | 6 | 8 | 12 | 67% | Platform railing | No | Install new bicycle racks on the inbound side of the platform. |
| West Newton | Framingham/Worcester | 1 | 0 | 1 | 16 | 6% | Fence | No | Install signs on the fence directing riders to existing bicycle racks. |
| Needham Center | Needham | 1 | 0 | 1 | 7 | 14% | Fence | No | Install additional bicycle racks (near capacity). |
| Needham Junction | Needham | 1 | 5 | 6 | 7 | 86% | Post | No | No recommendation. |
| Forge Park/495 | Franklin | 4 | 1 | 5 | 14 | 36% | Near accessible ramp | No | No recommendation. |
| Walpole | Franklin | 1 | 4 | 5 | 7 | 71% | Drain spout | No | Install additional sheltered bicycle racks (near capacity). |
| Windsor Gardens | Franklin | 1 | 0 | 1 | 0 | NP | Bench | No | Install bicycle racks (currently no bicycle parking). |
| Norwood Central | Franklin | 1 | 1 | 2 | 11 | 18% | Fence | No | Install signs at the west entrance directing riders to bicycle racks. |
| Norwood Depot | Franklin | 3 | 1 | 4 | 14 | 29% | Platform, posts | No | Repair or replace bicycle racks. |
| Endicott | Franklin | 6 | 5 | 11 | 17 | 65% | Railing, fence | No | Install bicycle rack (preferably sheltered). |
| Providence | Providence/Stoughton | 16 | 26 | 42 | 26 | 162% | Railings | No | Install additional sheltered bicycle racks or bicycle cage, if possible (over capacity). |
| Attleboro | Providence/Stoughton | 6 | 9 | 15 | 17 | 88% | Platform | No | Install bicycle racks at all locations. Install signs to direct riders to racks. |
| Mansfield | Providence/Stoughton | 3 | 4 | 7 | 33 | 21% | Nearby parking lot | No | Install new bicycle racks at the Winthrop parking lot before crosswalk to station. |
| Canton Junction | Providence/Stoughton | 2 | 3 | 5 | 16 | 31% | Platform | No | No recommendation. |
| Campello | Middleborough/Lakeville | 1 | 0 | 1 | 9 | 11% | Post | No | Install signs to direct riders to racks. |
| Brockton | Middleborough/Lakeville | 5 | 0 | 5 | 26 | 19% | Fence by platform | No | Install signs to direct riders to racks. |
| Holbrook/Randolph | Middleborough/Lakeville | 1 | 2 | 3 | 9 | 33% | Pole | No | No recommendation. |
| Whitman | Plymouth/Kingston | 2 | 8 | 10 | 8 | 125% | News stand poles | No | Install additional sheltered bicycle racks (over capacity). |
| North Scituate | Greenbush | 2 | 3 | 5 | 7 | 71% | Platform | No | No recommendation. |
| Watertown Square | Bus facility | 1 | 10 | 11 | 12 | 92% | Tree, pole by busway | Yes | No additional recommendation. |
| Watertown Yard | Bus facility | 7 | 2 | 9 | 4 | 225% | Poles, fence near shelter | No | Install additional bicycle racks closer to shelter. Install signage to direct users to existing rack. |
NP= No bicycle parking
P&P = Pedal & Park (bicycle cage)
BP= Bicycle port