Technical Memorandum
DATE: December 2, 2021
TO: Congestion Management Committee
FROM: Ryan Hicks, MPO Staff
RE: 2017–18 Inventory and Utilization of Bicycle Parking Spaces at MBTA Stations
The purpose of this memorandum is to summarize the findings of the 2017–18 Massachusetts Bay Transportation Authority (MBTA) bicycle parking survey. For this survey, the Boston Region Metropolitan Planning Organization (MPO) collected bicycle parking information at commuter rail stations, commuter boat terminals, and rapid transit stations, including surface rapid transit stations and some bus stops. (For the purposes of this memorandum, the term “stations” includes bus stops.) This monitoring is part of the Congestion Management Process (CMP), which is carried out in accordance with federal regulations to help determine the Boston region’s multimodal transportation investments for reducing congestion.
MPO staff inventoried MBTA, municipal, and private bicycle racks at each of the 143 rapid transit stations, 129 commuter rail stations, six commuter ferry terminals, and two of the major bus stops. There was a six percent increase in parked bicycles and a 20 percent increase in bicycle rack spaces from the 2012–13 inventory to the 2017–18 inventory. Of the 280 stations included in the bicycle survey inventory, 86 percent have bicycle racks. This includes 114 of the 143 rapid transit stations, 120 of the 129 commuter rail stations, five of the six ferry terminals, and one of the two major bus stops.
As discussed later in this memorandum, the factors contributing to the change in utilization include construction of additional bicycle facilities, changes in motor vehicle parking fees, improvement of bicycle infrastructure leading to MBTA stations, and increased presence of bikesharing, among other factors.
The CMP is an ongoing, federally mandated program that is required of all MPOs. The Boston Region MPO’s CMP is multimodal and focuses on monitoring pedestrian facilities, bicycle facilities, transit facilities, park-and-ride lots, roadways, and high-occupancy vehicle (HOV) lanes. Staff collected and analyzed data from these modes of travel. The results of this analysis provide planners and MPO members with tools to help prioritize projects and program funds. For example, the inventory of bicycle racks can help determine if additional bicycle racks will need to be installed at certain stations or if covered bicycle spaces are suitable.
This memorandum provides analysis on bicycle parking capacity and utilization at every MBTA station. Bicycle parking utilization is defined in this memorandum as the percentage of bicycle spaces occupied by the end of the MBTA-defined AM peak period.1 The data can be useful when posted on the web, as it can inform people who bicycle about stations that have available parking. It can also inform planners of local municipalities that stations in their communities may need additional bicycle parking capacity. Sharing this information with municipalities is important since bicycle spaces at MBTA stations are often provided by local municipalities or even private business owners.
Before the 2017–18 inventory, bicycle parking data were last collected in 2012–13. Previous bicycle parking data were also collected in 2009–11, 2005–06, 2002 (MPO area only), and 1999–2000.
Inventories occurred during fair weather days in the spring and fall of 2017 and 2018 for all rapid transit stations, commuter rail stations, commuter ferry stations, and the two bus stations. The major data collection protocol difference between the 2017–18 inventory and the 2012–13 inventory was that the commuter rail stations were surveyed in the summer of 2012, compared to the spring and fall of 2017–18. Additionally, the rapid transit stations were surveyed exclusively in the fall of 2012. Data for current and past inventories are in Appendix A.
In general, MPO staff inventoried each station once. Data were collected using the survey form shown in Appendix B. The number, location, and condition of bicycle racks were recorded, and the number of bicycles parked in the racks and elsewhere in the station. Data on amenities and other characteristics of the station and its vicinity were also collected, including lighting, security, and the presence or absence of shared-use paths (trails) and bicycle lanes near the station.
At many of the MBTA stations that lacked bicycle parking, there were bicycle racks near the station on municipal property or along the sidewalks. These bicycle racks were included in the inventory if there was no bicycle parking at the nearby transit station or if it appeared likely that the municipal bicycle racks would be convenient for transit riders. If bicycle racks were located nearby but were very inconvenient for transit riders, that information was not included in the inventory.
The observed utilization of the bicycle racks was assumed to be typical for the station. Detailed observations over time, which is an effort beyond the scope of this project, would be necessary to gather a more accurate bicycle rack utilization percentage to consider fluctuations due to weather and work schedules, among other factors.
Certain factors have influenced bicycle parking utilization since the last bicycle inventory was collected. These factors include the change in parking capacity, bicycles on MBTA vehicle policies, MBTA station parking fee changes, bikesharing, bicycle parking safety, the presence of bicycle facilities along station approaches, the general increase in popularity of bicycling, and data collection inconsistencies.
Other factors, such as MBTA service changes, land use policies, and the economy affect both bicycle and motor vehicle parking at MBTA stations. For more information on these factors, please refer to the 2017–18 Inventory of Park-and-Ride Lots at MBTA Facilities memorandum.2
Certain stations have experienced a change in capacity in various ways since the last inventory was collected, including the installation of bicycle cages and the removal of bicycle racks at different stations. Some changes in the capacity include adding a secure cage, inducing latent demand, and increasing the number of overall bicycles parked at a station primarily due to the increased sense of security.
Many bicycles parked at locations other than at bicycle racks may be an indication that the existing racks are not located in areas that are safe; the racks are in an inconvenient location; the racks are in disrepair; the racks are poorly designed; or the rack utilization is at or exceeding the design capacity. This can also indicate that local retail shops and other commercial establishments may need to provide additional bicycle racks for their patrons. For example, at Central and Harvard stations, many of the bicycles were locked to railings, trees, and signposts.
The MBTA began the process of outfitting their bus fleet with bicycle racks in 2006. Since then, the MBTA has made significant improvements with the help of a grant in 2010 through the MPO’s Clean Air and Mobility Program. Currently, all non-electric MBTA buses are equipped with bicycle racks. 3 This is an improvement from the 2012–13 inventory, as now 95 percent of the MBTA bus fleet have bicycle racks. Additionally, bicycles are allowed on commuter rail and rapid transit vehicles during non-peak period hours (all times except 7:00 AM–10:00 AM and 4:00 PM–7:00 PM) for both the 2012–13 and 2017–18 inventories, with the exceptions of the Green Line, Mattapan trolley, and Silver Line Routes 1, 2, and 3.
Bicycle racks at rapid transit stations allow people to use their bicycles at one end of a transit trip, while bicycle racks on buses allow customers to use their bicycles at both ends of a trip. For information about the MBTA’s rules for parking bicycles and bringing bicycles on MBTA vehicles, visit the MBTA’s website, which has the most up-to-date information.4
In recent years, parking fees have increased at some MBTA stations. The increase in parking fees may influence commuter behavior if the parking demand at an MBTA system is determined to be elastic compared to the parking fees. If the demand is elastic, then parking fee increases could cause commuters to engage in alternative methods of commuting between their homes and the MBTA station to save money, such as leading more people to bike to the stations, which could result in an increase in the number of parked bicycles.
Over the past few years, bikesharing has grown in popularity. Docked bikesharing first arrived in the Boston region in 2011. Docked bikesharing is provided in the Boston region by BlueBikes. More recently, dockless bikesharing, which allows a user to ride a bicycle within a designated area and leave it at any location, became popular in the mid-2010s. Dockless bikeshares may impact bicycle parking at MBTA stations because commuters can use these bicycles for first- and last-mile trips. This could eliminate the need to own a bicycle for commuting purposes—making parking a bicycle at the MBTA station a nonissue.
Dockless bikeshares have been banned in many communities in the Boston region shortly after the 2017–18 bicycle parking data were collected and several dockless bikeshare companies have transitioned their dockless bikeshare fleet to electric bicycles (or E-bicycles). Since the completion of the data collection effort, electric scooter (or E-scooter) share programs have emerged throughout the Boston region. It remains to be seen if these new commuting options will directly impact bicycle parking at MBTA stations.
The perception of the safety of an MBTA station can affect bicycle parking. More riders are willing to park their bicycle if riders are confident that their bicycle will not be stolen or vandalized. In past inventories, theft rates were available for bicycles at MBTA stations, however, the data are no longer available.
The comfort of people bicycling has an enormous influence on the frequency and popularity of bicycle riding. Adding bicycle friendly features, such as bicycle lanes and shared-use paths, along routes to stations increases the separation between bicycle and motor vehicle traffic. These features help people bicycling feel more comfortable riding from their homes to MBTA stations.
In recent years, there has been an increase in bicycling in the Boston region. Several factors contributed to this increase, including the cost of having a car, changes in land use patterns that make bicycling more comfortable, environmentally conscious behavior changes, and the desire to explore different ways to exercise. Land use changes, such as the increase in multifamily dwellings, have influenced the popularity of bicycling in recent years as municipalities have purchased bicycle friendly amenities, such as secure bicycle parking and showering facilities.
There are several factors that could result in inconsistent data collection. For instance, several different data collectors surveyed the MBTA stations. Additionally, there have been staff changes between inventories, leading to inconsistencies in station surveys between inventory years. For example, surveyors may not have included a bicycle rack in 2012–13 that was later included in 2017–18. Alternately, a bicycle rack’s type or capacity may have been miscalculated at a station in one of the inventory years. However, with every inventory collection, data are checked and are often corrected with station revisits, if necessary.
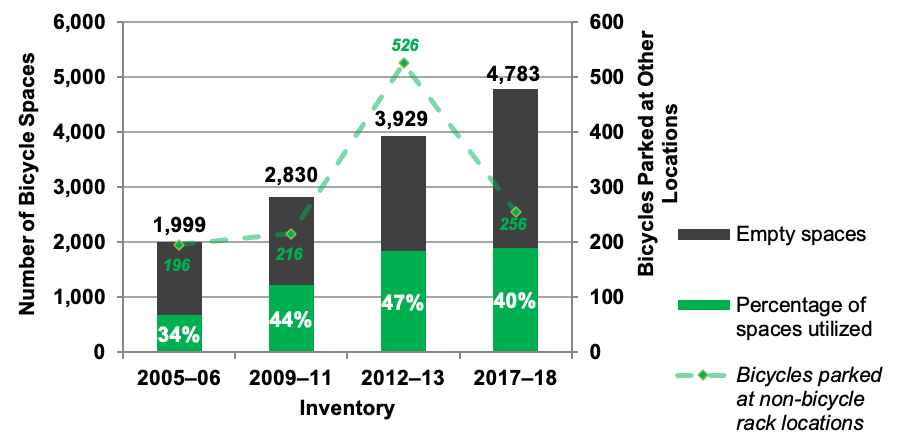
The total number of bicycle parking spaces on rapid transit lines increased by 22 percent between the 2012–13 and the 2017–18 inventories, during which time there was a three percent increase in the number of bicycles parked at rapid transit stations. This resulted in a seven percent decrease in utilization between the 2012–13 and 2017–18 inventories. Figure 1 shows the number of bicycles parked, the number of bicycle parking spaces, and the bicycle parking space utilization in the rapid transit system for the four inventory periods between 2005 and 2018.
Figure 1
MBTA Rapid Transit Bicycle Parking Utilization:
2005–06, 2009–10, 2012–13 and 2017–18 Inventories
MBTA = Massachusetts Bay Transportation Authority.
In Table 1, bicycle racks located at transfer stations (stations serving more than one line) were included in the data for all lines at a given station. For example, if there were 12 bicycle parking spaces at Downtown Crossing, those 12 spaces were included in the total for “Red Line,” and in the total for “Orange Line.” For stations that serve more than one line, the total number of bicycle racks at the station were also counted for each line. However, the total number shown is the actual number of bicycle spaces at the stations, not a summation of the “duplicate” numbers at a transfer station that serves multiple lines.
At an individual station, the number of parking spaces may differ between the two surveys for a variety of reasons, including that the number of parking spaces changed, the parking spaces were counted inconsistently, or field staff did not find all of the parking during one of the inventories. While the number of bicycle parking spaces is independent of seasonal variation, the number of parked bicycles does vary by season; therefore, most of the data for the 2017–18 inventory were collected in favorable bicycling weather, in the spring and fall. An inspection of the previous inventories indicates that most of the data were collected under conditions like those of the 2017–18 inventory.
Table 1
Bicycle Parking Inventory and Percentage of Spaces Utilized: Rapid Transit Stations, 2012–13 and 2017–18 Inventories
Line and Branch |
2012–13 Bicycles Parked |
2012–13 Parking Spaces |
2012–13 Percent Utilization |
2017–18 Bicycles Parked |
2017–18 Parking Spaces |
2017–18 Percent Utilization |
Red Line |
1,004 |
1,553 |
65% |
1,026 |
1,875 |
55% |
Mattapan High-Speed Line |
5 |
90 |
6% |
3 |
99 |
3% |
Blue Line |
92 |
409 |
22% |
154 |
512 |
30% |
Orange Line |
374 |
941 |
40% |
389 |
1,074 |
36% |
Green Line Subway |
82 |
207 |
40% |
121 |
349 |
35% |
Green Line B |
145 |
224 |
65% |
116 |
259 |
45% |
Green Line C |
34 |
187 |
18% |
37 |
197 |
19% |
Green Line D |
95 |
207 |
46% |
67 |
250 |
27% |
Green Line E |
17 |
45 |
38% |
8 |
62 |
13% |
Sliver Line Washington Street |
37 |
125 |
30% |
26 |
194 |
13% |
Sliver Line Waterfront |
77 |
230 |
33% |
71 |
202 |
35% |
Sliver Line SL3 |
0 |
0 |
N/A |
12 |
47 |
26% |
Total |
1,841 |
3,929 |
47% |
1,900 |
4,783 |
40% |
N/A = not available.
Of the rapid transit stations that had bicycle racks in the previous inventory (2012–13), the Green Line E Branch had the greatest percentage increase in bicycle parking spaces with 38 percent. The Red Line had the greatest increase in total bicycle parking spaces, with an increase in 322 additional bicycle parking spaces. This can be attributed to the installation and reconfiguration of bicycle cages at several stations along the Red Line since the 2012–13 inventory. The number of bicycle parking spaces on the Blue, Red, and Orange lines increased by 25 percent, 21 percent, and 14 percent, respectively. Zero stations were at 100 percent of their capacity during the 2017–18 inventory, compared to four rapid transit stations that were at capacity during the 2012–13 inventory.
The Red Line had the greatest number of bicycles parked at bicycle racks in both the 2012–13 and 2017–18 inventories. This is due in part to the high number of bicycles parked at racks at Alewife and Davis stations, and to a lesser extent at Central Square and Kendall/MIT. Alewife and Davis stations both have many bicycle parking spaces to accommodate demand, and both stations are located on shared-use paths that are heavily traveled by people walking and bicycling. The Red Line, Blue Line, Orange Line, and the C branch and subway sections of the Green Line all experienced increases in the number of bicycles parked since the 2012–13 inventory. However, the Mattapan Line, the Green Line’s B, D, and E branches, and the Silver Line’s Washington Street and Waterfront all had fewer parked bicycles since the 2012–13 inventory. The Blue Line experienced the highest overall increase in the number of parked bicycles, with an additional 62 bicycles parked in the 2017–18 inventory, compared to the 2012–13 inventory.
Bicycles parked at non-bicycle rack locations declined 49 percent near rapid transit stations. Much of the decline occurred on the B branch of the Green Line, which decreased from 181 bicycle to 24 bicycles. This decline is attributed to the day-to-day variation of bicycles parked along the B branch, as this branch passes through both the Boston College and Boston University campuses and attendees of these universities can have dramatically different schedules on different days in which the racks were inventoried.
The Red Line was the only line observed during the 2017–18 inventory to have more than 100 bicycles parked in areas other than the bicycle racks provided at the time of observation, with 45 of these bicycles parked near Alewife. A secondary survey could determine the destinations to which people are bicycling, specifically whether people are traveling to MBTA services or nearby commercial establishments. This survey would help determine who would be responsible for installing additional racks.
Twenty-seven of the 143 rapid transit stations observed in the most recent inventory did not have bicycle racks. Those stations are listed below:
Eighty percent of the 143 stations in the rapid transit system had bicycle racks when the 2017–18 survey was conducted. See Table A1.1 in Appendix A for rapid transit, station-specific data on bicycle parking and utilization. Table A1.1 also indicates the number of bicycles attached to objects other than bicycle racks (such as poles, trees, and railings) at each station.
Figures 2 and 3 show the 2017–18 utilization and the change in utilization between the 2012–13 and 2017–18 inventories on rapid transit stations, respectively. During the peak period, both the Alewife (Red Line) and the Waban (Green Line D) stations had over 85 percent bicycle rack utilization. Additionally, Harvard Avenue (Green Line B) and State Street (Orange Line) stations experienced an increase in bicycle rack usage of more than 50 percent since the 2012–13 inventory.
Figure 2
Bicycle Parking Capacity and Utilization for Rapid Transit Stations, Express Bus Stops, and Ferry Terminals, 2017–18 Inventory
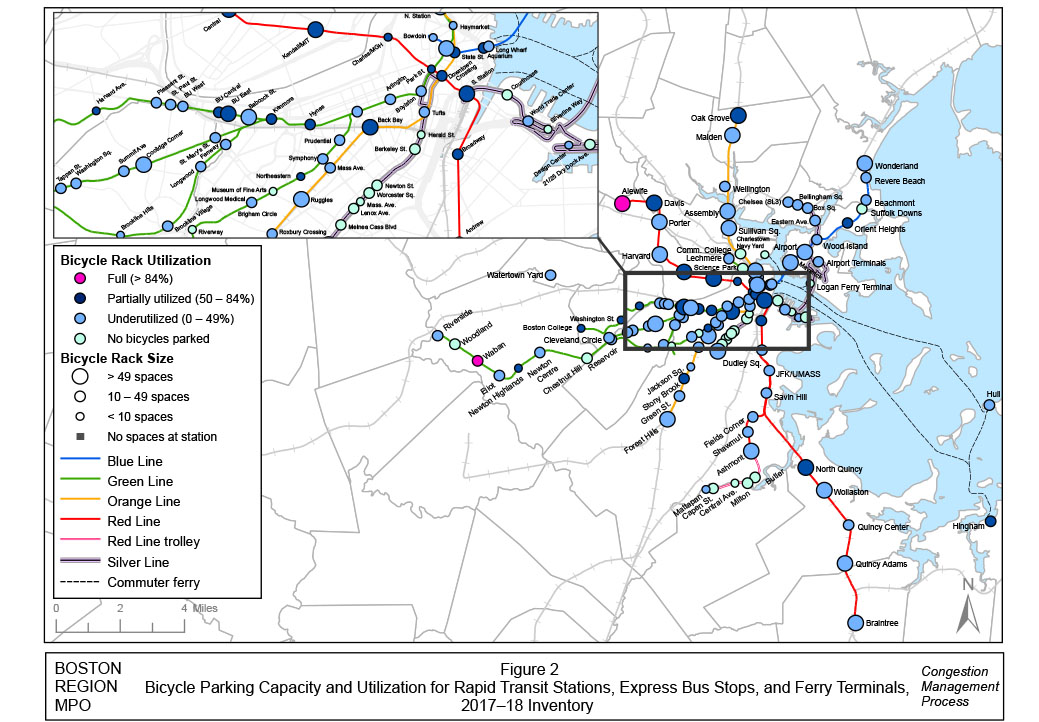
Figure 3
Change in Bicycle Rack Utilization for Rapid Transit Stations, Express Bus Stops, and Ferry Terminals, 2012–13 Inventory and 2017–18 Inventory
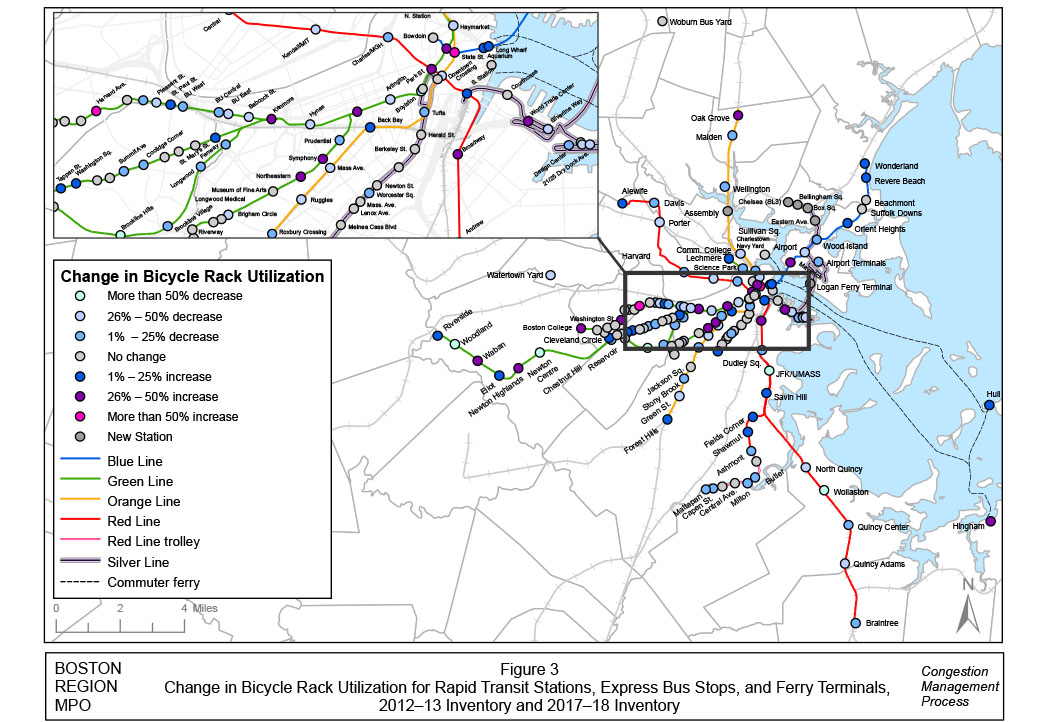
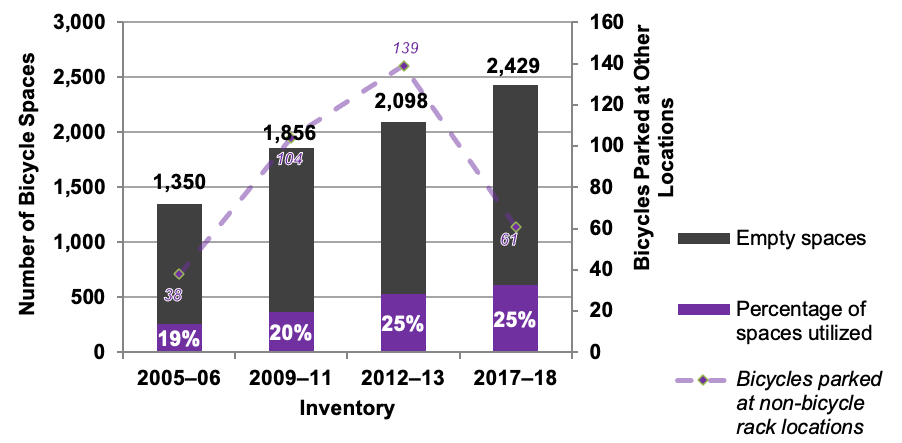
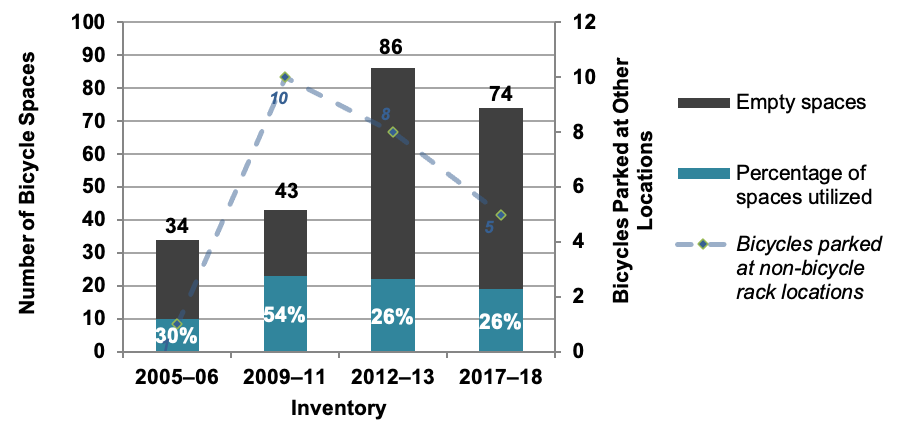
Figure 4 shows that while the total number of bicycle parking spaces in the commuter rail system increased by 17 percent from the 2012–13 inventory to the 2017–18 inventory, the utilization rate remained unchanged at 25 percent. Table 2 shows the number of bicycle parking spaces in the commuter rail system, the number of bicycles parked, and the percentage of bicycle parking space utilization by line for the two inventory periods.
Figure 4
MBTA Commuter Rail Bicycle Parking Utilization:
2005–06, 2009–10, 2012–13 and 2017–18 Inventories
MBTA = Massachusetts Bay Transportation Authority.
Table 2
Bicycle Parking Inventory and Percentage of Spaces Utilized: Commuter Rail Stations
Commuter Rail Line |
2012–13 Bicycles Parked |
2012–13 Parking Spaces |
2012–13 Percent Utilization |
2017–18 Bicycles Parked |
2017–18 Parking Spaces |
2017–18 Percent Utilization |
North Side |
|
|||||
Newburyport/Rockport Line |
90 |
272 |
33% |
112 |
383 |
29% |
Haverhill Line |
36 |
244 |
15% |
43 |
216 |
20% |
Lowell Line |
61 |
137 |
45% |
48 |
161 |
30% |
Fitchburg Line |
90 |
260 |
35% |
86 |
383 |
22% |
Framingham/Worcester Line |
74 |
272 |
27% |
74 |
247 |
30% |
North Side total |
351 |
1185 |
30% |
363 |
1390 |
26% |
South Side |
|
|||||
Needham Line |
16 |
104 |
15% |
18 |
91 |
20% |
Franklin Line |
25 |
162 |
15% |
37 |
162 |
23% |
Fairmount Line |
1 |
84 |
1% |
2 |
143 |
1% |
Providence/Stoughton Line |
81 |
309 |
26% |
150 |
348 |
43% |
Middleborough/Lakeville Line |
12 |
81 |
15% |
9 |
147 |
6% |
Kingston/Plymouth Line |
19 |
84 |
23% |
16 |
98 |
16% |
Greenbush Line |
25 |
109 |
23% |
20 |
98 |
20% |
South Side total |
176 |
891 |
20% |
250 |
1,039 |
24% |
Grand Total |
527 |
2,076 |
25% |
613 |
2,429 |
25% |
Ninety-three percent of the stations in the commuter rail system have bicycle racks. Six new stations were added to the 2017–18 inventory that were not surveyed previously: Boston Landing, Wachusett, Talbot Ave, Four Corners/Geneva, Newmarket and Foxborough. See Table A2.1 in Appendix A for commuter rail station-specific data on bicycle parking and utilization. Table A2.1 also indicates the number of bicycles locked to objects other than bicycle racks (for example, poles, trees, or railings) at each station.
The number of bicycle parking spaces counted during the 2017–18 inventory was greater than the number from the 2012–13 inventory on every commuter rail line, except for the Haverhill, Framingham/Worcester, Needham, Franklin, and Greenbush lines. The Providence/Stoughton line had both the highest number of parked bicycles (with 150 bicycles parked), and the highest utilization (at 43 percent). The Fairmount Line had the lowest bicycle rack utilization with one percent. Twenty-seven out of 129 commuter rail stations that had racks were observed to have no parked bicycles.
The number of bicycles parked at non-bicycle rack locations decreased 44 percent since the 2012–13 inventory was collected. Most notably, the Newburyport/Rockport line experienced the biggest decrease, decreasing from 51 bicycles to 13 bicycles. The cause of this decrease was likely due to several stations either adding bicycle racks or improving the visibility of the existing bicycle racks. Additionally, the overall utilization of the bicycle racks near the Newburyport/Rockport line decreased, so it logically follows that bicycles locked to objects other than bicycle racks would decrease as well.
In the most recent inventory (2017–18), nine of the 129 commuter rail stations observed did not have bicycle racks. These stations include:
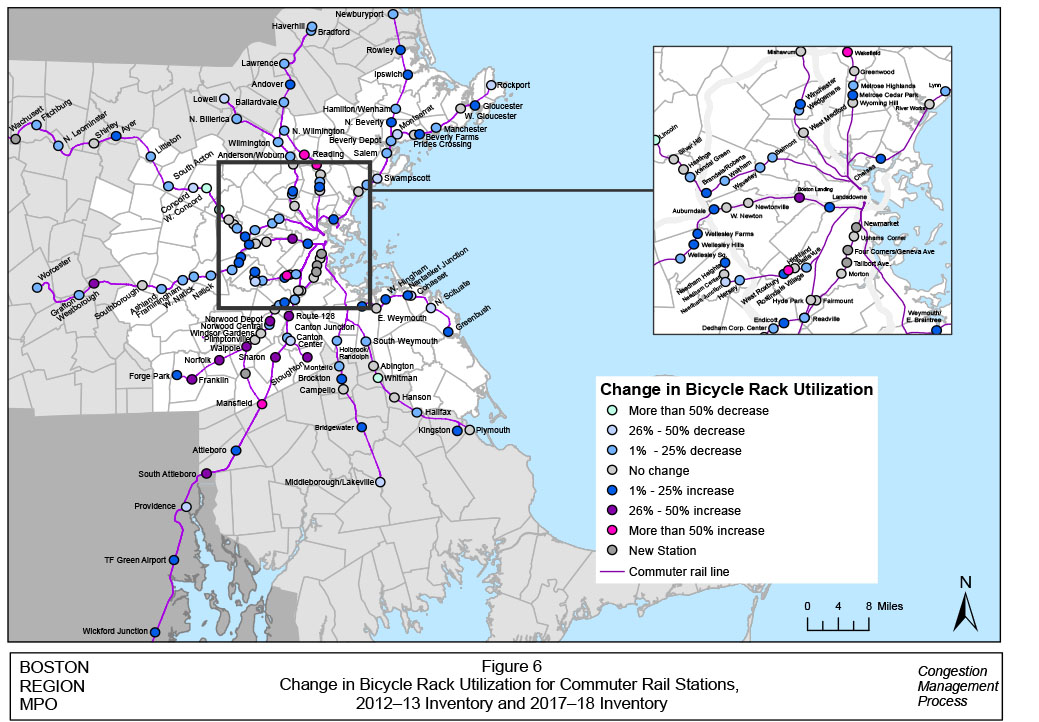
During the 2017–18 inventory, staff observed 61 bicycles locked to objects other than bicycle racks provided at the commuter rail stations. Figures 5 and 6 show the 2017–18 utilization and the change in utilization between the 2012–13 and 2017–18 inventories on commuter rail stations, respectively. Of the commuter rail stations that were monitored, Reading and Walpole had bicycle racks that were more than 85 percent utilized. Additionally, Reading, Mansfield, Wakefield, and Highland stations all experienced increases in utilization of more than 50 percent since the 2012–13 inventory.
Figure 5
Bicycle Parking Capacity and Utilization for Commuter Rail Stations,
2017–18 Inventory
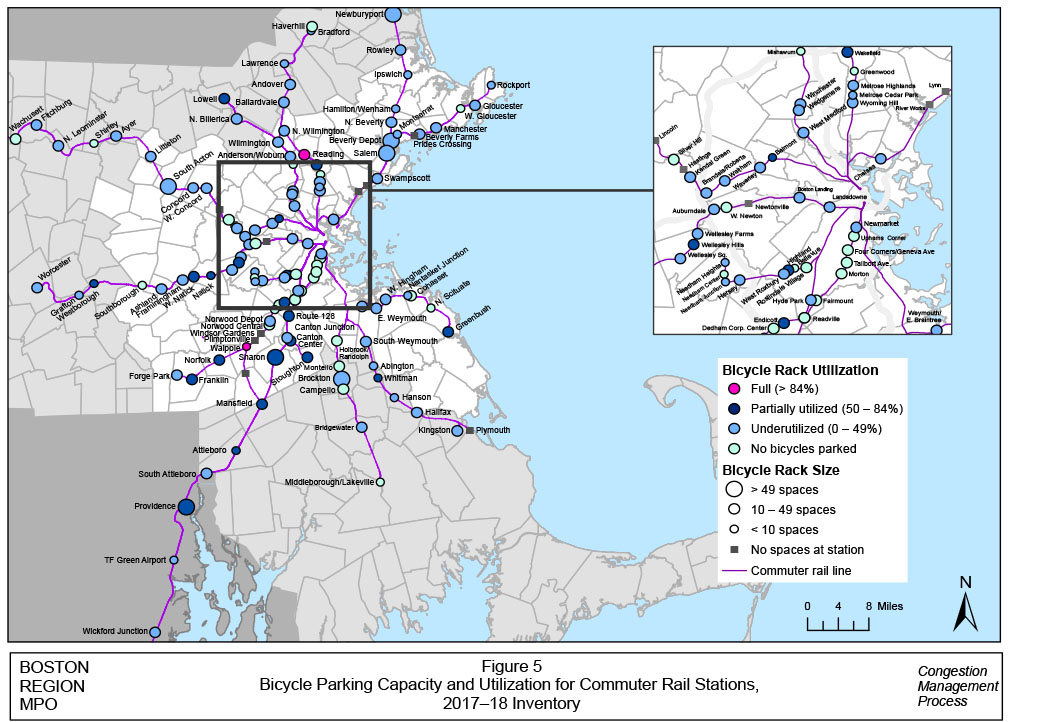
Figure 6
Change in Bicycle Rack Utilization for Commuter Rail Stations,
2012–13 Inventory and 2017–18 Inventory
In the time that passed between the 2012–13 and 2017–18 inventories, the MBTA ceased service to the Quincy Fore River Ferry Terminal; the Logan Airport Ferry Terminal was monitored for the first time. These changes are reflected in the 2017–18 inventory. The Logan Airport Ferry Terminal was in operation during the collection of previous inventories but was not previously surveyed.
All seven of the MBTA’s commuter boat facilities that are currently open were monitored in the 2017–18 inventory. Figure 7 shows that the overall bicycle parking utilization at these locations in the 2017–18 inventory was 29 percent. The utilization at the Hingham Ferry Terminal increased from 38 percent to 79 percent between the 2012–13 and 2017–18 inventories. The removal of 10 of 24 bicycle parking spaces from the terminal after the 2012–13 inventory contributed to this 41 percent increase in utilization. Table 3 shows the number of bicycles parked, the number of bicycle parking spaces, and the percentage of bicycle parking space utilization at the commuter boat terminals and major bus stops for the two most recent inventory periods. Table A3.1, in Appendix A, includes more detailed information about these locations.
The Hingham commuter boat terminal has racks that can accommodate 14 bicycles. Eleven out of 14 spaces were utilized at the time of observation for the 2017–18 inventory. Twenty-two bicycle spaces were removed from the Charlestown Navy Yard since the 2012–13 inventory, reducing the number of bicycle spaces from 28 to six spaces. There were no bicycles parked at the Charlestown Navy Yard in the 2017–18 inventory. Bicycles are allowed on MBTA commuter boats at all times, making it a viable option for people bicycling to bring bicycles on the boat, and then lock or ride them upon arrival at their destination.
At the time of the 2017–18 inventory, Rowes Wharf did not have any bicycle parking; however, new bicycle racks, consisting of 27 bicycle spaces, have been installed on Long Wharf, which is near Rowes Wharf. Long Wharf was revisited and during the observation, there were six bicycles parked. The bicycles parked and the number of bicycle spaces at Long Wharf are included in the 2017–18 inventory.
The Watertown Yard and Woburn park-and-ride lots were the only major bus stops monitored in the 2017–18 inventory. The utilization of bicycle racks at selected major bus stops decreased from 75 percent during the 2012–13 inventory to eight percent in the 2017–18 inventory. Watertown Yard had 12 bicycle spaces with four bicycles parked at the time of observation. There were no parking spaces at the Woburn park-and-ride lot, nor were any bicycles parked in the area.
Figure 7
MBTA Commuter Boat Bicycle Parking Utilization:
2005–06, 2009–10, 2012–13 and 2017–18 Inventories
MBTA = Massachusetts Bay Transportation Authority.
Table 3
Bicycle Parking Inventory and Percentage of Spaces Utilized:
Commuter Boat Terminals and Major Bus Stops
Transit Mode |
2012–13 Bicycles Parked |
2012–13 Parking Spaces |
2012–13 Percent Utilization |
2017–18 Bicycles Parked |
2017–18 Parking Spaces |
2017–18 Percent Utilization |
Commuter boat |
10 |
70 |
14 |
18 |
62 |
29 |
Major bus stops |
12 |
16 |
75 |
1 |
12 |
8 |
Source: Central Transportation Planning Staff
As part of the 2017–18 inventory, staff recorded information about station amenities, station surroundings, and other characteristics that would be pertinent to people bicycling. These include the types of bicycle racks at a station, whether the racks were sheltered, if there was a shared-use path or trail nearby, and whether there were bus routes that connect to the station. In addition, staff recorded data on bicycle lanes on the roadways that connect to MBTA stations. These data are available in Appendix A1.2, A2.2, and A3.2, and discussed below.
Tables A1.2, A2.2, and A3.2 (in Appendix A) list the amenities at each station. Some styles of bicycle racks are better than others. The inverted-U-style and post-and-loop style racks support a bicycle in two places, keeping the bicycle from falling and being damaged. These racks also make it easy to lock the bicycle frame and the front or rear wheel to the rack to prevent theft. Other rack styles, such as dish-rack or the ribbon and triangle, support bicycles in only one place, making it more likely for the bicycle to fall. Furthermore, locking both the bicycle frame and wheel to the dish-rack and ribbon-style racks can also be difficult.
At the stations inventoried, the inverted-U, ribbon, and triangle rack styles were the most common types of bicycle racks. While the post-and-loop is also a commonly used style, it was only observed on sidewalks in the proximity of stations, and rarely used at the stations themselves. Many bicycle racks consist of inverted-U-style racks.
People who bicycle may be deterred from bicycling to a transit station due to inclement weather conditions in part because of a lack of covered bicycle parking. Sheltered bicycle racks protect bicycles from the elements and provide a sense of security, but it is not feasible to install them at all stations. Of the 143 rapid transit stations, only 41 stations provide at least some covered bicycle parking—two of those stations are South Station and Back Bay Station. These major stations have commuter rail, rapid transit, and bus connections. Tables A1.2, A2.2, and A3.2 (in Appendix A) provide detailed information on all MBTA stations observed.
Between the 2012–13 inventory and the 2017–18 inventory, the number of commuter rail stations that had covered bicycle parking increased from 34 to 39 stations. The South Acton commuter rail station had individual bicycle lockers for rent, in addition to unsheltered bicycle racks. These bicycle lockers are operated by the Town of Action.
The American Recovery and Reinvestment Act, enacted in 2009, has provided the MBTA with $4.8 million for a variety of programs to expand MBTA bicycle parking facilities. This act allowed the MBTA to receive a federal grant that enabled collaboration with MassBikes to design and install pedal and park bicycle cages and bicycle racks throughout the MBTA system.5 As a result, 12 rapid transit stations and two commuter rail stations had pedal and park facilities at the time that the bicycle inventory was conducted.
Shared-use paths located near transit stations provide safe and convenient access to transit for people bicycling. Many stations are located near a shared-use path, and most of those stations were observed to have many parked bicycles. There are several shared-use paths in Boston and its surrounding municipalities, including the Dr. Paul Dudley White Charles River Bike Path, which runs along the Charles River between Boston and Watertown, and the Pierre Lallement Southwest Corridor Bike Path, which runs along the Orange Line between Forest Hills Station and Back Bay Station.
The MBTA bus system covers a large portion of the Boston region. Many of the rapid transit and commuter rail stations that were inventoried have bus connections. As the MBTA outfits its buses with bicycle racks, bus connectivity is becoming an important factor for people bicycling and using transit. To meet the needs of people who bicycle and use transit, the MBTA equipped all non-electric buses with bicycle racks.
Several MBTA stations include bicycle lanes on roads leading to the stations, making them accessible to people bicycling. On the Red Line, Porter, Harvard, Central, and Kendall stations are all served by bicycle lanes on Main Street and portions of Massachusetts Avenue in Cambridge.
Bluebikes is a bikesharing program that currently operates more than 300 docking stations and more than 3,000 bicycles in the Boston region. At the time of the 2012–13 inventory, the system had 100 docking stations. This bikesharing program was implemented in the Boston region in 2011 as Hubway, which was a collaboration between the City of Boston and the Metropolitan Area Planning Council. In 2018, a rebranding occurred with Blue Cross Blue Shield becoming the official sponsor of the bikesharing program. Of the MBTA stations that were monitored in the 2017–18 inventory, 116 rapid transit stations, 13 commuter rail stations, four ferry terminals, and one bus stop were in close proximity (one-half mile) to a Bluebikes’ station.
Bicycle racks promote bicycle access to MBTA stations by providing a safe and convenient place to lock a bicycle. Between the 2012–13 inventory and 2017–18 inventory, there was a 20 percent increase in the number of bicycle parking spaces throughout the entire MBTA system; 83 MBTA stations (including new stations) that did not have bicycle parking during the 2005–06 inventory had acquired bicycle racks by the time of the 2017–18 inventory. There was also a 163 percent increase in the number of bicycles parked at racks. The increase in the number of spaces, coupled with the larger increase in usage, indicates that there was an overall increase in the percentage of utilization since the 2005–06 inventory was conducted.
Many MBTA rail stations—26 rapid transit stations, 22 commuter rail stations and one commuter ferry terminal—were at 50 percent capacity or higher, including two rapid transit stations and two commuter rail stations that reached 85 percent capacity during the 2017–18 inventory.
More than 800 bicycle parking spaces were added to rapid transit stations since the 2012–13 inventory. Eighty percent of the 143 stations in the rapid transit system had bicycle racks when the 2017–18 inventory was conducted. The change in the number of bicycles parked on rapid transit lines varied from line to line between the 2012–13 and 2017–18 inventories. Some lines had decreases in the number of parked bicycles, while others had increases. No stations were at 100 percent capacity during the 2017–18 inventory, compared to four rapid transit stations being completely filled during the 2012–13 inventory.
More than 350 bicycle parking spaces were added to commuter rail stations since the 2012–13 inventory. Only nine commuter rail stations did not have bicycle racks nearby. The total number of bicycle parking spaces in the commuter rail system increased by 17 percent since the 2012–13 inventory and the utilization rate remained unchanged at 25 percent. Of the 129 observed commuter rail stations, 27 stations had parked bicycles at the time of observation. The Lowell Line experienced the biggest drop in utilization at 15 percent. The Fitchburg line also experienced the second largest drop in utilization at 13 percent.
The commuter ferry lost eight parking spaces since the 2012–13 inventory. As a result, the bicycle parking utilization on the commuter ferry increased from 14 percent to 29 percent. The utilization of bicycle racks at selected major bus stops decreased from 75 percent during the 2012–13 inventory to eight percent in the 2017–18 inventory. The utilization change is likely caused by the decrease in bus ridership.
In addition to the conclusions listed above, there are several trends that can be drawn from the 2017–18 MBTA bicycle parking survey regarding bicycle parking and station access. These trends do not reflect bicycle utilization, but these factors can indirectly influence utilization over time.
Table A4.1 (in Appendix A) lists the MBTA stations where parked bicycles were observed in locations other than bicycle facilities. It identifies the locations of those bicycles, the number of bicycle spaces provided by the station’s racks, and the number of bicycles parked in them. It also presents recommendations for each station based on the locations and utilization of bicycle racks, the locations of the bicycles parked in other areas, and station characteristics.
The key recommendations include
The results of the 2017–18 MBTA bicycle parking inventory are displayed publicly on the park-and-ride dashboard, which is available on the Boston Region MPO’s website.6 The dashboard includes both automobile parking and bicycle parking information at every MBTA station. The bicycle parking data included on the dashboard are the number of bicycles parked, bicycle parking capacity, bicycle rack types, and bicycle infrastructure located near MBTA stations. Park-and-ride and bicycle parking data are available for download from the dashboard in Excel format so that users can conduct their own analysis of the data, if desired.
The results of this memorandum will be shared with local stakeholders, such as municipalities and transportation agencies. This study will help these entities make planning and programming decisions to provide better experiences for commuters who park their bicycles at MBTA stations. Additionally, these results will be presented to the Boston Region MPO Board and shared publicly on the Boston Region MPO’s website.
The Boston Region Metropolitan Planning Organization (MPO) operates its programs, services, and activities in compliance with federal nondiscrimination laws including Title VI of the Civil Rights Act of 1964 (Title VI), the Civil Rights Restoration Act of 1987, and related statutes and regulations. Title VI prohibits discrimination in federally assisted programs and requires that no person in the United States of America shall, on the grounds of race, color, or national origin (including limited English proficiency), be excluded from participation in, denied the benefits of, or be otherwise subjected to discrimination under any program or activity that receives federal assistance. Related federal nondiscrimination laws administered by the Federal Highway Administration, Federal Transit Administration, or both, prohibit discrimination on the basis of age, sex, and disability. The Boston Region MPO considers these protected populations in its Title VI Programs, consistent with federal interpretation and administration. In addition, the Boston Region MPO provides meaningful access to its programs, services, and activities to individuals with limited English proficiency, in compliance with U.S. Department of Transportation policy and guidance on federal Executive Order 13166. The Boston Region MPO also complies with the Massachusetts Public Accommodation Law, M.G.L. c 272 sections 92a, 98, 98a, which prohibits making any distinction, discrimination, or restriction in admission to, or treatment in a place of public accommodation based on race, color, religious creed, national origin, sex, sexual orientation, disability, or ancestry. Likewise, the Boston Region MPO complies with the Governor's Executive Order 526, section 4, which requires that all programs, activities, and services provided, performed, licensed, chartered, funded, regulated, or contracted for by the state shall be conducted without unlawful discrimination based on race, color, age, gender, ethnicity, sexual orientation, gender identity or expression, religion, creed, ancestry, national origin, disability, veteran's status (including Vietnam-era veterans), or background. A complaint form and additional information can be obtained by contacting the MPO or at http://www.bostonmpo.org/mpo_non_discrimination. To request this information in a different language or in an accessible format, please contact Title VI Specialist By Telephone: For people with hearing or speaking difficulties, connect through the state MassRelay service:
|
Appendix A: Bicycle Parking Utilization Capacity and Amenities: Comprehensive Results of 2017–18 Inventory
Appendix B: 2017–18 Bicycle Parking Survey Form
1 The end of the AM peak period is defined as time where the last inbound peak period vehicle leaves the respective station or stop. The last peak period commuter rail train typically begins its inbound trip before 9:00 AM and arrives at either North Station or South Station by 9:50 AM. The last peak period rapid transit, bus or ferry vehicle typically begins its inbound trip before 9:00 AM.
2 Boston Region MPO memorandum titled 2017–18 Inventory of Park-and-Ride Lots at MBTA Facilities, available online at https://www.ctps.org/data/pdf/programs/cmp/park-and-ride-memo-2017-2018.pdf.
3 MBTA, “Bringing Your Bike on the Bus.” Available online at https://www.mbta.com/bikes/using-bus-bike-racks (accessed April 16, 2021).
4 MBTA, “Bikes.” Available online at https://mbta.com/riding_the_t/bikes/ (accessed April 16, 2021).
5 Pedal and park facilities are secure enclosed structures that provide bicycle parking. Pedal and park facilities typically have a capacity of 50 to 150 bicycle parking spaces and have controlled access.
6 Boston Region MPO, “Park-and-Ride Data Dashboard.” Available online at https://www.ctps.org/maploc/www/apps/pnr-dashboard/index.html (accessed April 16, 2020).