Technical Memorandum
DATE: October 1, 2020
TO: Massachusetts Department of Transportation and the Federal Highway Administration
FROM: Boston Region Metropolitan Planning Organization Staff
RE: Boston Region MPO Mid-Performance Period CMAQ Progress Report (2020)
The Boston Region Metropolitan Planning Organization (MPO) has developed this mid-performance period Congestion Mitigation and Air Quality Improvement (CMAQ) performance plan for the first federal performance period in accordance with Title 23 of the Code of Federal Regulations (CFR), part 490.107(c)(3), and Title 23 of the United States Code, part 149(l).1 This plan provides the following information:
The Boston Region MPO has submitted this mid-performance period CMAQ Performance Plan for inclusion with the Massachusetts October 2020 Performance Management Form.
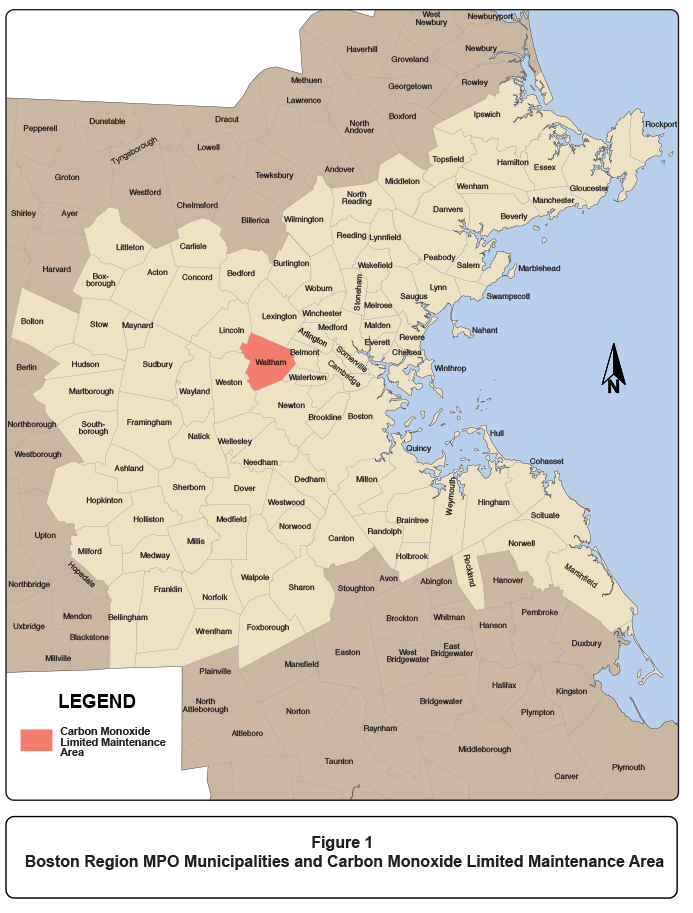
The Boston Region MPO serves 97 municipalities in eastern Massachusetts as shown in Figure 1. It includes a limited maintenance area for carbon monoxide in Waltham. On April 22, 2002, the City of Waltham was redesignated as being in attainment for carbon-monoxide emissions with a limited maintenance plan approved by the US Environmental Protection Agency (EPA). While the MPO is not required to perform modeling analysis for a conformity determination for carbon monoxide, the MPO is still required to provide a status report on the timely implementation of projects and programs that will reduce emissions from transportation sources—so-called transportation control measures—which are included in the Massachusetts State Implementation Plan. The MPO provides this information in annual updates to its Transportation Improvement Program (TIP).
The Federal Highway Administration’s (FHWA) October 2017 applicability determination for CMAQ traffic congestion and on-road mobile source emissions measures determined that the Boston Region MPO was required to develop a CMAQ performance plan and establish two-year and four-year targets for the on-road mobile source emissions measure.2 These two-year and four-year targets pertain to carbon monoxide emissions. According to the FHWA’s October 2019 applicability determination, which reflects adjustments as of the mid-point of the first federal performance period, the Boston Region MPO must continue to meet performance requirements that pertain to carbon monoxide emissions.3
Figure 1
Boston Region MPO Municipalities and Carbon Monoxide Limited Maintenance Area
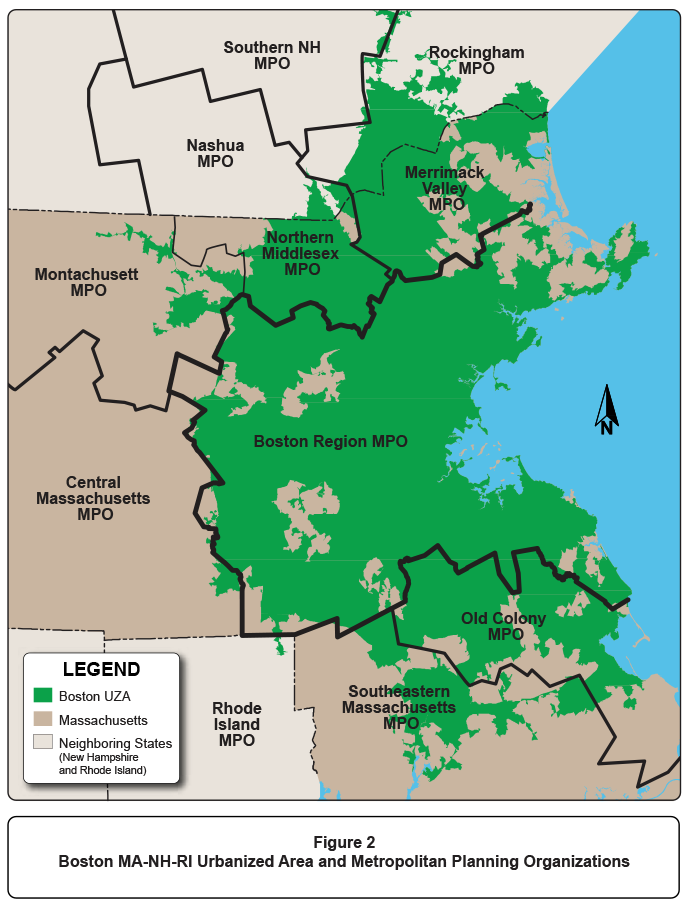
The Boston Region MPO is part of the Boston MA-NH-RI Urbanized Area (UZA), as established by the 2010 US Census. Figure 2 shows the Boston MA-NH-RI UZA, including the states and MPOs that are wholly or partially in the UZA. The FHWA’s October 2017 applicability determination for CMAQ traffic congestion and on-road mobile source emissions measures states that targets for the traffic congestion measures must be established for the Boston MA-NH-RI UZA, and that the Boston Region MPO must participate in this target-setting process.4 This is because the Boston region includes(1) mainline highways on the National Highway System (NHS) that cross into an urbanized area with a population of more than one million, and (2) a limited maintenance area that overlaps an urbanized area with a population of more than one million. According to the FHWA’s October 2019 applicability determination, the Boston Region MPO must continue to meet performance requirements that pertain to traffic congestion measures.5
Figure 2
Boston MA-NH-RI Urbanized Area and Metropolitan Planning Organizations
The total emissions reduction measure, which addresses on-road mobile source emissions, is the cumulative estimated emission reductions, for all CMAQ-funded projects, of each applicable criteria pollutant and precursor for which the area within the MPO is designated as a nonattainment or maintenance area. Applicable criteria pollutants include ozone (O3), carbon monoxide (CO), and particulate matter (PM2.5 and PM10), while precursors include volatile organic compounds (VOCs) and oxides of nitrogen (NOx). As mentioned in Section 1, the Boston Region MPO includes a limited maintenance area for carbon monoxide in Waltham and therefore measures estimated reductions of carbon monoxide from CMAQ- funded projects.
To establish a baseline for this measure, Boston Region MPO staff reviewed listings of obligated projects and information in the CMAQ Public Access system to identify CMAQ-funded projects that would have been obligated in federal fiscal years (FFYs) 2014–17. When conducting this review, MPO staff did not identify any projects that were both (1) located in Waltham and (2) funded all or in part with CMAQ dollars. As a result, MPO staff identified a baseline level of carbon monoxide emissions reduction that is equal to zero daily kilograms.
In October 2017, the FHWA determined that the Boston Region MPO was required to set performance targets for the total emissions reduction measure with respect to its carbon monoxide maintenance area in Waltham for the first federal performance-monitoring period (FFYs 2018–21). These targets include the following:
When developing these initial performance targets, Boston Region MPO staff reviewed transportation projects programmed in its FFYs 2018–22 and FFYs 2019–23 TIPs to identify any that were (1) located in Waltham and (2) funded all or in part with CMAQ dollars. At that time, MPO staff did not identify any projects that met both criteria in its TIPs for the years FFYs 2018–21. As a result, the MPO set its two-year and four-year carbon monoxide emissions reductions targets equal to the baseline value of zero kilograms per day. Table 1 summarizes this information.
Table 1
Boston Region MPO Emissions Reduction Targets
Performance Measure |
Baseline Years and Data |
Baseline Value |
Two-Year Target (FFYs 2018–19) |
Four-Year Target (FFYs 2018–21) |
Daily kilograms of CO emissions reduction from CMAQ projects in Boston region nonattainment or maintenance areas |
FFYs 2014–17 data on obligated projects with CMAQ funding |
0 kg per day |
0 kg per day |
0 kg per day |
Note: A limited maintenance area for carbon monoxide is located in Waltham.
CMAQ = Congestion Mitigation and Air Quality. CO = carbon monoxide. FFY = federal fiscal year. kg = kilogram. MPO = metropolitan planning organization.
Sources: Boston Region MPO.
The Boston Region MPO took action to adopt these emissions reduction performance targets on September 20, 2018.
The FHWA established two CMAQ performance measures related to traffic congestion, which are to be measured for identified UZAs:
The Boston MA-NH-RI UZA baseline for this measure was established using 2012–16 US American Community Survey (ACS) estimates, which were the most recent five-year estimates available as of CY 2017. Massachusetts Department of Transportation (MassDOT), New Hampshire Department of Transportation (NH DOT), and MPO staff reviewed estimates of the means of transportation to work for workers ages 16 and older, as outlined in ACS tables DP03 (“Selected Economic Characteristics”), S0801 (“Commuting Characteristics by Sex”), and others. The baseline for the percent of non-SOV travelin the Boston MA-NH-RI UZA was developed by subtracting the estimated share of workers ages 16 and older who drove alone to work from 100 percent. The resulting baseline value for the share of non-SOV travel for the Boston MA-NH-RI UZA was 33.6 percent.
In October 2017, the FHWA determined that MassDOT, NH DOT, the Boston Region MPO, and the Northern Middlesex Council of Governments (NMCOG) were required to establish the following targets for the Boston MA-NH-RI UZA for the percent of non-SOV travel measure:
To develop these targets, MassDOT and NH DOT used a series of five ACS five-year period estimates—from 2012 (2008–12 ACS estimate) to 2016 (2012–16 ACS estimate)—to create a linear trend line. This trend line suggests that over time the percent of non-SOV travel in the Boston UZA, as measured by the means of transportation to work, will increase. MassDOT and NH DOT then used this trend line to project ACS five-year estimates that would reflect expected conditions as of the end of CY 2019 (the expected 2015–19 ACS estimate) and as of the end of CY 2021 (the expected 2017–21 ACS estimate). MassDOT and NH DOT selected these projected values as the Boston MA-NH-RI UZA targets for the percent of non-SOV travel and established these values as the two-year and four-year targets for the Boston MA-NH-RI UZA. Figure 3 shows the historic five-year ACS estimates, the projected estimates, and the targets.
Figure 3
Actual Values and Targets for the Percent of Non-SOV Travel in the Boston MA-NH-RI UZA (as of September 2018)
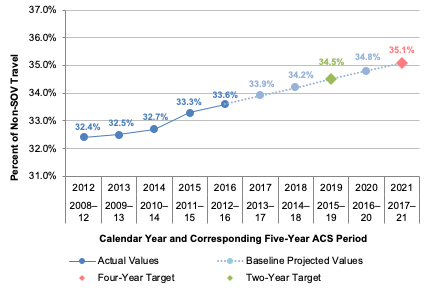
Note: Values in this figure reflect five year rolling averages for the percent of non-SOV travel to work.
ACS = US American Community Survey. MA = Massachusetts. NH = New Hampshire. Non-SOV = non-single-occupancy vehicle. RI = Rhode Island. UZA = urbanized area.
Sources: US Census Bureau, ACS Five-Year Estimates (Table DP03, “Selected Economic Characteristics”); MassDOT; NH DOT; and the Boston Region Metropolitan Planning Organization.
The Boston Region MPO is required to report UZA targets for the percent of non-SOV travelmeasure that are identical to those reported by MassDOT and NH DOT. The Boston Region MPO took action to adopt these initial performance targets for the percent of non-SOV travelmeasure on September 20, 2018. These target values are summarized in Table 2.
Table 2
Boston MA-NH-RI UZA Targets for the Percent of Non-SOV Travel Measure
CMAQ Traffic Congestion Performance Measure |
Baseline Data |
Baseline Value |
Two-Year Target |
Four-Year Target |
Percent of non-SOV travel |
ACS data available in 2017 (2012–16 estimates) |
33.6% |
34.5% |
35.1% |
ACS = US American Community Survey. CMAQ = Congestion Mitigation and Air Quality. CY = calendar year. MA = Massachusetts. NH = New Hampshire. Non-SOV = non-single-occupancy vehicle. RI = Rhode Island. UZA = urbanized area.
Sources: MassDOT, NH DOT, ACS and the Boston Region MPO.
The annual hours of PHED per capita measure estimates the expected delay experienced by a UZA’s population from travel on the NHS during peak periods. In 2018, MassDOT coordinated with Cambridge Systematics and NH DOT to develop a baseline estimate for this measure using the data elements outlined in Table 3.
Table 3
Data Elements for Calculating Annual Hours of PHED Per Capita
for the Boston MA-NH-RI UZA (as of September 2018)
PHED Measure Data Element |
Source for the Boston UZA |
UZA Boundary |
US Decennial Census |
UZA Population |
Population estimate for MA and NH portions of UZA, based on 2012–16 ACS block group data and expected Boston MSA population growth from 2016 to 2017 |
Reporting Segments |
2017 NPMRDS |
Travel times in 15-minute intervals |
2017 NPMRDS |
Hourly Traffic Volume |
AADT reported to the HPMS by Massachusetts and NH DOT |
Annual Vehicle Classification for Buses, Trucks, and Cars |
AADT, AADT single unit, and AADT combination unit classification data as reported to the HPMS |
Annual Vehicle Occupancy for Cars, Buses, and Trucks |
Data provided by FHWA in Average Vehicle Occupancy Factors for Computing Travel Time Reliability Measures and Total Peak Hour Excessive Delay Metrics, April 2018 |
AADT = average annual daily traffic. ACS = US American Community Survey. FHWA = Federal Highway Administration. HPMS = Highway Performance Monitoring System. MA = Massachusetts. MSA = Metropolitan Statistical Area. NH = New Hampshire. NPMRDS = National Performance Management Research Data Set. PHED = peak hour excessive delay. RI = Rhode Island. UZA = urbanized area.
Source: MassDOT, NH DOT, and Boston Region MPO staff.
Table 4 lists the components of the 2017 baseline value measure, including (1) a PHED estimate that reflects the NHS network within the Boston MA-NH-RI UZA and (2) the UZA population. Using these components, MassDOT, Cambridge Systematics, and NH DOT identified a baseline value of 18.3 annual hours of PHED per capita.
Table 4
Boston MA-NH-RI UZA Baseline for
Annual Hours of PHED Per Capita
MA and NH Annual Hours of PHED (CY 2017) |
Boston MA-NH-RI UZA Population (MA and NH Only)* |
Annual PHED Per Capita for the Boston MA-NH-RI UZA |
80,053,183 |
4,371,476 |
18.3 hours per person |
* Cambridge Systematics aggregated 2012–16 ACS population estimates at the block group level to estimate the population for the portion of the Boston UZA in Massachusetts and New Hampshire. Then this estimate was inflated for 2017 by applying information on expected population growth in the Boston Metropolitan Statistical area between 2016 and 2017. Rhode Island is excluded from these metrics because no part of the NHS system in the Boston UZA passes through Rhode Island.
ACS = American Community Survey. CY = calendar year. MA = Massachusetts. NH = New Hampshire. RI = Rhode Island. PHED = peak hour excessive delay. UZA = urbanized area.
Sources: National Performance Management Research Data Set, US Census Bureau ACS, Cambridge Systematics, FHWA, MassDOT, and NH DOT.
Based on FHWA’s 2017 applicability determination, MassDOT, NH DOT, the Boston Region MPO, and the NMCOG were required to establish a four-year target for the annual hours of PHED per capita measure, which reflects expected performance on this measure as of the end of CY 2021. These agencies also opted to report a two-year target for this measure, which reflects expected performance as of the end of CY 2019.
As previously discussed, MassDOT, Cambridge Systematics, and NH DOT coordinated with one another to process data from the National Performance Management Research Data Set (NPMRDS) and other data to create a baseline value for the Boston UZA for the annual hours of PHED per capita measure. They only examined NPMRDS travel-time data from CY 2017 when developing targets for the PHED measure because of the differences in features between the Version 1 and Version 2 NPMRDS that the US Department of Transportation had made available to states and MPOs. When setting targets, MassDOT, Cambridge Systematics, and NHDOT considered guidance from FHWA to states and MPOs, which explains that because there are differences between Versions 1 and 2 of the NPMRDS, using multiple years of data to set targets may not be the best approach, especially for four-year targets.6 MassDOT and NH DOT elected to set both a two-year target (reflecting performance as of the end of CY 2019) and a four-year target (reflecting performance as of the end of CY 2021) equal to the 2017 baseline value—18.3 annual hours of PHED per capita—and established these targets for the Boston MA-NH-RI UZA.
The Boston Region MPO is required to report UZA targets for the annual hours of PHED per capita measure that are identical to those reported by MassDOT and NH DOT. The Boston Region MPO took action to adopt these targets for the annual hours of PHED per capita measure on September 20, 2018. These target values are summarized in Table 5.
Table 5
Boston MA-NH- RI UZA Targets for the
Annual Hours of PHED per Capita Measure
CMAQ Traffic Congestion Performance Measure |
Baseline Value |
Two-Year Target (CYs 2018–19) |
Four-Year Target (CYs 2018–21) |
Annual hours of PHED per capita |
18.3 hours per person |
18.3 hours per person |
18.3 hours per person |
ACS = American Community Survey. CMAQ = Congestion Mitigation and Air Quality. CY = calendar year. MA = Massachusetts. NH = New Hampshire. PHED = peak hour excessive delay. RI = Rhode Island. UZA = urbanized area.
Sources: NPMRDS, FHWA, MassDOT, NH DOT, the US Census Bureau ACS and the Boston Region MPO.
This CMAQ Performance plan describes projects either wholly or partially funded with CMAQ funding that are being implemented—or are expected to be implemented—in the Boston region. These projects include those that have been selected by the Boston Region MPO and those that have been selected by MassDOT. Prior to programming, CMAQ investments that the MPO may fund are reviewed by the CMAQ Consultation Committee, which is responsible for determining whether a project shows an air quality benefit and is eligible for CMAQ funding. The members of the committee include representatives from MassDOT, the Massachusetts Department of Environmental Protection (DEP), the United States Department of Transportation (USDOT), US EPA, and Massachusetts MPOs.
Table 6 describes projects in the Boston region that fall into the following categories:
For each project, the table provides this information:
Table 6 notes where MPO staff have made updates to project descriptions, funding obligation years, or assessments of impacts on traffic congestion measures, as appropriate. Because none of these projects are in the carbon monoxide limited maintenance area in Waltham, this table does not include information about expected carbon monoxide emissions reduction.
While Boston Region MPO staff expects that these projects will help to reduce the excessive delay people experience, increase the share of non-SOV travel in the Boston MA-NH-RI UZA, and reduce emissions, MPO staff do not estimate that these projects have had an impact on the two-year traffic congestion or emission reduction performance targets described in Section 2. As noted in Table 6, projects for which CMAQ funds were obligated in FFY 2018 or FFY 2019 are all still under construction. It is possible that these projects may contribute to progress towards the four-year targets for the relevant measures if construction is complete, the facilities are open for use, and travel patterns have restabilized by the end of CY 2021. Also, the MPO has funded several small-scale projects through its Community Connections Program in FFY 2021—including signal improvements, carpool marketing support, new microtransit service, and bike shelters—that may be obligated for funding and implemented within that same year, and which could have an effect on progress toward the four-year targets. Transit-supporting projects funded through MassDOT’s Workforce Transportation Program may also contribute toward achieving the four-year targets. In general, however, the Boston Region MPO expects that the benefits of these projects will be realized in future years and support progress towards future sets of performance targets.
Table 7 describes CMAQ projects that, as of September 2018, were scheduled to be obligated for funding during FFYs 2018–21 but that have since been rescheduled for future federal fiscal years. Boston Region MPO staff will continue to monitor these projects and discuss their impacts in future CMAQ performance plans.
Table 6
CMAQ-funded Transportation Projects
Programmed in the Boston Region: FFYs 2018–21
| Project Name |
Project Category |
Project Description |
MPO Municipalities |
CMAQ Performance Plan Status |
Expected |
Implementation Status |
Relationship to Annual Hours of PHED per Capita Measure |
Relationship to the Percent of Non-SOV Travel Measure |
|---|---|---|---|---|---|---|---|---|
Green Line Extension to College Avenue with the Union Square Spur |
Transit Projects |
Extend the MBTA Green Line from a relocated Lechmere Station in East Cambridge to College Avenue in Medford, with a branch to Union Square in Somerville. |
Cambridge, Medford, and Somerville |
Included in 2018 Plan |
2017–19 (actual) |
Under construction |
This project is not on the NHS but may reduce PHED by providing an alternative to travel on nearby NHS routes. |
This project may increase non-SOV travel because it will expand a transit alternative to SOV travel. |
Southborough: Reconstruction of Main Street (Route 30) from Sears Road to Park Street |
Traffic Flow Improvement Projects |
Reconstruct Main Street to include new traffic signals. Improve roadway geometry and construct sidewalks. |
Southborough |
Included in 2018 Plan |
2018 (actual) |
Under construction |
This project is not on the NHS and not expected to affect PHED on the NHS network. It is expected to help reduce delay in the project corridor. |
This project may increase non-SOV travel by adding new sidewalks in the project corridor. |
Braintree: Adaptive Signal Controls on Route 37 (Granite Street) |
Traffic Flow Improvement Projects |
Implement adaptive signal controls on Route 37. |
Braintree |
Included in 2018 Plan |
2018 (actual) |
Under construction |
This project is on the NHS and may reduce PHED by implementing signals that adapt to changing traffic patterns and create smoother traffic flow. |
This project is not expected to increase non-SOV travel. |
Brookline: Intersection and Signal Improvements at Route 9 and Village Square (Gateway East) |
Traffic Flow Improvement Projects |
Revitalize the corridor by improving the streetscape and regional connections for bicycles and pedestrians. Realign Walnut Street to the intersection of Route 9 opposite Pearl Street to create a four-way intersection. Upgrade signals at the Washington Street/Brookline Avenue intersection and connect them with new signals at the Walnut Street/Pearl Street intersection.* |
Brookline |
Included in 2018 Plan |
2018 (actual) |
Under construction |
This project is on the NHS and may reduce PHED by improving signalization and roadway geometry. |
This project may increase non-SOV travel by enhancing bicycle and pedestrian amenities in the project corridor. |
Framingham-Natick: Cochituate Rail Trail (CRT) Construction |
Bicycle and Pedestrian Projects |
Construct 2.4 miles of rail trail, including connections to the Natick Mall at Speen Street, the Framingham section of the CRT, and North Main Street. Create a grade separated crossing at Route 30 and rehabilitate the CSX bridge over Route 9.* |
Framingham, Natick |
Included in 2018 Plan |
2019 (actual) |
Under construction |
This project is not on the NHS and not expected to affect PHED on the NHS network. |
This project may increase non-SOV travel because it will create connections in the region's bicycle and pedestrian network. |
Needham-Newton: Reconstruction of Highland Avenue, Needham Street and Charles River Bridge, From Webster Street (Needham) to Route 9 (Newton) |
Traffic Flow Improvement Projects |
Reconstruct Highland Avenue. The project will include the rehabilitation of the Charles River bridge, geometric improvements, sidewalk reconstruction, traffic signal equipment and/or timing upgrades, and implementation of bike lanes and shared use pathways.* |
Needham, Newton |
Included in 2018 Plan |
2019 (actual) and 2020 (expected) |
Under construction |
This project is not on the NHS but may reduce PHED on nearby NHS routes by improving signalization and roadway geometry. |
This project may increase non-SOV travel by expanding bicycle and pedestrian facilities in the project corridor. |
Hopedale-Milford: Resurfacing and Intersection Improvements on Route 16 (Main Street) |
Traffic Flow Improvement Projects |
Resurface the roadway, reconstruct sidewalks, and make other improvements to the intersection of Route 16 and Route 140, including upgrades to signal equipment and widening where feasible. |
Milford |
Included in 2018 Plan |
2019 (actual) |
Under construction |
This project is on the NHS and may reduce PHED by improving signalization and roadway geometry. |
This project may increase non-SOV travel by improving sidewalks in the project corridor. |
Acton-Concord: Bruce Freeman Rail Trail Construction (Phase IIB) |
Bicycle and Pedestrian Projects |
Construct a one-mile rail-to-trail project that connects to the existing 12-mile trail from Lowell to Acton. Replace the rail-trail bridge over Nashoba Brook, build a new rail-trail bridge over Route 2, and build a new Route 2 culvert over a wildlife crossing.* |
Acton, Concord |
Included in 2018 Plan |
2019 (actual) |
Under construction |
This project is not on the NHS and not expected to affect PHED on the NHS network. |
This project may increase non-SOV travel because it will create connections in the region's bicycle and pedestrian network. |
Brookline: Pedestrian Bridge Rehabilitation over MBTA off Carlton Street |
Bicycle and Pedestrian Projects |
Rehabilitate pedestrian bridge to restore pedestrian connection. |
Brookline |
Included in 2018 Plan |
2019 (actual) |
Advertised for construction |
This project is not on the NHS and not expected to affect PHED. |
This project may increase non-SOV travel because it will create connections in the region's pedestrian network. |
Natick: Reconstruction of Route 27 (North Main Street to Wayland town line) excluding the Route 9 Interchange |
Traffic Flow Improvement Projects |
Reconstruct Route 27. Implement minor widening to create a more consistent cross-section, construct sidewalks on both sides of the roadway, implement bicycle accommodations, upgrade existing signals, and add new signals at Lake Street, Rutledge Road, and Pine Street. |
Natick |
Included in 2018 Plan |
2020 (actual) |
Advertised for construction |
This project is on the NHS and may reduce PHED by improving signalization and roadway geometry. |
This project may increase non-SOV travel by expanding bicycle and pedestrian facilities in the project corridor. |
Hopkinton: Signal and Intersection Improvements on Route 135 |
Traffic Flow Improvement Projects |
Implement intersection improvements at Route 85, Pleasant Street and Wood Street. Planned improvements include signal equipment additions and upgrades and additional lanes at Route 85, possible signalization at Pleasant Street, and minor widening, geometric modifications and equipment upgrades at Wood Street. Reconstruct sidewalks and wheelchair ramps and implement streetscape enhancements.* |
Hopkinton |
Included in 2018 Plan |
2020 (expected) |
Advertised for construction |
This project is on the NHS and may reduce PHED by improving signalization and roadway geometry. |
This project may increase non-SOV travel by improving pedestrian accommodations in the project corridor.** |
Beverly: Intersection Improvements at Three Locations: Cabot Street (Route 1A/97 at Dodge Street [Route 1A]), County Way, Longmeadow Road and Scott Street; McKay Street at Balch Street; and Veterans Memorial Bridge (Route 1A at Rantoul, Cabot, Water, and Front Streets) |
Traffic Flow Improvement Projects |
Update and modernize traffic signal equipment, signalize or install a modern roundabout at the intersection of McKay Street at Balch Street, and provide ADA compliant wheelchair ramps at sidewalks at each intersection. Provide bike lanes at two of the three intersections. |
Beverly |
Included in 2018 Plan |
2020 (actual; changed from 2019) |
Under construction |
This project includes intersections on the NHS and may reduce PHED by improving signalization and roadway geometry. |
This project may increase non-SOV travel by enhancing bicycle and pedestrian travel at these intersections. |
Ashland: Reconstruction on Route 126 (Pond Street) from the Framingham Town Line to the Holliston Town Line |
Traffic Flow Improvement Projects |
Reconstruct Route 126. Install new and/or upgraded signals with optimized signal timing and phasing. Construct sidewalks on both sides of the corridor.* |
Ashland |
Included in 2018 Plan |
2020 (expected) |
Advertised for construction |
This project is on the NHS and may reduce PHED by improving signalization. |
This project may increase non-SOV travel by improving pedestrian facilities in the project corridor.** |
Malden: Exchange Street Downtown Improvement Project |
Traffic Flow Improvement Projects |
Improve sidewalks, ramps, crosswalks, sidewalk extensions (bump-outs), and bicycle accommodations, including an on-street bicycle lane and bicycle racks. Provide connections to the MBTA Malden Center station. |
Malden |
Included in 2018 Plan |
2020 (expected) |
Under construction |
This project is not on the NHS and not expected to affect PHED on the NHS network. |
This project may increase non-SOV travel by enhancing bicycle and pedestrian travel in the project corridor and to an MBTA transit station.** |
Cape Ann Regional Transportation Authority: First Mile/Last Mile On-Demand Service from Gloucester MBTA Station to Job Sites |
Transit Projects |
Pilot first- and last-mile transit services, that are targeted toward the workforce population utilizing commuter rail, providing service between the Gloucester MBTA commuter rail station and major employers in the area. |
Gloucester |
Added to 2020 Progress Report |
2020 (expected)† |
Implementation expected to start in FFY 2021† |
This project may support transit services on NHS routes and may reduce PHED by providing an alternative to SOV travel on these corridors. |
This project may increase non-SOV travel by offering a new transit option that connects commuter rail service to employment destinations. |
MetroWest Regional Transit Authority: MWRTA PACT Program (Public and Commerce Transit) |
Transit Projects |
Fund a staff person to conduct outreach with retail, corporate and multifamily housing facilities including along MWRTA routes; connect employers with existing public transit options; and explore potential pilot programs and public/private partnerships. |
MWRTA Service Area municipalities (Ashland, Dover, Framingham, Holliston, Hopkinton, Hudson, Marlborough, Milford, Natick, Sherborn, Southborough, Sudbury, Wayland, Wellesley, and Weston) |
Added to 2020 Progress Report |
2020 (expected)† |
Implementation expected to start in FFY 2021† |
This project may support transit or other non-SOV services on NHS routes and may reduce PHED by providing an alternative to SOV travel on these corridors. |
This project may increase non-SOV travel by encouraging use of transit and other non-SOV travel options. |
Walpole: Construction on Route 1A (Main Street) from the Norwood Town Line to Route 27 |
Traffic Flow Improvement Projects |
Implement intersection improvements and coordinated traffic signals with optimized timings. Construct new sidewalks on both sides of the road (except for the segment between the Bullard/Willet Street intersection and the Norwood town line) and provide four-foot shoulders along Route 1A for bicycle travel. Improve the Route 1A bridge over the Neponset River.* |
Walpole |
Included in 2018 Plan |
2020 (expected) |
Advertised for construction |
This project is not on the NHS but may reduce PHED on nearby NHS routes by improving signalization. |
This project may increase non-SOV travel by expanding bicycle and pedestrian accommodations in the project corridor. |
Everett: Reconstruction of Ferry Street, South Ferry Street, and a Portion of Elm Street |
Traffic Flow Improvement Projects |
Reconstruct Ferry Street from the Malden city line (Belmont Street) to Route 16 and Elm Street between Ferry Street and Woodlawn Street. The project will include resurfacing and the addition of new sidewalks, wheelchair ramps, curb extensions and bicycle accommodations. The traffic signals at five locations and the fire station will be upgraded and signals at Chelsea Street will be replaced by a roundabout.* |
Everett |
Included in 2018 Plan |
2021 (expected) |
Under design |
This project is not on the NHS but may reduce PHED on nearby NHS routes by improving signalization. |
This project may increase non-SOV travel by improving pedestrian accommodations in the project corridor.** |
Boston-Brookline: Multi-Use Path Construction on New Fenway (Phase 1) |
Bicycle and Pedestrian Projects |
Construct a new multi-use bike/pedestrian pathway from the Muddy River in Brookline to Maitland Street in Boston. |
Boston, Brookline |
Included in 2018 Plan |
2021 (expected; changed from 2020) |
Under design |
This project is not on the NHS and not expected to affect PHED on the NHS network. |
This project may increase non-SOV travel by providing a new bicycle and pedestrian facility. |
Dedham: Pedestrian Improvements along Elm Street and Rustcraft Road Corridors |
Bicycle and Pedestrian Projects |
Install new curbing, sidewalks, and ramps on both sides of the Elm Street/Rustcraft Road corridor. Implement minor roadway widening to accommodate shoulders for bicycle travel in each direction. |
Dedham |
Included in 2018 Plan |
2021 (expected) |
Under design |
This project is not on the NHS and not expected to affect PHED. |
This project may increase non-SOV travel by enhancing bicycle and pedestrian facilities in the project corridor and improving access to an MBTA commuter rail station.** |
Newton: Newton Microtransit Service |
Transit Projects |
Implement a new dynamically routed microtransit service that will provide shared, first- and last-mile rides between three MBTA rail lines and the Wells Avenue Business District before expanding citywide. This system will build on the Newton In Motion (NewMo) microtransit system operated by Via. |
Newton |
Added to 2020 Progress Report |
2021–23 (expected) |
Implementation expected to start in 2021 |
This service may operate on NHS routes and may reduce PHED by providing an alternative to SOV travel on these corridors. |
This project may increase non-SOV travel by providing a new transit option. |
Somerville: Davis Square Signal Improvements
|
Traffic Flow Improvement Projects |
Improve the traffic signals throughout Davis Square in Somerville, with a specific focus on upgrading the transit signals supporting the operations of the Davis Square MBTA busway. |
Somerville |
Added to 2020 Progress Report |
2021 (expected) |
Implementation expected to start in 2021 |
This project is not on the NHS and not expected to affect PHED on the NHS network. It may help reduce delay in the project area. |
This project may increase non-SOV travel by improving transit mobility, which may make it a more attractive travel option. |
Cambridge: Concord Avenue Transit Signal Priority |
Traffic Flow Improvement Projects |
Add transit signal priority equipment along the Concord Avenue corridor in Cambridge, with the goal of reducing travel times for several MBTA bus routes. |
Cambridge |
Added to 2020 Progress Report |
2021 (expected) |
Implementation expected to start in 2021 |
This project is not on the NHS and not expected to affect PHED on the NHS network. It may help reduce delay in the project area. |
This project may increase non-SOV travel by improving transit mobility, which may make it a more attractive travel option. |
Sharon: Carpool Marketing
(MPO Community Connections project) |
Transportation Demand Management Projects |
Fund and develop a partnership with a carpool marketing firm to promote shared rides to Sharon’s MBTA commuter rail station. |
Sharon |
Added to 2020 Progress Report |
2021 (expected) |
Implementation expected to start in 2021 |
This project is not on the NHS but may reduce congestion and PHED on nearby NHS routes by encouraging travelers to carpool. |
This project may increase non-SOV travel by supporting a non-SOV alternative travelers can use to access transit. |
Concord: Bruce Freeman Rail Tail Bike Shelters (MPO Community Connections project) |
Bicycle and Pedestrian Projects |
Construct several protected bike racks near the West Concord MBTA commuter rail station to support commuters who ride the Bruce Freeman Rail Trail to the train station. |
Concord |
Added to 2020 Progress Report |
2021 (expected) |
Implementation expected to start in 2021 |
This project is not on the NHS and not expected to affect PHED on the NHS network. |
This project may increase non-SOV travel by supporting bicycle and pedestrian trips, including those made to access transit. |
Note: The CMAQ project list in the Boston Region MPO’s 2018 CMAQ Performance plan included a CMAQ-funded Community Connections investment program designed to support first- and last-mile solutions and community transportation. This 2020 table no longer includes the program as a line item, but instead lists Community Connections projects that the MPO selected for funding in FFY 2021.
* This description has been updated since the 2018 CMAQ Performance Plan.
** This assessment has been updated since the 2018 CMAQ Performance Plan.
† This project has been selected to receive funding, including CMAQ funds, through MassDOT's FY 2020 Workforce Transportation Program. Although the COVID-19 pandemic delayed the development of the final scope of work (SOW), the SOW has now been finalized and funding has been obligated.
ADA = Americans with Disabilities Act. CMAQ = Congestion Mitigation and Air Quality Improvement. FFY = federal fiscal year. MBTA = Massachusetts Bay Transportation Authority. MPO = Metropolitan Planning Organization. NHS = National Highway System. Non-SOV = non-single-occupancy vehicle. PHED = peak hours of excessive delay.
Source: Boston Region MPO staff.
Table 7
CMAQ-funded Transportation Projects Programmed in the Boston Region Rescheduled to FFY 2022 and Beyond
| Project Name |
Project Category |
Project Description |
MPO Municipalities |
Expected CMAQ Obligation Year (FFY) |
Relationship to Annual Hours of PHED per Capita Measure |
Relationship to the Percent of Non-SOV Travel Measure |
|---|---|---|---|---|---|---|
Lynn: Reconstruction on Route 129 (Lynnfield Street) from Great Roads to Wyoma Street |
Traffic Flow Improvement Projects |
Reconstruct Route 29 from Colonial Avenue to approximately 150 feet south of Floyd Avenue. Improve intersections, signage, and curbing, and add new sidewalks and wheelchair ramps, among other project features.* |
Lynn |
2022 (changed from 2020) |
This project is on the NHS and may reduce PHED by improving signalization. |
This project may increase non-SOV travel by expanding pedestrian facilities in the project corridor.** |
Boston: Improvements on Boylston Street, from Intersection of Brookline Avenue and Park Drive to Ipswich Street |
Traffic Flow Improvement Projects |
Improve existing roadway geometry and upgrade the signal equipment at five intersections on Boylston Street. Expand pedestrian and bicycle facilities, including by providing exclusive bike lanes in both directions. |
Boston |
2022 (changed from 2021) |
This project is on the NHS and may reduce PHED by improving signalization and roadway geometry. |
This project may increase non-SOV travel by expanding bicycle and pedestrian facilities in the project corridor. |
Norwood: Intersection Improvements at Route 1A and Upland Road/Washington Street and Prospect Street/Fulton Street |
Traffic Flow Improvement Projects |
Install signals and implement geometric improvements at two intersection locations on Route 1A. Widen Washington Street and Upland Road to accommodate turning lanes and reconstruct sidewalks to meet ADA/AAB standards.* |
Norwood |
2022 (changed from 2021) |
This project is not on the NHS and not expected to affect PHED on NHS roadways. It may help reduce delay in the project area. |
This project may increase non-SOV travel by improving pedestrian accommodations in the project area.** |
Wakefield-Lynnfield: Rail Trail Extension, from the Galvin Middle School to the Lynnfield/Peabody Town Line |
Bicycle and Pedestrian Projects |
Construct a 4.4-mile rail trail extension, which will be part of the proposed 30-mile Border to Boston Trail. |
Lynnfield, Wakefield |
2024 (changed from 2021) |
This project is not on the NHS and not expected to affect PHED. |
This project may increase non-SOV travel because it will create connections in the region's bicycle and pedestrian network, which may include connections to schools and the Wakefield MBTA commuter rail station.** |
* This description has been updated since the 2018 CMAQ Performance Plan.
** This assessment has been updated since the 2018 CMAQ Performance Plan.
AAB = Architectural Access Board. ADA = Americans with Disabilities Act. CMAQ = Congestion Mitigation and Air Quality Improvement. FFY = federal fiscal year. MBTA = Massachusetts Bay Transportation Authority. MPO = Metropolitan Planning Organization. NHS = National Highway System. Non-SOV = non-single-occupancy vehicle. PHED = peak hours of excessive delay.
Source: Boston Region MPO staff.
In its October 2019 applicability determination, the FHWA maintained that the Boston Region MPO must fulfill performance management requirements for the total emissions reduction measure for the first federal performance-monitoring period (FFYs 2018–21 for this measure). As previously mentioned, these apply specifically to the carbon monoxide maintenance area in Waltham. MPO staff gathered information about recent transportation improvement projects from FFY 2018 and FFY 2019 lists of federally obligated projects, and staff did not identify any projects that are (1) located in Waltham, and (2) funded all or in part with CMAQ dollars. As a result, the value for the total emissions reduction measure as of the mid-point of the performance period equals the baseline value of zero (0) kilograms.
In 2018, the Boston Region MPO set two-year and four-year targets for the total emissions reduction measure, both of which were equal to zero (0) kilograms. (See Section 2.1 for details.) As previously mentioned, the MPO’s estimated mid-point, or two-year, performance value and its two-year target value are both equal to zero (0) kilograms. MPO staff used project data from the MPO’s FFY 2020–24 TIP (as amended) and its FFYs 2021–25 TIP to estimate whether it would likely achieve its four-year performance target for this measure, which is a reduction of zero (0) kilograms per day. Staff ultimately did not identify any projects that have been obligated or programmed in FFY 2020, or that are expected to be programmed in FFY 2021, that are both (1) located in Waltham and (2) expected to receive CMAQ funding. As a result, the MPO’s expected emissions reduction value as of the end of the first performance period (FFY 2021) and its four-year target both equal zero (0) kilograms. Because of this finding, the MPO will maintain the four-year target it set in 2018.
Table 8 summarizes information about the Boston Region MPO’s baseline and mid-performance-period values for the total emissions reduction measure and about the MPO’s performance targets for this measure.
Table 8
Boston Region MPO Emissions Reduction Measure Values and Targets
Performance Measure |
Baseline Value (FFYs 2014–17 data) |
Two-Year Target (FFYs 2018–19) |
Two-Year Value (FFYs 2018–19 data) |
Four-Year Target (FFYs 2018–21) |
Daily kilograms of CO emissions reduction from CMAQ projects in Boston region nonattainment or maintenance areas |
0 kg per day |
0 kg per day |
0 kg per day |
0 kg per day |
Note: A limited maintenance area for carbon monoxide is located in Waltham. The baseline and mid-point values are based on data about projects that have been federally obligated with CMAQ dollars during relevant time periods.
CMAQ = Congestion Mitigation and Air Quality. CO = carbon monoxide. FFY = federal fiscal year. MPO = Metropolitan Planning Organization.
Source: Boston Region MPO.
In its October 2019 applicability determination, the FHWA maintained that the Boston Region MPO must fulfill performance management requirements for traffic congestion measures for the first federal performance-monitoring period (CYs 2018–21 for these measures). These measures include both the percentof non-SOV travel measure and the annual peak hours of excessive delay per capita measure, both of which are calculated for the Boston MA-NH-RI UZA.
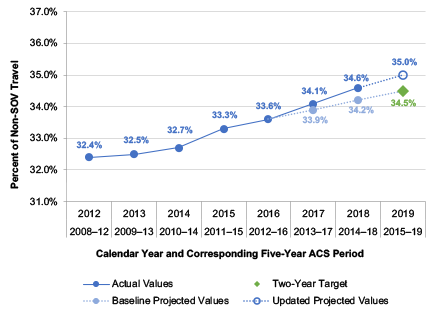
As discussed in Section 2.2, MassDOT, NH DOT, the Boston Region MPO and the NMCOG identified a baseline value for the percent of non-SOV travel in the Boston MA-NH-RI UZA using estimates of means of transportation to work for workers ages 16 and older from the 2012–16 US ACS. This baseline value, which was calculated by subtracting the estimated share of workers age 16 and older who drove alone from 100 percent, equaled 33.6 percent. In 2020, these agencies examined 2013–17 and 2014–18 ACS data, as outlined in tables DP03 (“Selected Economic Characteristics”), S0801 (“Commuting Characteristics by Sex”) and others, to refine their collective understanding of trends in non-SOV travel. They found that over time, the percentage of non-SOV travel has continued to rise in the Boston MA-NH-RI UZA, with the value calculated using 2013–17 ACS data equal to 34.1 percent, and the value calculated using 2014–18 ACS data equal to 34.6 percent.
Table 2 in Section 2.2 shows the targets that MassDOT, NH DOT, the Boston Region MPO, and the NMCOG set for the percent of non-SOV travel measure in 2018. Figure 4 displays past and more recent actual values for this performance measure, along with the two-year target. MassDOT staff calculated a trend line using available actual values for this measure, which suggests that the five-year rolling average of the percentage of non-SOV travel to work would increase by approximately 0.4 percentage points per year. As shown in the figure, if the trend of past growth in non-SOV travel to work continued through 2019 the Boston MA-NH-RI UZA would likely exceed its two-year target of 34.5 percent non-SOV travel.
Figure 4
Updated Actual and 2019 Projected Values for the
Percent of Non-SOV Travel in the Boston MA-NH-RI UZA
(as of September 2020)
ACS = US American Community Survey. MA = Massachusetts. NH = New Hampshire. Non-SOV = non-single-occupancy vehicle. RI = Rhode Island. UZA = urbanized area.
Sources: US Census Bureau, ACS Five-Year Estimates (Table DP03, “Selected Economic Characteristics”); MassDOT; NH DOT; and Boston Region Metropolitan Planning Organization staff.
The trend line also suggests that the share of non-SOV travel in the Boston MA-NH-RI UZA might meet or exceed the initial four-year target of 35.1 percent, which was set in 2018. It is important to note that the COVID-19 pandemic, along with related public and private sector responses, has affected 2020 travel patterns across modes and will likely have impacts on travel in 2021 as well. Fluctuations in SOV traffic volumes, transit ridership, and carpool, taxi, and rideshare travel do introduce some uncertainty. However, some changes, such as increased teleworking, may complement the ongoing investments by MassDOT, NH DOT, the Boston Region MPO, the NMCOG, and other agencies in the Boston UZA in projects that encourage travelers to use alternatives to SOVs when traveling to work and other destinations. Also, the five-year rolling average value associated with the four-year target (2017–21) will capture improvements in non-SOV travel made in 2017, 2018, and 2019, even if uncertainties will affect travel choices in 2020 and 2021. Given these updated data points and assumptions, MassDOT and NH DOT—in consultation with the Boston Region MPO and NMCOG staff—plan to update the Boston UZA’s four-year performance target for the percent of non-SOV travel measure from 35.1 percent to 35.8 percent. This target adjustment is shown in Figure 5.
Figure 5
Updated Actual Values, Projected Values, and Four-Year Target for the
Percent of Non-SOV Travel in the Boston MA-NH-RI UZA (as of September 2020)
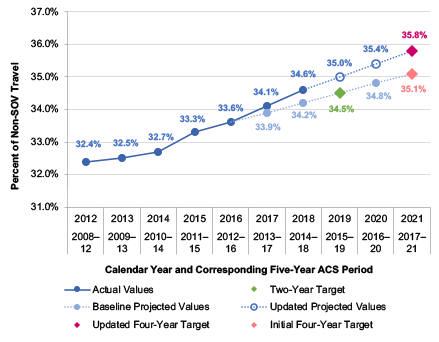
Note: Values in this figure reflect five-year rolling averages for the percent of non-SOV travel to work for workers ages 16 and older.
ACS = US American Community Survey. MA = Massachusetts. NH = New Hampshire. Non-SOV = non-single-occupancy vehicle. RI = Rhode Island. UZA = urbanized area.
Sources: US Census Bureau, ACS Five-Year Estimates (Table DP03, “Selected Economic Characteristics”); MassDOT; NH DOT; and Boston Region Metropolitan Planning Organization staff.
MassDOT and MPO staff discussed the proposed adjustment to the percent of non-SOV travel target and received positive feedback from Boston Region MPO members. Targets for the percent of non-SOV travel measure, including the adjusted four-year target, are summarized in Table 9.
Table 9
Boston MA-NH-RI UZA Percent of
Non-SOV Travel Measure Values and Targets
Performance Measure |
Baseline Value (CYs 2012–16 average) |
Two-Year Target (CYs 2015–19 average) |
Projected Two-Year Value (CYs 2015–19 average) |
Adjusted Four-Year Target (CYs 2017–21 average) |
Percent of non-SOV travel |
33.6% |
34.5% |
35.0% |
35.8% |
Note: Values in this table reflect five-year rolling averages for the percent of non-SOV travel to work.
ACS = US American Community Survey. CY = calendar year. MA = Massachusetts. NH = New Hampshire. Non-SOV = non-single-occupancy vehicle. RI = Rhode Island. UZA = urbanized area.
Sources: US Census Bureau, ACS Five-Year Estimates (Table DP03, “Selected Economic Characteristics”); MassDOT; NH DOT; and Boston Region Metropolitan Planning Organization staff.
As discussed in Section 2.2, the annual hours of PHED per capita measure estimates the expected excessive delay experienced by a UZA’s population from travel on the NHS during peak periods. MassDOT and NH DOT worked with The Center for Advanced Transportation Technology Laboratory (CATT Lab) at the University of Maryland, INRIX, and Boston Region MPO staff to develop updated estimates of the annual hours of PHED per capita measure for CYs 2018 and 2019 using the data sources described in Table 10.
Table 10
Data Elements for Calculating Annual Hours of PHED Per Capita
for the Boston MA-NH-RI UZA (as of September 2020)
PHED Measure Data Element |
Source for the Boston MA-NH-RI UZA |
UZA Boundary |
US Decennial Census |
UZA Population |
Population estimate for MA and NH portions of the Boston MA-NH-RI UZA, based on ACS block group data (rolling 5-year estimates) |
Reporting Segments |
2018 and 2019 HPMS data for Massachusetts and New Hampshire |
Travel times in 15-minute intervals |
2018 and 2019 HPMS data for Massachusetts and New Hampshire |
Hourly Traffic Volume |
AADT reported to the HPMS by Massachusetts and NH DOT |
Annual Vehicle Classification for Buses, Trucks, and Cars |
AADT, AADT single unit, and AADT combination unit classification data as reported to the HPMS by Massachusetts and New Hampshire |
Annual Vehicle Occupancy for Cars, Buses, and Trucks |
Data provided by FHWA in Average Vehicle Occupancy Factors for Computing Travel Time Reliability Measures and Total Peak Hour Excessive Delay Metrics, April 2018 |
AADT = average annual daily traffic. ACS = US American Community Survey. FHWA = Federal Highway Administration. HPMS = Highway Performance Monitoring System. MA = Massachusetts. MSA = Metropolitan Statistical Area. NH = New Hampshire.. RI = Rhode Island. UZA = urbanized area.
Source: MassDOT, NH DOT, and Boston Region MPO.
Table 11 lists the components of the annual hours of PHED per capita measure for CYs 2017, 2018, and 2019. These include (1) a PHED estimate that reflects the NHS network within the Boston MA-NH-RI UZA and (2) the UZA population. This table also lists the values for the annual hours of PHED per capita measure for each year.
Table 11
Boston MA-NH-RI UZA Values for Annual Hours of PHED Per Capita
(as of September 2020)
Year |
MA and NH Annual PHED |
Boston MA-NH-RI UZA Population (MA and NH Only)* |
Annual PHED Per Capita for the Boston MA-NH-RI UZA |
2017 (baseline) |
80,053,183 |
4,371,476 |
18.3 |
2018 |
101,084,000 |
4,420,143 |
22.9 |
2019 |
113,017,780 |
4,480,127 |
25.2 |
* These population estimates are based on five-year ACS estimates at the block group level for the population in the portion of the Boston MA-NH-RI UZA in Massachusetts and New Hampshire. Rhode Island is excluded from these metrics because no part of the NHS system in the Boston MA-NH-RI UZA passes through Rhode Island.
ACS = American Community Survey. HPMS = Highway Performance Monitoring System. MA = Massachusetts. NH = New Hampshire. NHS = National Highway System. PHED = peak hour excessive delay. RI = Rhode Island. UZA = urbanized area.
Sources: HPMS data for Massachusetts and New Hampshire, US Census Bureau ACS, MassDOT, NH DOT, the Center for Advanced Transportation Technology Laboratory (CATT Lab) at the University of Maryland, INRIX, and Boston Region Metropolitan Planning Organization staff.
The 2018 and 2019 estimates reflect an increase compared to the baseline value of 18.3 hours of delay per capita from 2017. As described in Section 2.2, the initial value and targets for this measure were calculated with a limited amount of historic data, given differences between the Version 1 and Version 2 NPMRDS that were available in 2018. Also, MassDOT staff notes that several data-related factors may affect these more recent estimates. For example, the segments included on the NHS network in the NPMRDS vary from set to set, which affects the amount of excessive delay that states and MPOs are able to account for in their calculations. While congestion may have increased in the Boston MA-NH-RI UZA over the past several years, these issues complicate any analysis of trends.
Table 5 in Section 2.2 shows the targets that MassDOT, NH DOT, the Boston Region MPO, and NMCOG set for the annual hours of PHED per capita measure in 2018. As previously discussed, recent values for this measure are higher than the 2017 baseline, though several data-related factors are likely influencing the calculations. Also, the COVID-19 pandemic, along with related public and private sector responses, has impacted travel behavior across modes in 2020 and will likely continue to do so in 2021. Given these circumstances and uncertainty, MassDOT and NH DOT have not proposed any changes to the existing four-year performance target of 18.3 hours of peak-hour excessive delay per capita. Table 12 lists the two-year target, the estimated two-year value, and the four-year performance target for the annual hours of PHED per capita measure.
Table 12
Boston MA-NH-RI UZA Targets for the Annual Hours of PHED
Per Capita Measure (as of September 2020)
Performance Measure |
Baseline Value |
Two-Year |
Estimated Two-Year |
Four-Year (CY 2021) Target |
Annual hours of PHED per capita |
18.3 hours per person |
18.3 hours per person |
25.2 hours per person |
18.3 hours per person |
CY = calendar year. MA = Massachusetts. NH = New Hampshire. PHED = peak hour excessive delay. RI = Rhode Island. UZA = urbanized area.
Sources: NPMRDS, US Census Bureau American Community Survey, MassDOT, NH DOT, the Center for Advanced Transportation Technology Laboratory (CATT Lab) at the University of Maryland, INRIX, and Boston Region Metropolitan Planning Organization staff.
In CY 2022, Boston Region MPO staff will prepare a Full Performance Period CMAQ Progress Report for the first performance period in accordance with FHWA applicability determinations and other requirements. This final progress report will describe four-year performance for the federally required CMAQ performance measures, along with updates about CMAQ-funded projects in the Boston region and their expected impacts on performance with respect to CMAQ measures and targets. The Boston Region MPO will also produce the CMAQ performance plan for the second federal performance period in CY 2022. The second performance period begins on January 1, 2022, and extends through December 31, 2025, for CMAQ traffic congestion performance measures (CYs 2022 through 2025). For the on-road mobile source emissions measure, the second performance period begins on October 1, 2011, and ends on September 30, 2025 (FFYs 2022 through 2025).
Questions pertaining to this Boston Region MPO CMAQ Performance Plan can be addressed to Michelle Scott or Anne McGahan of the Boston Region MPO staff. Staff contact information is available athttps://www.bostonmpo.org/ctps_staff.
The Boston Region Metropolitan Planning Organization (MPO) operates its programs, services, and activities in compliance with federal nondiscrimination laws including Title VI of the Civil Rights Act of 1964 (Title VI), the Civil Rights Restoration Act of 1987, and related statutes and regulations. Title VI prohibits discrimination in federally assisted programs and requires that no person in the United States of America shall, on the grounds of race, color, or national origin (including limited English proficiency), be excluded from participation in, denied the benefits of, or be otherwise subjected to discrimination under any program or activity that receives federal assistance. Related federal nondiscrimination laws administered by the Federal Highway Administration, Federal Transit Administration, or both, prohibit discrimination on the basis of age, sex, and disability. The Boston Region MPO considers these protected populations in its Title VI Programs, consistent with federal interpretation and administration. In addition, the Boston Region MPO provides meaningful access to its programs, services, and activities to individuals with limited English proficiency, in compliance with U.S. Department of Transportation policy and guidance on federal Executive Order 13166. The Boston Region MPO also complies with the Massachusetts Public Accommodation Law, M.G.L. c 272 sections 92a, 98, 98a, which prohibits making any distinction, discrimination, or restriction in admission to, or treatment in a place of public accommodation based on race, color, religious creed, national origin, sex, sexual orientation, disability, or ancestry. Likewise, the Boston Region MPO complies with the Governor's Executive Order 526, section 4, which requires that all programs, activities, and services provided, performed, licensed, chartered, funded, regulated, or contracted for by the state shall be conducted without unlawful discrimination based on race, color, age, gender, ethnicity, sexual orientation, gender identity or expression, religion, creed, ancestry, national origin, disability, veteran's status (including Vietnam-era veterans), or background. A complaint form and additional information can be obtained by contacting the MPO or at http://www.bostonmpo.org/mpo_non_discrimination. To request this information in a different language or in an accessible format, please contact Title VI Specialist |
1 The first performance period begins on January 1, 2018, and extends through December 31, 2021, for CMAQ traffic congestion performance measures (calendar years 2018 through 2021). For the on-road mobile source emissions measure, the first performance period begins on October 1, 2017, and ends on September 30, 2021 (federal fiscal years 2018 through 2021).
2 FHWA, “Applicability Determination: CMAQ Traffic Congestion and CMAQ On-road Mobile Source Emissions Measures,” https://www.fhwa.dot.gov/environment/air_quality/cmaq/ measures/cmaq_applicability/october_2017/cmaqaqpplicability2018.pdf, accessed September 24, 2020, page 13.
3 FHWA, Applicability Determination: CMAQ Traffic Congestion and CMAQ On Road Mobile Source Emissions Measures, as of October 1, 2019,” https://www.fhwa.dot.gov/environment/ air_quality/cmaq/measures/cmaq_applicability/october_2019/cmaqaqpplicability2019.pdf, accessed September 24, 2020, page 14.
4 FHWA, “Applicability Determination: CMAQ Traffic Congestion and CMAQ On-road Mobile Source Emissions Measures,” page 27.
5 FHWA, “Applicability Determination: CMAQ Traffic Congestion and CMAQ On Road Mobile Source Emissions Measures, as of October 1, 2019,” page 28.
6 FHWA, “Frequently Asked Questions: Target Setting,” https://www.fhwa.dot.gov/tpm/ faq.cfm#targ, accessed September 24, 2020.