Project Manager
Chen-Yuan Wang
Project Principal
Mark Abbott
Data Analysts
Chen-Yuan Wang
Chaopeng Hu
Graphics
Kenneth Dumas
Kim DeLauri
Cover Design
Kim DeLauri
Editor
Meghan O’Connor
The preparation of this document was supported
by the Federal Highway Administration through
MPO Planning Contract #105757 and MPO §5303 Contract #102694.
Central Transportation Planning Staff is
directed by the Boston Region Metropolitan
Planning Organization (MPO). The MPO is composed of
state and regional agencies and authorities, and
local governments.
June 2021

For general inquiries, contact
Central Transportation Planning Staff
State Transportation Building
Ten Park Plaza, Suite 2150
Boston, Massachusetts 02116
857.702.3700
617.570.9192 (fax)
The Boston Region Metropolitan Planning Organization (MPO) operates its programs, services, and activities in compliance with federal nondiscrimination laws including Title VI of the Civil Rights Act of 1964 (Title VI), the Civil Rights Restoration Act of 1987, and related statutes and regulations. Title VI prohibits discrimination in federally assisted programs and requires that no person in the United States of America shall, on the grounds of race, color, or national origin (including limited English proficiency), be excluded from participation in, denied the benefits of, or be otherwise subjected to discrimination under any program or activity that receives federal assistance. Related federal nondiscrimination laws administered by the Federal Highway Administration, Federal Transit Administration, or both, prohibit discrimination on the basis of age, sex, and disability. The Boston Region MPO considers these protected populations in its Title VI Programs, consistent with federal interpretation and administration. In addition, the Boston Region MPO provides meaningful access to its programs, services, and activities to individuals with limited English proficiency, in compliance with U.S. Department of Transportation policy and guidance on federal Executive Order 13166.
The Boston Region MPO also complies with the Massachusetts Public Accommodation Law, M.G.L. c 272 sections 92a, 98, 98a, which prohibits making any distinction, discrimination, or restriction in admission to, or treatment in a place of public accommodation based on race, color, religious creed, national origin, sex, sexual orientation, disability, or ancestry. Likewise, the Boston Region MPO complies with the Governor's Executive Order 526, section 4, which requires that all programs, activities, and services provided, performed, licensed, chartered, funded, regulated, or contracted for by the state shall be conducted without unlawful discrimination based on race, color, age, gender, ethnicity, sexual orientation, gender identity or expression, religion, creed, ancestry, national origin, disability, veteran's status (including Vietnam-era veterans), or background.
A complaint form and additional information can be obtained by contacting the MPO or at http://www.bostonmpo.org/mpo_non_discrimination. To request this information in a different language or in an accessible format, please contact
Title VI Specialist
Boston Region MPO
10 Park Plaza, Suite 2150
Boston, MA 02116
civilrights@ctps.org
By Telephone:
857.702.3702 (voice)
For people with hearing or speaking difficulties, connect through the state MassRelay service:
Relay Using TTY or Hearing Carry-over: 800.439.2370
Relay Using Voice Carry-over: 866.887.6619
Relay Using Text to Speech: 866.645.9870
For more information, including numbers for Spanish speakers, visit https://www.mass.gov/massrelay
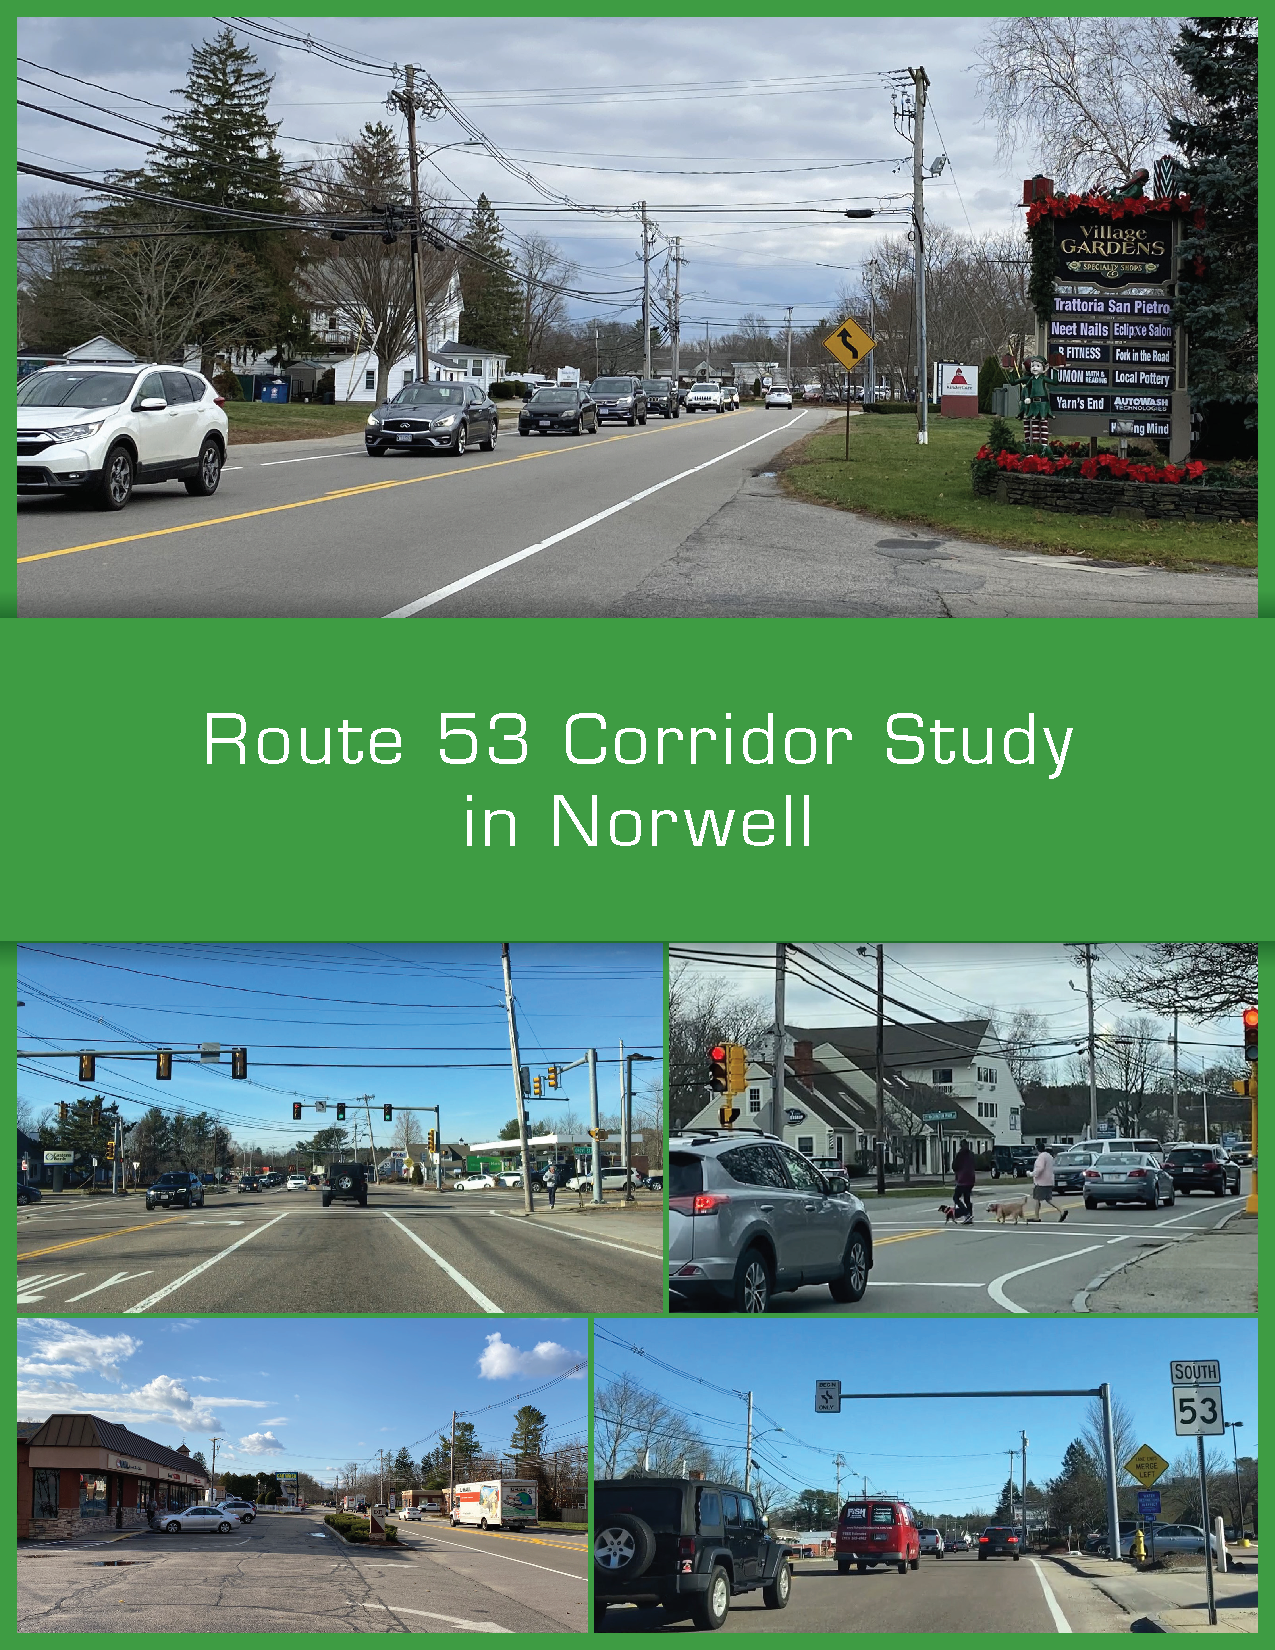
The Route 53 Corridor Study in Norwell is one in a series of studies supported by the Boston Region Metropolitan Planning Organization that address safety, mobility, and access on the Boston region’s roadways. This report identifies specific transportation issues and concerns in the Route 53 corridor in Norwell, Massachusetts; presents an in-depth analysis of multiple transportation-related factors, such as accommodations for people who walk and bike and safe access to adjacent businesses; proposes short- and long-term improvements to address the problems; and provides a vision for the corridor’s long-term development.
Chapter 2—Existing Conditions and Issues
Chapter 3—Roadway Operations Analysis
Chapter 5—Proposed Improvements
Chapter 6—Summary and Recommendations
Each year, the Boston Region Metropolitan Planning Organization (MPO) conducts outreach to local agencies, municipalities, the public, and other stakeholders during the development of the Unified Planning Work Program, a program of studies and research projects that provide transportation planning and technical assistance to municipalities and agencies in the Boston region. The purpose of this outreach is to gather information about specific transportation problems in the region so that studies may be conducted to analyze these issues, and projects may be developed to address these issues to improve the operation of the transportation system as a whole.
The MPO’s series of Subregional Priority Roadways studies grew out of this information-gathering process. These studies identify safety, mobility, access, and other transportation-related concerns on specific roadways identified as requiring improvements by subregional planning groups. The studies evaluate potential multimodal solutions to the problems and then make recommendations for agencies and municipalities to implement. Each year, the Boston Region MPO chooses an arterial or collector roadway for staff to analyze, which results in recommendations for short- and long-term improvements for that roadway area.
Selecting a study area in the Boston region is a thorough and exacting process, based on many factors. In any large metropolitan region, there are many roadways that need improvement, so it can be a challenge to single out just one. However, because the MPO’s Subregional Priority Roadways program is ongoing, MPO staff can address each problem area methodically, according to priority and regional needs.
This report focuses on Route 53 in Norwell, Massachusetts. It contains a review of existing conditions, various safety and operations analyses, and proposed short- and long-term improvements to address the problems in the study corridor.
Key issues and concerns identified for the corridor include the following:
The recommended short-term improvements could enhance safety for all users and improve traffic operations in the study area. With a high benefit-to-cost ratio, these short-term improvements should be considered and implemented as soon as resources are available. Three projects were identified and recommended for implementation in the short term:
Significantly improving the safety, mobility, and access for all users of the roadway would require a series of long-term improvements. These are the major long-term improvements proposed for the corridor and the expected benefits:
This report provides a detailed review and recommendations for improvements that address the transportation issues in the Route 53 corridor in Norwell. By addressing these problems systematically through the Subregional Priority Roadways program, the resulting improvements will help to enhance quality of life, support economic development, and improve air quality throughout the region.
During development of the Unified Planning Work Program (UPWP) and the Long-Range Transportation Plan (LRTP), the Boston Region Metropolitan Planning Organization (MPO) gathers feedback from the public, municipalities, the Metropolitan Area Planning Council’s (MAPC) subregional groups, and the Massachusetts Department of Transportation (MassDOT) to identify transportation problems in the region. These problems generally involve accommodations for people who walk and bike, freight movement, traffic bottlenecks, safety of roadway users, and safe or convenient access for abutters along roadway corridors—problems that can adversely affect the region’s quality of life, economic development, and air quality.
Each year, the MPO conducts a study, Addressing Safety, Mobility, and Access on Subregional Priority Roadways, to identify roadway segments in the Boston region that are of concern to stakeholders, but that have not been cited in the regional needs assessment conducted for the LRTP.1 The Subregional Priority Roadways studies focus on arterial or collector roadways and result in recommendations for short- and long-term improvements. Funding for the Route 53 Corridor Study in Norwell was documented in the federal fiscal year (FFY) 2020 UPWP, and a work program outlining the study was approved by the MPO board on October 1, 2019.2
The Route 53 Corridor Study in Norwell focused on safety, mobility and access, and specific concerns related to bicycle and pedestrian transportation, multiuse trail feasibility, and other subjects raised by stakeholders. The objectives of the study were to
The MPO selected Route 53 in Norwell by assessing 22 roadway corridors in the Boston region that were identified as potential candidates for study by various sources, including 1) suggestions heard during outreach for the FFY 2020 UPWP; 2) concerns documented in meeting records from the UPWP outreach process for the past five years; and 3) data from the MPO’s Congestion Management Process. MPO staff assembled detailed data about these roadways and evaluated them according to the following selection criteria:
The selected Route 53 corridor contains mainly commercial developments, including large scale shopping plazas and street-front retailers, and some multiunit residents and single-family houses. All the segments in the corridor are classified as urban minor arterial. The roadway carries regional and local traffic, with a crash rate higher than the state average for urban minor arterials. It lacks accommodation for people who bike and has insufficient accommodation for people who walk with many sidewalk gaps.
The Town of Norwell is currently planning to enhance the vibrancy, safety, and livability of the Route 53 corridor through land use changes and roadway improvements. This study supports the Town’s goals by analyzing existing transportation conditions and identifying potential improvements to make the corridor safer and enhance mobility. The study was strongly endorsed by all stakeholders, including the Town of Norwell, MAPC, and MassDOT.
The study corridor is approximately 2.2 miles long from Route 228 (Main Street in Hingham and Pond Street in Norwell) to Assinippi Avenue in Norwell. The study area covers Route 53 (Washington Street) and its adjacent areas and connected roadways. Major cross streets in the corridor include Main Street (Hingham), Pond Street, High Street, Grove Street, Oak Street, Hall Drive, Brantwood Road, Jacobs Trail, and Assinippi Avenue. Figure 1 shows the study corridor, adjacent roadways, and major developments in the study area.
At the request of MPO staff, MassDOT collected daily traffic volumes and intersection turning movement counts (including pedestrian and bicycle movements and the percentage of heavy vehicles) for this study. The data collection was delayed due to the COVID-19 pandemic. In September 2020, MassDOT resumed the traffic count programs and collected the data for this study in October.
MPO staff also collected a series of data from the Town of Norwell, including land use and zoning information, traffic studies from recent proposed developments in the corridor, and the police crash reports for a five-year period from 2015 to 2019.
During the study, MPO staff developed a survey to gather feedback from the public on perceived problems with Route 53 in Norwell and to seek improvement ideas.
During the course of the study, MPO staff worked closely with an advisory committee comprised of representatives from the Town of Norwell, MassDOT, and MAPC. (See Appendix A for a complete list of the study advisory members.)
Three advisory committee meetings were held to guide and support the study. In the first meeting (January 30, 2020), MPO staff introduced the study, received input about the corridor’s issues and concerns, and coordinated data collection needs. In the second meeting (January 7, 2021), staff presented the existing condition analyses and discussed ideas for potential improvements with the advisory committee members.
In the final meeting (March 4, 2021), MPO staff reviewed the proposed short- and long-term improvements with the study advisory members. After the meetings, staff received comments and revised the proposed improvements accordingly.
Route 53 is one of the major highways in southeastern Massachusetts, along with Route 3 and Route 3A. The 22-mile state highway extends between Route 3A in Quincy and Route 3A in Kingston, serving many communities in the South Shore area. As it generally runs parallel to Route 3, Route 53 is frequently used as an alternative route when Route 3 traffic is congested.
The selected Route 53 corridor in Norwell is about 2.2 miles from Route 228 (Pond Street/Main Street in Hingham) to Assinippi Avenue at the Hanover town line. The corridor is basically a two-lane roadway, one lane in each direction, which carries about 20,000 to 25,000 vehicles per weekday.4 The entire section is classified as urban minor arterial and under the jurisdiction of MassDOT Highway Division District 5.
The corridor contains three major signalized intersections, one signalized pedestrian crosswalk, a number of unsignalized intersections, and many commercial driveways. The three signalized intersections are Route 53 at Pond Street and Main Street, at High Street and Grove Street, and at Jacobs Trail and Stop & Shop Driveway. The signalized crosswalk is a mid-block location just south of Washington Park Drive, which is equipped with a regular traffic signal on Route 53 and pedestrian signals and push buttons on both sides of the roadway.
The adjacent land uses include commercial, residential, offices, religious, public offices, and open lands. Nearly 90 percent of the adjacent areas in the corridor are under business district zoning. The corridor can be roughly distinguished into three sections in terms of the existing land uses. The north section, Route 53 between Pond Street and Oak Street, is the busiest section with a large number of commercial and business developments, including Queen Anne Plaza that houses Big Y Market and Pharmacy, T.J. Maxx, and HomeGoods.
The middle section, Route 53 between Oak Street and Hull Drive, is the least developed area of the corridor, as a large part of the south side is occupied by a protected town well-field. Meanwhile, Norwell Public Safety Headquarters is located in the section between the town well-field and Hull Drive. This section also contains several small- and medium-scale commercial developments and a condominium, mainly on the north side.
The south section, Route 53 between Hull Drive and Assinippi Avenue, although not as densely developed as the north section, contains a number of small- to large-scale commercial developments, including the Norwell Athletic Club, a large-scale Stop & Shop, and various types of land uses, including a church (Saint Helen Church), a park-like cemetery, and retirement homes. The surrounding areas are wooded and scenic, making this section a potential for village style mixed-use developments and redevelopments.
The corridor does not have sufficient accommodation for people who walk. Sidewalks exist mainly on the north side of Route 53 from Pond Street to CVS and Kappy’s (about 600 feet south of High Street). It is unsafe and inconvenient for residents who like to walk to local stores and shops, especially in the sections with insufficient sidewalks.
There are no dedicated bike lanes in the entire corridor. Meanwhile, shoulders on both sides of the roadway are generally narrow (about two to three feet wide). Four- to five-foot shoulders exist in a limited section mainly on the north side between Oak Street and Hall Drive. These shoulders are not suitable for bike travel due to the high vehicle travel speeds over 40 miles per hour (mph) in the section.
There are no Massachusetts Bay Transportation Authority (MBTA) buses or any regional or local bus services in the corridor. Beyond the corridor, there are only two transit services connecting to Boston. The Plymouth & Brockton commuter bus has a station with park-and-ride parking located on Hingham Street in Rockland, just south of Route 3. The MBTA commuter rail Greenbush Line has a station at East Weymouth, located about 1.5 miles north of Route 53 in Weymouth.
MPO staff developed a survey to help determine the public’s opinion about the problems on Route 53 in Norwell, and to gather ideas for resolving them. With the assistance of Norwell and MAPC, the online survey was posted on the town’s website and published in local media, and received 217 responses between February 25, and April 6, 2020. More than half (53 percent) of the responses came within the first two days of the website posting. This reflects the strong community engagement by the town.
The survey contained the following nine questions:
Appendix B provides these questions and the applicable answers from the survey. Multiple choice answers are allowed in Questions 1 to 6, and only one choice is applicable to Question 7. Figure 2 shows the results from the survey for these seven questions, with the number of responses to the answers in each question. In addition, the percentage of answers and comments provided for the answer of “other (please specify)” to Questions 1 to 7 are summarized in Appendix B.
Question 8 is designed to understand the geographical distribution of the respondents. The answers indicate that about 85 percent of the respondents are Norwell residents. The rest of respondents are from the South Shore area, except for one from Boston, two from Cambridge, and two from Cape Cod.
Question 9 is a free response question for the respondents to describe further viewpoints and to cover the problems and improvement ideas that the survey answers might not have included. Nearly half of the respondents left significant response feedback for the question. The comments received are categorized by locations and by problem types in Appendix C.
The following list includes notable conclusions drawn from the survey.
Feedback from the survey was helpful to gauge community sentiment and to solicit ideas for solutions to the existing problems. Some of the ideas were considered in developing the improvement alternatives discussed in Chapter 5.
Based on findings from the user survey, analyses of crash data and existing traffic operations, and discussions with the study advisory members, major issues and concerns of the corridor include the following:
The above issues and concerns are about the corridor in general. The issues and concerns at specific locations in the corridor are further analyzed and identified in Chapters 3 and 4, and are summarized by location along with the proposed improvements in Chapter 5.
To analyze the existing roadway operations, MPO staff requested MassDOT’s assistance in collecting automatic traffic recorder (ATR) counts on the approaching roadways and intersection turning movement counts (TMCs) for this study. The ATR counts include daily traffic volumes and spot speed counts and the TMCs include pedestrian and bicycle counts at the intersections.
The data collection was delayed by a snowstorm in late November 2019, and periodic snowfall in the following months. In March 2020, just as MassDOT scheduled the collection of the TMCs for this study, the state’s traffic data collection operations were suspended because of the COVID-19 pandemic.5 In September, MassDOT resumed traffic count programs and collected the count data for this study from October 6, to October 11, on both weekend and weekdays.
Staff reviewed historical counts and MassDOT COVID-19 traffic monitoring reports and made a series of adjustments to the collected data so that the data would reflect the normal traffic conditions, not the pandemic conditions.
Daily traffic volumes are the fundamental data for analyzing traffic intensity and patterns in a roadway corridor. Staff used the ATR counts collected from October 7 (Wednesday) to October 9 (Friday) as the basis to estimate the annual average weekday traffic volumes at key locations in the corridor (see Appendix D for the originally recorded counts by hour). Based on the analysis of MassDOT COVID-19 traffic monitoring reports for District 5, staff increased the original counts by eight percent to represent the normal traffic conditions.6
Figure 3 shows the estimated 2020 daily traffic volumes. The numbers in the graphic are average weekday directional volumes representing the normal traffic conditions in 2020 that were adjusted from the recorded counts. The two tables in the graphic further summarize the data by count location, originally recorded volume, adjusted volume, combined volume of both directions, directional split, and the estimated annual average weekday daily traffic, adjusted by seasonal factors.
In general, the corridor carries an average daily traffic volume of about 16,000 to 24,000 vehicles per weekday in early October. The north section, Route 53 between Pond Street and High Street, carries the highest volume of about 24,000 vehicles per weekday. The south section, Route 53 between Jacobs Trail and Assinippi Avenue, carries about 18,000 vehicles per day. The other sections in the corridor generally carry about 16,000 to 18,000 vehicles per weekday.
Traffic volumes in early October were higher than most other months in the year. Adjusted for seasonal factors, the corridor is estimated to carry an average of 15,000 to 23,000 vehicles per weekday.
In addition to daily traffic counts, MassDOT collected turning movement counts at major intersections in the study corridor, including vehicle movements (by vehicle classifications), bicycle movements, and pedestrian crossings. These counts were collected during the morning peak period (6:00 AM–10:00 AM) and the evening peak period (2:00 PM–6:00 PM) on Thursday, October 8, and during the midday peak period (10:00 AM–2:00 PM) on Saturday, October 10, 2020. Appendix E contains these counts summarized by 15-minute intervals.
Staff found that these counts are much lower than the counts collected in recent years (before the pandemic) by analyzing historical counts at major intersections in the corridor.7 The analysis observed the following traffic volume and pattern changes during the pandemic due to many people working or attending school from home with more flexible schedules:
Based on this analysis, staff increased the recorded turning movements at the count locations by 25 to 30 percent in AM peak hour and by five to eight percent in the PM peak hour to represent normal traffic conditions, except the intersection of Route 53 at Pond Street. Staff used the peak hour turning movement counts at the intersection directly from a recent traffic study for the areas near Queen Anne’s Corner (collected on Thursday September 26, 2019; see Appendix F for the counts summarized by 15-minute intervals).8 Using the 2019 counts at this key intersection as the basis, staff made additional minor adjustments to the counts at other intersections through a count-balancing process.
Figure 4 shows the final adjusted weekday AM and PM peak hour turning movement counts at major intersections in the corridor. The counts indicate that during the busy traffic months, such as September or October, the intersection of Route 53 at Pond Street could carry nearly 3,000 vehicles in the morning peak hour and nearly 3,800 vehicles in the evening peak hour. The intersection of Route 53 at High Street and Grove Street could carry nearly 2,600 vehicles in the morning peak hour and nearly 2,900 vehicles in the evening peak hour. The other intersections in the corridor generally carry a much lower traffic volume ranging from 1,400 vehicles to slightly more than 2,000 vehicles per peak hour.
The counts also indicate that the intersection of Route 53 at Route 228 (Pond Street/High Street) carries a high proportion of left turns on the Route 53 northbound and on both approaches of Route 228, and a high proportion of right turns on the Route 53 northbound and on the Route 228 eastbound. The intersection of Route 53 at High Street and Grove Street carries a high proportion of left turns on the Route 53 southbound and High Street eastbound, a high proportion of right turns on the Route 53 southbound, and a very high proportion of right turns on Grove Street.
Both the 2019 counts at the intersection of Route 53 and Pond Street and the counts collected in 2020 at other intersections in the corridor include Saturday midday peak-period and peak-hour counts. Analysis of the Saturday peak-hour counts indicates that the traffic movement patterns in the Saturday peak hour are similar to that in the PM peak hour at major intersections in the corridor, and the Saturday peak-hour traffic volumes generally are about five to 10 percent lower than those in the PM peak hour.
In addition to traffic volumes, the intersection turning movement counts—conducted in the extended four-hour peak periods in the weekday morning and evening and on Saturday midday—also provided pedestrian crossing counts and bicycle counts by turning movements on each approach for this study.
Figure 4 also shows the pedestrian crossing counts in the AM and PM peak hours at major intersections in the corridor. The intersection of Route 53 at Pond Street and High Street had about two to five pedestrian crossings per peak hour. The intersection of Route 53 at High Street and Grove Street had about five pedestrian crossings in the AM or PM peak hour. At the intersection of Route 53 and Queen Anne Plaza Driveway, there were about one or two pedestrian crossings on Route 53 during the peak traffic hour. Other intersections in the corridor had about one to three pedestrian crossings per peak hour and with almost no crossings on Route 53, except the intersection of Route 53 at Washington Park Drive and Brantwood Road where the signalized crosswalk is located; it had about two to four pedestrian crossings on Route 53 per peak traffic hour.
Review of the bicycle counts at the major intersections indicate that about one to two cyclists traveled along the corridor in the weekday AM or PM peak hour. On the fair weather Saturday (October 10, 2020), there were about two to four cyclists traveling in the corridor from 10:00 AM to 11:00 AM.
There are no sidewalks on the south side on most sections of the corridor, no bicycle accommodations in the entire corridor, and limited crosswalks across Route 53 at four signalized locations. These may have impeded walking and biking activities in the corridor.
It is essential to examine the amount of truck and bus traffic in a study corridor, as an unusually high percentage of these heavy vehicles may seriously impact roadway operations.9
Staff reviewed vehicle classifications in the turning movement counts and identified the percentages of heavy vehicles within the total traffic at major locations in the corridor. On average, heavy vehicles accounted for approximately three to four percent of the Route 53 traffic in the AM peak hour, and approximately one to two percent in the PM and Saturday peak hours. These percentages are regarded as normal for an urban minor arterial.
Adjacent to the corridor, Pond Street was identified as carrying nearly 10 percent of heavy vehicle traffic from Route 3 and Hingham Street (Rockland) toward Route 53 in the AM peak hour. However, heavy vehicle traffic diminished significantly in other times of the day after the AM peak hour.
The percentage of heavy vehicle traffic by direction of approach to the major intersections was calculated in the intersection capacity analyses and the traffic simulation models used for this study. The capacity analyses detailed in the following sections indicate that the existing volumes of heavy vehicles do not seriously affect traffic operations at the intersections studied.
Based on the estimated turning movement counts, MPO staff constructed peak hour traffic models for the entire corridor and conducted capacity analyses for major intersections using Synchro, a traffic analysis and simulation program.10 The model set consisted of weekday AM and PM peak hour models and scenarios, including signal retiming under the assumed existing conditions and proposed improvement alternatives under the projected future traffic conditions in 2030.
Figure 5 shows the results of weekday AM and PM peak-hour capacity analyses for the assumed normal traffic conditions in 2020 at major intersections in the corridor and the level of service (LOS) each intersection provides.
The LOS was determined based on criteria from the Highway Capacity Manual (HCM).11 The HCM defines LOS, using a qualitative scale from A to F, for signalized and unsignalized intersections as a function of the average vehicle control delay.12 For the intersections in a metropolitan urban area, LOS A, B, and C are considered desirable; LOS D and E are considered acceptable; and LOS F is considered undesirable.
The intersection of Route 53 at Pond Street is estimated to operate at an overall acceptable LOS (LOS D in the AM peak hour and LOS E in the PM peak hour). However, some individual approaches are estimated to operate at an undesirable LOS F, such as the Route 53 northbound left-turn approach with an average delay of nearly two minutes in the AM peak hour and nearly three minutes in the PM peak hour; the Main Street left-turn approach with an average delay of about one and a half minutes in the AM peak hour; and the Pond Street through movement with an average delay of one and a half minutes in the AM peak hour and nearly two minutes in the PM peak hour.
The intersection of Route 53 at High Street and Grove Street is estimated to operate at overall acceptable LOS (LOS C in the AM peak hour and LOS E in the PM peak hour). However, the Route 53 southbound left-turn approach is estimated to operate at an undesirable LOS F with an average delay of more than three minutes in the PM peak hour. Field observations before the pandemic indicated that the left-turn queue in the evening peak hour frequently extended beyond its storage length (about 300 feet) and impeded other vehicles’ access to the adjacent businesses.
The third signalized intersection, Route 53 at Jacobs Trail and Stop & Shop Driveway, is evaluated to operate at an overall desirable LOS B in both AM and PM peak hours with no substantial delays at any of the approaches. Field observations before the pandemic indicated that the Route 53 northbound is somewhat congested, but traffic queues mostly cleared in each of the cycles.
At the unsignalized intersections, drivers on the stop-controlled approaches generally experience noticeable delays during the peak hours due to the busy traffic on Route 53. In the AM peak hour, most of the approaches are evaluated to operate at acceptable LOS. In the PM peak hour, left turns from Queen Anne Plaza Driveway and Oak Street are estimated to operate at unacceptable LOS F, with an average delay of nearly one minute. The left turn from Assinippi Avenue is also estimated to operate at unacceptable LOS F, with an average of more than two minutes. However, the left-turn approach of Assinippi Avenue usually has less than 10 vehicles in the AM or PM peak hour.
Staff also explored opportunities of retiming signals or rearranging phasing at the three signalized intersections and found that all signals have the potential to improve from the existing settings, especially the intersection of Route 53 at High Street and Grove Street. These options are discussed in Chapter 5. Details of Synchro capacity analysis reports for the major intersections in the weekday AM and PM peak hour under the assumed 2020 traffic conditions are included in Appendices G and H.
One of the major concerns raised by the town residents is the generally high travel speeds in the corridor. In order to examine the prevailing travel speeds versus regulated speeds, MPO staff requested that MassDOT help collect spot-speed data during the period when automatic traffic counts were being conducted.
Figure 6 shows the existing speed regulations and estimated 85th percentile speed at selected locations in the corridor, based on spot-speed counts collected from automatic traffic recorders. The 85th percentile speed is the speed at or below which 85 percent of vehicles passing a given point are traveling, and it is the principal value used to establish speed controls by MassDOT. It is generally regarded as the prevailing speed at a location where the speed data are collected.
The corridor has three speed limit zones:
The regulated speed limit in each zone applies to both directions of Route 53. The 85th percentile speeds estimated from the data indicate that the high vehicle travel speeds (nearly 45 mph) occur in the sections adjacent to Farrar Farm Road, where the commercial developments are not as dense as other sections, except the southbound traffic past Farrar Farm Road. The southbound drivers there tend to slow down as they enter a lower speed limit zone (35 mph) and approach toward the Norwell Police Department. Once the drivers pass the Norwell Safety Headquarters, they tend to speed up to nearly 45 mph again.
The section between Queen Anne Plaza and Oak Street has a lower estimated 85th percentile speed of about 40 mph. Because of the dense commercial developments in the section, it should be examined for the potential of 35 mph speed regulation.
The proposed long-term improvements described in this report with the reduction of travel lane width and the addition of a central left-turn lane or traffic median would potentially reduce travel speeds in the corridor. At the design stage, a consistent 35 mph speed limit could be planned for the entire corridor. In the near term, if the speed regulation in the aforementioned section is to be changed, an engineering study, based on speed data collected from radar or laser guns, would have to be undertaken.13
The corridor generally has a right-of-way width of 60 feet or more. Based on MassGIS’ standardized assessors’ parcel data, the corridor can be distinguished into four district roadway sections:
Figures 7, 8, 9-1, 9-2, and 10 show the existing roadway cross section and potential reconfiguration alternatives in the four roadway sections based on the approximate right-of-way widths. In each of the roadway sections, the cross section represents a typical layout in or near the tightest right-of-way area. It exhibits the view of a southbound driver in the corridor.
The section of Route 53 between Pond Street and High Street is located in the busiest business district of the corridor. The top graphic in Figure 7 shows that the existing roadway contains a 14-foot wide TWLTL and a wide travel lane of about 15 feet in each direction, which allows vehicles to travel at high speeds. Two potential reconfiguration alternatives are proposed in this roadway section to: 1) reduce the travel lanes to 11-foot and the TWLTL to 12-foot, and to install street-level bike lanes with a three-foot traffic buffer; and 2) reduce the travel lanes and TWLTL the same as Alternative 1, but install sidewalk level bike lanes under a shared use path or separated from sidewalks with a grass buffer, while accommodating the existing utility poles (see the bottom graphic of Figure 7).
The roadway section of Route 53 between High Street and Oak Street is narrow and abutted by continuous commercial developments, except the area adjacent to High Street (containing 7-Eleven, CVS, and Kappy’s). As shown in the top graphic of Figure 8, this section contains two 12-foot travel lanes (one in each direction), narrow shoulders of about two to three feet, and five-foot sidewalks on the north side only.
The potential improvement proposed by Alternative 1 would reduce the travel lanes to 11-feet wide, install five-foot street-level bike lanes with a two-foot traffic buffer on both sides, and install five-foot sidewalks on both sides. This reconfiguration would require about five feet more width than the available right-of-way. Alternative 2 proposes to reduce the travel lanes to 11 feet, install an 11-foot center lane as a left-turn only lane, TWLTL, or traffic median, maintain two-foot shoulders, and install an eight-foot shared use path on the north side and five-foot sidewalks on the south side. It would require about 10 feet more width than the available right-of-way. Alternative 3 has a similar layout as Alternative 2, but proposes to install an eight-foot shared use path or street-level separated bike lanes with grass buffer, and sidewalks on both sides of the roadway. It would require about 15 feet more width than the available right-of-way.
The proposed center lane and the added pedestrian and bicycle accommodations would significantly improve the access to adjacent developments, the traffic flow along the corridor, and the safety for all users of the roadway. At the design stage, the speed regulation in this section should change from 40 mph to 35 mph. However, variations of the alternatives may need to be considered due to the availability of acquiring the additional right-of-ways.
The extensive roadway section of Route 53 between Oak Street and Jacobs Trail has a consistent right-of-way of about 60 feet. The top graphic of Figure 9-1 shows that the right-of-way is not fully utilized. The roadway has a pavement surface of about 30 feet wide that contains two 12-foot travel lanes, two- to three-foot shoulders on both sides, and five- to six-foot sidewalks on the north side only. The available right-of-way provides opportunities for adding sidewalks on the south side and accommodations on both sides for people who bike.
Alternative 1 is the minimal build option that would maintain the existing two travel lanes, add street-level bike lanes with three-foot street buffers on both sides, and add sidewalks on the south side of the roadway (see the bottom graphic in Figure 9-1). Alternative 2 proposes to reduce the two travel lanes to 11 feet, install a 12-foot center lane as left-turn only lane or traffic median, and install five-foot street-level bike lanes with a two-foot traffic buffer on both sides (see the top graphic in Figure 9-2). Alternative 3 proposes a similar layout as Alternative 2 to improve access to the adjacent developments, and would install a shared use path with a three-foot traffic buffer on both sides for people who walk and bike (see the bottom graphic of Figure 9-2). All three alternatives may be constructed within a right-of-way of about 60 feet wide.
Although not as densely developed as the first roadway section, this roadway section contains many businesses and developments of different land uses. Adding a center lane to function as a left-turn only lane or traffic median would significantly improve the safety, mobility, and access for all users in the corridor. In addition, it would provide more room for general vehicles to move aside for the emergency vehicles in the section where the Norwell Public Safety Headquarters is located.
As shown in Figure 10, the roadway section of Route 53 between Jacobs Trail and Assinippi Avenue has a right-of-way of about 70 feet. It contains three 12-foot travel lanes, one in the northbound and two in the southbound, two- to three-foot shoulders on both sides, and sidewalks on the north side only. The roadway in this section carries northbound and southbound traffic equally. However, the current distribution of one travel lane in the northbound and two in the southbound appears to be appropriate.14
Alternative 1 proposes to maintain the existing travel lanes with a slight reduction of the two southbound lanes to 11 feet each, install six-foot street-level bike lanes with a three-foot traffic buffer on both sides, and install six-foot sidewalks on both sides. It would require a right-of-way of about 65 feet. Alternative 2 proposes a similar layout for vehicle travel, but instead would install a 10-foot shared use path on the south side and sidewalk-level bike lanes separated by a grass buffer with sidewalks on the north side for people who walk and bike. It would require a right-of-way of about 70 feet.
This roadway section has a profile different from the other sections in the corridor, with northbound running uphill and southbound running downhill. Alternative 2 is much more preferable to Alternative 1, as it provides more separation from traffic and more protection for people who bike.
Crash data are an essential resource for identifying safety and operational problems in a study area. Analyzing data on the number of crashes and types of collisions that occur at particular locations, and the circumstances under which crashes occur (such as the time of day and roadway surface conditions) also helps to develop improvement strategies.
For this study, MPO staff collected the most recent five-year (2015–19) crash reports from the Norwell Police Department for the entire corridor and conducted a series of crash data analyses. In total, 287 crashes were recorded in the five-year period at different locations in the corridor.
Major statistics analyzed from the data set including the following:
Based on the five-year crash data and the estimated average daily traffic, MPO staff estimated that the entire corridor has a crash rate of 4.11 crashes per million vehicle-miles traveled (MVMT). This crash rate is higher than the statewide average for principal urban arterials, which is 3.49 crashes per MVMT (updated July 2020, based on 2017 crash data).
Staff further calculated the crash rates by five consecutive segments in the corridor based on the comparable roadway layout, land use characteristics, and daily traffic volume. The crash rates for the five segments include
Appendix I contains worksheets showing the crash rate calculations for the entire corridor and the five different segments in the corridor.
Staff also calculated the crash rates at major intersections in the corridor, based on the Norwell Police Department crash data and the estimated intersection traffic counts. The crash rates for the signalized intersections are as follows:
The average crash rate for MassDOT District 5 signalized intersections is 0.75 crashes per MEV (updated June 2018, based on 2016 crash data). Both intersections in the busiest commercial district of the corridor have a crash rate higher than the district average.
Among the unsignalized intersections, Route 53 at Assinippi Avenue is estimated to have the highest crash rate of 0.47 crashes per MEV. This rate is lower than the average crash rate for unsignalized intersections in MassDOT District 5, which is 0.57 crashes per MEV.
Appendix J contains worksheets showing the crash rate calculations for the major intersections in the corridor.
To investigate safety and operational problems further, MPO staff constructed collision diagrams for the entire corridor at major intersections and in the roadway segments between those intersections, based on the recent five-year Norwell Police Department crash reports. The crash reports, containing descriptions of how and where those crashes occurred, were useful in constructing the collision diagrams.
Appendix K presents nine collision diagrams for nine consecutive sections in the corridor. It also includes information on the crashes in each section (indexed by chronological order of occurrence) summarized in a lookup table following each collision diagram. The information includes crash date and time, severity (property damage only [PDO], non-fatal injury, fatality, or unknown), manner of collision type (rear-end, angle, single vehicle, rear-to-rear, sideswipe [same or opposite direction], head-on, or unknown), road surface conditions, weather conditions, most harmful event, vehicle actions prior to crash, and driver contributing code.
Key findings from collision diagram analysis and factors that might have affected safety and operations in each of the corridor sections are summarized below.
These findings from collision diagrams are useful for identifying safety and operational problems and developing improvement alternatives at major intersections and specific roadway segments in the corridor. The findings are further discussed in the context of proposed improvements in Chapter 5.
Based on the analyses in the previous chapters, MPO staff developed a series of short- and long-term improvements to address safety and operational problems in the corridor. The proposed short-term improvements could be implemented within three years at a relatively low cost. The long-term improvements are more complicated and cover larger areas, thus requiring intensive planning and design, and significant funding.
This chapter contains seven sections. The first section outlines the corridor improvement objectives and design strategies based on the identified issues and concerns for the corridor. The next five sections review the existing roadway conditions, discuss issues and concerns, and propose short- and long-term improvements for five consecutive but distinct roadway sections in the corridor. The last section in this chapter provides an overview of the proposed long-term improvements under the projected 2030 traffic conditions.
Based on the identified key issues and concerns and discussions with the advisory members, MPO staff developed the following objectives to improve the safety, mobility, and access for all users of the corridor:
To achieve the objectives, staff applied the following design strategies to the proposed improvement alternatives:
This section discusses the Route 53 corridor from Pond Street to High Street. It is the busiest section of the corridor and contains two major intersections that are usually congested during the peak hours. In between the two intersections, the roadway contains three lanes, two wide travel lanes of about 15 feet in each direction, and a continuous TWLTL of about the same width, which allows vehicles to travel at high speeds.
In summary, there are major issues and concerns regarding this section of roadway:
The TWLTL application aims to reduce crashes and to provide convenient access to adjacent developments; however, many drivers do not know how to use it appropriately. There are general rules for using a TWLTL:
For three-lane urban arterials, the TWLTL is not as safe as the center lane with one-way left-turn pockets and traffic medians, particularly for roadways that carry 20,000 or more vehicles per day. However, in order to provide access to continuous developments existing on both sides of an arterial, such as this roadway section, the TWLTL may be an inevitable choice.
In the short term, this roadway section can be considered for restriping to improve the TWLTL operation. Figure 11 shows the conceptual plan for restriping this roadway section. Major elements of the improvement include
Synchro tests indicate that traffic operations at the two major intersections can be improved by retiming traffic signals under the existing layout. Appendix L contains the Synchro AM and PM peak-hour analysis reports for the signal retiming scenarios at the three signalized intersections in the corridor (including the intersection of Route 53 at Jacobs Trail). The expected improvements for the two intersections in this section are summarized below:
In the long term, this study proposes the following improvements for the section of Route 53 between Pond Street and High Street in general and at three specific locations. Figures 12 and 13 show the proposed improvements for this section in two conceptual plans. Appendix M contains the intersection capacity analyses for the major intersections in the corridor with the proposed improvements under the projected 2030 AM and PM peak-hour traffic conditions.
This section discusses the Route 53 corridor between High Street and Oak Street, including the intersections of Route 53 at Oak Street and the business district just south of Oak Street. Except the area adjacent to High Street, the roadway is narrow and abutted by continuous commercial developments. It contains two travel lanes, narrow shoulders, and sidewalks on the north side only.
These are the major issues and concerns in this roadway section:
Proposed short-term improvements in this roadway section to consider include
In the long term, this study proposes the following improvements for the section in general and at the intersection of Route 53 at Oak Street. Figure 14 shows the conceptual plan of the proposed improvements.
This section discusses the Route 53 corridor between Oak Street and Hall Drive, including the intersection of Route 53 at Hall Drive. The adjacent areas in this roadway section are less developed, as a large portion of the south side is the protected town well-field surrounded by woods. Norwell Public Safety Headquarters, including Norwell Police and Fire Departments, is located just south of the town well-field. The section has two 12-foot travel lanes, shoulders of about two to four feet wide, and five-foot sidewalks on the north side only.
These are the major issues and concerns in this roadway section:
Figure 15 shows the conceptual plan of proposed short- and long-term improvements in this section. In the short term, this study proposes to install a traffic control system on Route 53 for the emergency vehicle operations.26 Major elements of the traffic control system could include
In the long term, this study proposes the following improvements for the section in general and at the intersection of Route 53 and Hall Drive:
This section discusses the Route 53 corridor between Hall Drive and Jacobs Trail. The adjacent land uses include commercial developments and other types of land uses, including a church, a park-like cemetery, and senior and retirement homes. The surrounding areas are wooded and have potential for village style mixed-use developments or redevelopments.
The roadway contains two 12-foot travel lanes, shoulders of about two to three feet wide, and five-foot to six-foot sidewalks on the north side only. A signalized crosswalk exists on the south side of Washington Park Drive. The location is controlled by a regular traffic signal with pedestrian signals and push buttons. It provides 21 seconds for people to walk across Route 53. Field observations did not identify major problems at this crosswalk. However, some improvements can be made to increase drivers’ awareness of the crosswalks.
These are the major issues and concerns in this roadway section:
Proposed short-term improvements in this section include
In the long term, this study proposes the following improvements for the section in general and at the signalized crosswalk. Figure 16 shows the conceptual plan of the proposed improvements:
This section discusses the Route 53 corridor between Jacobs Trail and Assinippi Avenue, including both the intersections of Route 53 at Jacobs Trail and at Assinippi Avenue. The corridor contains a large-scale Stop & Shop on the south side and local stores and shops, a few residences, and vacant lands on the north side.
The roadway contains three 12-foot travel lanes (two in the southbound and one in the northbound), shoulders of about two to three feet wide, and five-foot sidewalks on the north side only. The intersection of Route 53 at Jacobs Trail and Stop & Shop Driveway is signalized. The intersection of Route 53 at Assinippi Avenue is unsignalized with stop-control on Assinippi Avenue.
These are the major issues and concerns in this roadway section:
Proposed short-term improvements in this section to be considered include
In the long term, this study proposes the following improvements for the section in general and at the intersections of Route 53 at Jacobs Trail and at Assinippi Avenue. Figure 17 shows the conceptual plan of the proposed improvements.
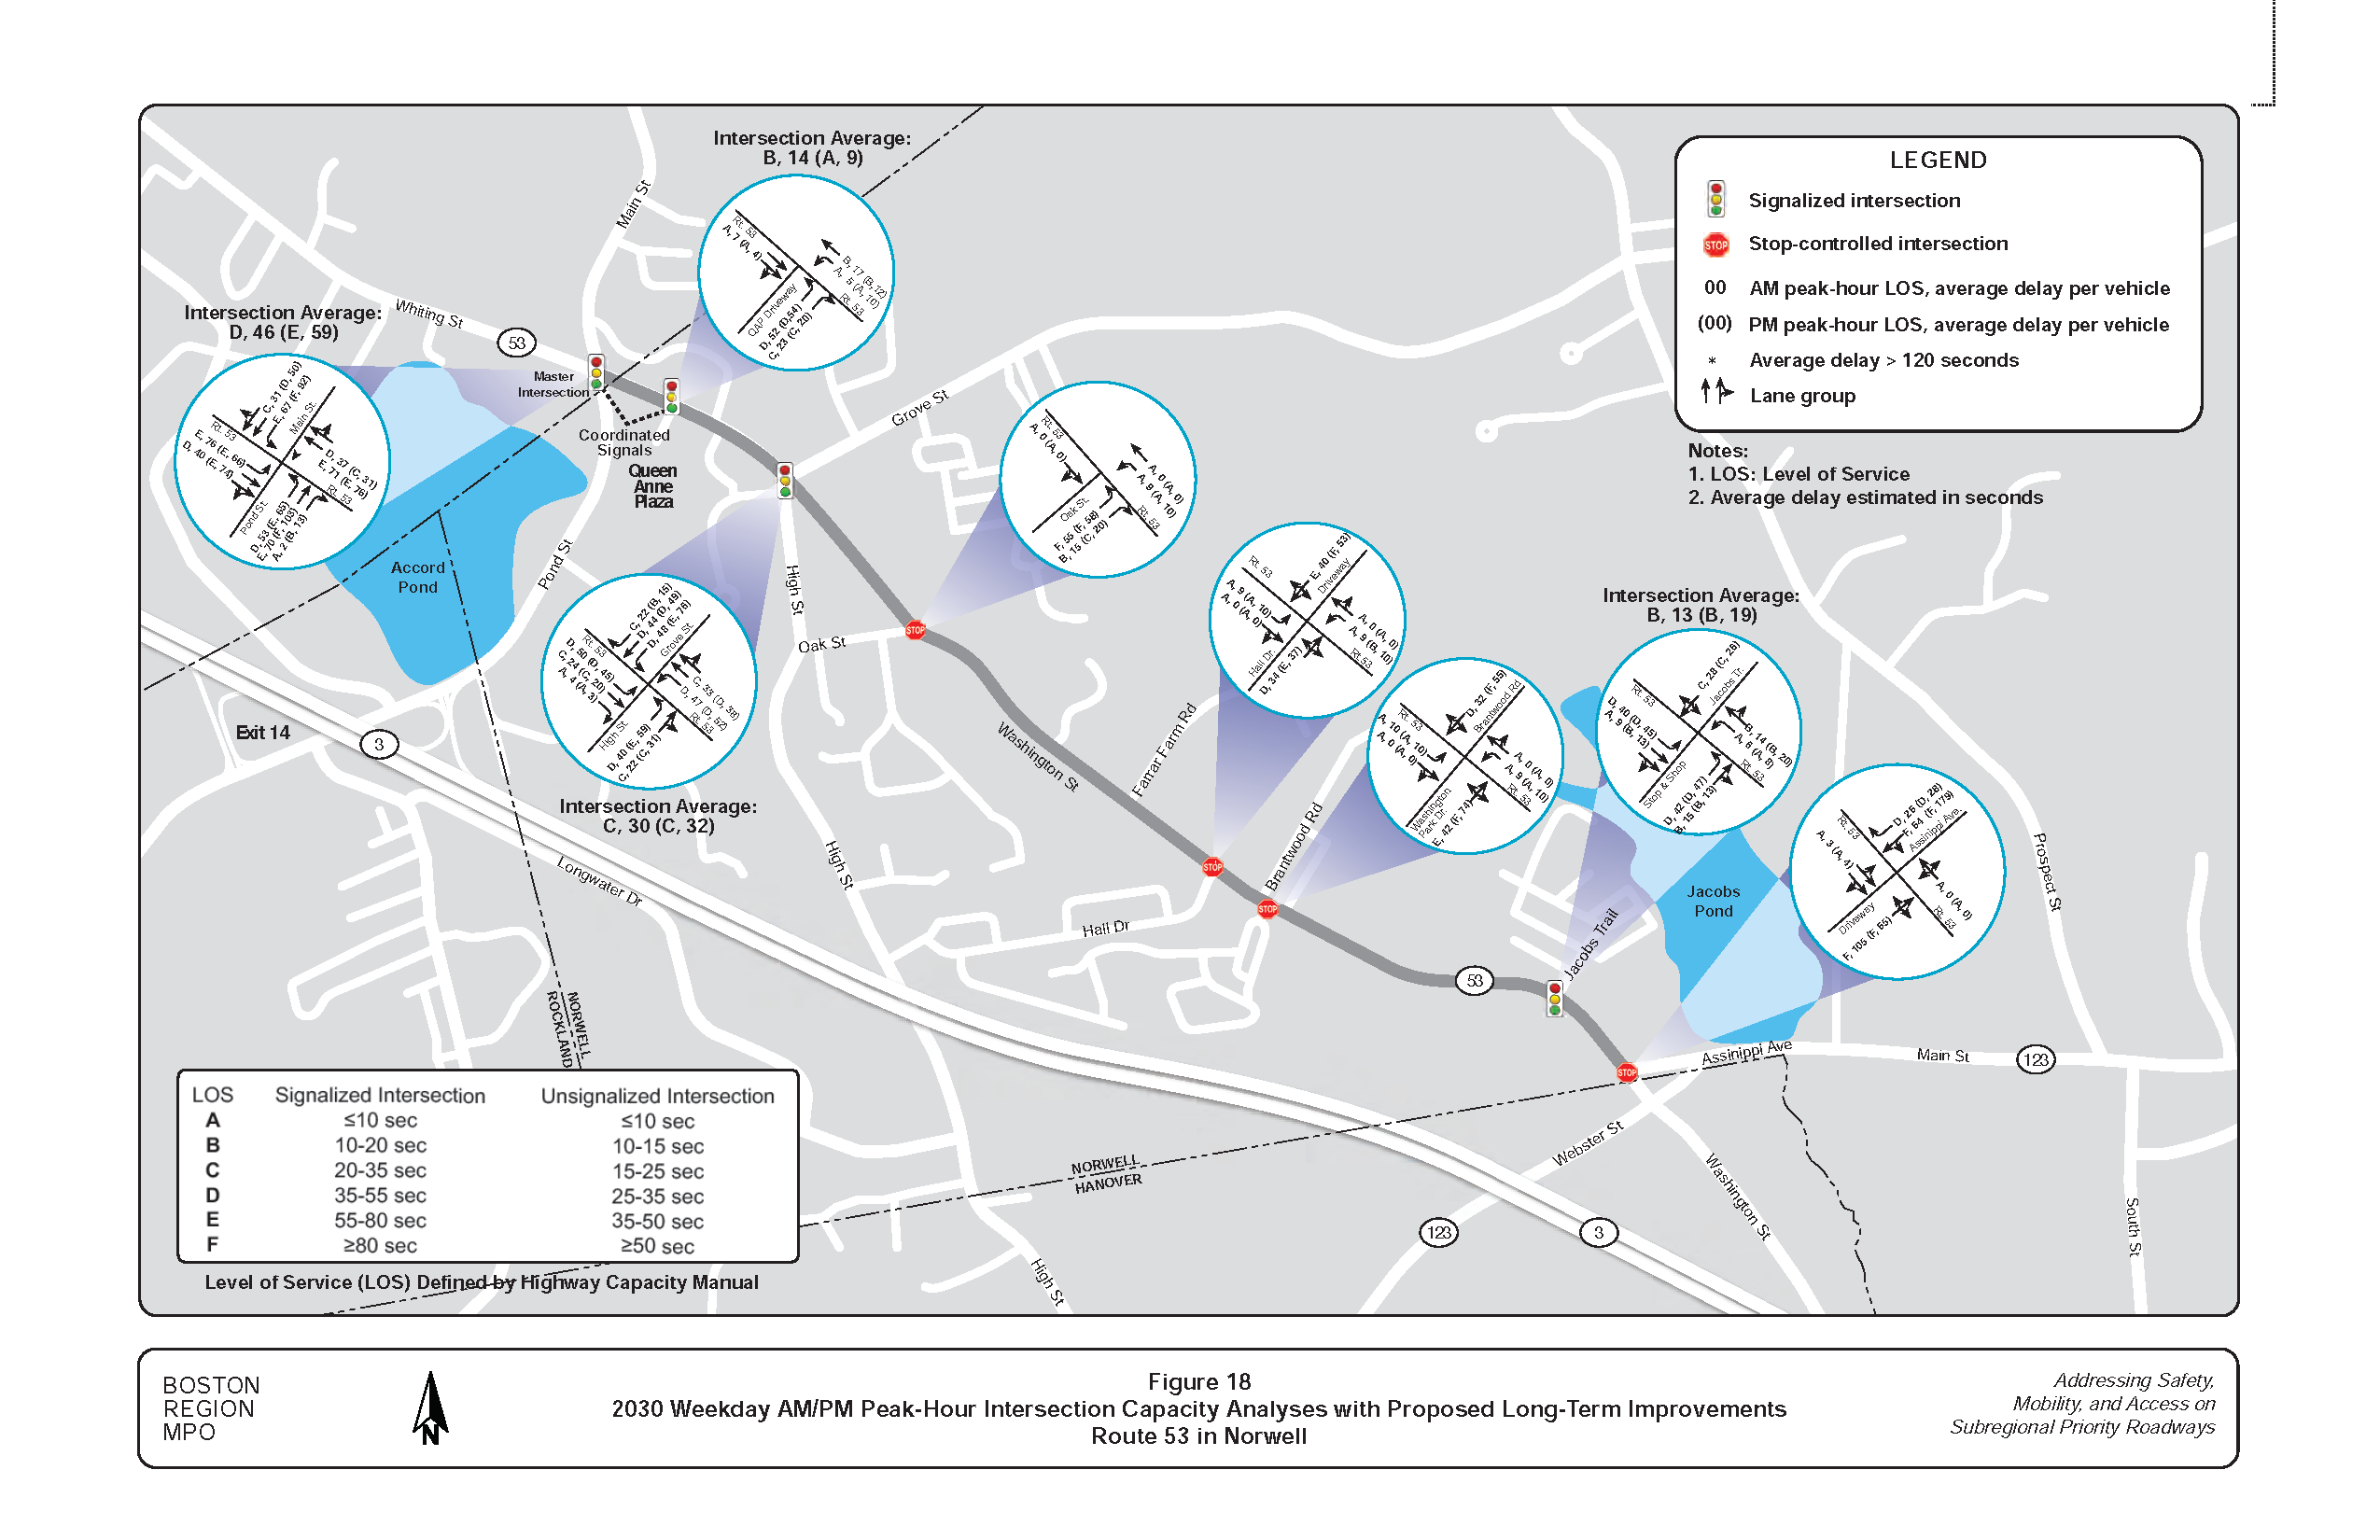
To further examine the effect of the proposed long-term improvements at the various locations described above, staff constructed traffic models for projecting traffic conditions in the Route 53 corridor to the horizon year 2030. Staff projected the 2030 traffic volumes by using growth factors estimated from the recent traffic impact study for the Queen Anne’s Corner and the Boston Region MPO’s regional transportation planning model. The models project that traffic in the study area would increase by three percent (about 0.3 percent annually) in the AM peak period and four percent (about 0.4 percent annually) in the PM peak period from 2020 to 2030.
Figure 18 summarizes the weekday AM and PM peak hour intersection capacity analyses for major intersections in the corridor under the projected 2030 traffic conditions. With the proposed long-term improvements, all the intersections would operate at an acceptable level of service (LOS E or better) during the weekday AM and PM peak hours.
Synchro 2030 peak-hour capacity analysis reports of the study intersections are included in Appendix M. These reports present the results of the analysis of the future-year weekday AM and PM peak hour traffic conditions, under the assumption that the proposed improvements are implemented.
This report provides a vision for the long-term development of the Route 53 corridor in Norwell and presents a series of improvements that would support the corridor to operate safely and efficiently for all people who walk, bike, and drive, or ride with others in the corridor. The recommendations included are based on a series of safety and operations analyses that were performed to identify safety and operational problems in the corridor and to develop short- and long-term improvement alternatives.
The recommended short-term improvements could enhance safety for all users and improve traffic operations in the study area. With a high benefit-to-cost ratio, these short-term improvements should be considered and implemented as soon as resources are available from highway maintenance or Chapter 90 funding. Among them, three projects are identified for implementation:
To significantly improve the safety, mobility, and access for all users in the corridor would require a series of long-term improvements. The benefits expected to result from implementing the proposed long-term improvements from this study include
Implementing the recommended long-term improvements in this 2.2-mile corridor would require sufficient resources. Four implementation stages can be considered for the entire corridor, as follows:
Depending on the available and potential resources, the Town of Norwell could consult with MassDOT District 5 and reprioritize the implementation stages by rearranging, combining, or dividing the four proposed segments.
Meanwhile, achieving the proposed Complete Streets vision for Route 53 via the recommended improvements would require significant effort and collaboration on the part of all stakeholders, including the Town of Norwell, residents, business owners, and MassDOT. All parties must concur on how the recommendations should be realized in a resourceful and fiscally responsible manner.
The next steps toward implementation are for the town to identify priority sections of Route 53 and work with MassDOT District 5 to initiate a project. For municipalities to initiate roadway projects, MassDOT recently developed an online tool for submission. The Massachusetts Project Intake Tool (MaPIT) is a web-based application designed to help proponents map, create, and initiate projects with available in-house geographic information system (GIS) resources. The tool can be accessed from the GeoPass webpage of Massachusetts GIS for Transportation (GeoDOT) website, https://massdothpi.esriemcs.com/mapit.
To move a project from the initiation to the development stage, the Town of Norwell must obtain favorable assessment from MassDOT’s Project Review Committee, start the project design process, and identify potential funding sources by coordinating with MassDOT and the Boston Region MPO.
MPO staff will continue to support this work by providing assistance with further project planning and the funding process. In addition, staff will continue to monitor the progress toward implementing this study’s recommendations via the MPO’s UPWP Study Recommendations Tracking Database.
Appendix N contains details about the various steps in MassDOT’s project development process, including a schematic timetable. Information about the project development process may be found on MassDOT’s website, at https://www.mass.gov/service-details/project-development-process.
Figure 1
Study Area Map
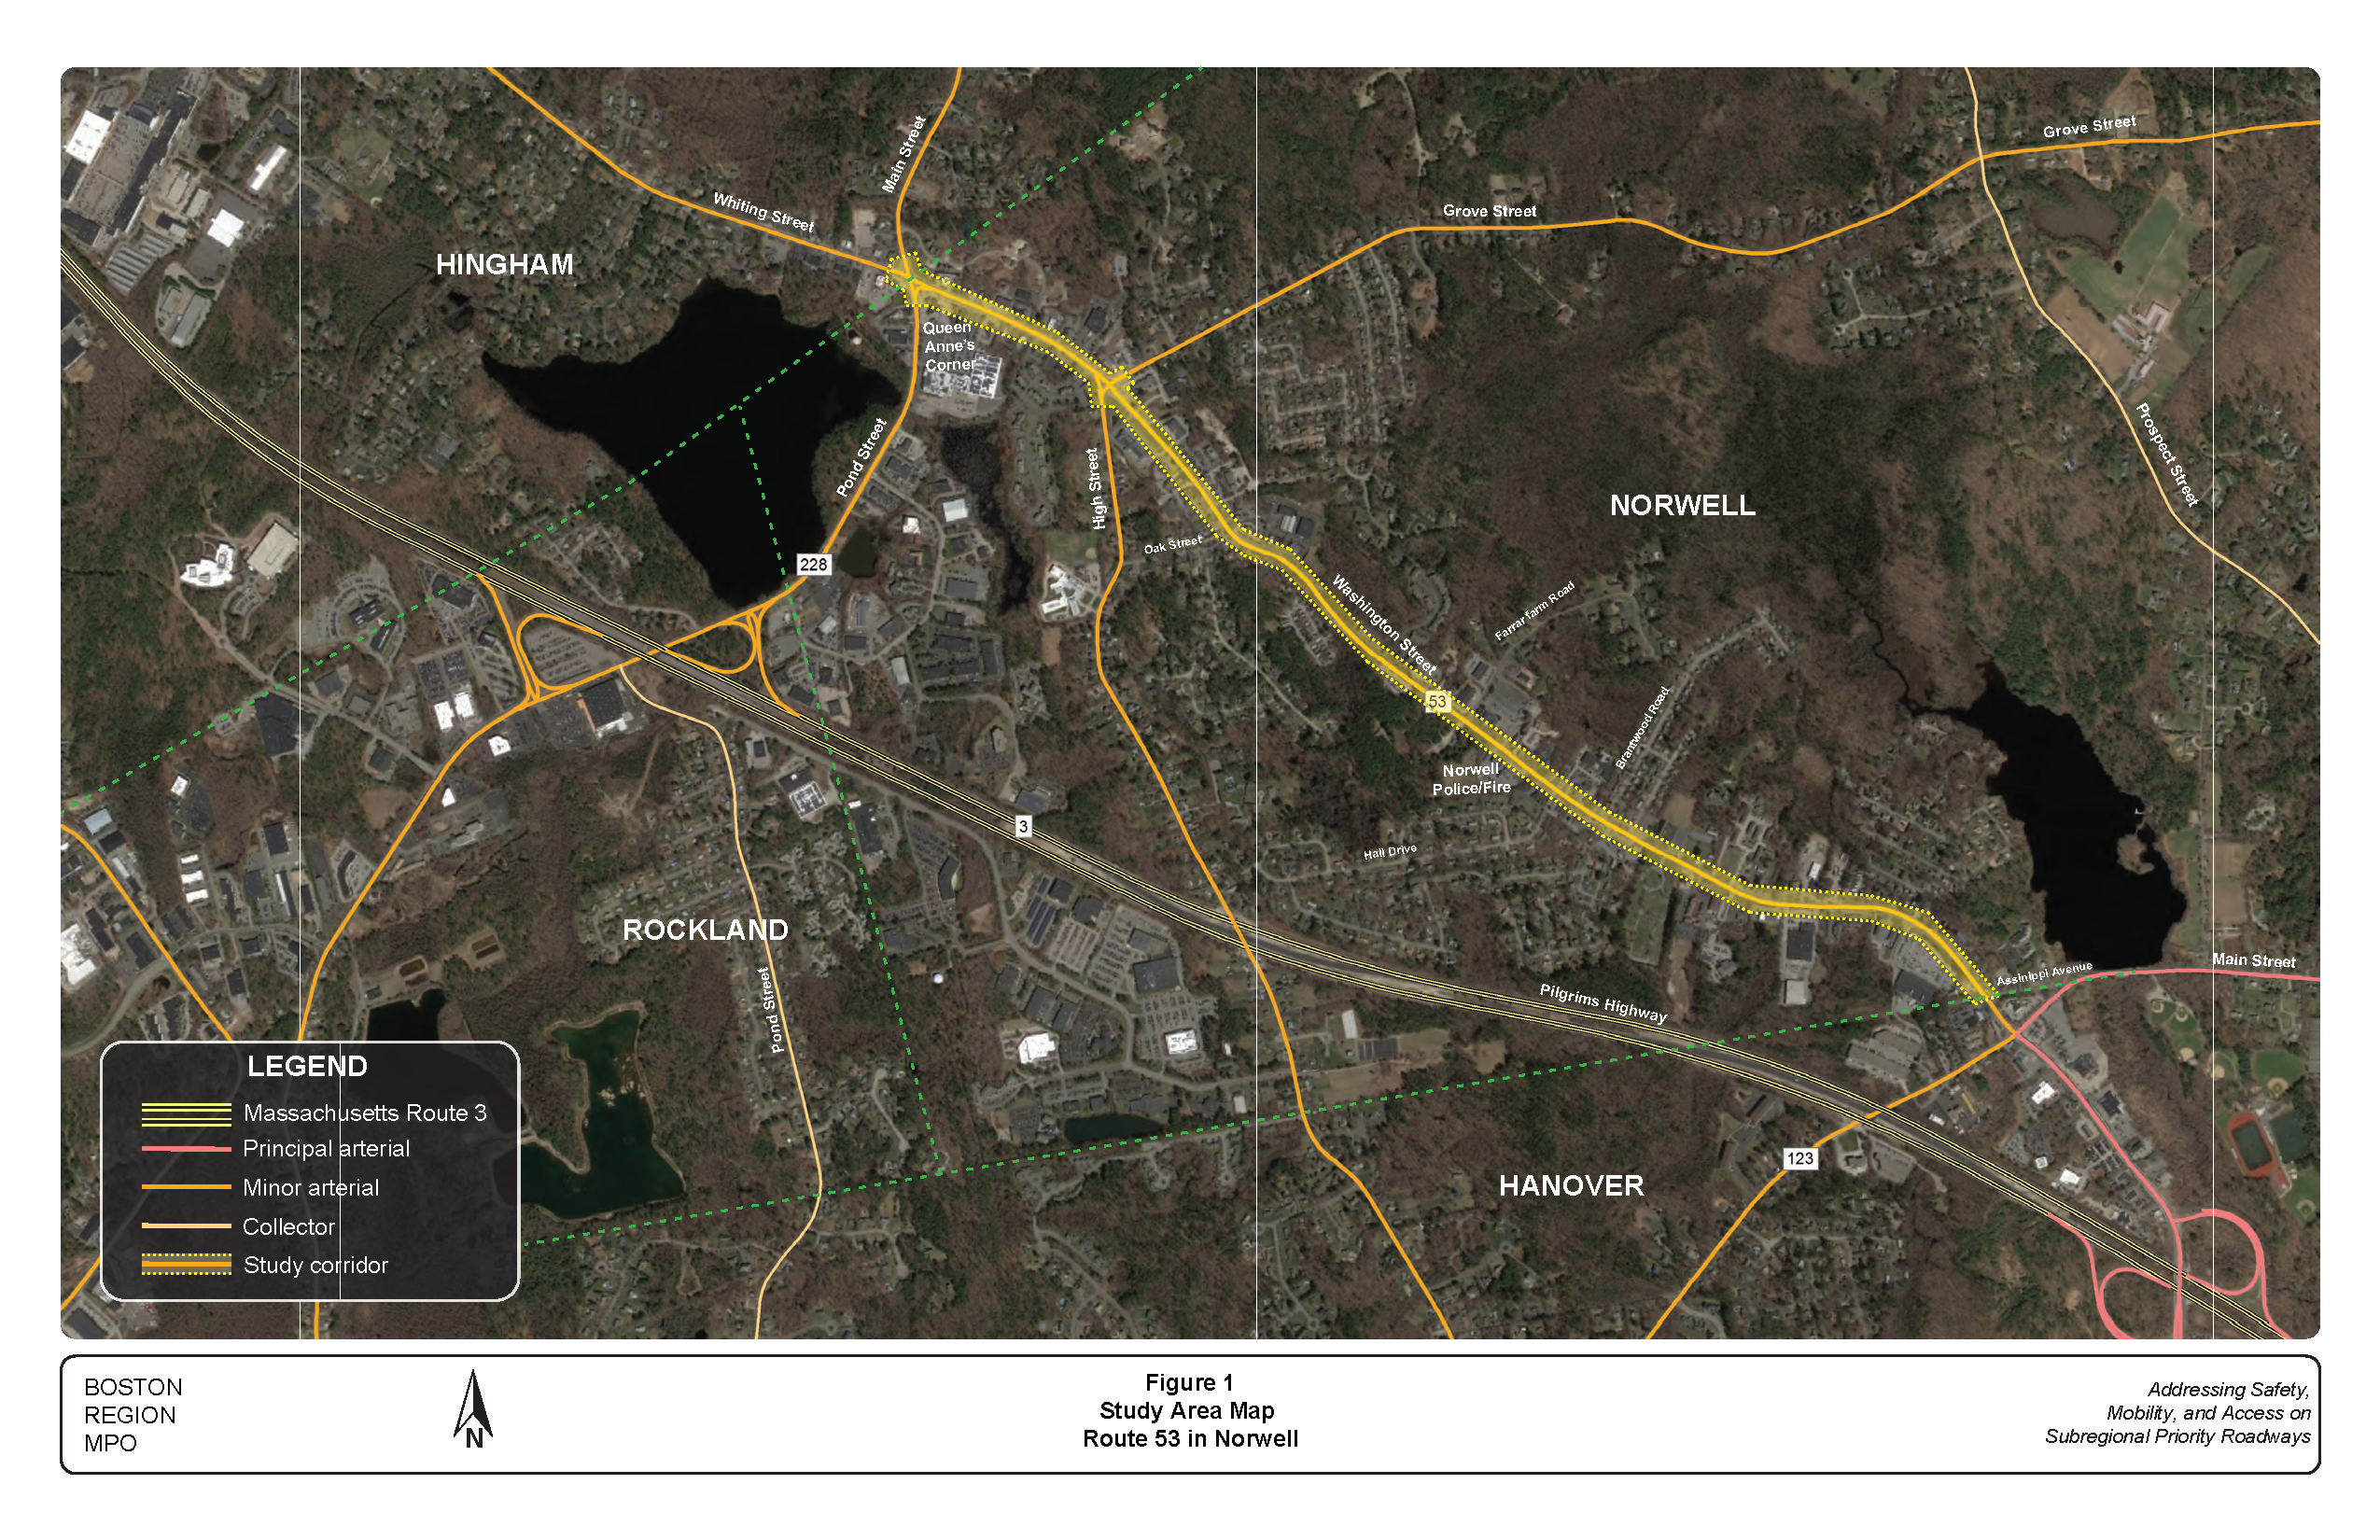
Figure 2
Survey Questions and Responding Scores
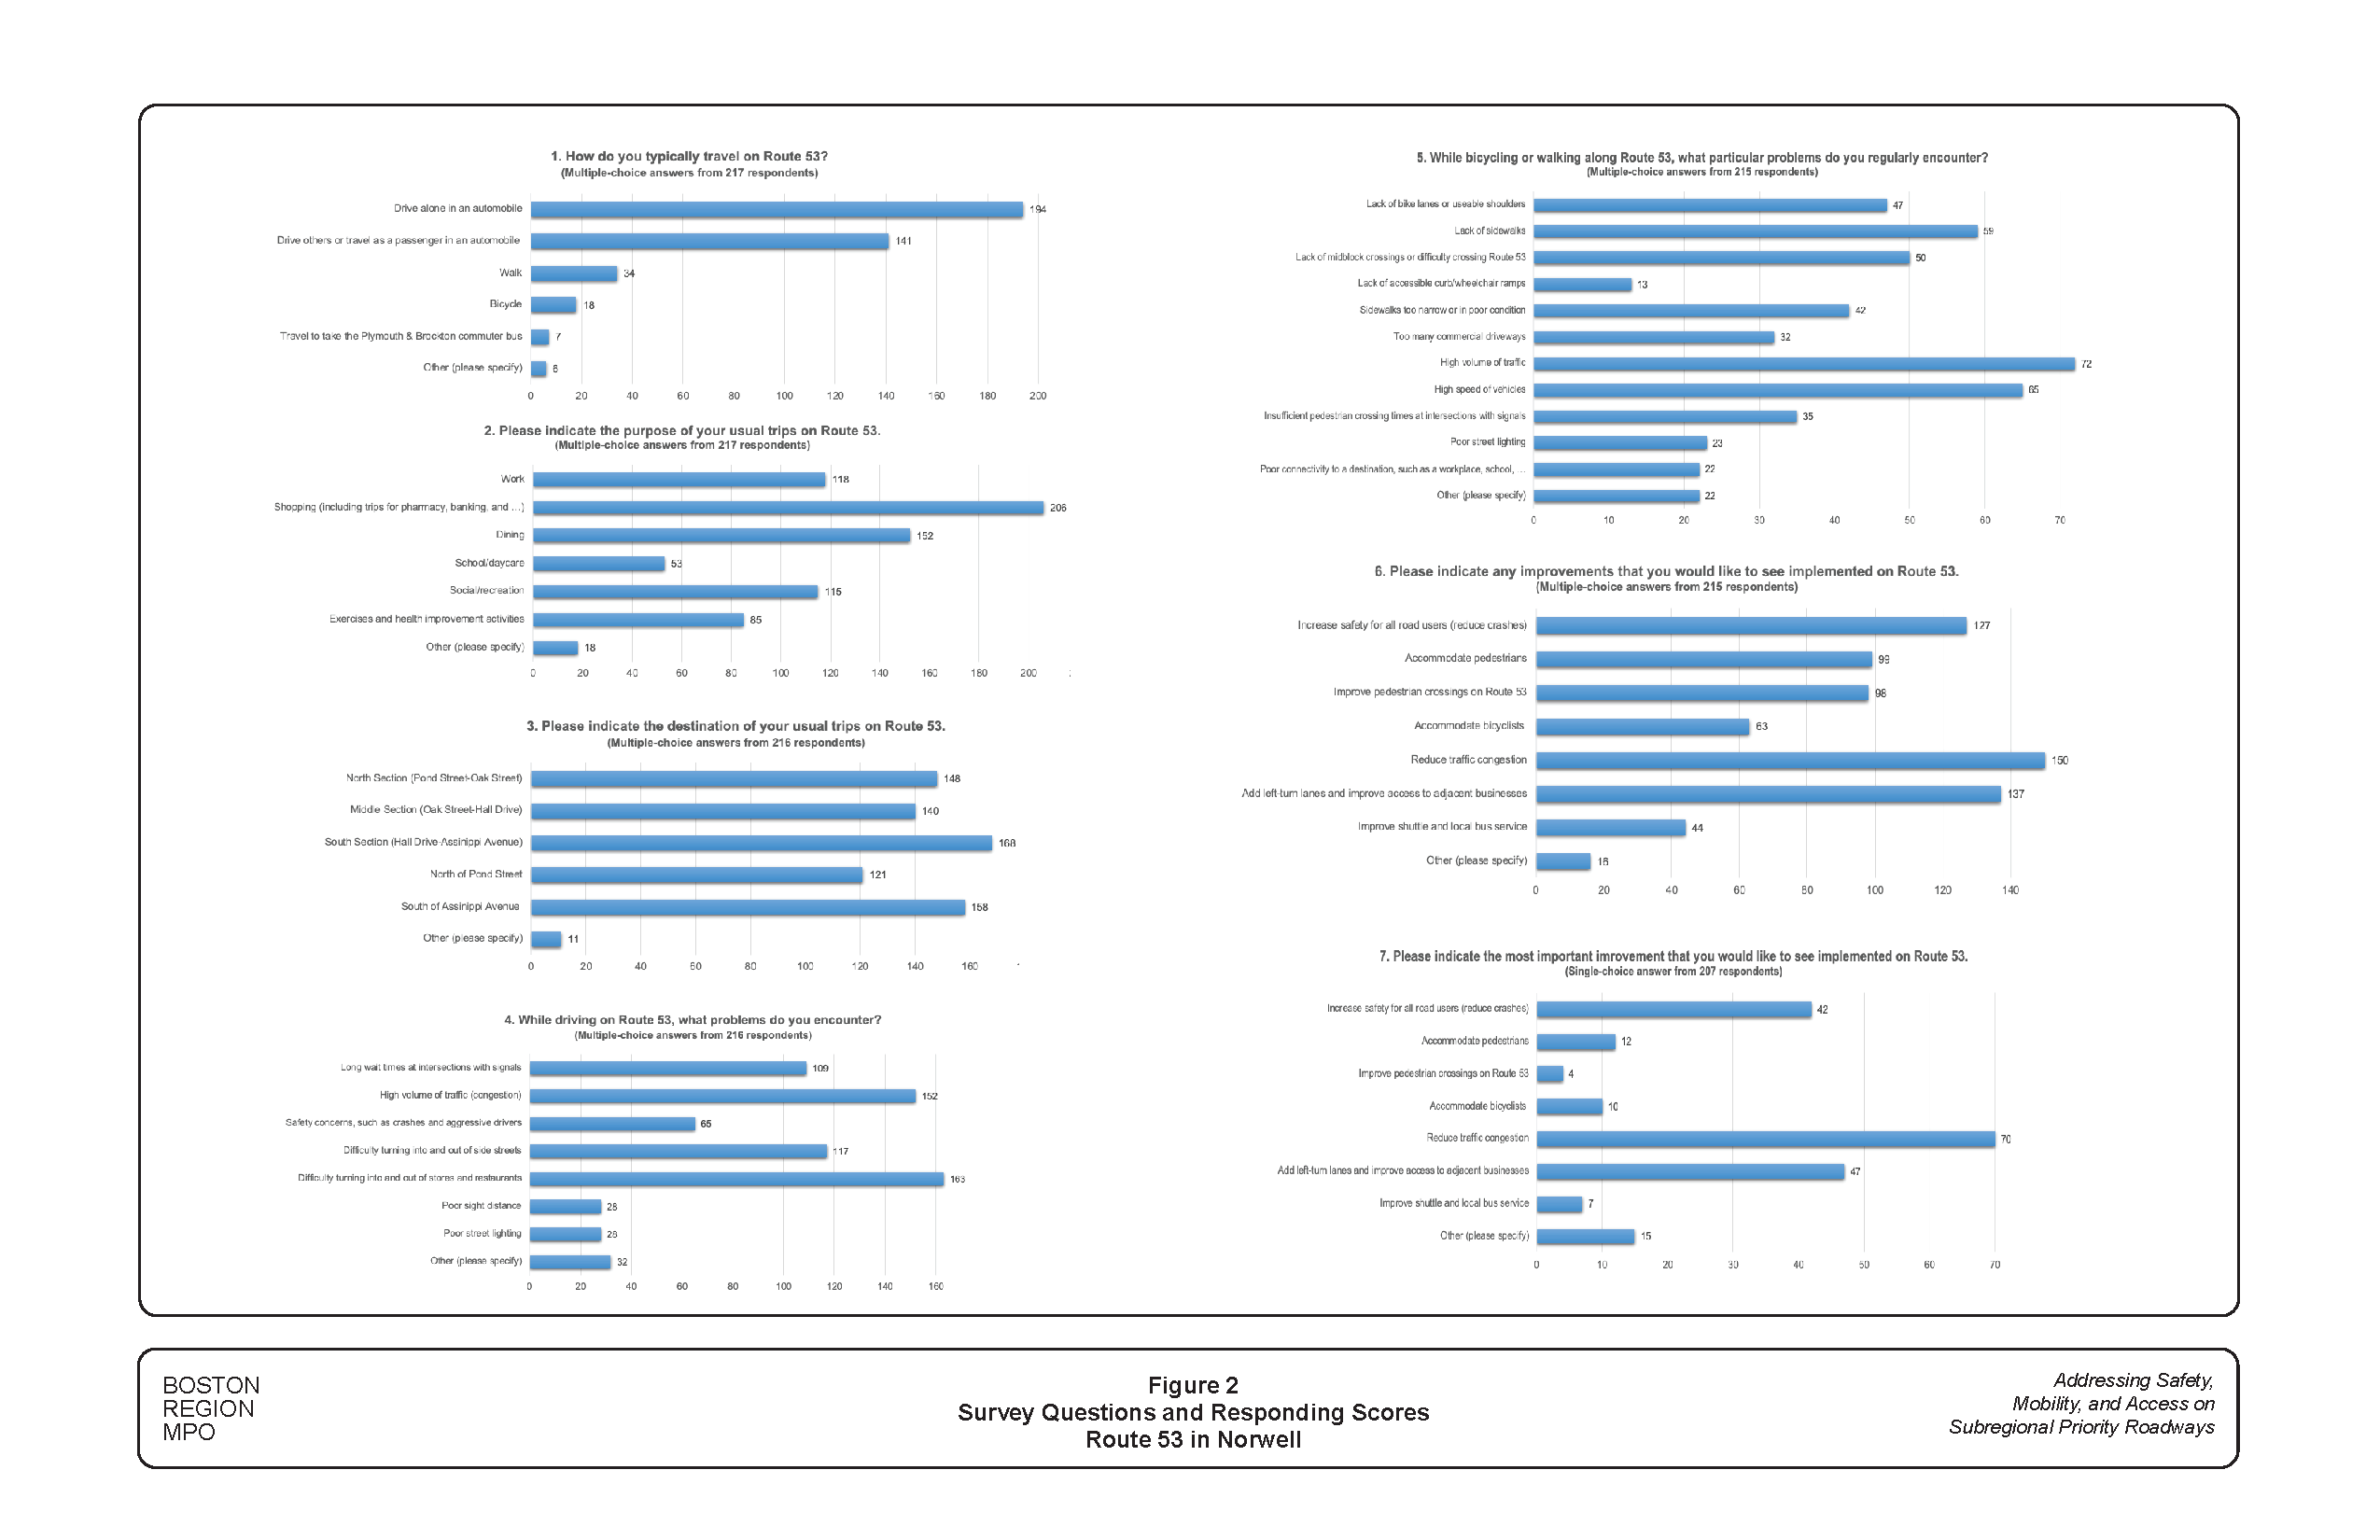
Figure 3
Estimated 2020 Daily Traffic Volumes
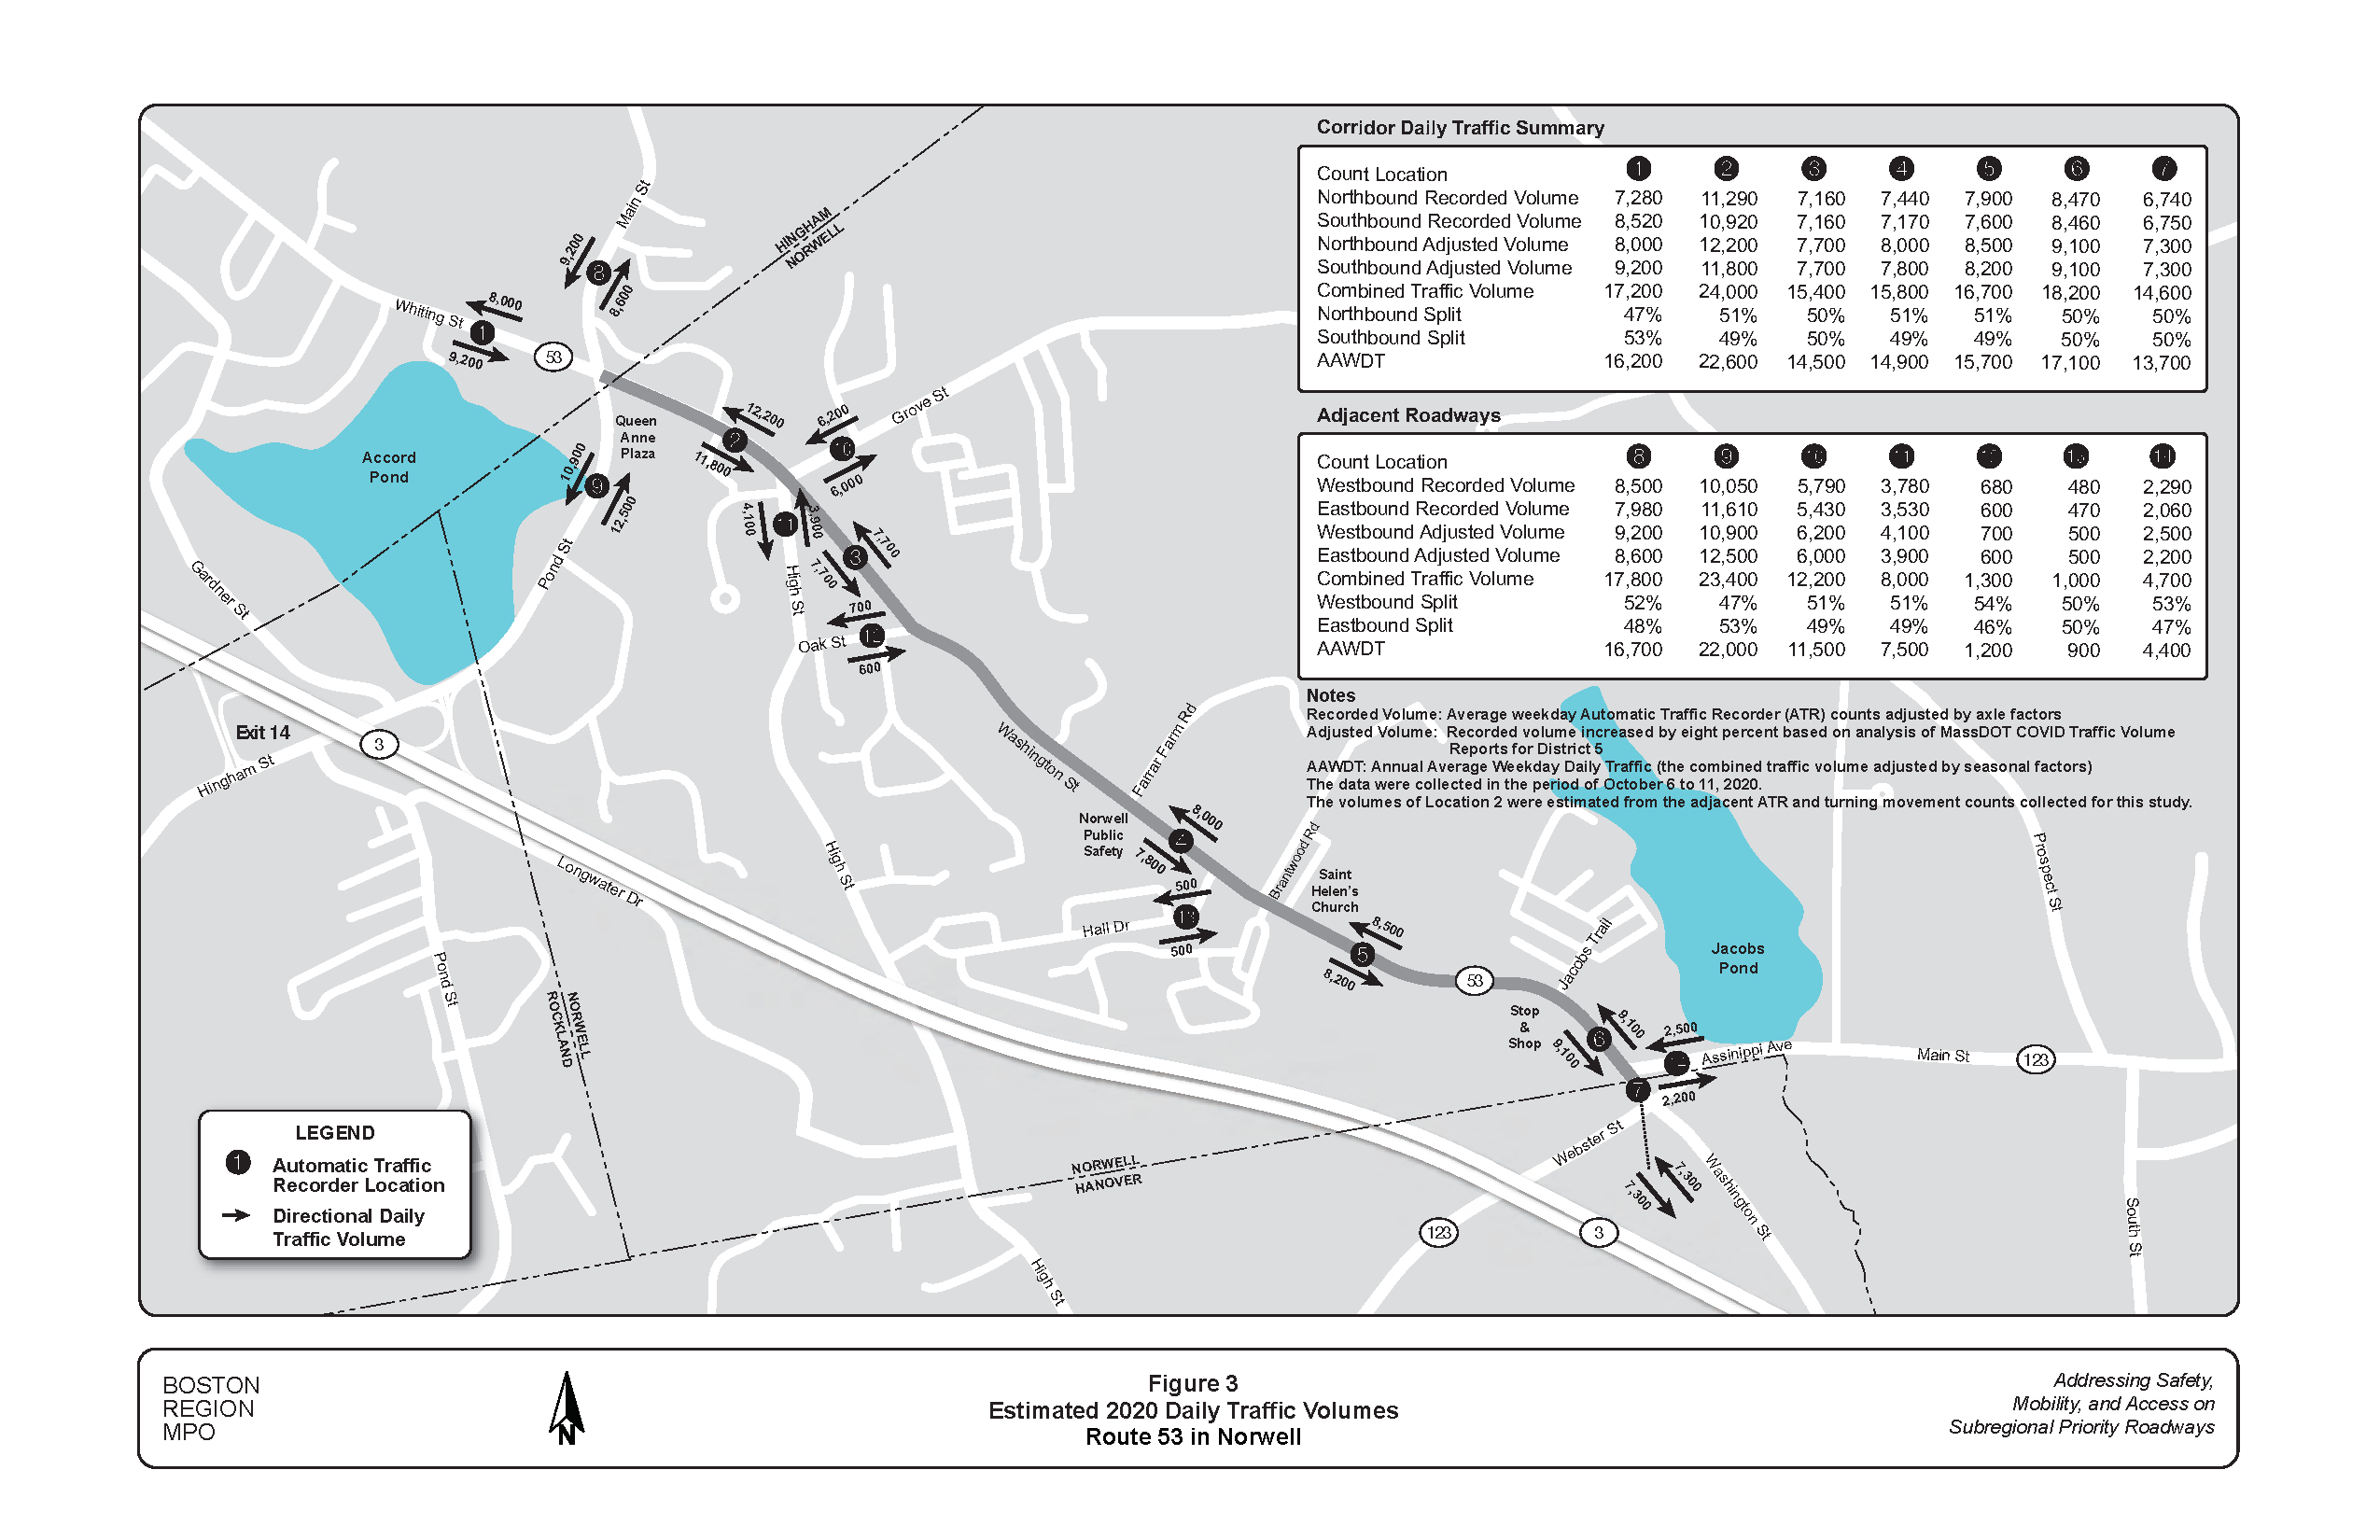
Figure 4
Estimated 2020 Weekday AM/PM Peak-Hour Traffic and Pedestrian Volumes
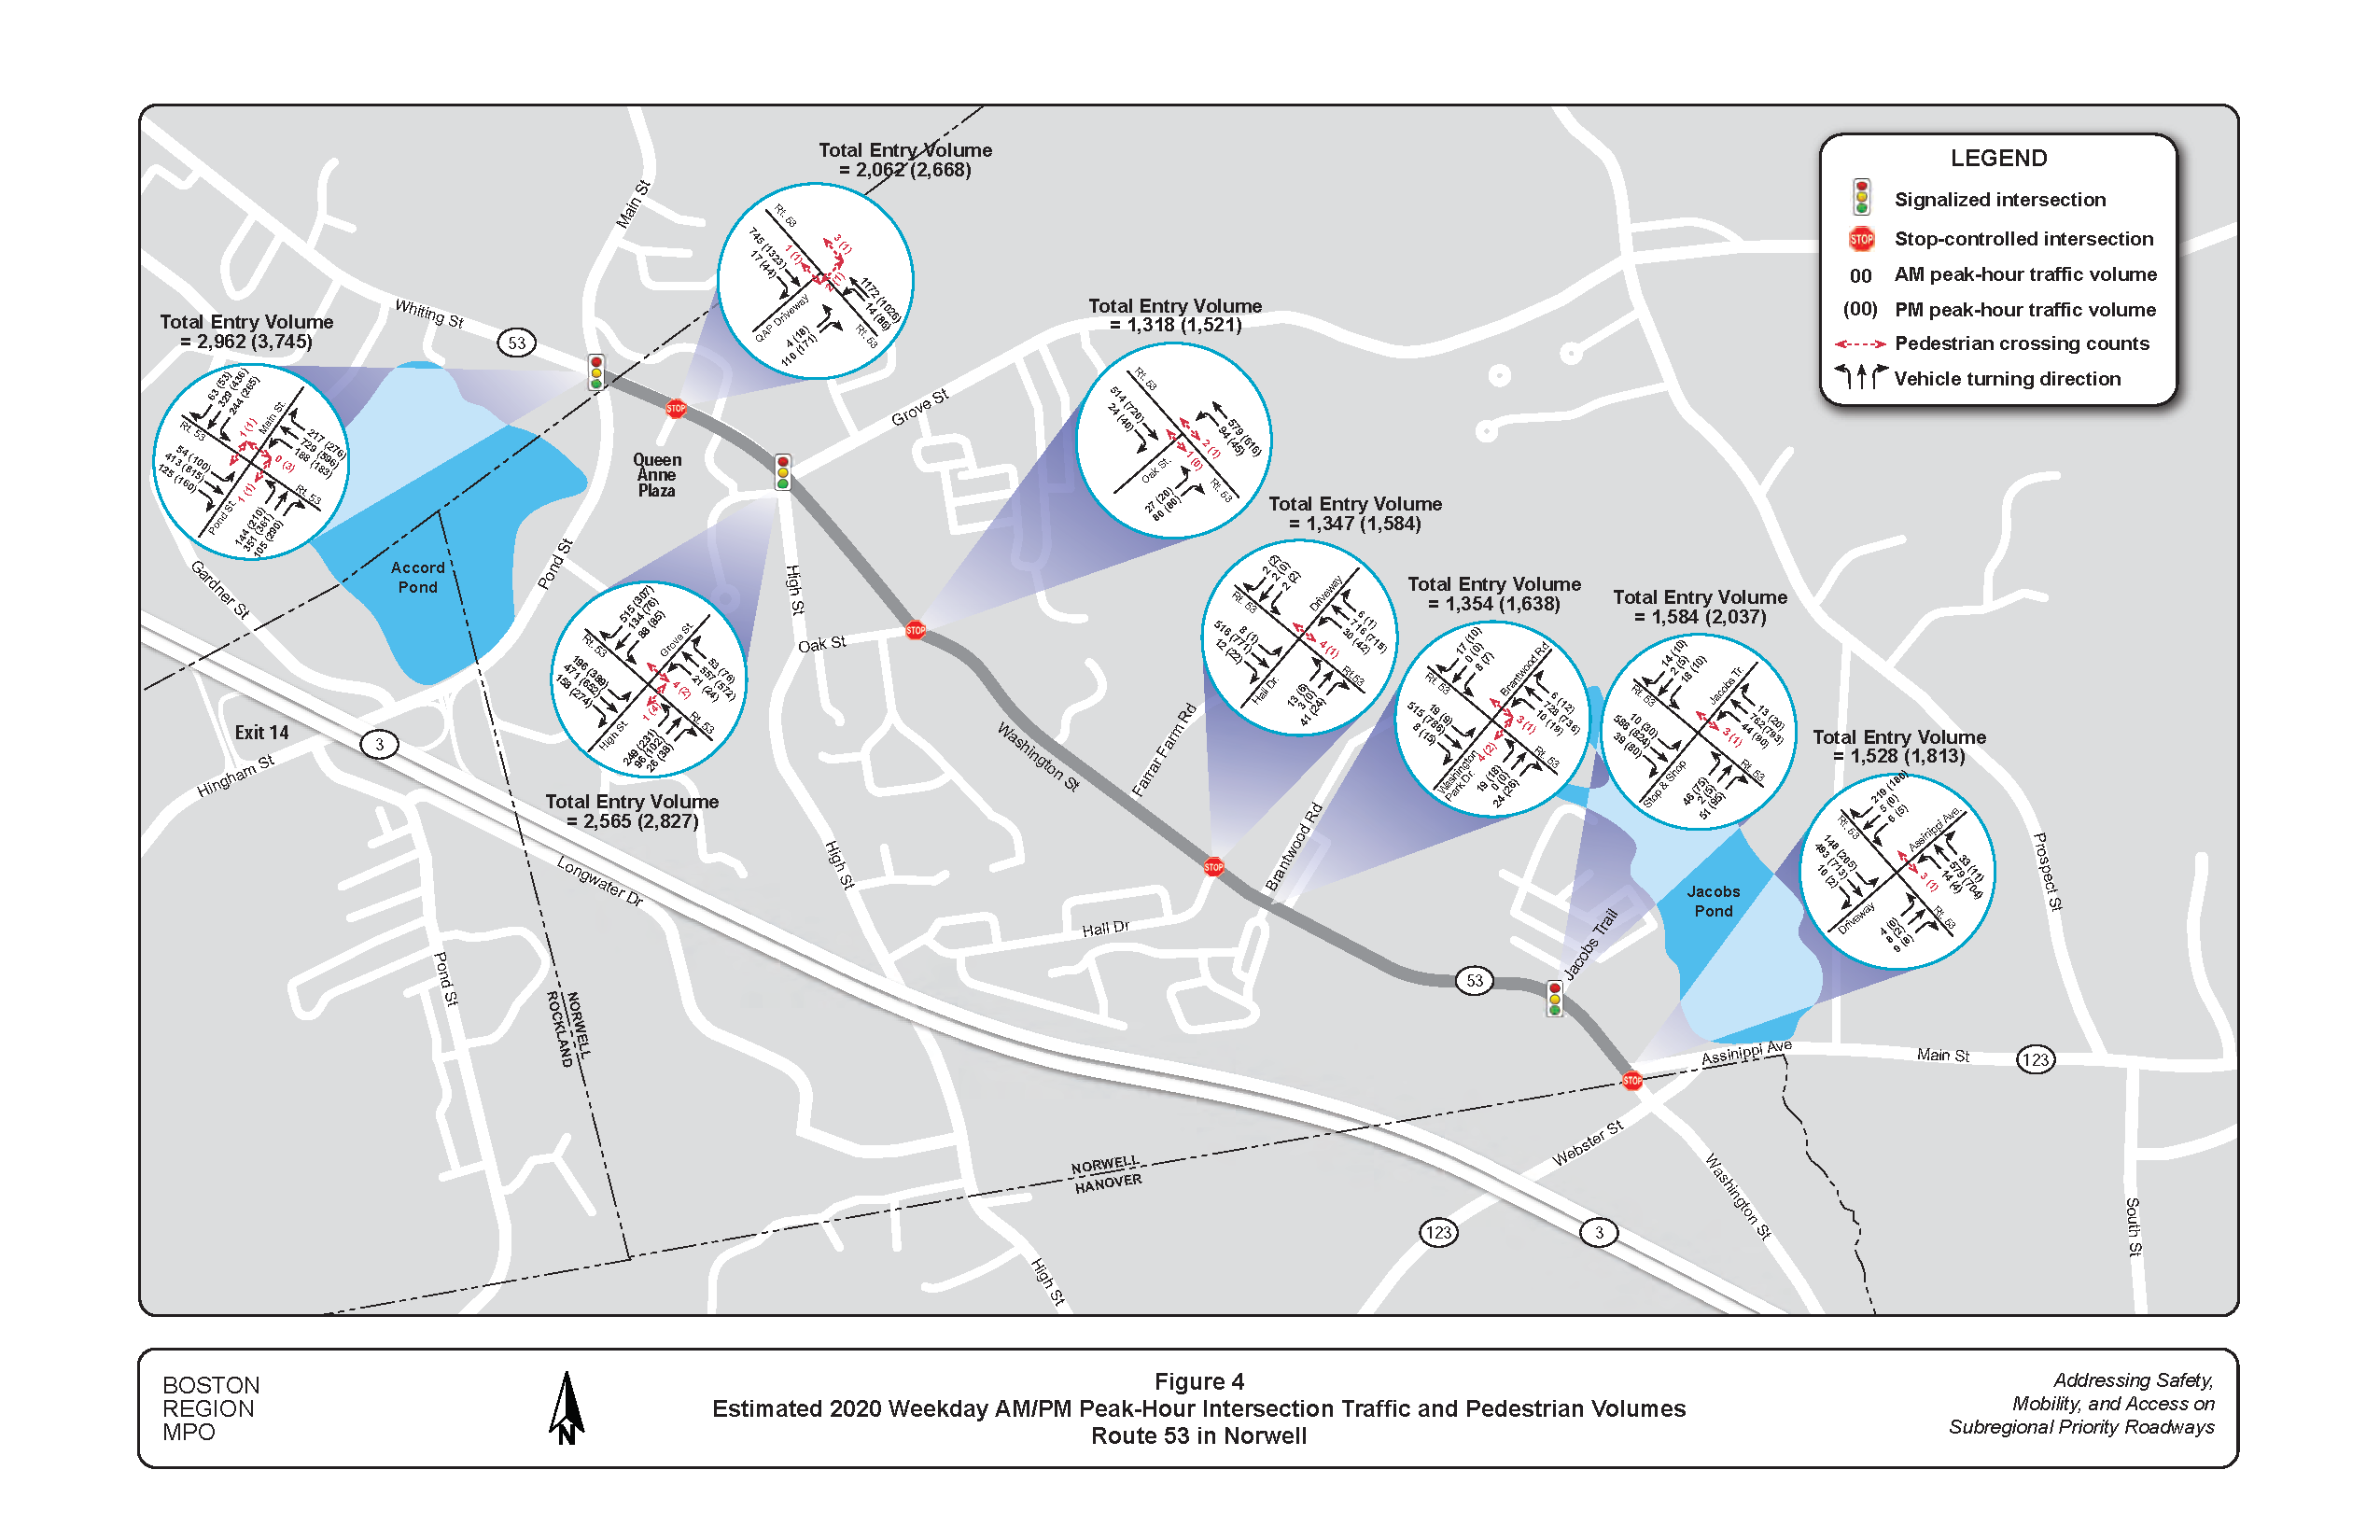
Figure 5
2020 Weekday AM/PM Peak Hour Intersection Capacity Analyses
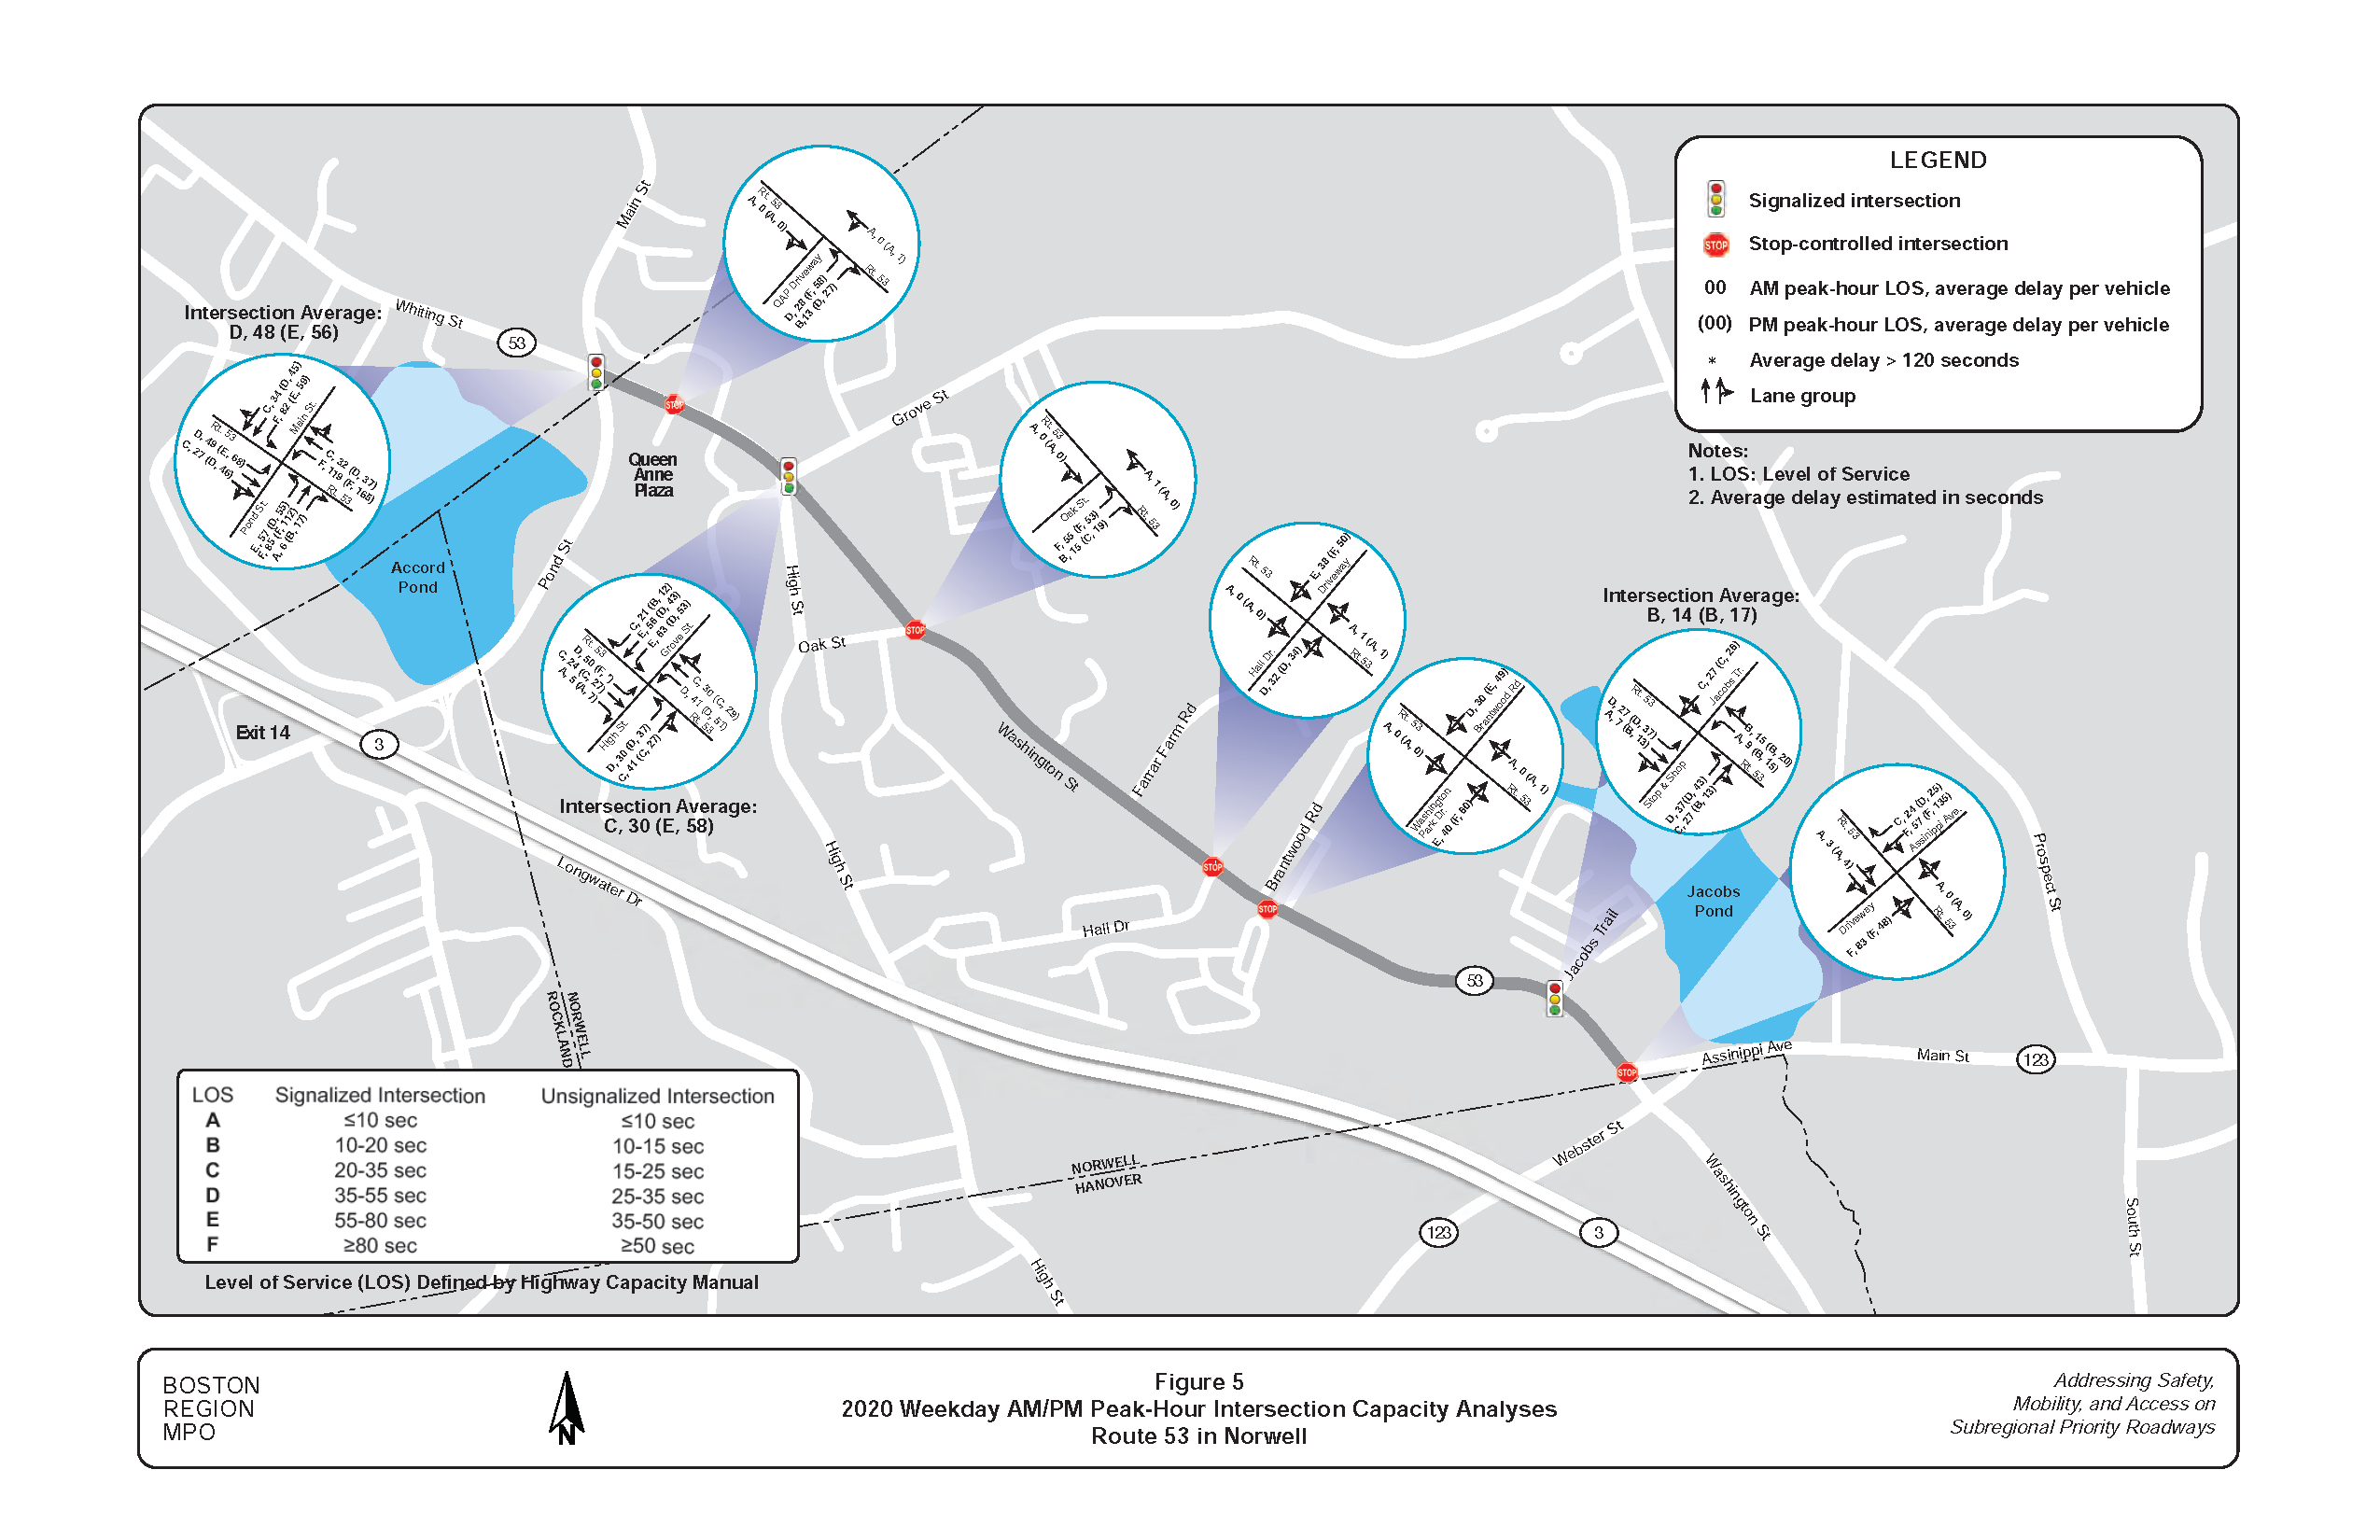
Figure 6
Speed Regulations and Estimated 85th Percentile Speeds
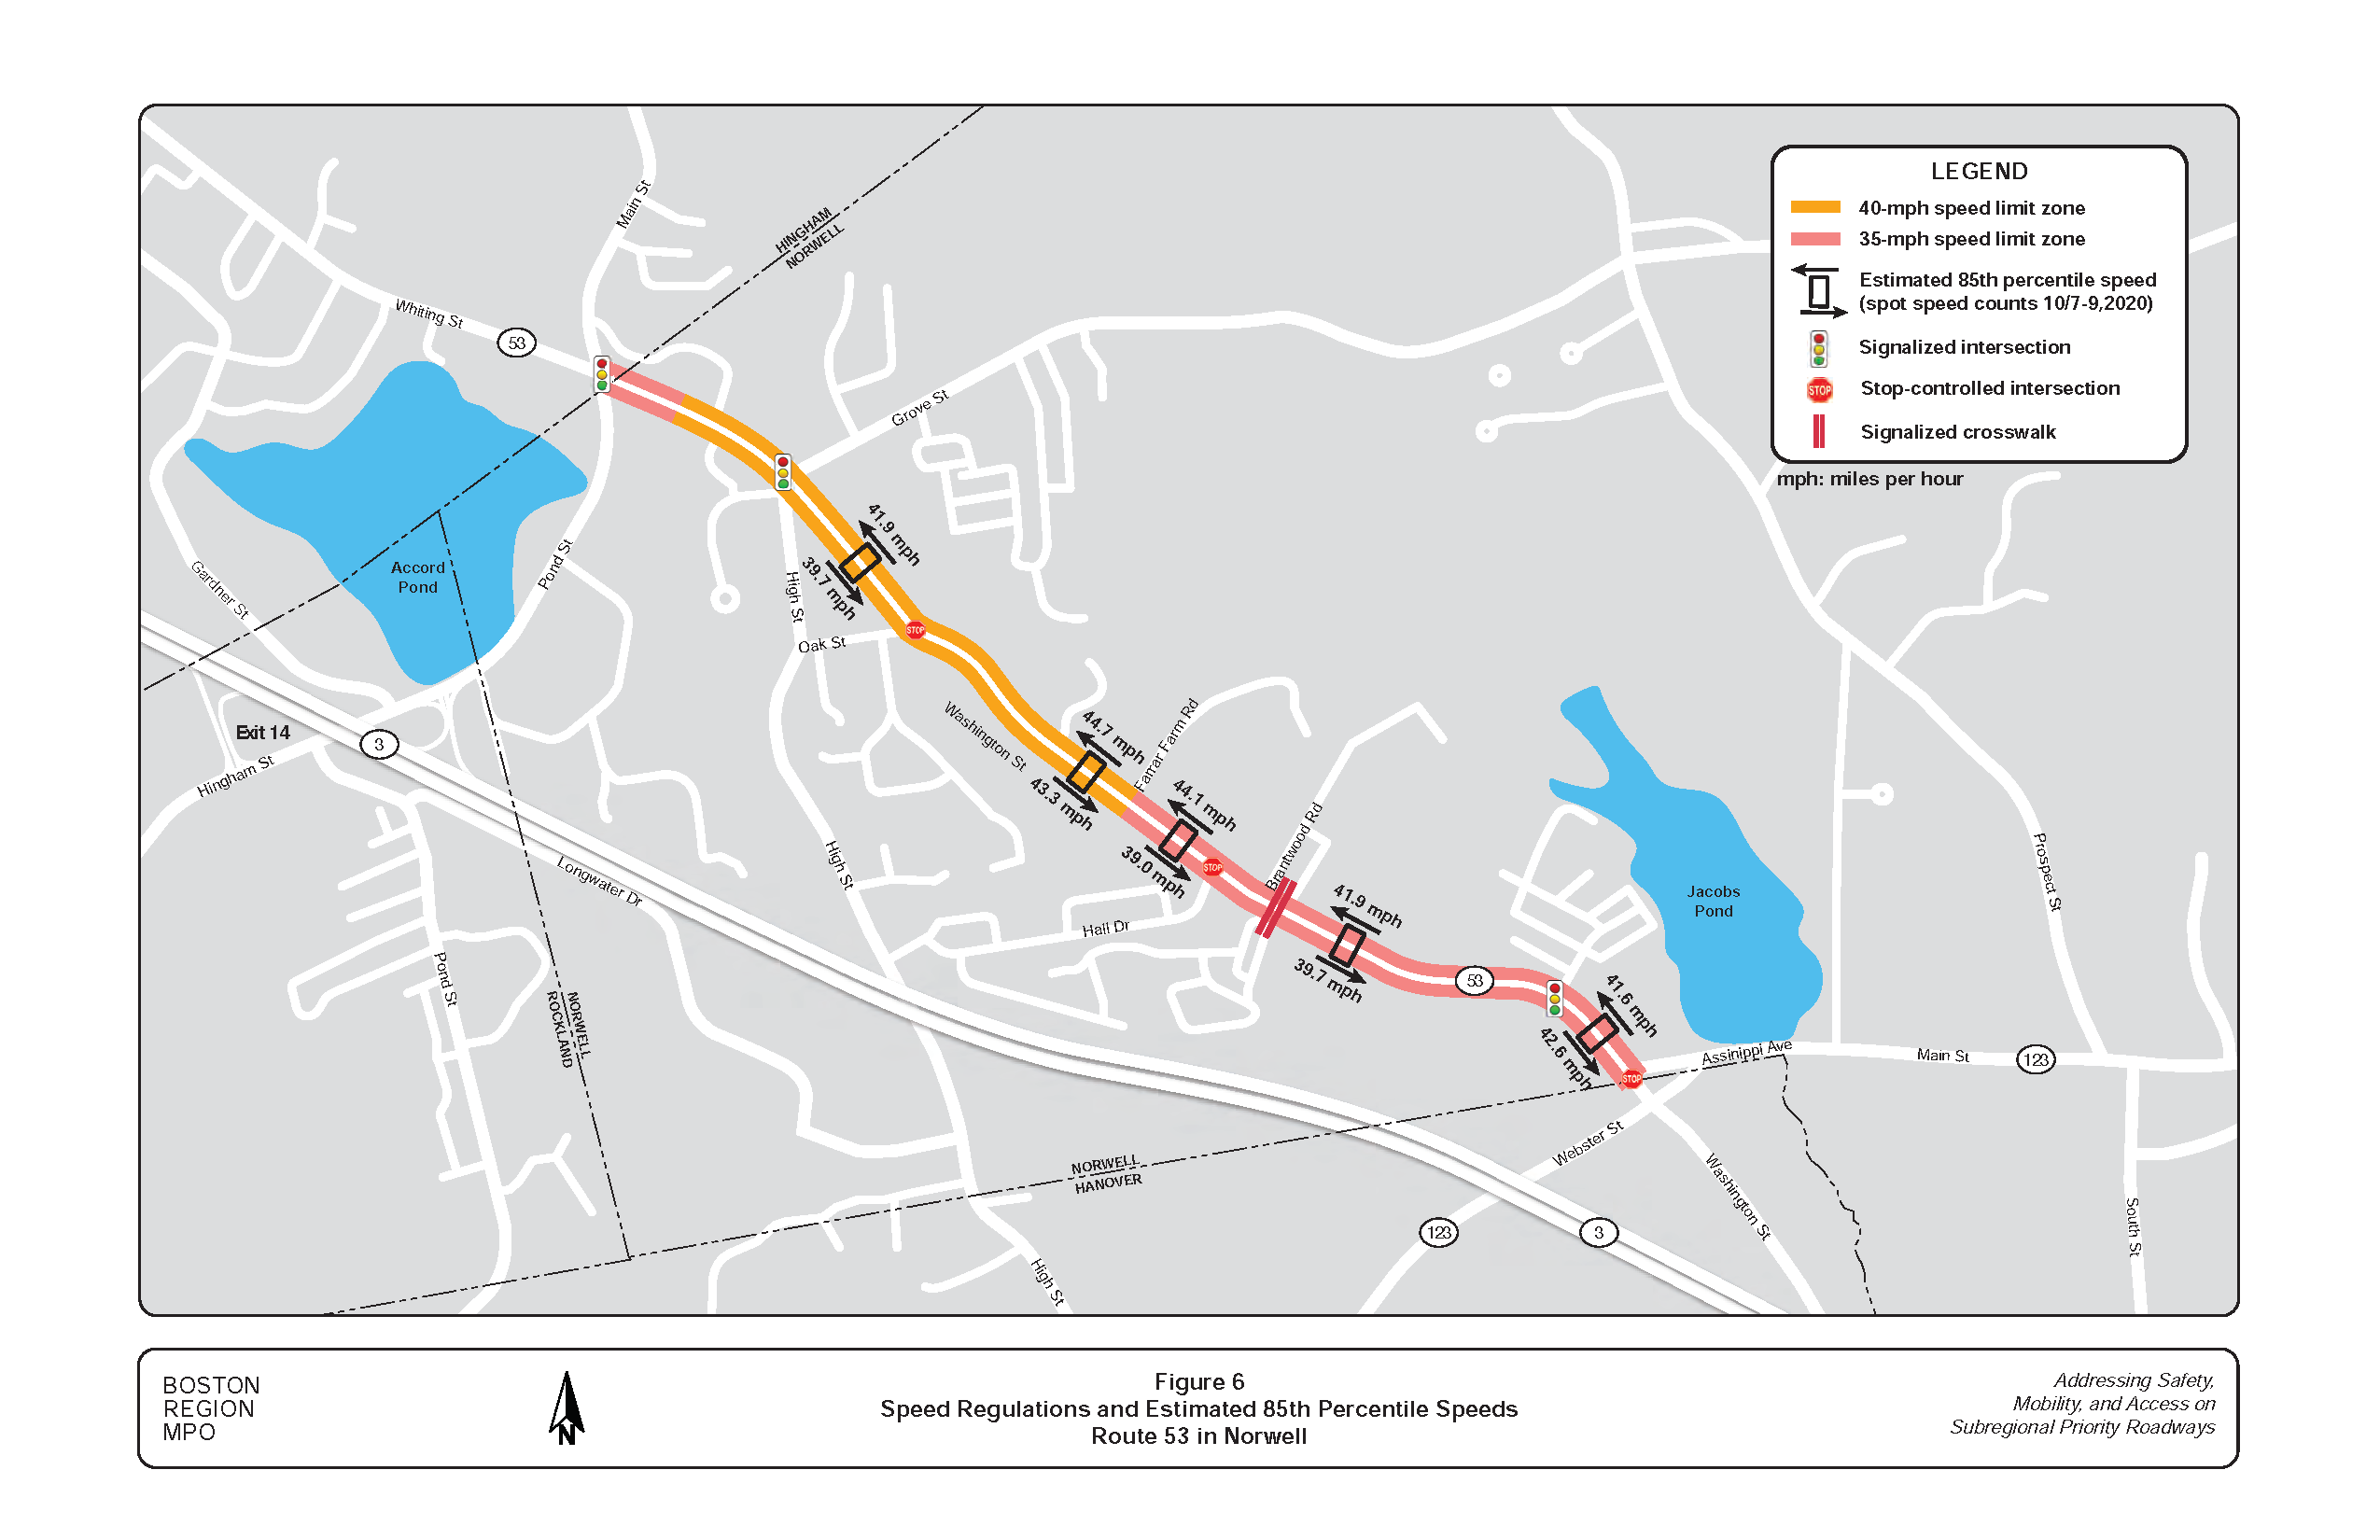
Figure 7
Existing Roadway Cross Section and Potential Reconfigurations:
Route 53 between Pond Street and High Street
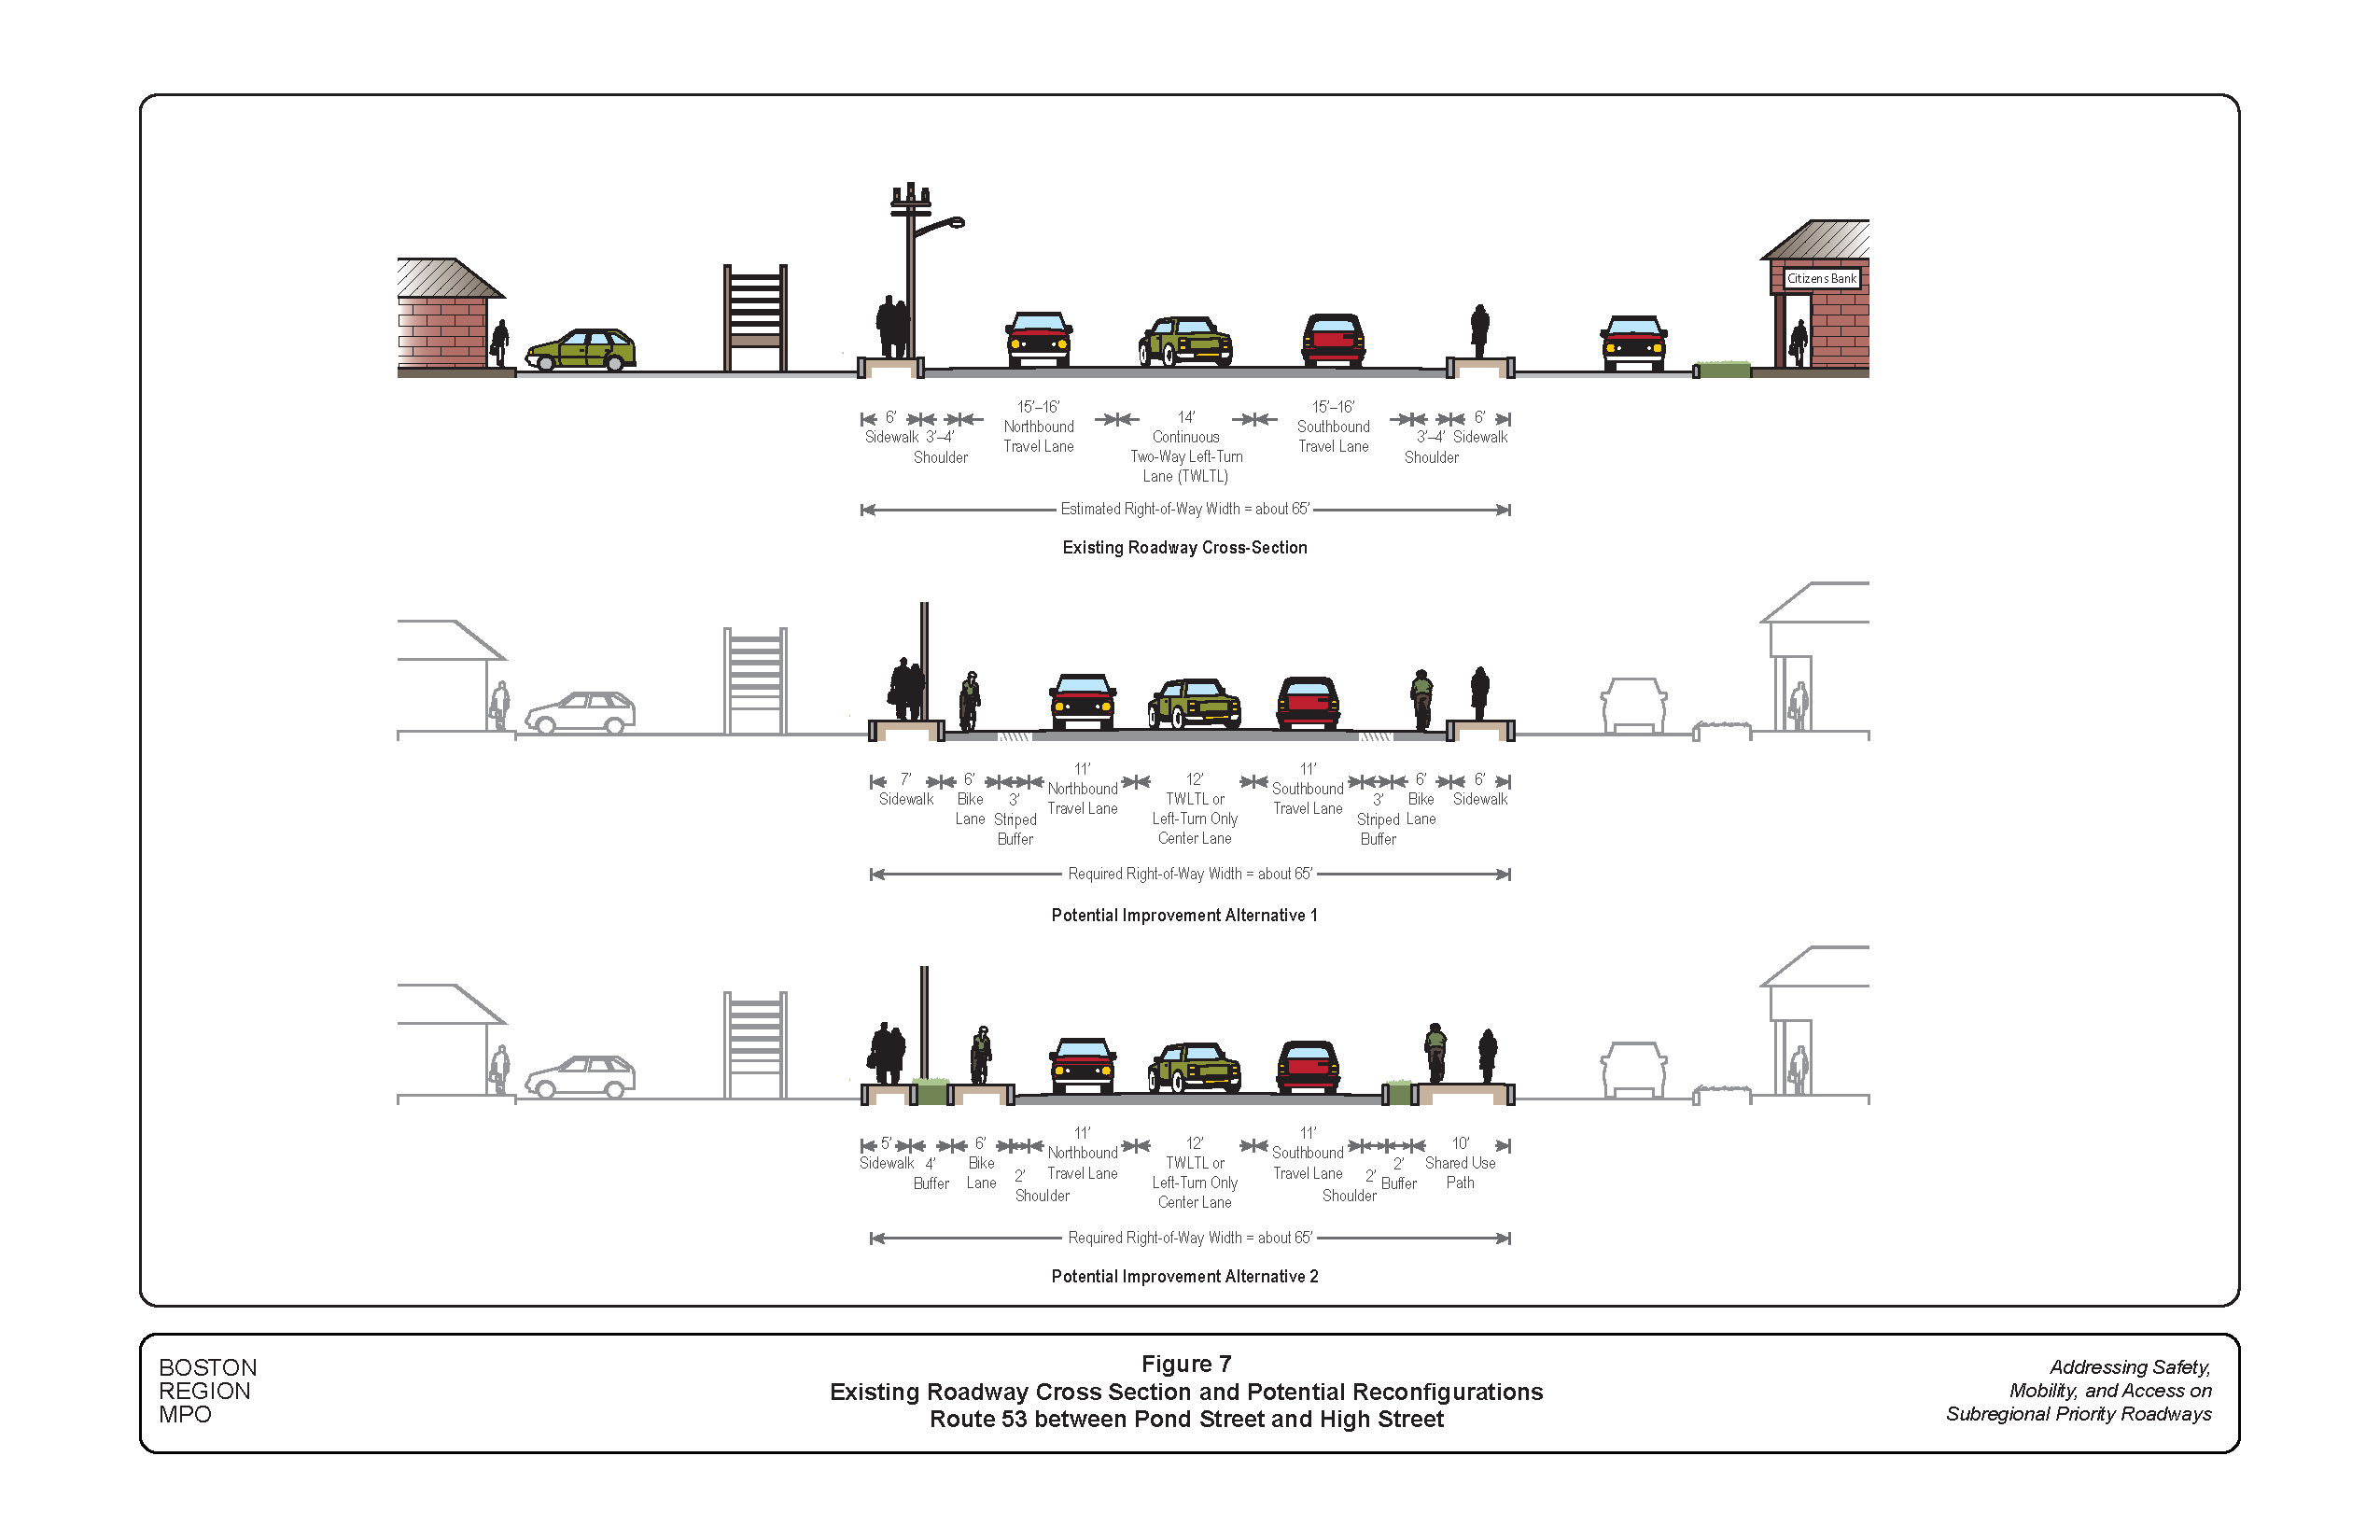
Figure 8
Existing Roadway Cross Section and Potential Reconfigurations:
Route 53 between High Street and Oak Street
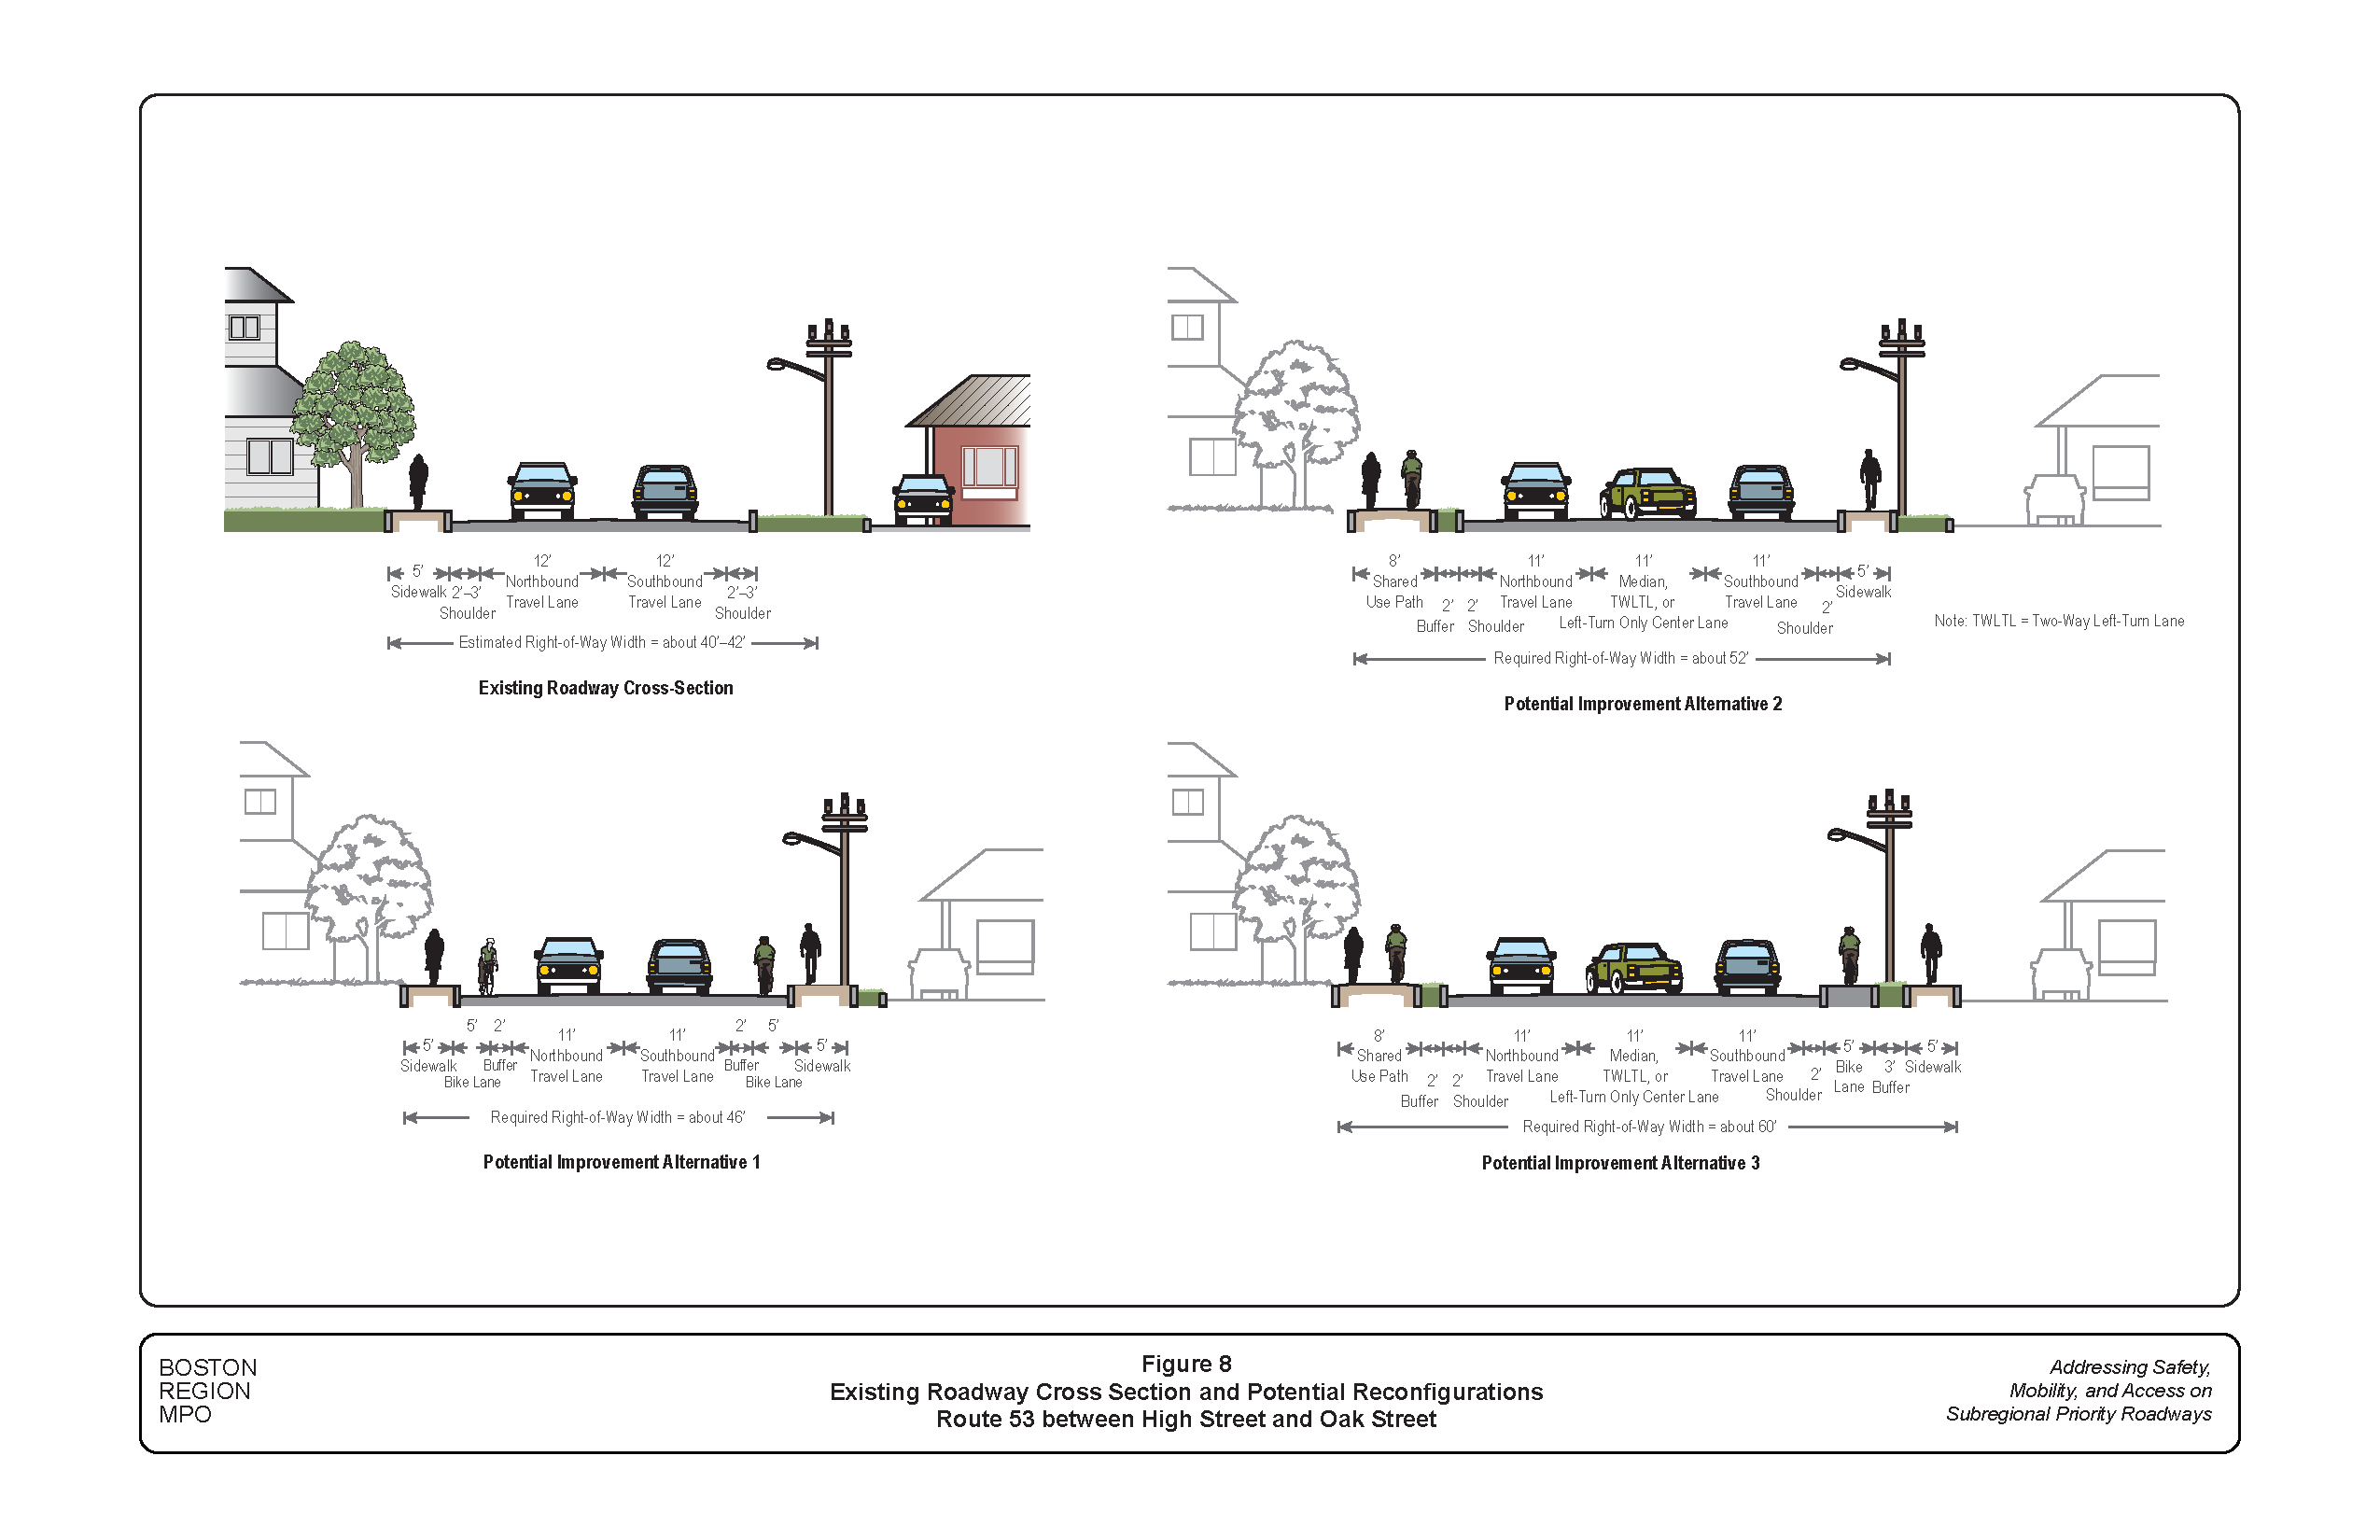
Figure 9-1
Existing Roadway Cross Section and Potential Reconfigurations:
Route 53 between Oak Street and Jacobs Trail
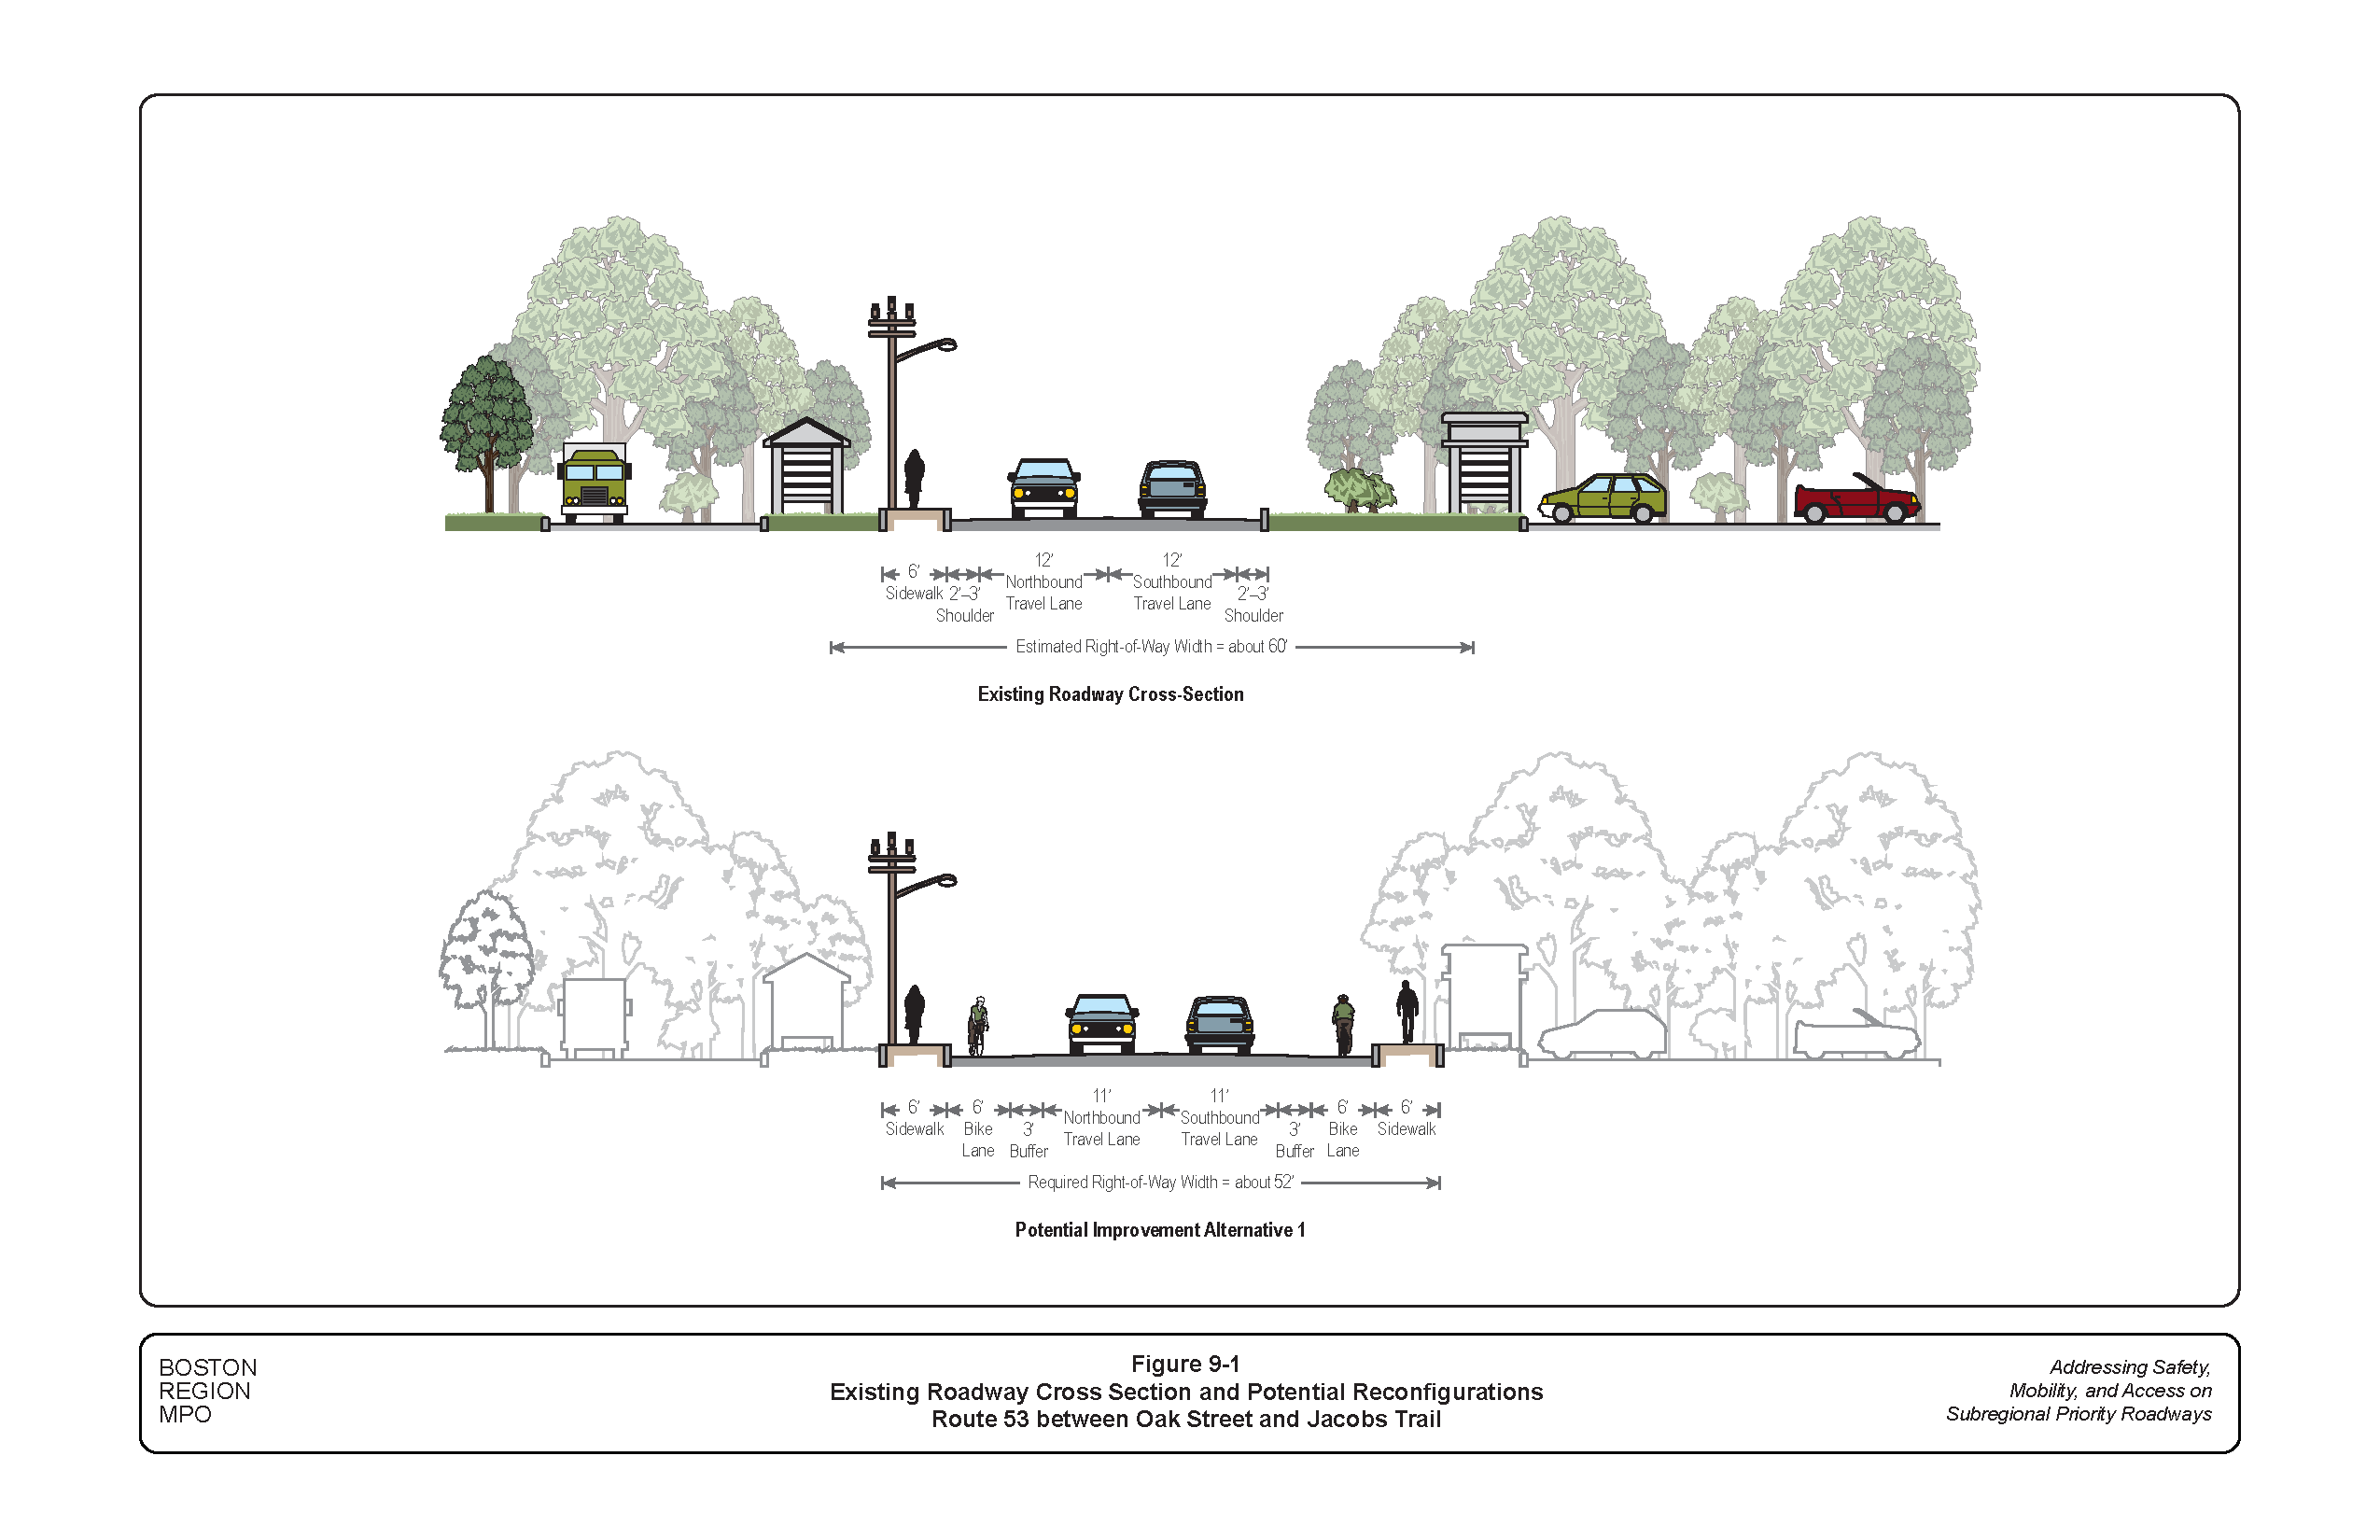
Figure 9-2
Existing Roadway Cross Section and Potential Reconfigurations:
Route 53 between Oak Street and Jacobs Trail
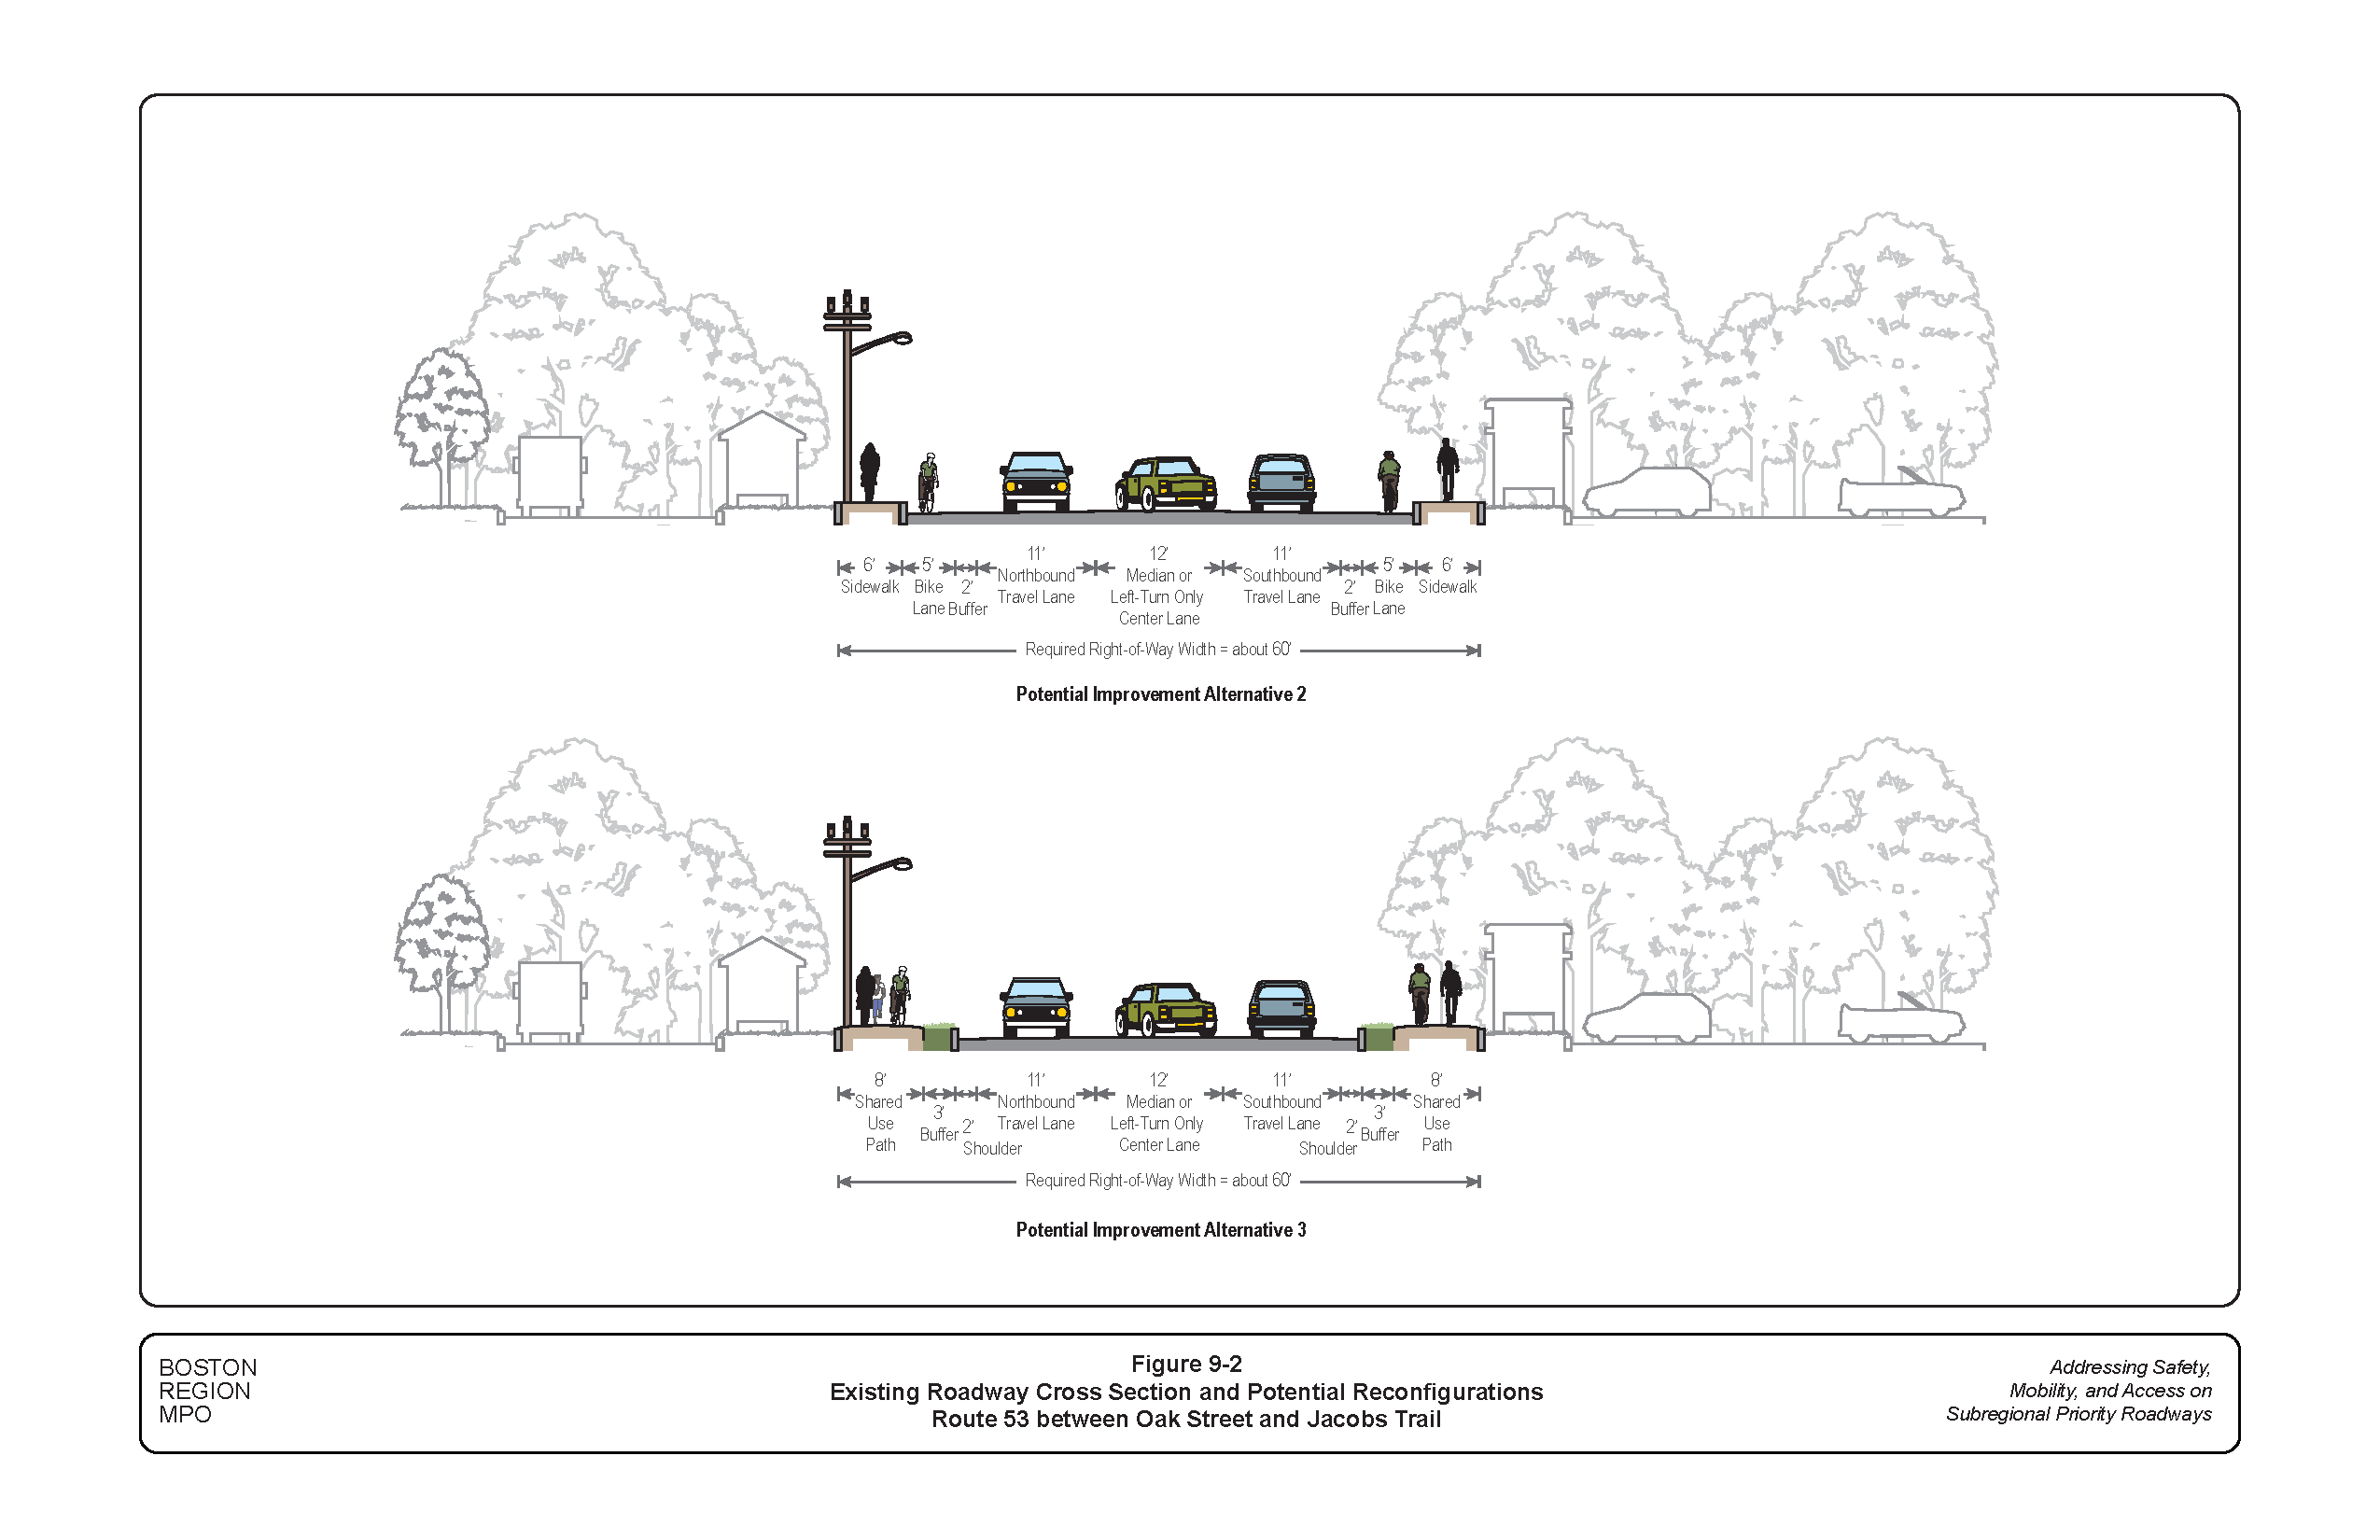
Figure 10
Existing Roadway Cross Section and Potential Reconfigurations:
Route 53 between Jacobs Trail and Assinippi Avenue
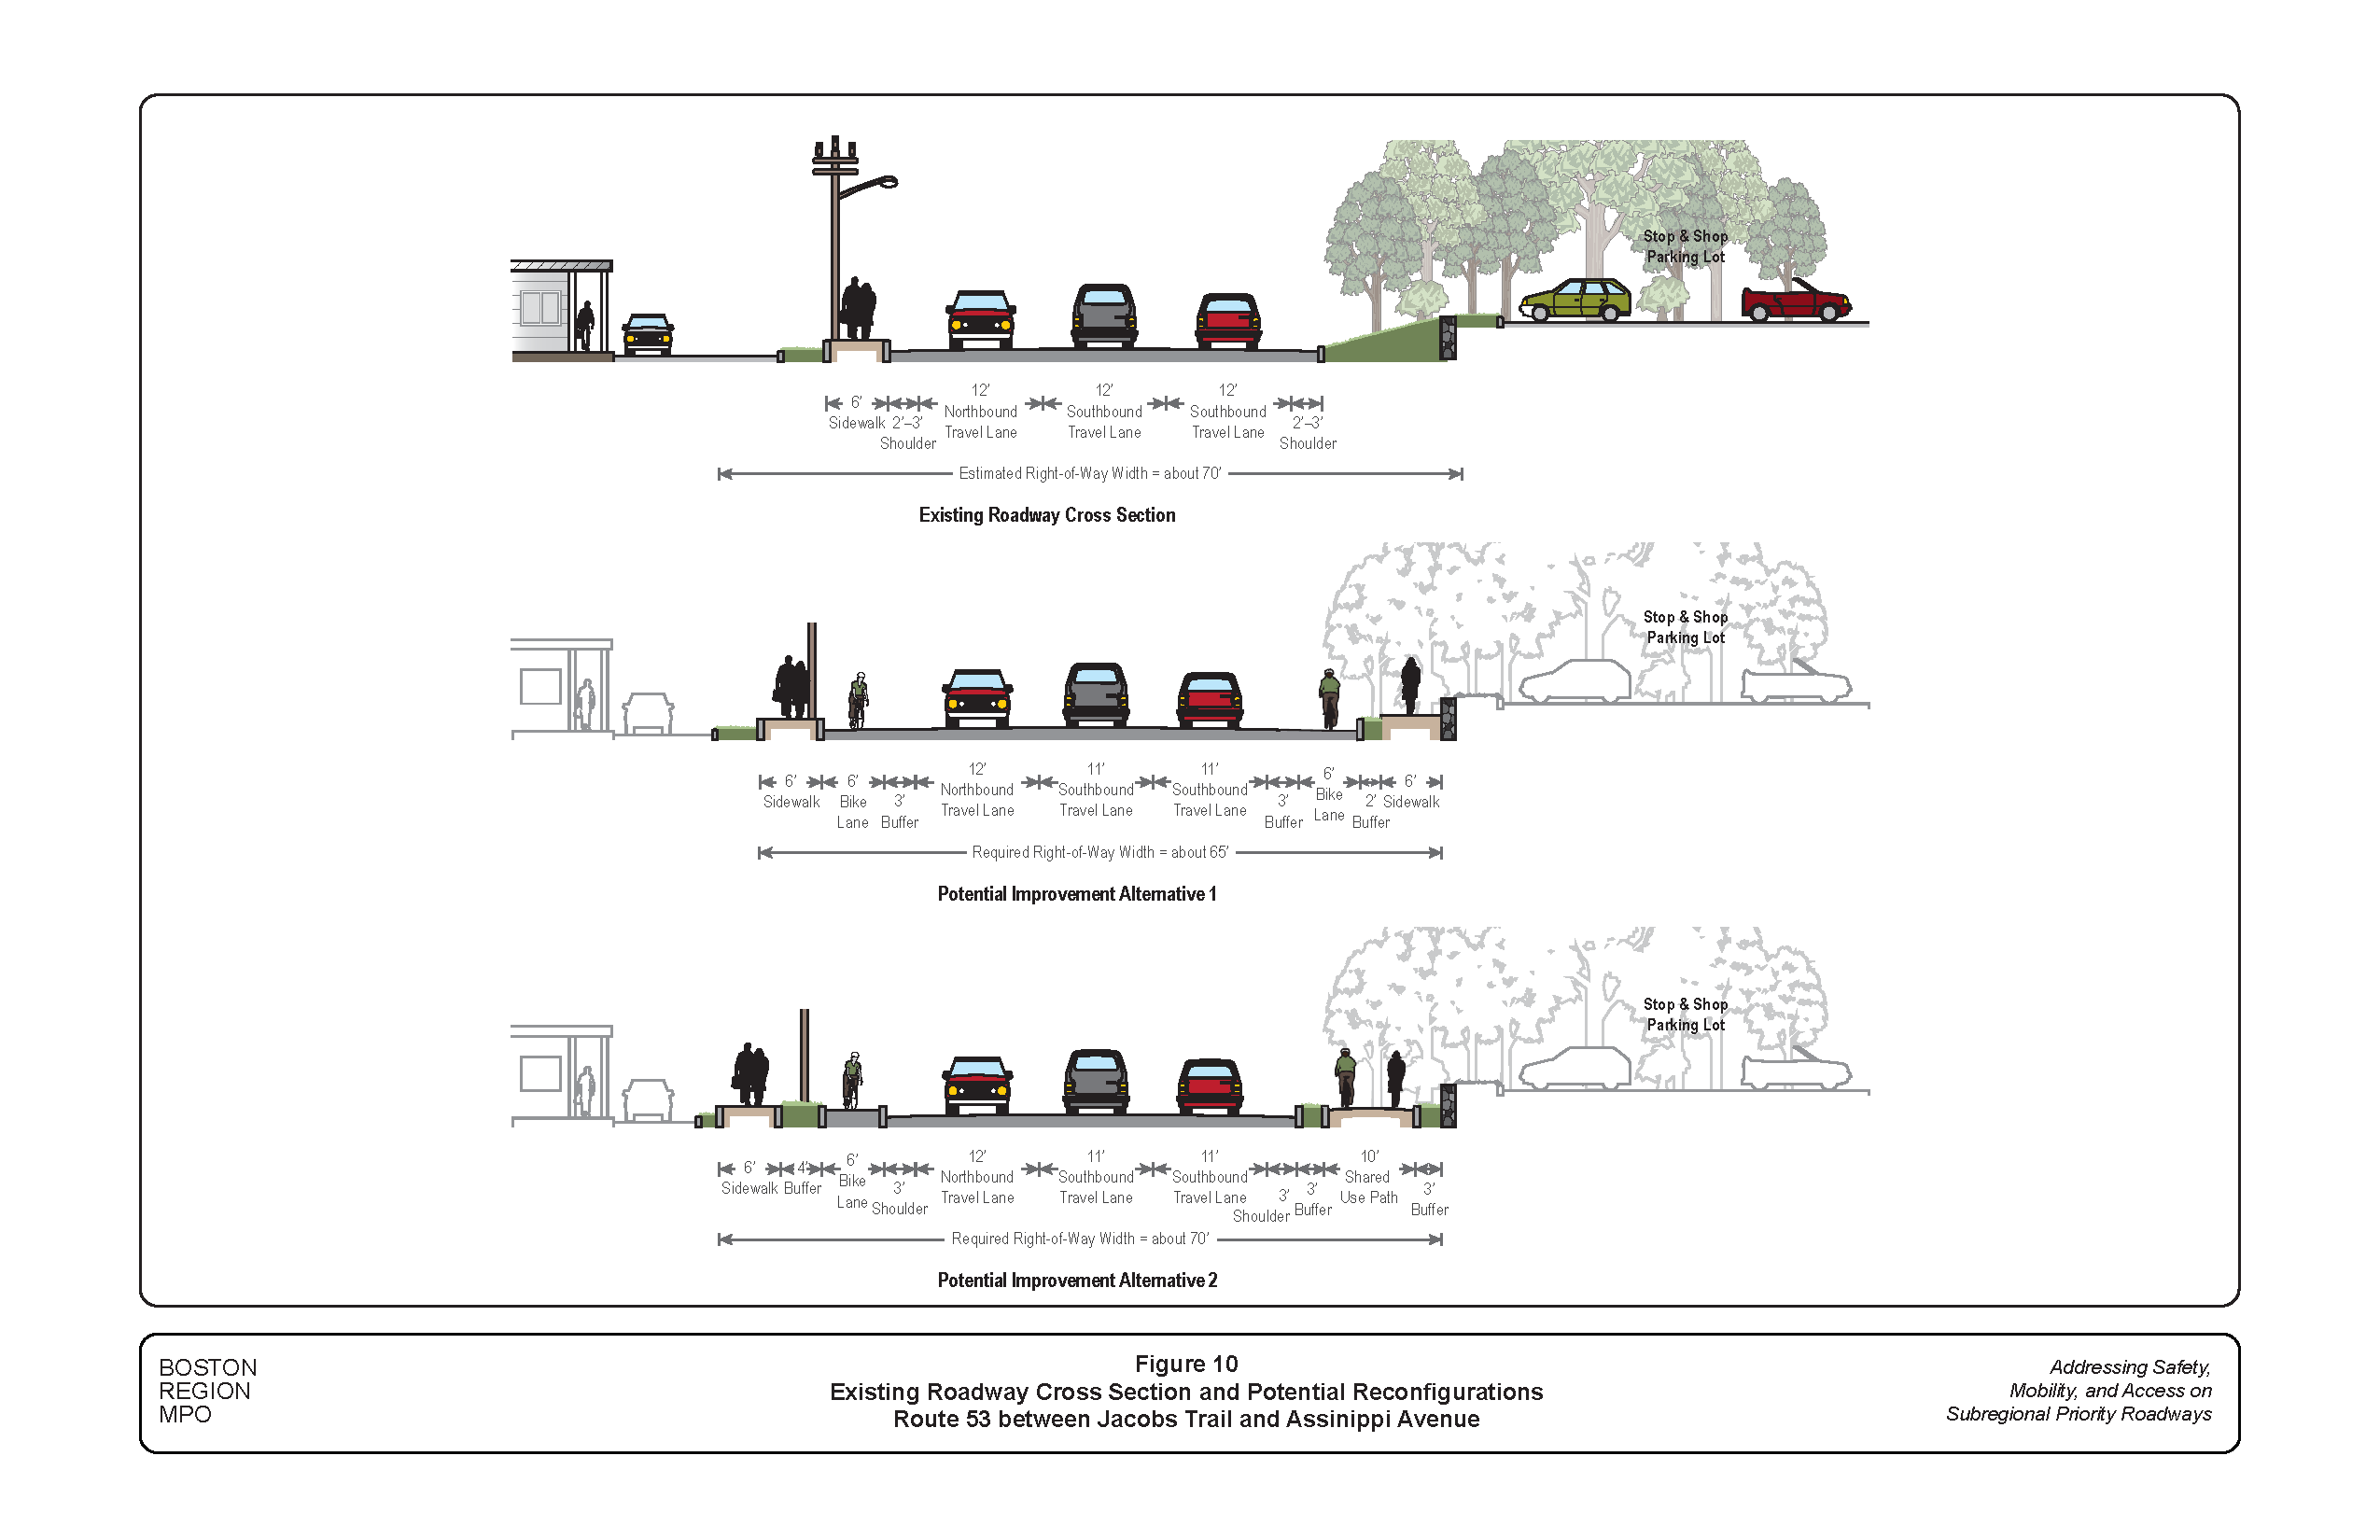
Figure 11
Proposed Restriping Conceptual Plan:
Route 53 between Pond Street and High Street
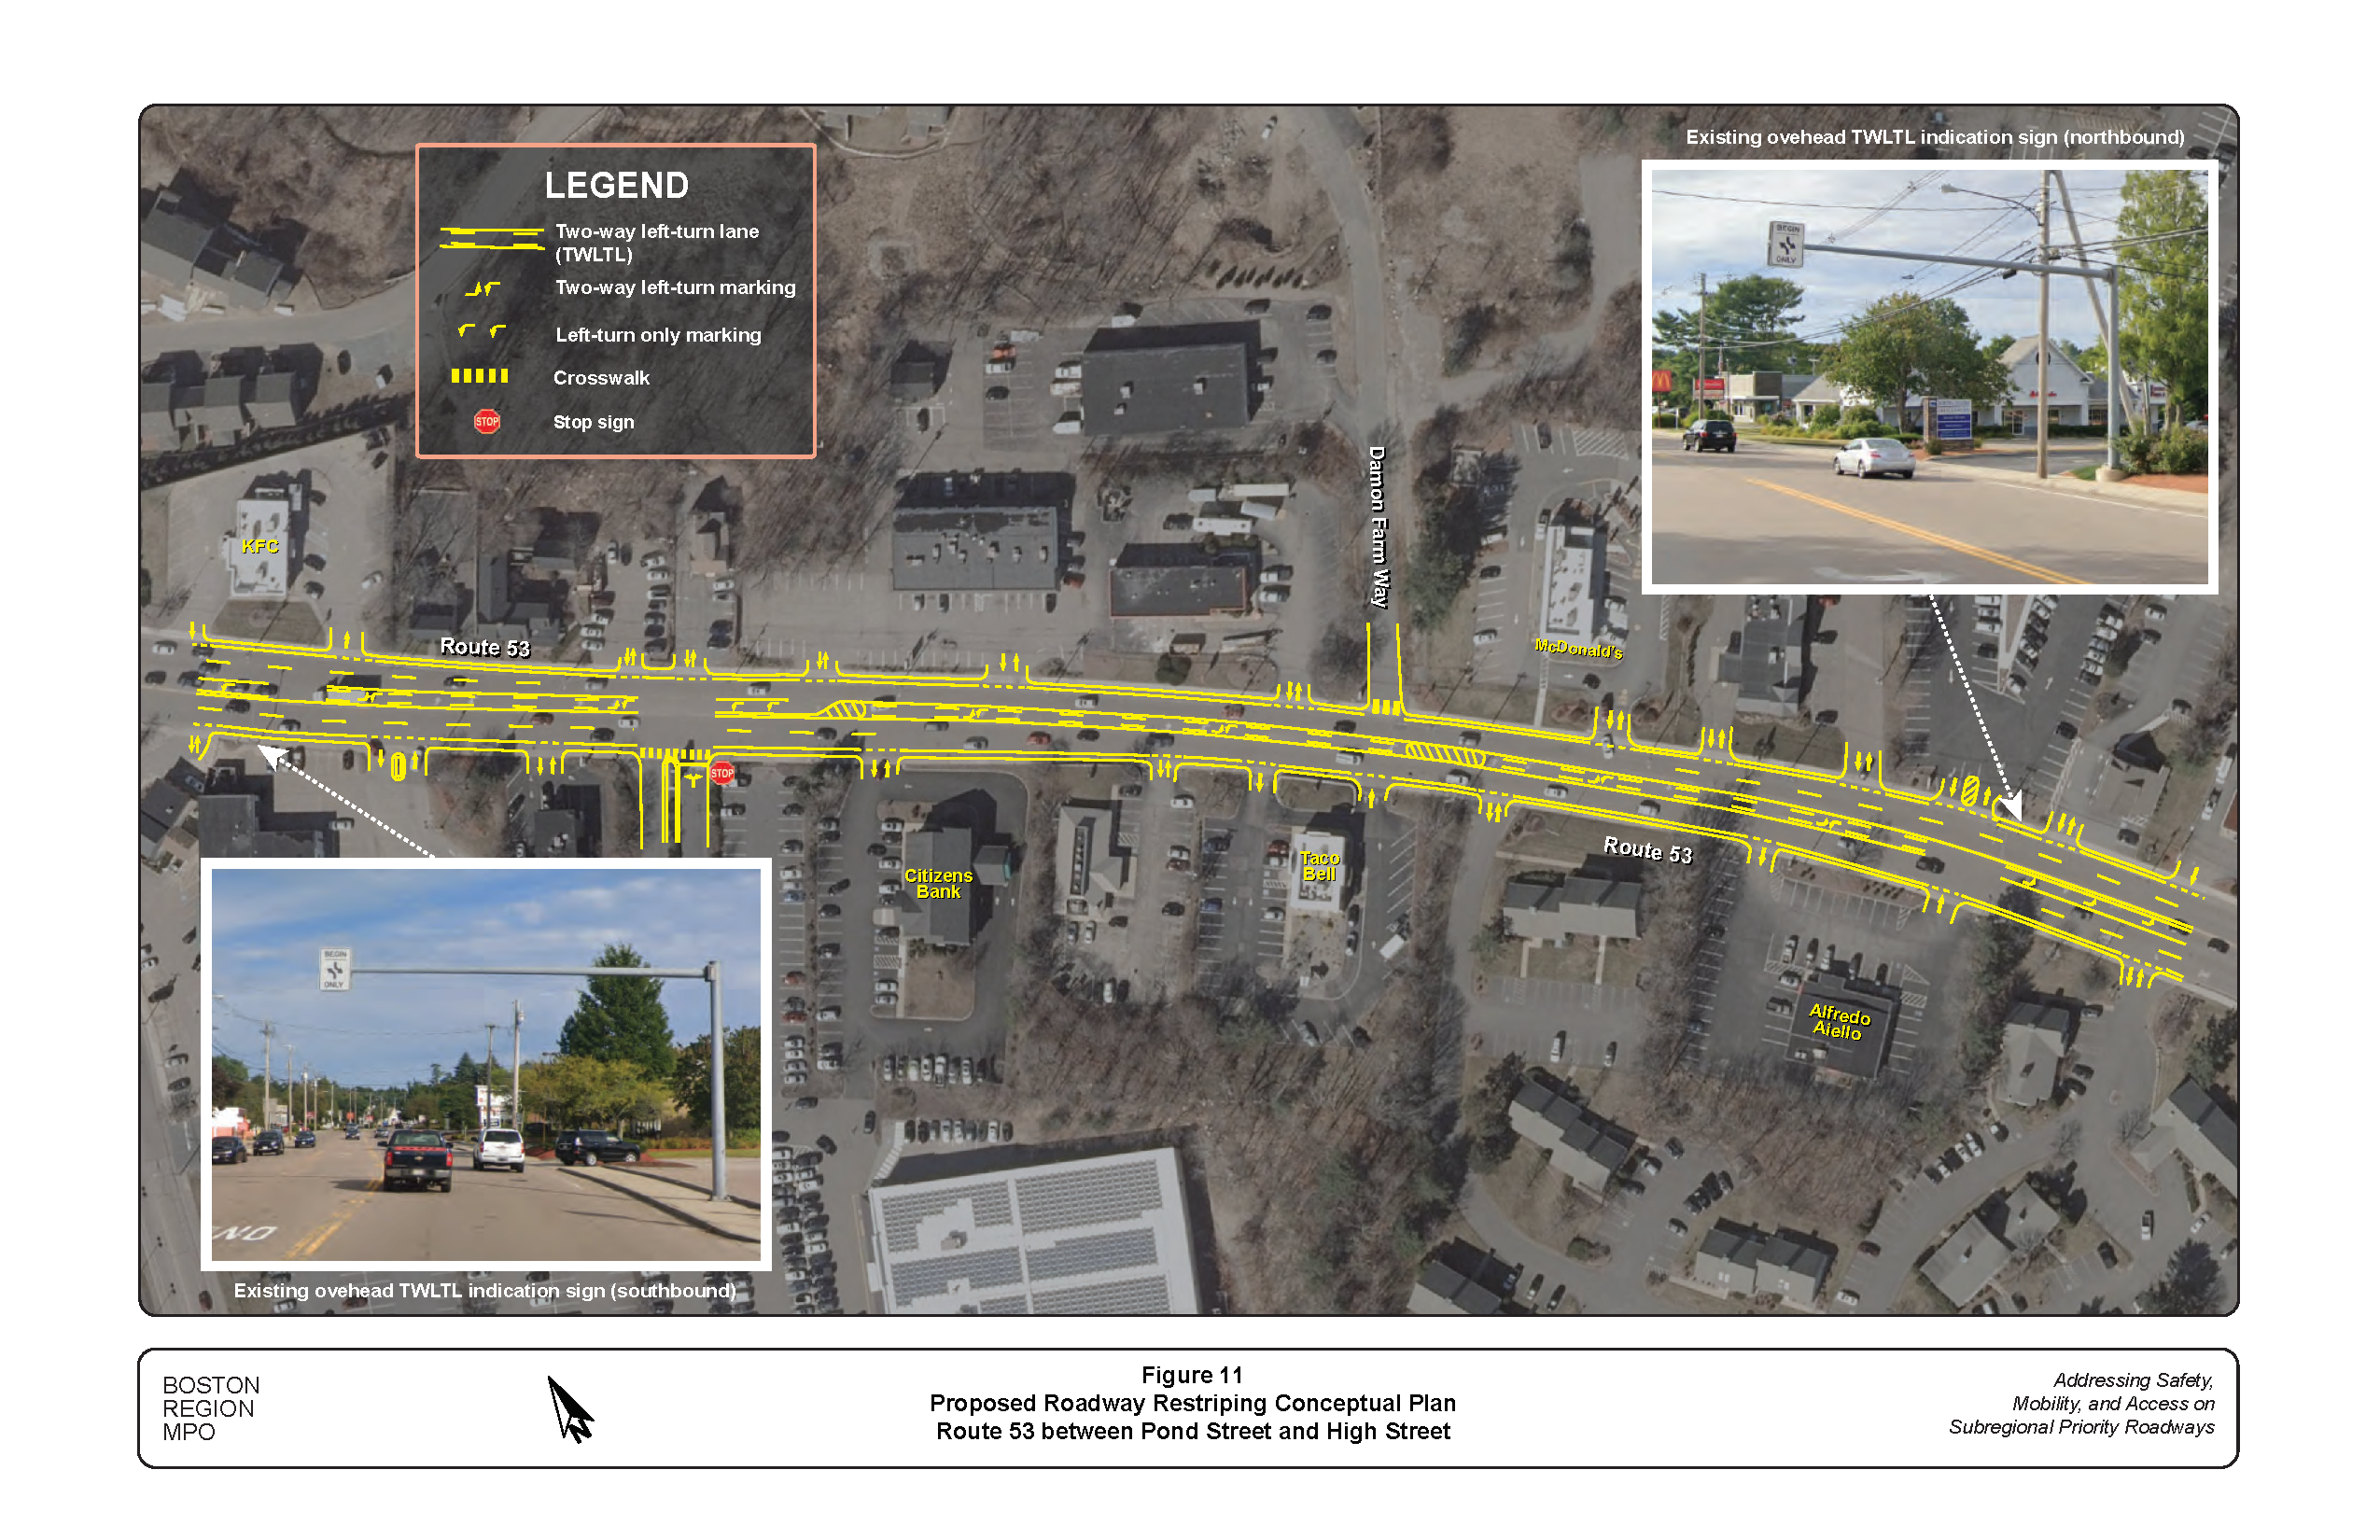
Figure 12
Proposed Long-Term Improvements Conceptual Plan:
Route 53 between Pond Street and High Street (Section 1)
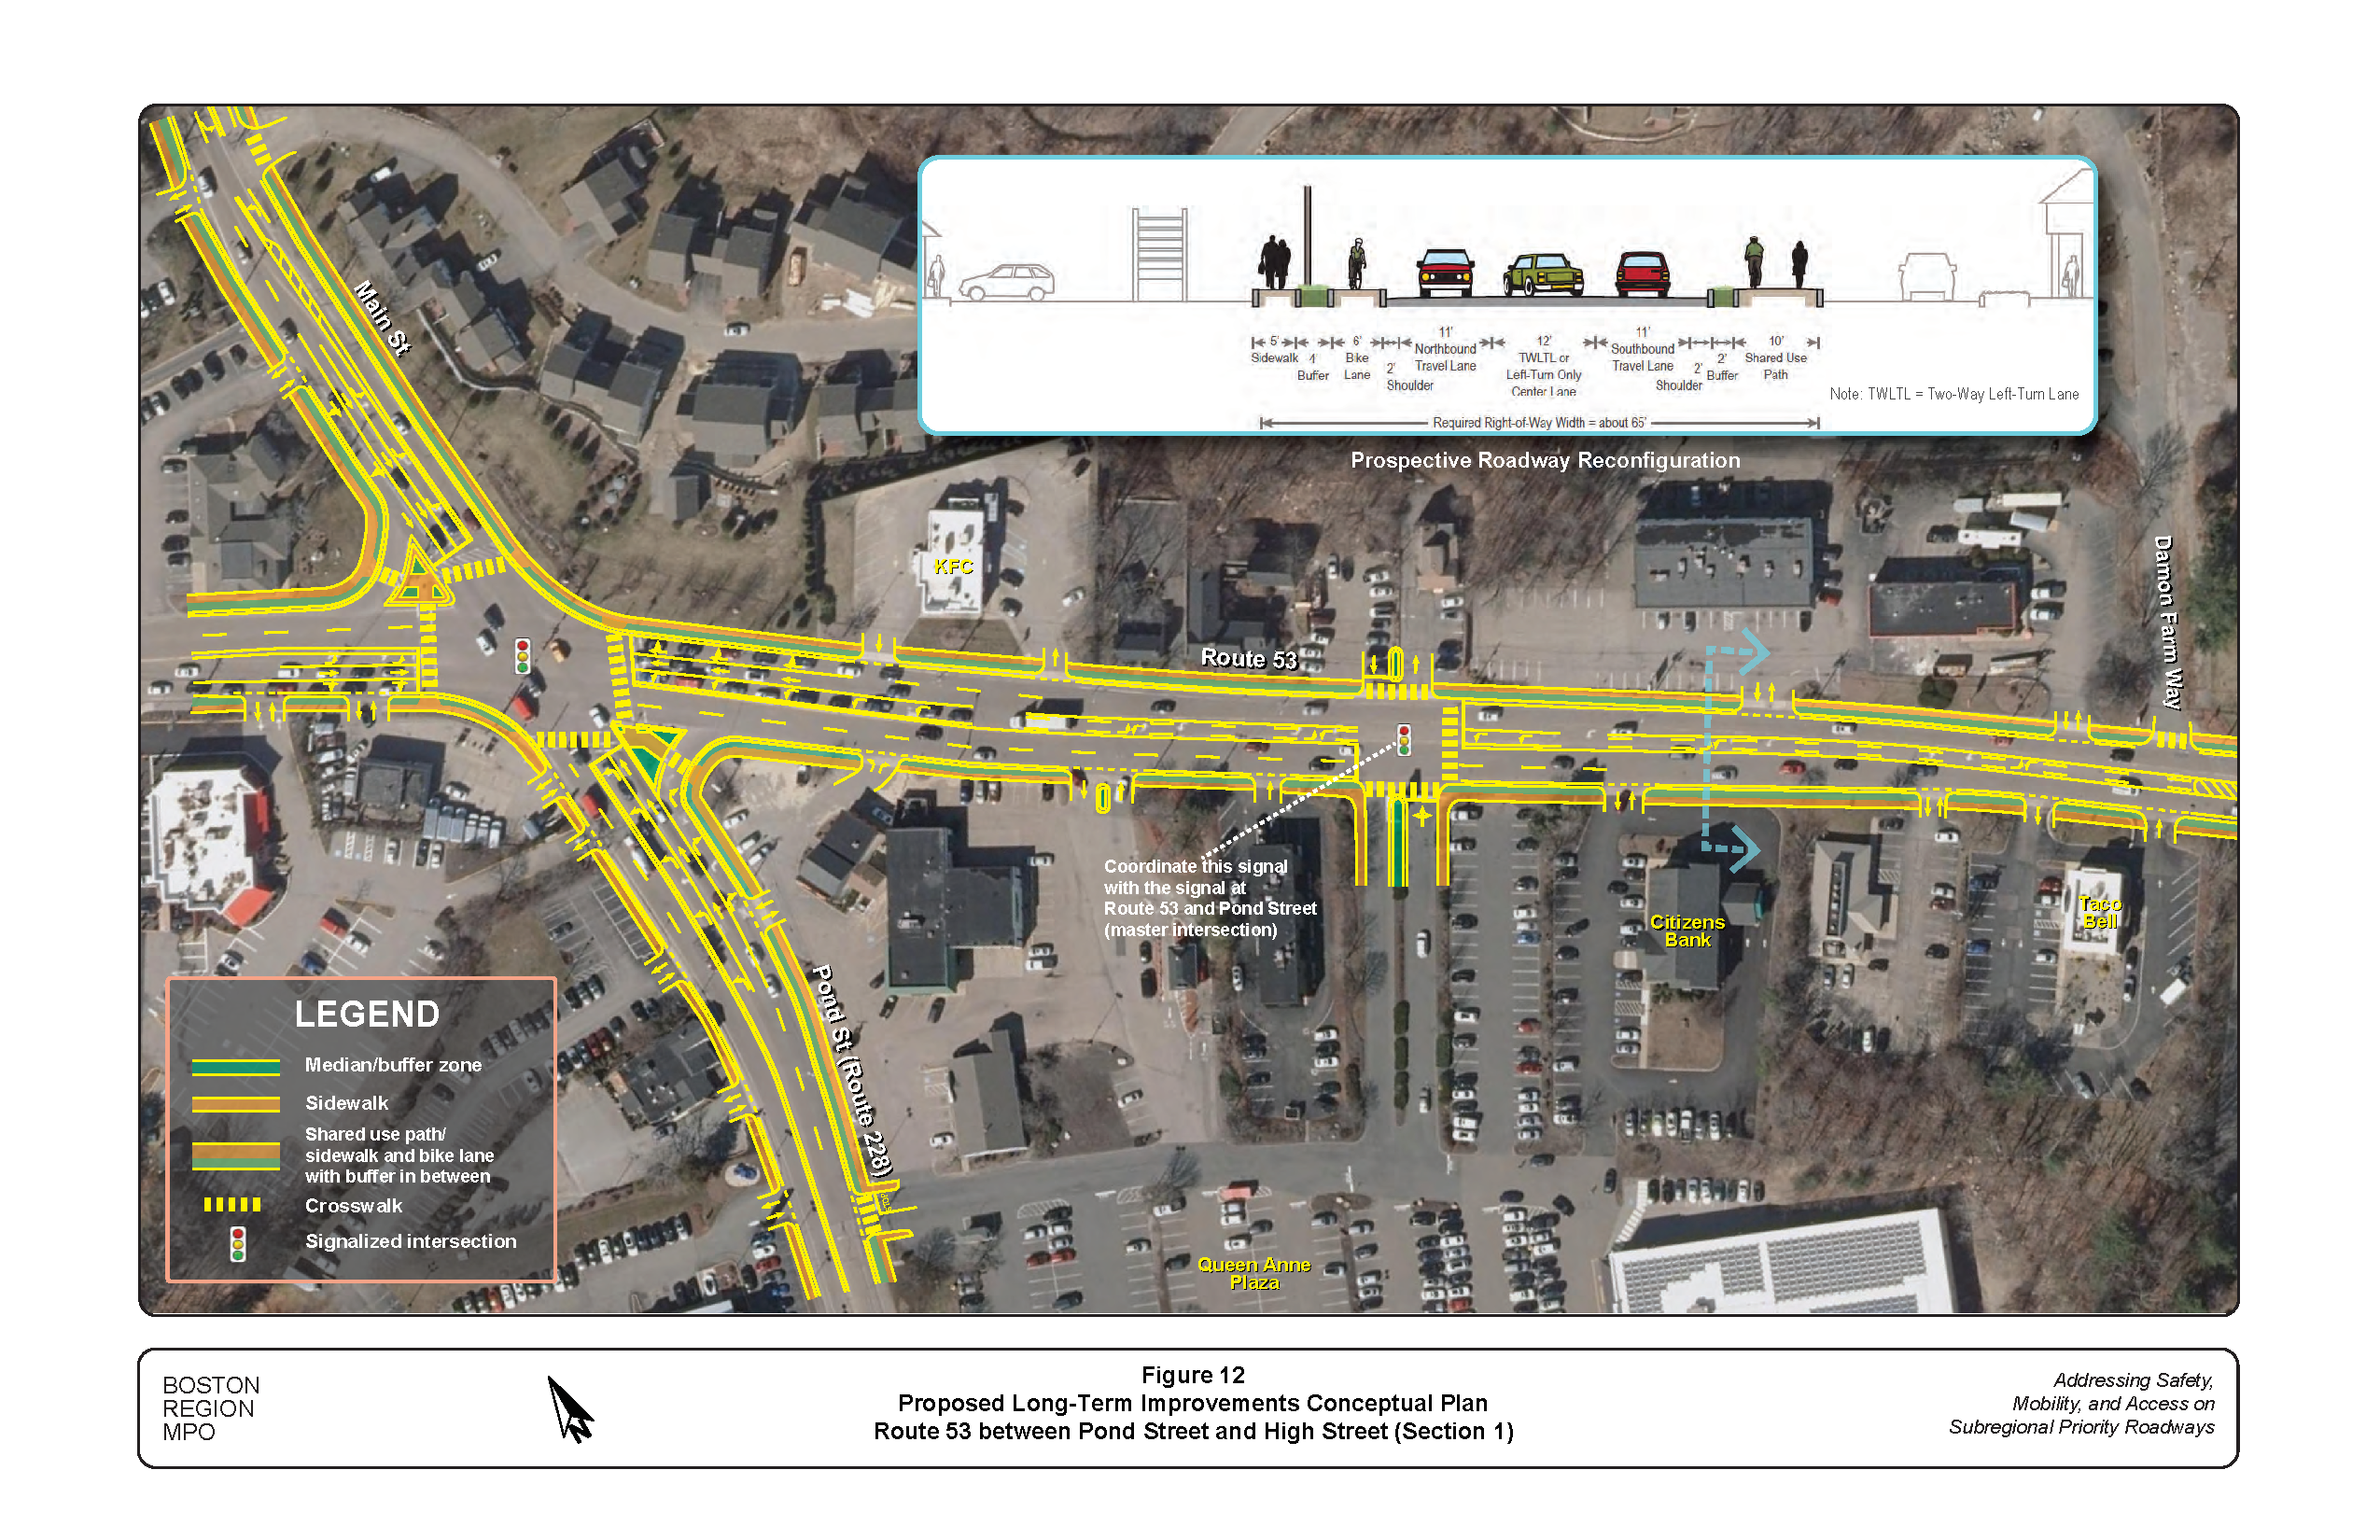
Figure 13
Proposed Long-Term Improvements Conceptual Plan:
Route 53 between Pond Street and High Street (Section 2)
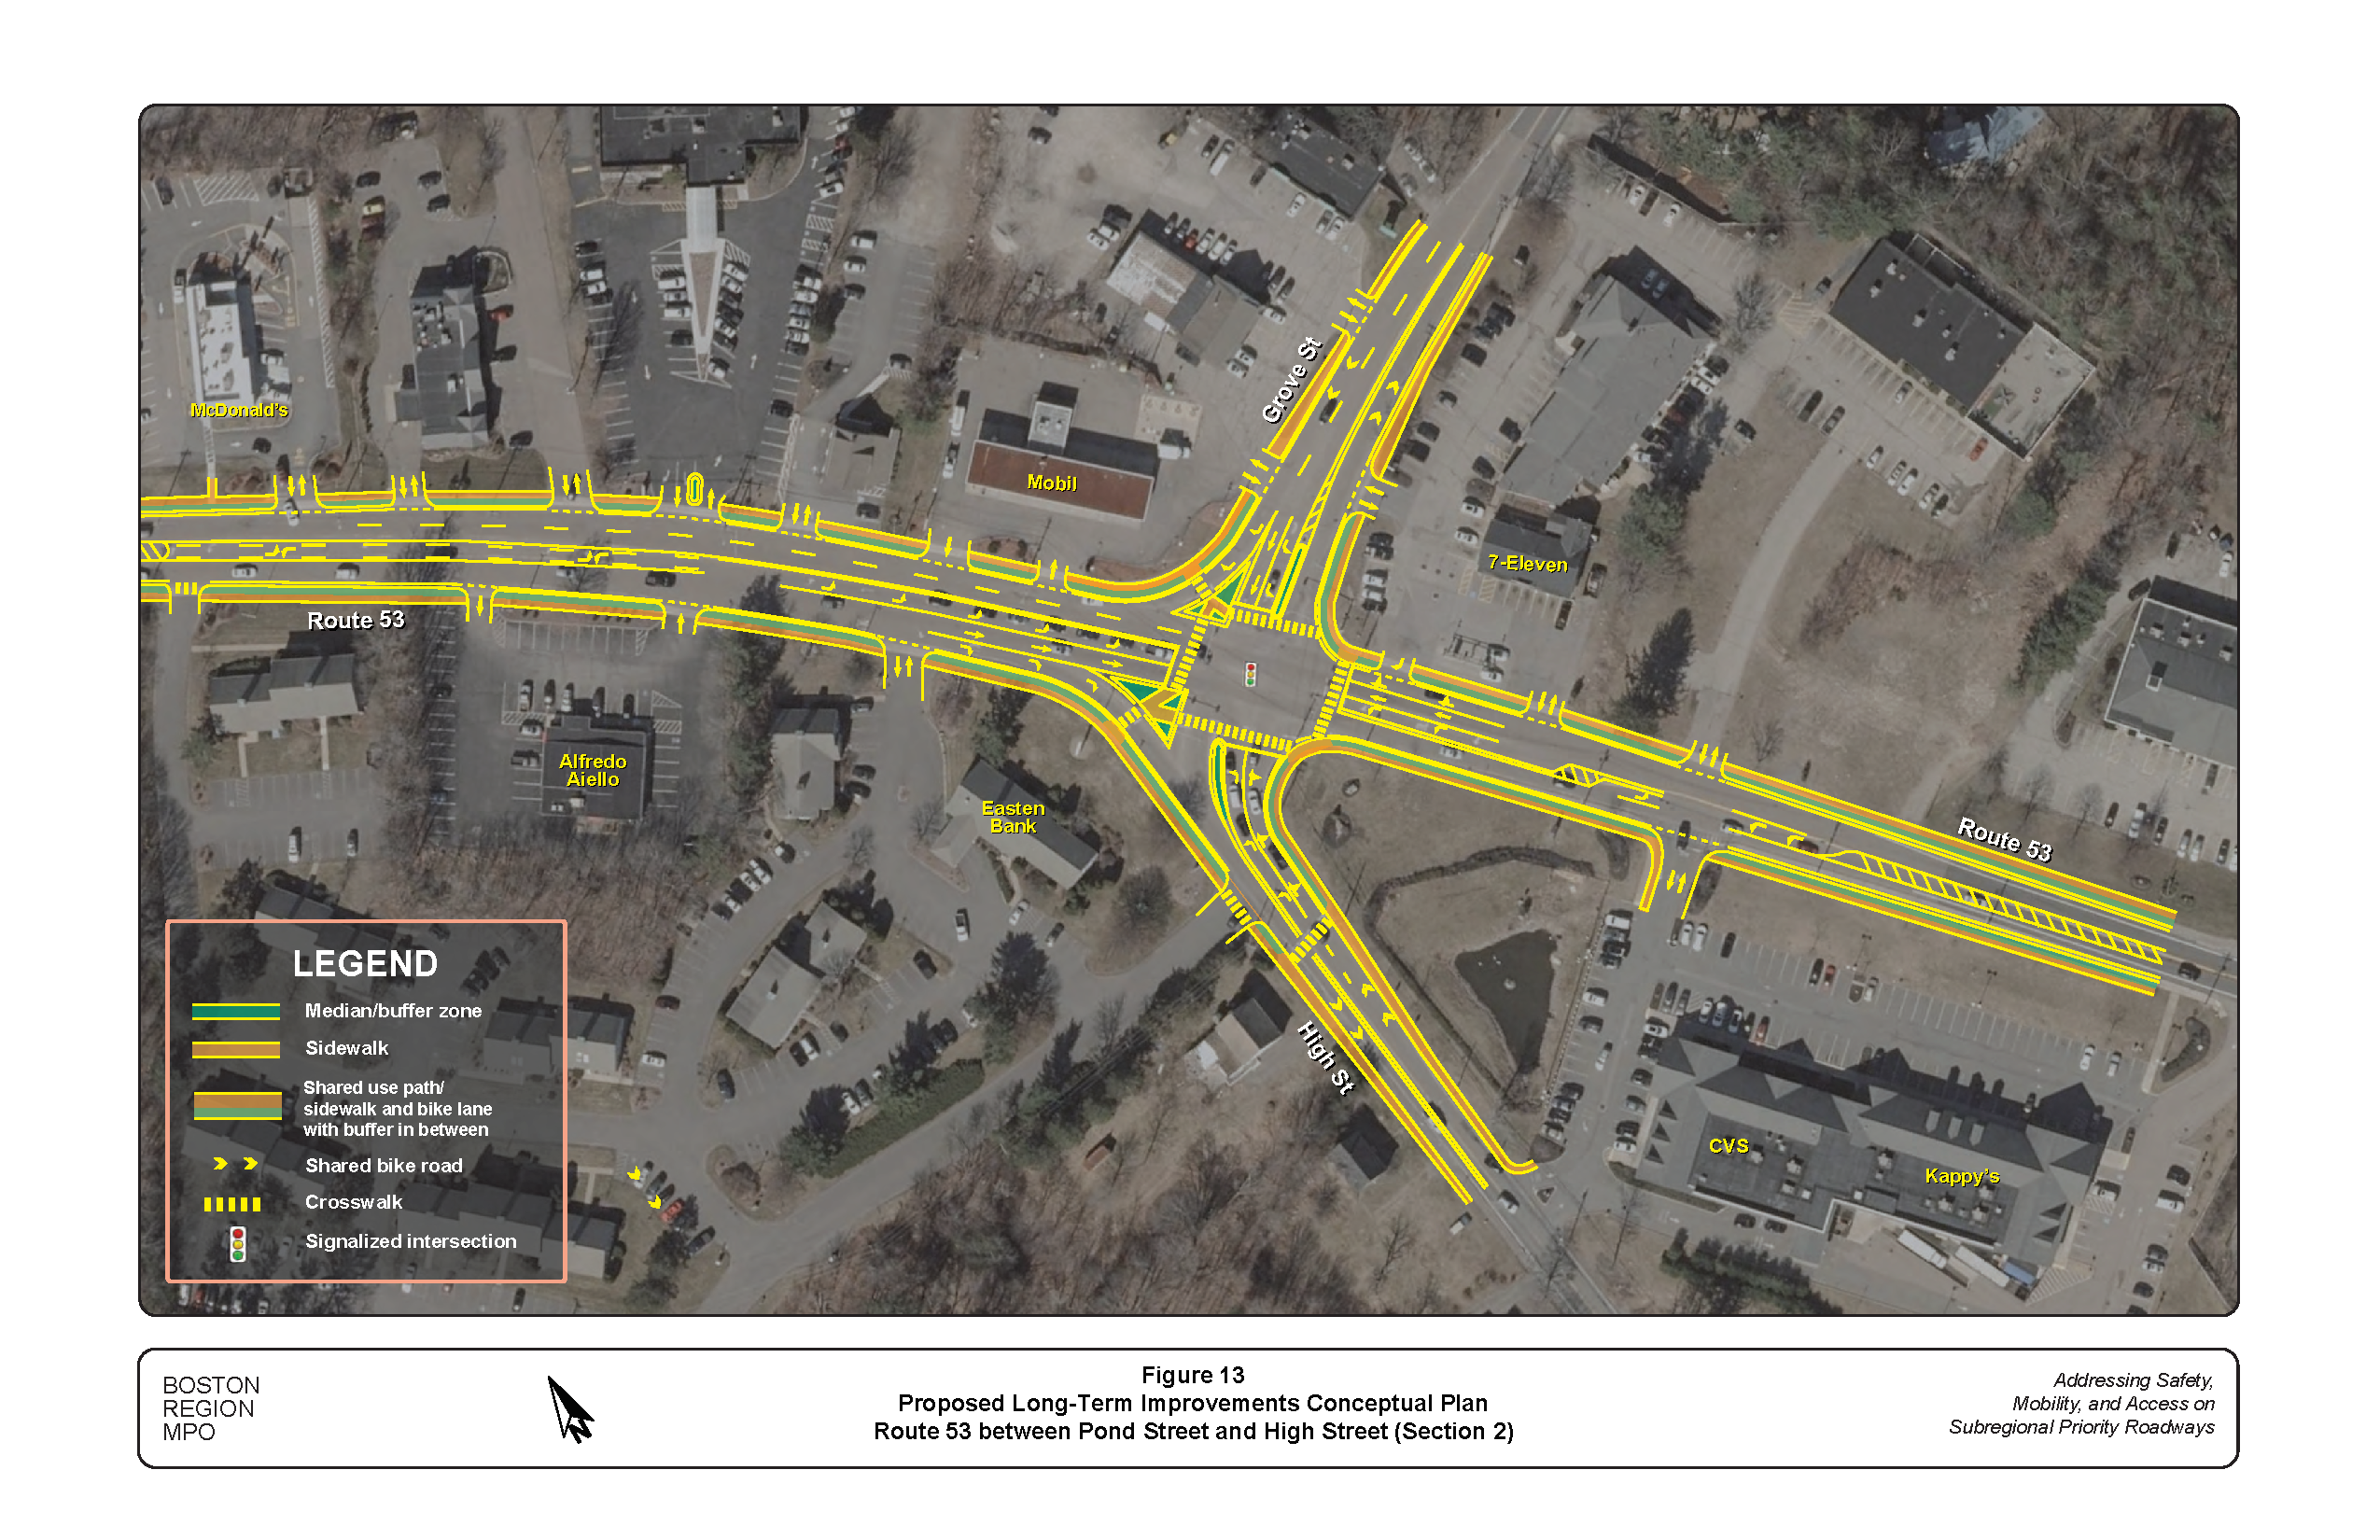
Figure 14
Proposed Long-Term Improvements Conceptual Plan:
Route 53 between High Street and Oak Street
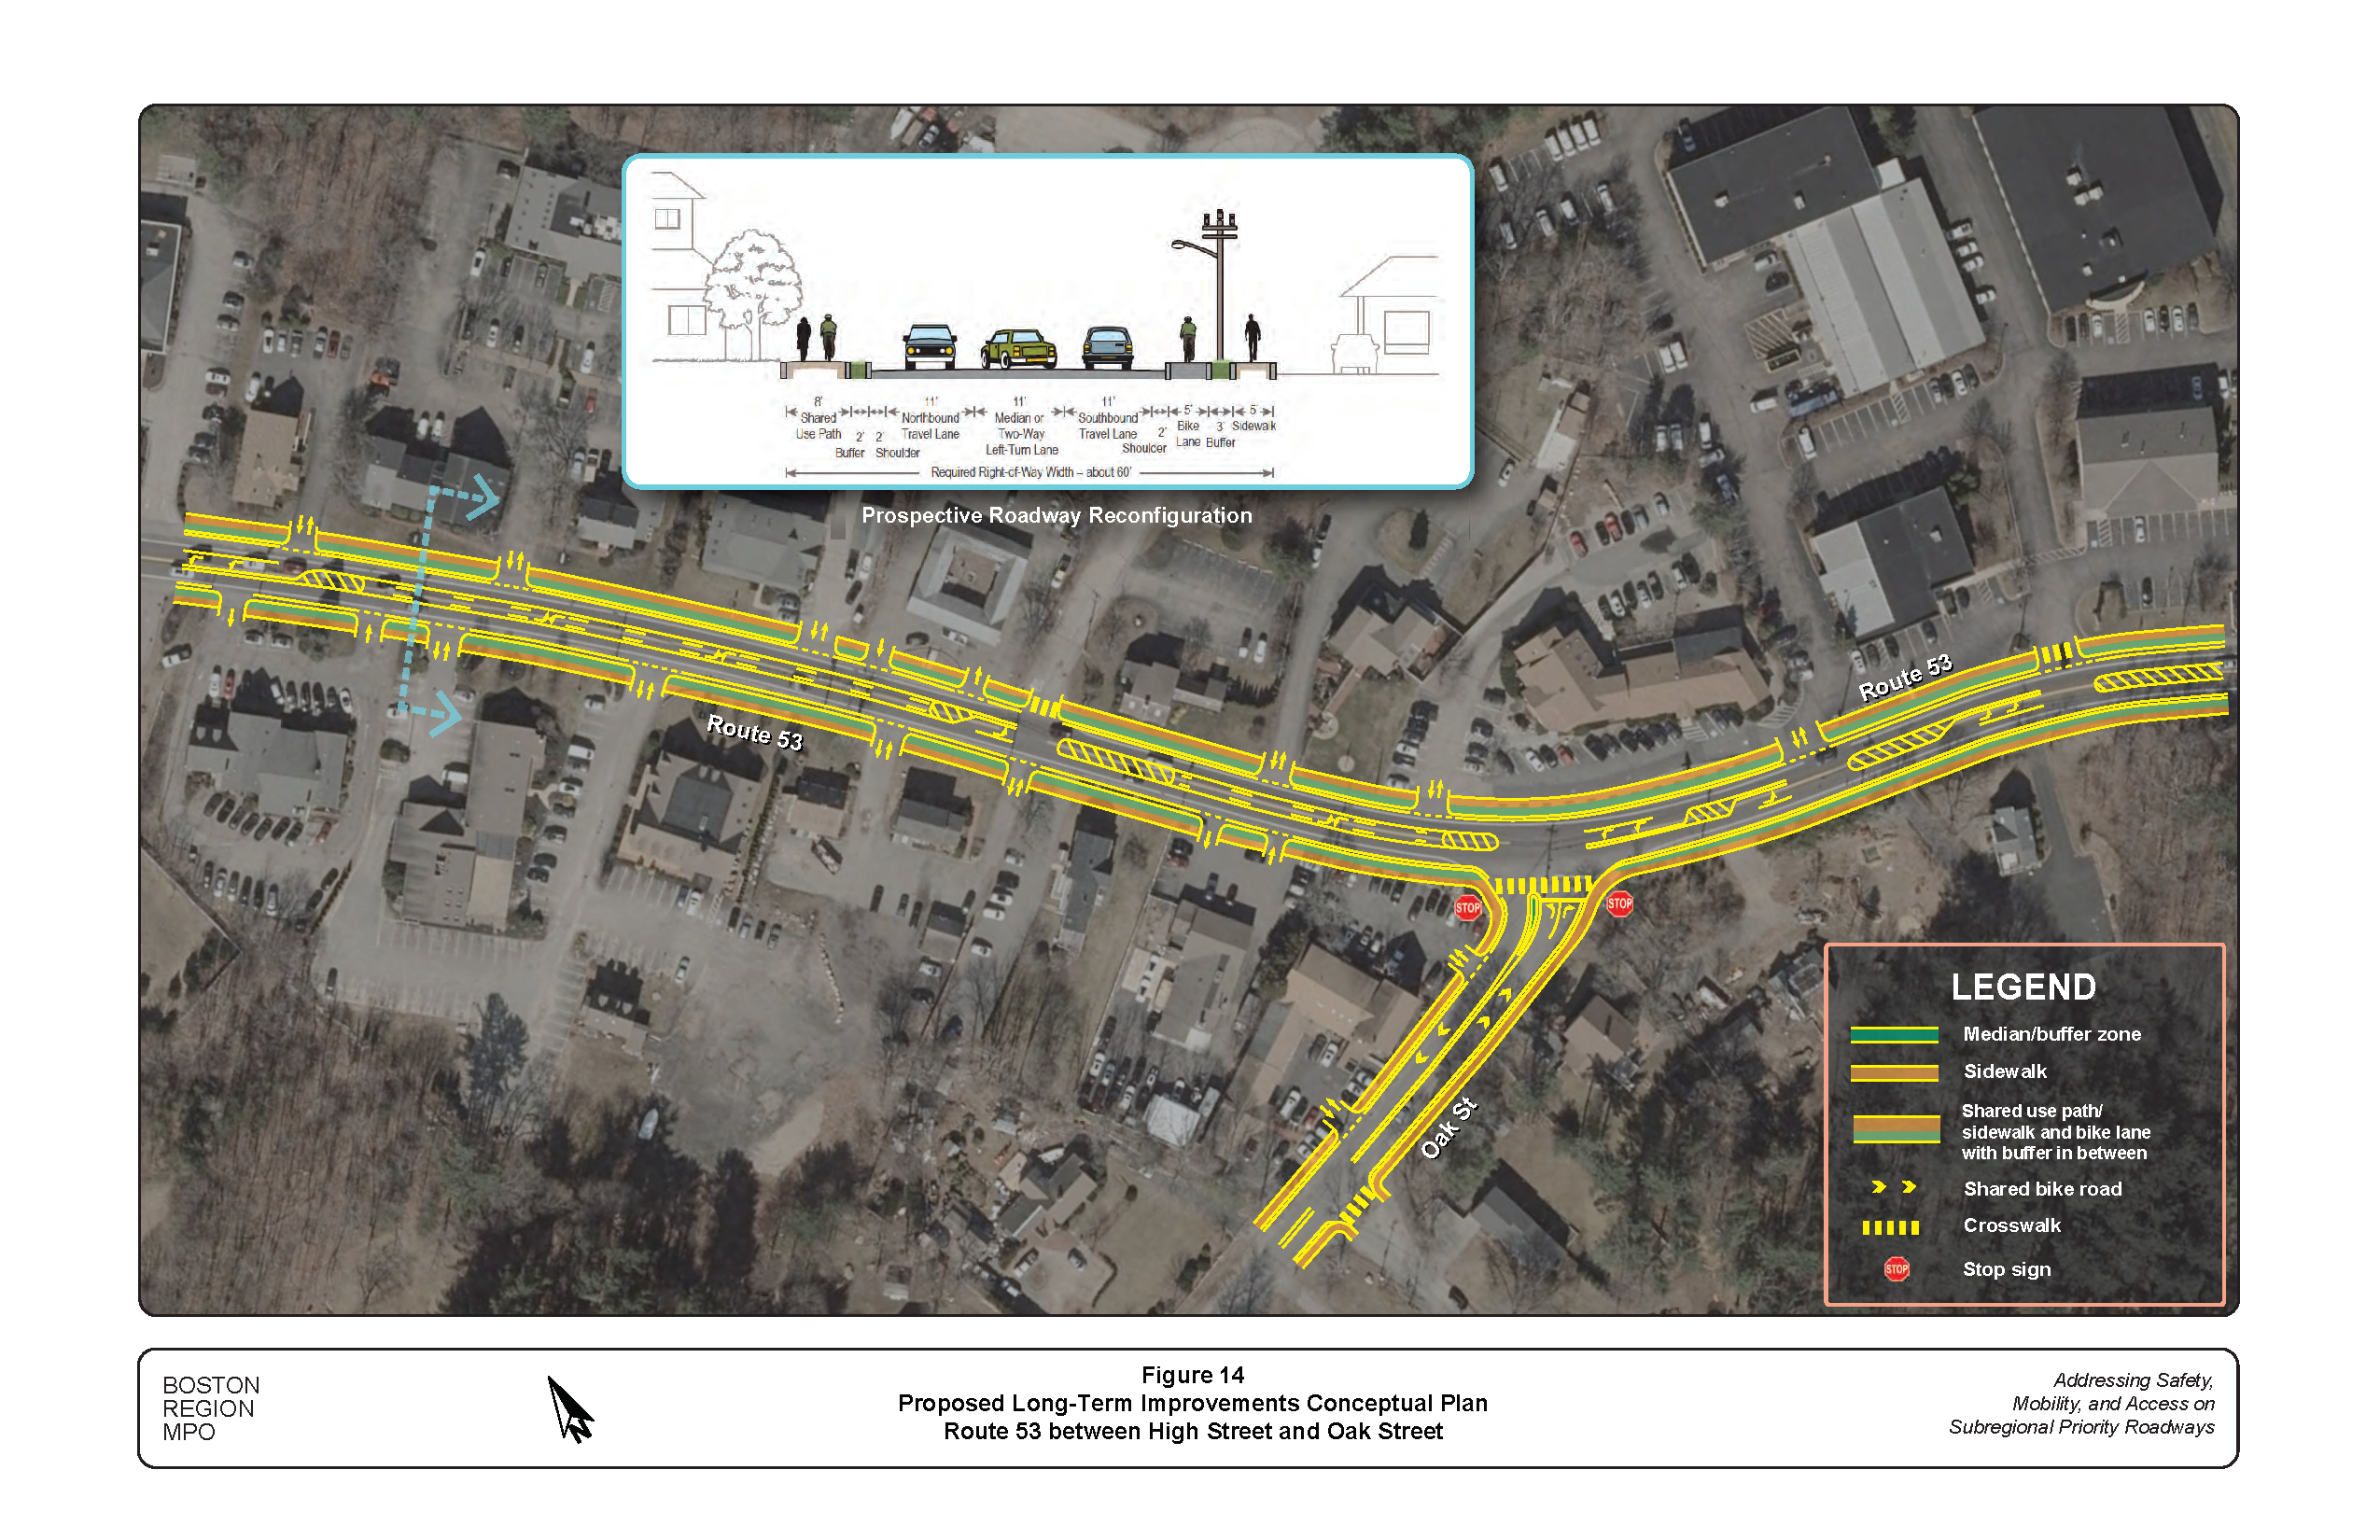
Figure 15
Proposed Short- and Long-Term Improvements Conceptual Plan:
Route 53 between Oak Street and Hall Drive
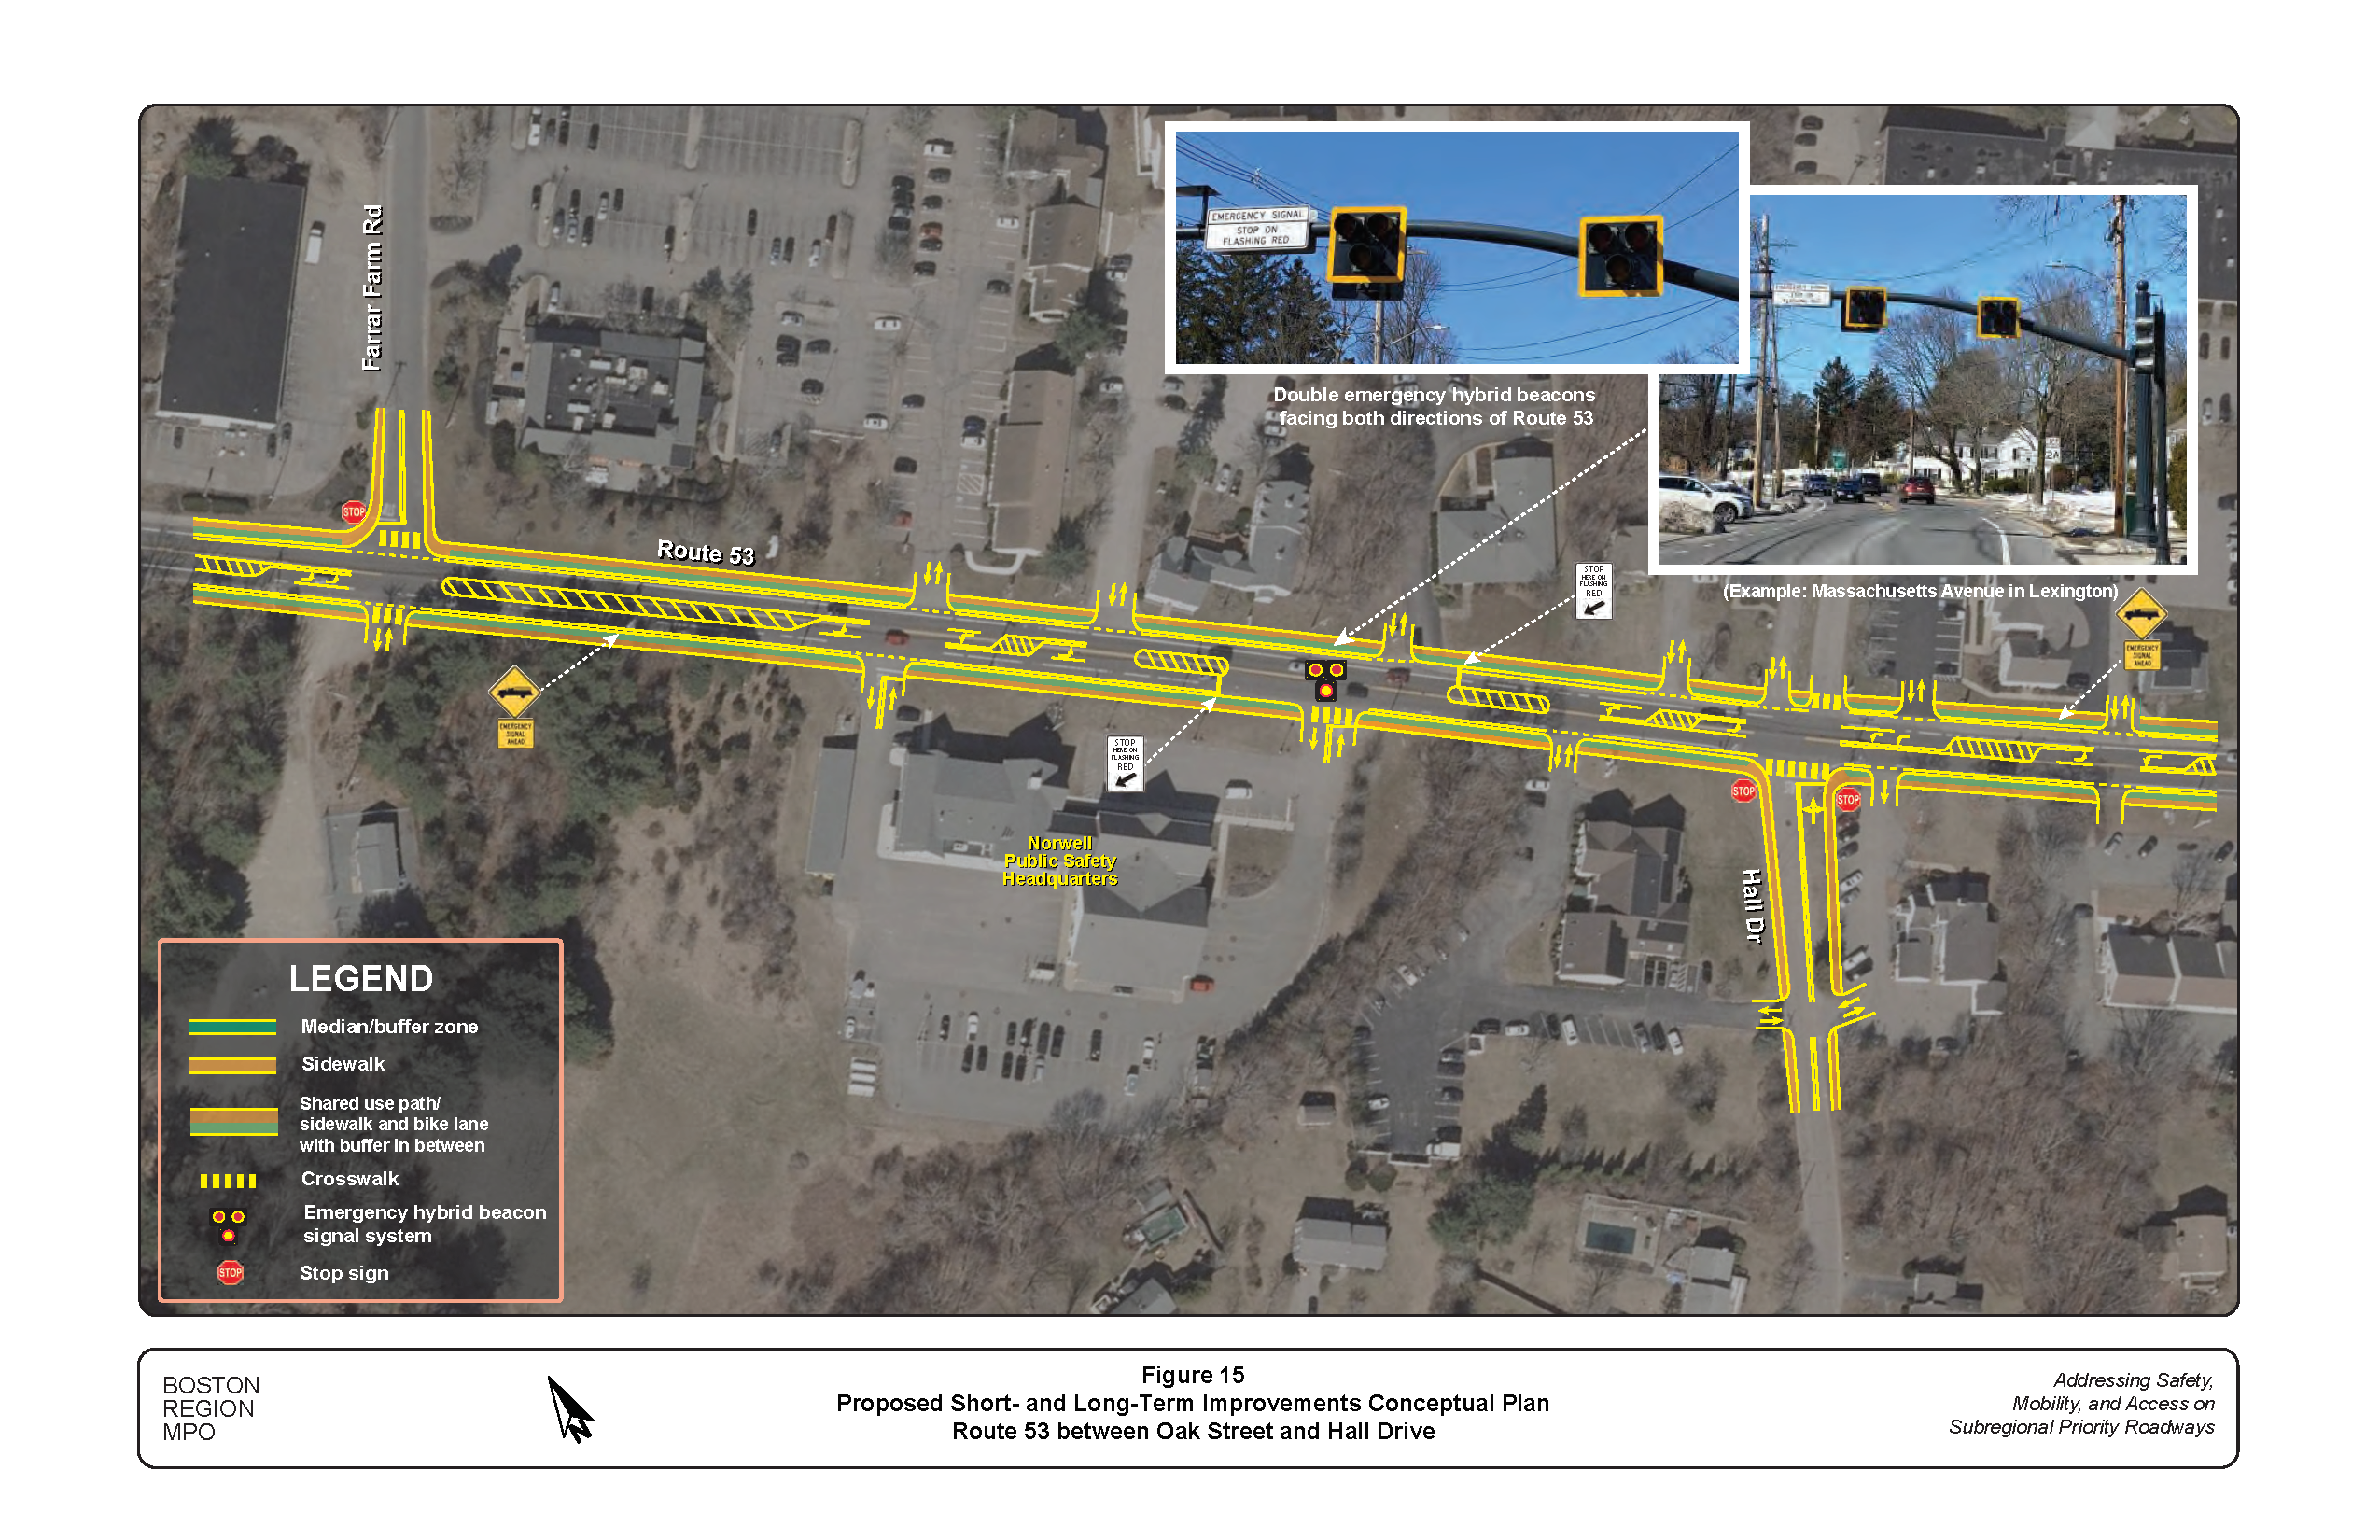
Figure 16
Proposed Long-Term Improvements Conceptual Plan:
Route 53 between Hall Drive and Jacobs Trail
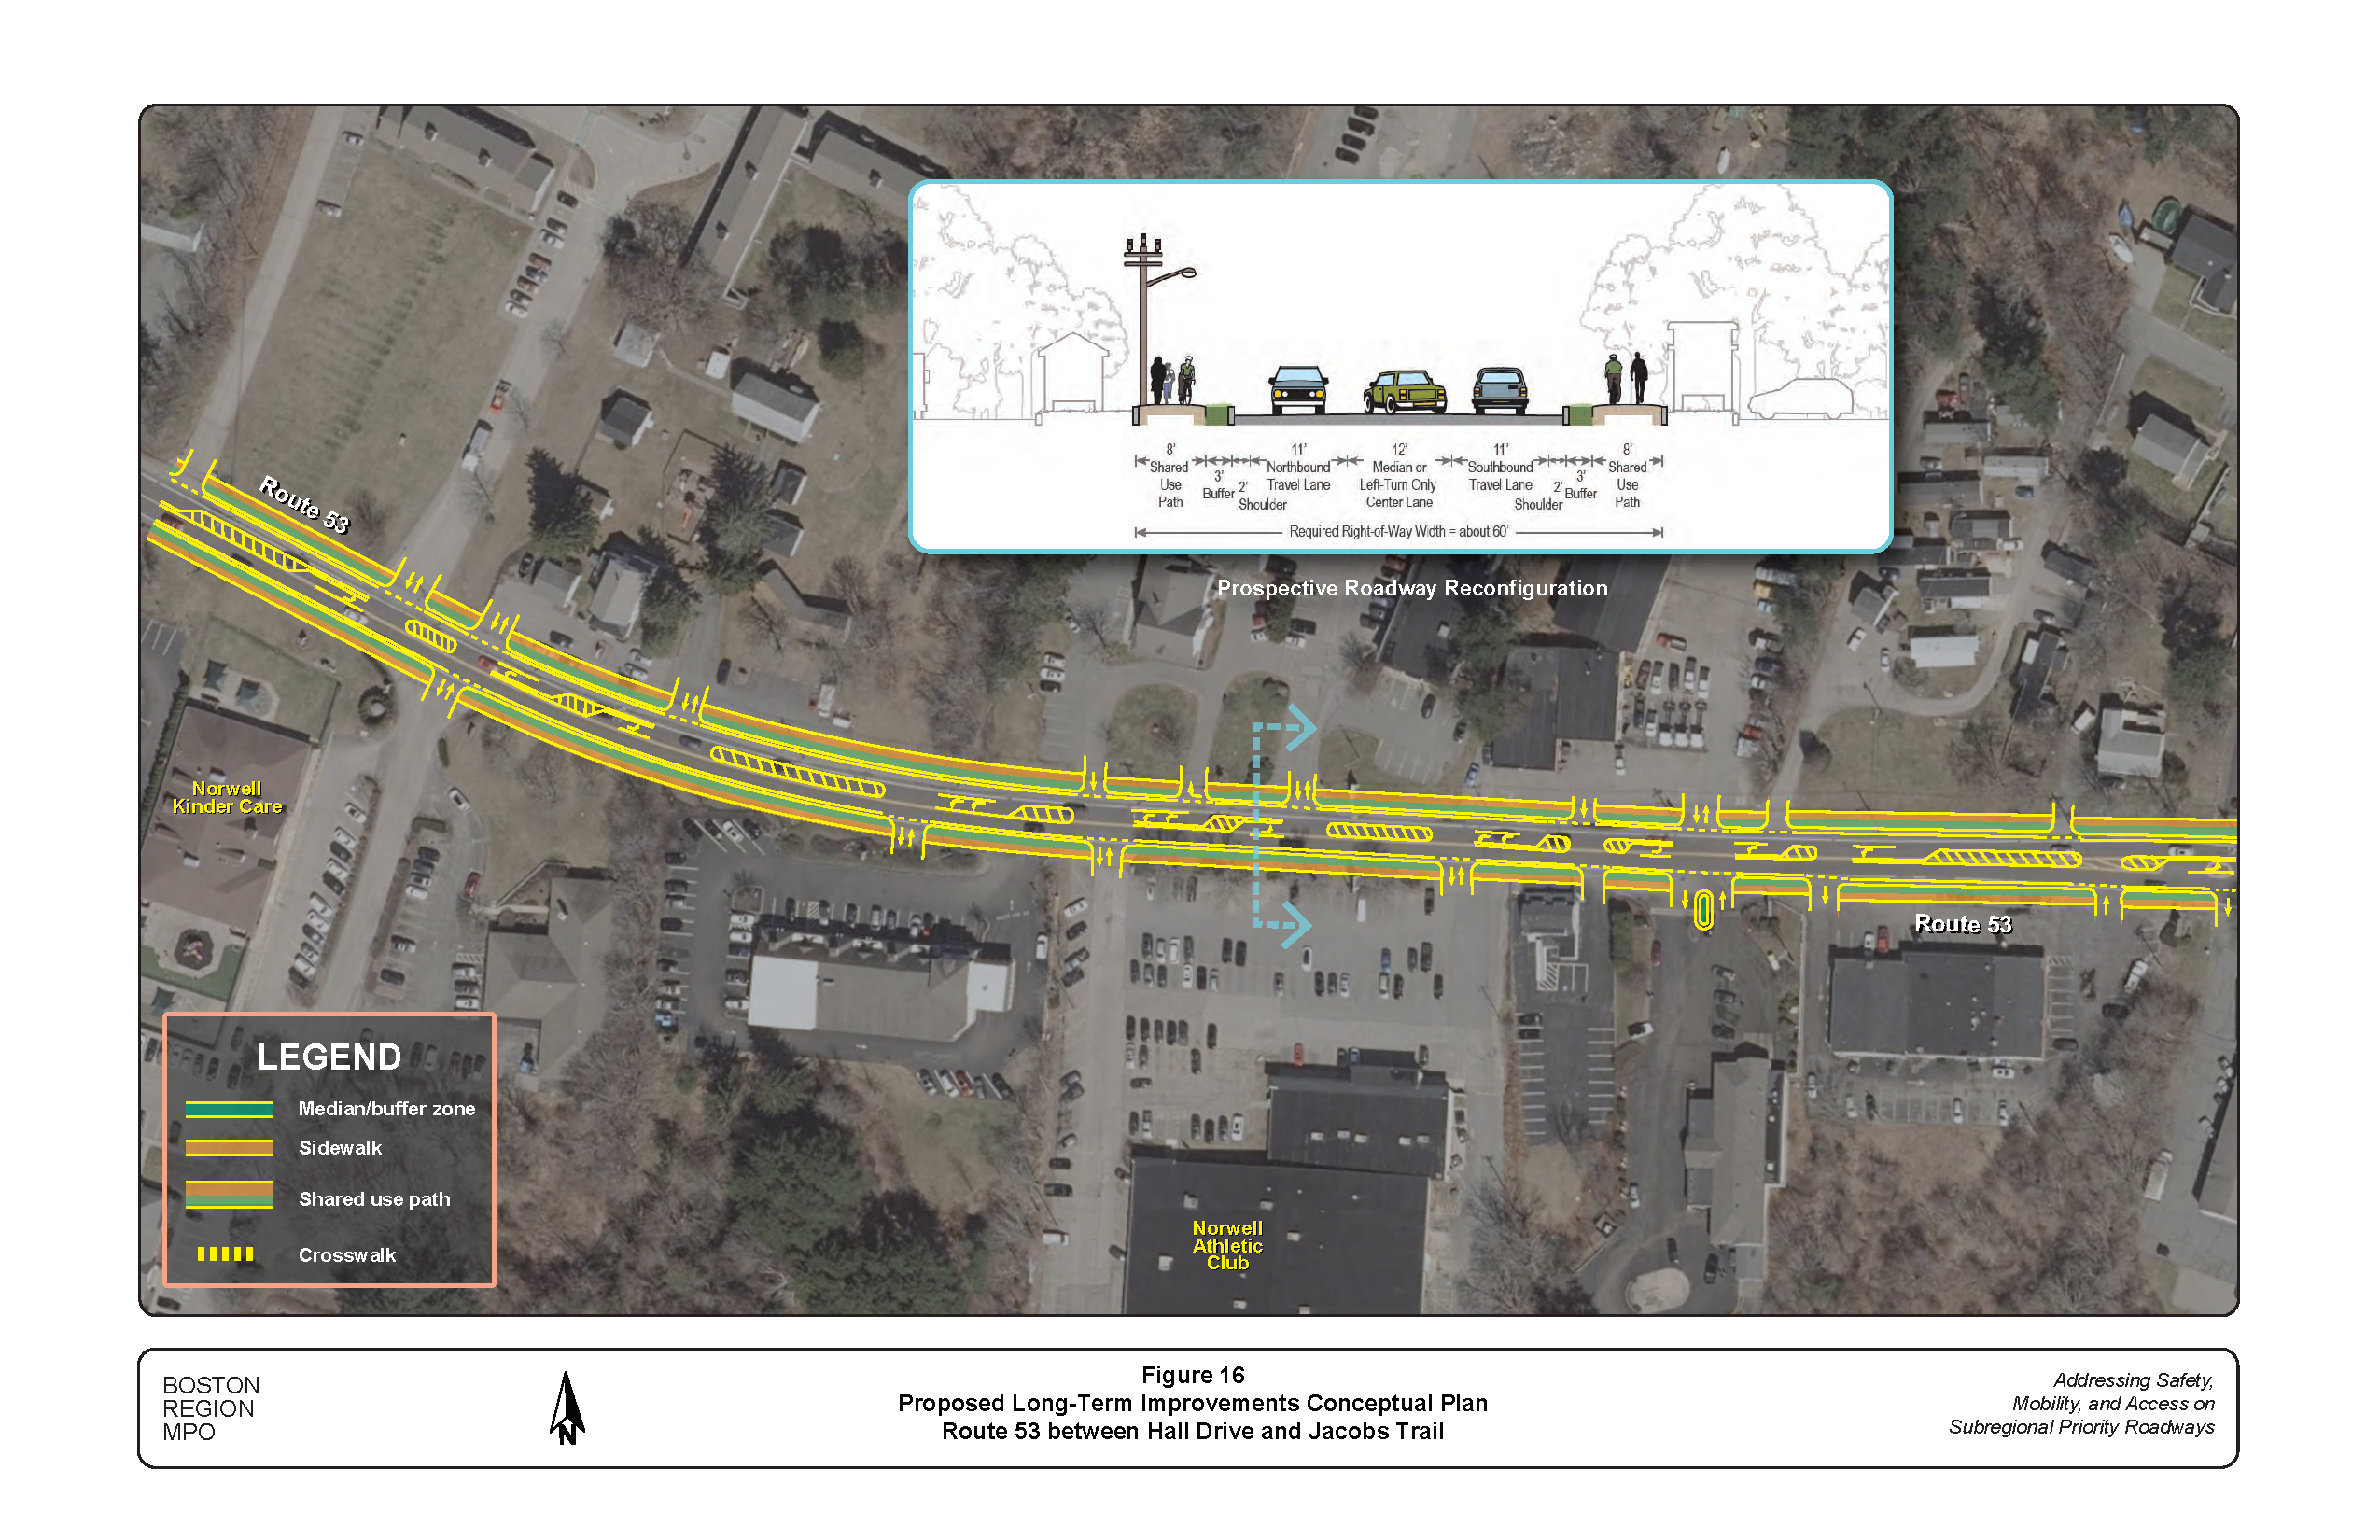
Figure 17
Proposed Long-Term Improvements Conceptual Plan:
Route 53 between Jacobs Trail and Assinippi Avenue
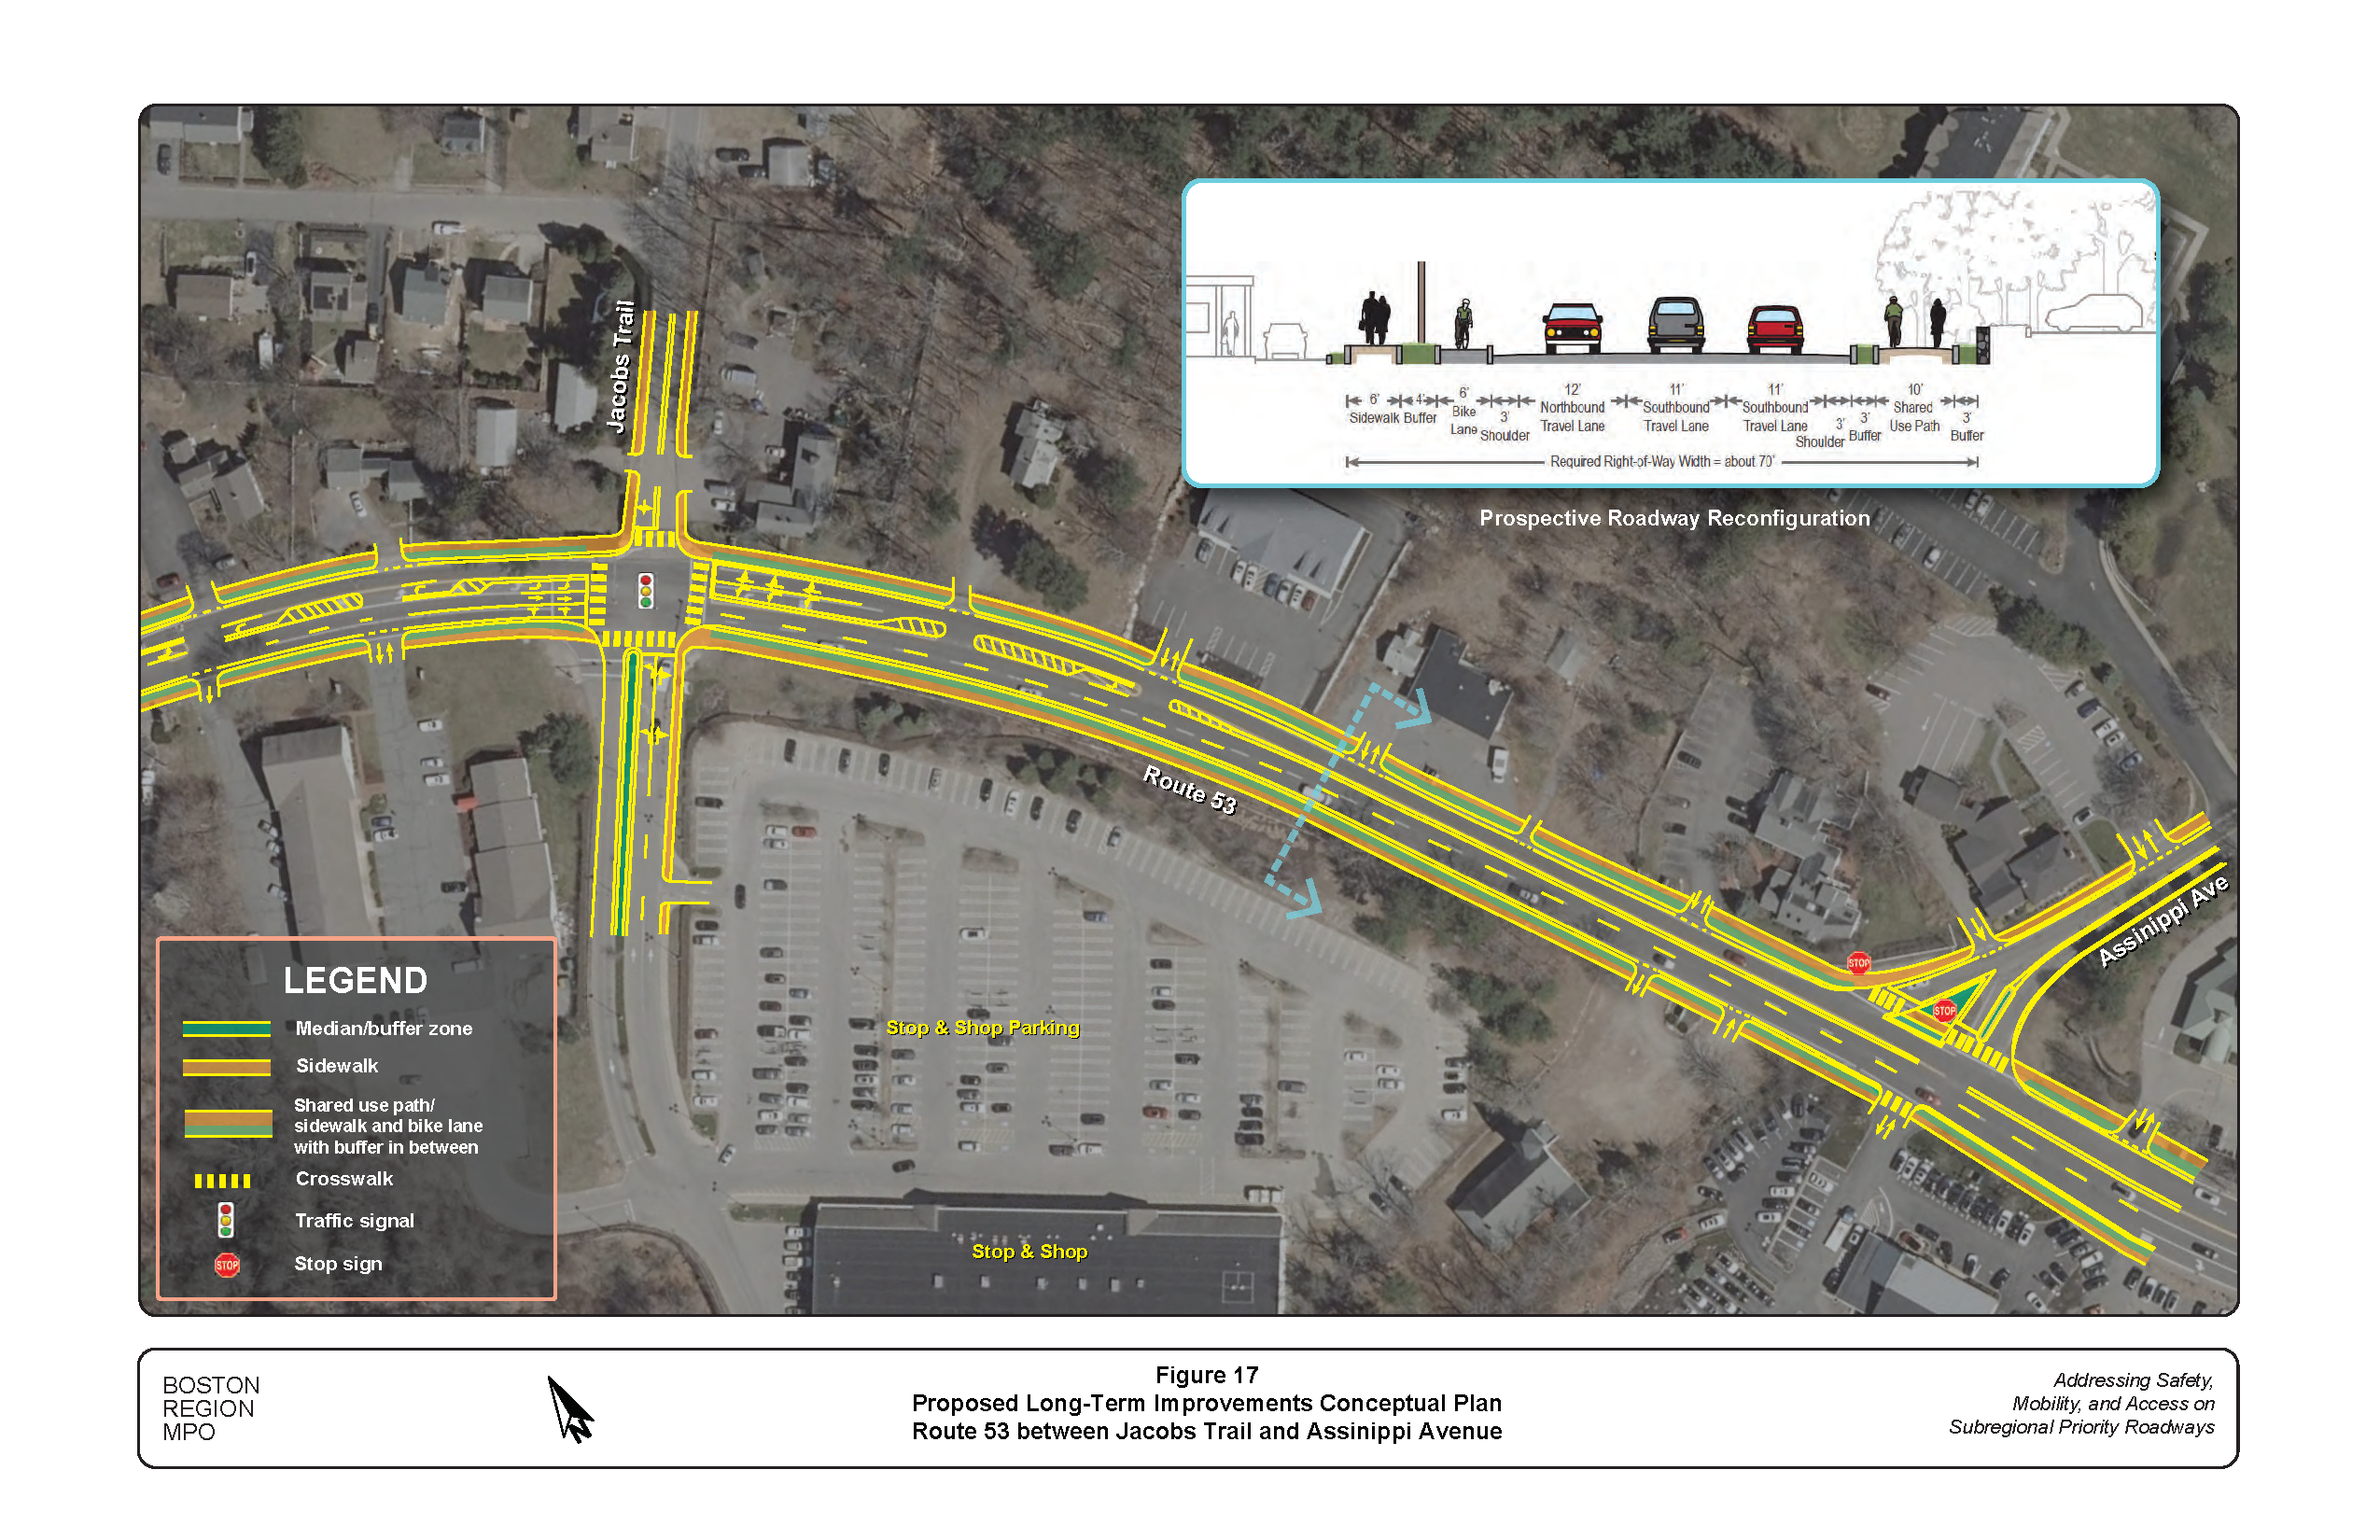
Figure 18
2030 Weekday AM/PM Peak Hour Intersection Capacity Analyses with Proposed Long-Term Improvements
1 Roadways prioritized for improvement through this needs assessment are addressed through another annual work program, Addressing Priority Corridors from the Long-Range Transportation Plan Needs Assessment.
2 The FFY 2020 UPWP was endorsed by the MPO on June 18, 2019, and was approved by the MPO’s federal partners and took effect on October 1, 2019.
3 Details of the criteria and rating system may be found in the Central Transportation Planning Staff’s technical memorandum, “Selection of FFY 2020 Subregional Priority Roadway Study Location,” dated November 7, 2019.
4 The Route 53 section between Pond Street and High Street has three lanes, two travel lanes and a two-way left-turn lane.
5 Governor Baker's COVID-19 Order #5, which prohibited gatherings of more than 25 people, was issued on March 15, 2020.
6 Since April 2020, MassDOT continually monitored the impacts of COVID-19 on the state’s transportation network, including roadways and transit services, and published weekly traffic volumes at permanent count stations in the state, with comparison of the volumes in the same period in 2019, on MassDOT Mobility Dashboard (https://mobility-massdot.hub.arcgis.com). The eight percent increase was estimated from the counts at the permanent stations near the study area in District 5 in the period from the week of September 21, 2020, to the week of October 19, 2020.
7 The historical data include the following resources: 1) available traffic counts in and around the study area from MassDOT Transportation Data Management System (Massachusetts government webpage https://www.mass.gov/traffic-volume-and-classification); 2) traffic impact study conducted in 2019 for the area near Queen Anne’s Corner; 3) traffic studies for the proposed developments in the corridor since 2000 provided by the Norwell Planning Department.
8 Technical memorandum, Community Transportation Technical Assistance Program: Norwell Traffic Impact Study, Seth Asante, Mark Abbott, Chaopeng Hu, Central Transportation Planning Staff, February 7, 2020.
9 Heavy vehicles include single-unit trucks (Federal Highway Administration [FHWA] Vehicle Classes 5 to 7), articulated trucks (single- and multi-trailer trucks, FHWA Vehicle Classes 8 to 13), and buses (FHWA Vehicle Class 4). Vehicles on a single frame with two axles and six tires (dual rear wheels) (FHWA Vehicle Class 5) include trucks and recreational vehicles. Passenger cars of any type and all other two-axle four-tire vehicles (FHWA Vehicle Class 3), such as pickups, vans, mini-buses, ambulances, motor homes, and campers (even a passenger car pulling a trailer), are not considered heavy vehicles.
10 Synchro Version 10.3 was used for the analyses. This software is developed and distributed by Trafficware Ltd. It can perform capacity analyses and traffic simulation (when combined with SimTraffic) for an individual intersection or a series of intersections in a roadway network.
11 Highway Capacity Manual 2010, Transportation Research Board of the National Academies, Washington DC.
12 Control delay quantifies the increase in travel time that a vehicle experiences due to a traffic signal or other type of control. It also provides a surrogate measure for driver discomfort and fuel consumption.
13 To establish or modify speed controls, MassDOT requires the collection of speed data by radar gun or laser gun at critical locations at intervals not to exceed 0.25 miles, in addition to vehicle trial runs in the study area.
14 Synchro tests indicate that if the travel lanes are rearranged to two lanes in the northbound and one in the southbound, the intersection of Route 53 at Jacobs Trail and Stop & Shop driveway would encounter extensive traffic queues during the PM peak hour in the southbound where many businesses are located.
15 In this study, the term “pedestrian crashes” refers to crashes that involve at least one vehicle and one pedestrian; “bicycle crashes” refers to crashes that involve at least one vehicle and one bicycle. No crashes between at least one bicycle and one pedestrian were identified in the available data.
16 The main purpose of a TWLTL is to provide left-turn access to the adjacent developments. A general rule for driving on TWLTLs is not to travel continuously for more than 200 feet.
17 The section in this collision diagram is about 1,600 feet long, including the intersection of Route 53 at Oak Street and two driveways from the adjacent developments further south of Oak Street.
18 The storage length of a turning lane refers to the space where vehicles queue to wait for turning. The storage lane extension is based on the estimated queue lengths from Synchro analyses of the intersection operations under the projected 2030 AM and PM peak-hour traffic volumes and the consideration of available right-of-way. The Synchro reports of the analyses are included in Appendix M.
19 This improvement will reduce the footprint of the intersection somewhat and improve the views of drivers to each other and to people walking at the intersection. However, the relocations should also take the necessary turning radii for trucks at this skewed intersection.
20 The intersection carries a significant number of patrons to and from the plaza. It also is a suitable location to provide a protected pedestrian crossing on Route 53. The installation would increase safety and mobility for all users of this intersection, especially if a joined development of the parcels on the north side of the intersection is to be established.
21 Synchro tests of the proposed coordination indicate that it would not impede the traffic operations at the Route 53/Route 228 intersection, which would maintain the same LOS and average delay (it would even improve slightly in the PM peak hour) as the uncoordinated situation. Synchro analyses also indicate that this new intersection would operate at desirable LOS in both AM and PM peak hours (see Appendix M).
22 The existing pedestrian signals operate under a combined mode: the signal for crossing Route 53 operates under exclusive signal phases and the signals for crossing High Street and Grove Street (with crosswalks parallel to Route 53) operate concurrently with Route 53 through and right-turn traffic.
23 This proposed improvement would require a further engineering study with speed data collected by using radar gun, laser gun, or LiDAR technology.
24 Depending on the right-of-availability, other roadway reconfiguration alternatives (see Section 3.6) may have to be considered at the design stage.
25 The corridor travel spot speed data in the area indicate that the travel speeds in the southbound approaching the Norwell Public Safety Headquarters is lower than other areas in this section.
26 Originally staff proposed the emergency signal system as a long-term improvement. The study advisory members from Norwell considered it as a high priority and should be implemented in the short term. In addition, the members suggested that the feasibility of incorporating a crosswalk and pedestrian signals should be explored at the design stage, as currently only one protected pedestrian crossing exists in the 1.5-mile stretch between High Street and Jacobs Trails. Also at the design stage, if should be examined if additional warning, such as horn sounds, is necessary to support the signal system.
27 The beacons and the traffic signal should be all overhung and supported by mast arms. The entire signal system would be equipped with preemption functions controlled by the public safety officers.
28 Manual on Uniform Traffic Control Devices (MUTCD) Chapter 2C provides more detailed information about the warning sign W11-8.
29 See MUTCD Chapter 2B for the regulatory sign R10-6.
30 Currently, there is a pedestrian crossing warning sign on the northbound approach but no warning sign on the southbound approach.
31 The signal equipment at the crosswalk may need to be relocated and updated due to the roadway reconfiguration. At the design stage, it should be considered to be replaced by a fully functional traffic signal with accessible pedestrian signals at the intersection of Route 53 and Washington Park Drive.
32 Synchro AM and PM intersection capacity analysis reports for the signal retiming scenarios are included in Appendix L.
33 The roadway section has an about even daily traffic volume in both directions. In the PM peak hour, the northbound approach of the Jacobs Trail intersection is somewhat congested. Synchro tests of switching the southbound/northbound lane distribution indicate that it is not favorable because it would create even longer queues on the intersection’s southbound approach and impede accesses to and from the adjacent businesses there.
34 The addition would not affect the existing exclusive pedestrian signal phasing operation at the intersection.
35 The storage length is excessive as the approach carries a low volume of left-turn traffic of about 20 to 30 vehicles per peak hour. The remaining space can be used as a left-turn pocket to access the businesses on the south side.
36 The unsignalized intersection would operate at an overall acceptable LOS under the projected 2030 traffic conditions (see Appendix M). The only approach encounter undesirable delays during peak hours is the left-turn approach on Assinippi Avenue, which carries about five to ten vehicles per peak hour.
37 This improvement would take more time and resources than the usual short-tern improvements, but should be achievable in three years. It is considered a high priority and strongly supported by the Town of Norwell. As it is related to the corridor economic development and public safety, potential resources could include state- or town-supported economic development and public safety improvement funds in addition to the highway-related funds.