
Technical Memorandum
DATE: November 17, 2022
TO: Boston Region MPO
FROM: Sandy Johnston, Uday Schultz
RE: Scan of Integrating Transit and Truck Priority
This memo provides an initial overview and contextual research on a niche but potentially important topic relevant to transportation planning in the Boston region: transit vehicles and trucks sharing roadway priority, such as dedicated lanes or streets, on arterial and other sub-highway roadways. While not the national center for manufacturing, imports, freight, and logistics that it once was, Boston remains a regional logistics hub, a port city with significant freight activity and a dense, transit-dependent metropolis.
Both transit and freight vehicles operating in mixed traffic suffer reliability and speed challenges related to the area’s congestion and quirky roadway network (the urban myth of “paved cow paths”). Freight and transit traffic share a variety of characteristics and needs, among them being bigger than standard car traffic; needing certain roadway geometry; placing a high value on reliability; and being highly concentrated in a subset of corridors and near certain destinations. This research begins to explore the extent to which these shared characteristics and interests may be able to lead to cooperation in allocation of roadway space.
This is not intended to be a comprehensive research report—among other limitations, it is limited to available English-language materials, and thus focuses on the Anglosphere—but an initial scan that gives key stakeholders, including municipalities, the Massachusetts Bay Transportation Authority (MBTA), Massport, and freight shippers and carriers, something to react to and develop avenues for future research.
This research is funded and carried out by the MPO’s freight planning program, and as such (and because bus priority has already received considerable attention) focuses mostly on the truck aspect(s) of shared priority, and particularly on instances of shared truck and bus lanes. Given an overall dearth of literature and documentation on this topic, this memo tackles basic questions identified by staff and stakeholders such as
While this research is not intended to determine methods of implementation or to provide specific technical guidance, staff have identified several major lessons:
For more information, see section 4, “Conclusions and Further Research,”. The hope is that this scan will place actionable information in the hands of planners and policymakers engaging with roadway space allocation and possibilities for shared priority of various sorts, while pointing to possibilities for future research that will explore these questions in more depth.
Various modes of transportation have always competed for road space, especially in a highly congested region such as Boston, but awareness of such competition has become particularly acute in recent years. The Boston region is known to be especially congested, and forecasts call for traffic of all kinds to increase in coming decades as the region continues to grow. This is expected to be especially true in the areas where the most frequent transit also operates, potentially dampening transit’s ability to itself reduce congestion and provide effective mobility. The MBTA and several municipalities have collaborated to begin to build a network of bus priority lanes, ranging from side-running lanes shared with bicycles that operate on a part-time basis to physically protected, full-time, center-running lanes such as those on Columbus Avenue in Boston. The Massachusetts Port Authority (Massport) has built a network of roadways primarily intended to serve truck traffic to or from its major freight generators, including the South Boston Bypass Road, the Coughlin Bypass Road, and the Butler Freight Corridor; the first two are now open to general traffic, including some MBTA buses.
MPO staff have engaged significantly with the question of road space allocation, producing research on Prioritization of Dedicated Bus Lanes for Massachusetts Department of Transportation (MassDOT) in 2016; a research study on The Future of the Curb in 2019; a guidebook on Managing Curb Space in 2021; and a third phase of curb space research upcoming in 2022. In an environment where there is consistent competition for space between different road users and strict tradeoffs frequently exist, the potential to combine priorities and share priority, such as through bus-and-truck lanes, offers considerable promise. Given the overall scarcity of examples of such shared priority measures, and the potentially significant operational and safety challenges they present, the concept also deserves significant scrutiny.
The most immediate impetus behind this research was the planned implementation of shared bus-and-truck lanes on Summer Street in the South Boston Waterfront area (see more details below). Conversations with staff from Massport, the City of Boston, and MBTA indicated a shared interest in understanding this compromise solution in the context of other, related implementations, and understanding what successes and challenges might be expected based on other cities’ experiences.
Even before engagement with the Summer Street corridor, questions about road space allocation and potential shared priority have been of interest to MPO freight-planning staff, who have tried during federal fiscal year 2022 to engage important stakeholders around the region. This process has revealed considerable concern among freight stakeholders about road space allocation issues. One MPO board member suggested that allowing trucks into bus lanes that are perceived as “empty,” even at certain times of day or under certain traffic conditions, might both mitigate criticism and create a proactive constituency for such lanes and for enforcement of keeping them clear. Buses and trucks might even benefit from similar geometry.
Some within the Boston region have also predicted that developing a better understanding of shared freight and transit priority may also support emerging transport technologies or reduce highway maintenance costs. Outgoing MetroWest Regional Transit Authority administrator Ed Carr predicted in his penultimate column in the monthly Hub Happenings newsletter (May 2022) that down the line “freight and rapid transit will meld together in a single lane on major highways, allowing for large savings in highway maintenance, which is predicated on axle weight on the surface of the roadway. That single lane will be dedicated and reinforced as well as electrified. Safe and autonomous driven freight and transit vehicles will lower the cost of transporting goods and people, as well as lower the cost of road maintenance.”
Through this research and other conversations, MPO staff have become aware of several proposals for shared transit and truck priority within the region, at varying stages of development.
Summer Street is a busy bus corridor connecting South Boston to the Financial District and the rest of Downtown Boston. Before the COVID-19 pandemic, MBTA Route 7 carried approximately 4,600 passengers per day along this route. As part of the South Boston Seaport Strategic Transit Plan, jointly led by the Boston Planning and Development Agency (BPDA) and the Boston Transportation Department, the city has proposed multimodal improvements to the Summer Street corridor, including shared bus/truck lanes and dedicated, protected bike accommodations. The Summer Street bus priority measures intended will form part of the planned North Station to Seaport Multimodal Corridor. With bus lanes in places along much of the route, the Summer Street corridor would then host the new all-day frequent service T7 under the MBTA Bus Network Redesign proposal, a service that would essentially through-route the current routes 7 and 93 through downtown Boston and provide service enhancements. As of the Fall 2022 schedule, Route 7 runs nine to 10 trips per hour in the peak direction in the peak hour; the October 2022 revisions to the Bus Network Redesign proposal, which leave the routing of the T7 unchanged from the Spring 2022 proposal, propose a peak headway of eight minutes for the T7, or 7.5 buses per hour.
Figure 1
Proposed Route T7 in MBTA Bus Network Redesign
MBTA = Massachusetts Bay Transportation Authority.
Summer Street, especially the segment east of Pumphouse Road, is also an important freight corridor. It connects Massport’s Paul W. Conley Container Terminal1 and numerous truck-using firms in the Raymond L. Flynn Marine Park to Interstate 90 (I-90) and I-93. MPO staff conducted truck counts and analyzed this area extensively in 2016–17, publishing results in the Trucks in the South Boston Waterfront report. The MPO and MassDOT also designated part of Summer Street as a Critical Urban Freight Corridor (CUFC) in 2017.
Figure 2
South Boston Waterfront Critical Urban Freight Corridors
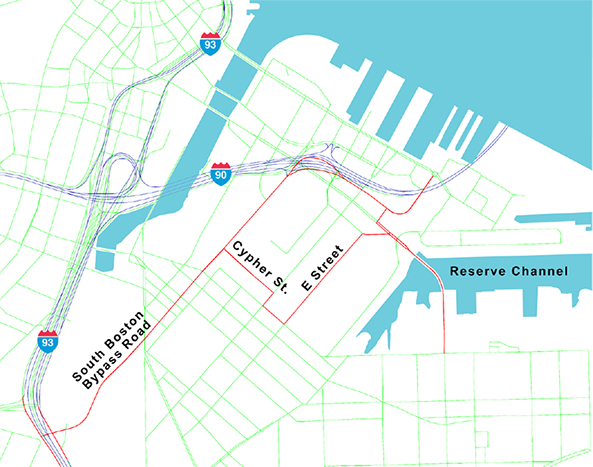
Source: CTPS, Proposed Critical Urban Freight Corridors (May 2017)
As part of the South Boston Waterfront research, MPO staff found that 670 trucks per day enter or leave the Seaport area via Summer Street at its crossing of the Fort Point Channel, while 185 entered or exited Summer Street at its intersection with E. First Street in South Boston. Since this study, traffic patterns in the Seaport have changed somewhat due to the opening of the Butler Freight Corridor connecting Conley Terminal to Summer Street north of E. First Street. Summer Street between the Butler Corridor and Pumphouse Road, with its peak-hour congestion and mixed traffic, thus serves as a key connecting piece in a dedicated or semi-dedicated freight network linking the Conley Terminal to the freeway system. Brief August 2022 field observations by MPO staff as part of this research observed that in the mid-morning period (after morning commuter rush but at a previously observed peak for truck traffic) traffic was relatively free-flowing in the segment of Summer Street between the Reserved Channel and D Street, with variance in truck travel times being attributable mostly to signal timing.
Initial plans for changes to Summer Street called for center-running dedicated bus lanes. Through reviewing documentation for the Raymond L. Flynn Marine Park Master Plan Update and conversations with staff from Massport, City of Boston, and MBTA, staff now understand that plans for the shorter term have changed. In the near term, the plan that has emerged is for side-running dedicated lanes on Summer Street. Between the intersection with the Butler Freight Corridor and the intersection of D Street, a stretch encompassing two sets of bus stops, these lanes will be shared between MBTA buses and trucks. We understand that these lanes are now planned for implementation on a pilot basis in Spring 2023. The purpose of allowing trucks to share the lanes will, at first, be highly specific: mitigating any potential impact to travel time and reliability for trucks moving between the Conley Terminal and the highway network connection at Pumphouse Road as a result of bus lane implementation. However, there are plans to discuss admitting general-purpose trucks to the managed lanes at a later date; as demonstrated later in this memo, enforcement of such complicated rules may be challenging. As a result, the Summer Street lanes will be relatively special among the already-rare phenomenon of shared bus and truck lanes in that they will primarily accommodate 18-wheelers rather than local delivery trucks.
BPDA has been conducting a study of development and rezoning along Western Avenue in Allston, an area expected to see significant redevelopment from light industrial to residential in coming years. The study includes significant transportation elements, including various possibilities for street configuration. The draft plan, presented in July 2022, proposes as a long-term concept a full transitway along Western Avenue, similar to those implemented on 14th Street in New York City and Market Street in San Francisco, allowing buses to travel the full length but restricting other vehicles.
Figure 3
Proposed Traffic Patterns for Potential Western Avenue Transitway
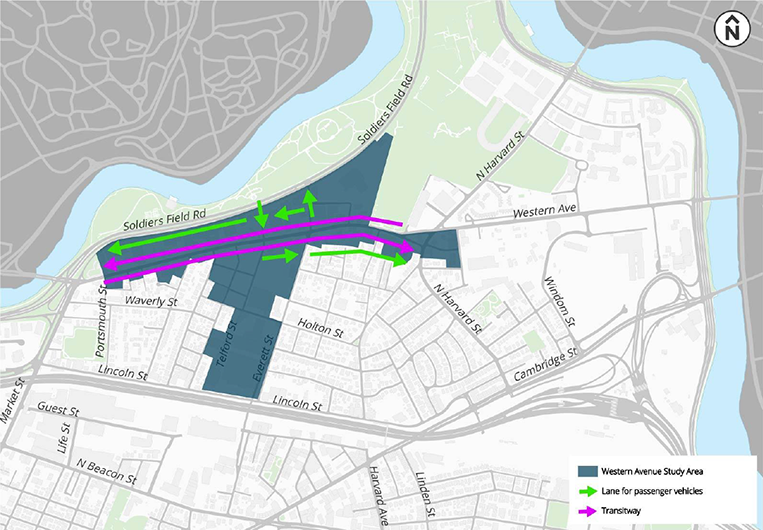
In this concept—which would require City acquisition of additional right-of-way via large setback requirements to be implemented as the area is redeveloped—as much delivery activity as possible would be moved to side streets, and any such activity that needed to stay on Western Avenue would be accommodated via large setbacks rather than on-street. More detailed plans for delivery traffic, and plans for any existing through-freight traffic, will be determined by future public process, including a formal Western Avenue Transitway study.
For the past several years, BPDA has been conducting PLAN: East Boston, a comprehensive master planning process for the East Boston neighborhood. One draft recommendation of the plan is to construct a busway between Service Road and Chelsea Street and a new station for MBTA buses (current routes SL3, 112 and 120) in Day Square between Chelsea and Bennington Streets. This busway would connect to dedicated bus lanes on Chelsea Street between and Square and the Chelsea Street Bridge over Chelsea Creek. For most of this distance, the Martin A. Coughlin Bypass Road, whose primary purpose is to carry truck traffic to and from Logan Airport,2 parallels Chelsea Street, but terminates in a T intersection with Chelsea Street about 850 feet from the eastern abutment of the bridge. Some project interviewees suggested that the possibility of allowing trucks to use this short segment of the dedicated lanes between the Bypass Road intersection and Chelsea Creek. However, we understand that the entire concept is extremely preliminary and will be subject to further discussion.
MassDOT is also conducting a study to “assess the potential uses of the MassDOT/MBTA rail parcels located between Route 1A and the Chelsea Creek in East Boston, and evaluate the Route 1A corridor between Bell Circle and Day Square.” The Coughlin Bypass Road occupies this right-of-way, a former railroad line that once led to the East Boston Docks, south of Curtis Street. This study was prompted largely by a private sector proposal led by a firm called Cargo Ventures to use the right-of-way for an extended Bypass Road north from its current terminus to serve Cargo Ventures’ proposed warehousing and consolidated park and fly uses between McClellan Highway (Route 1A) and Chelsea Creek, as shown in Figure 4.
Figure 4
Cargo Ventures Bypass Road Extension Concept
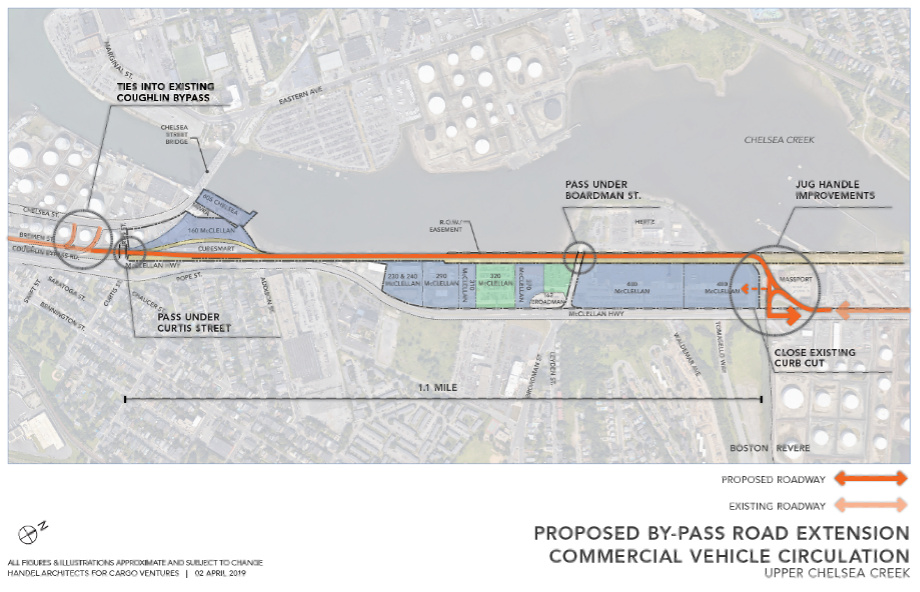
Source: Cargo Ventures, Visions for the Upper Chelsea Creek Industrial District: East Boston (2019).
Cargo Ventures had previously presented a different concept (Figure 5) for the area that would have extended the Bypass Road north through a multimodal transit center. The Bypass Road extension would have been open to both bus and truck traffic; whether it would have been open for single-occupancy vehicle travel is unclear. This alternative concept is not under consideration as part of the active MassDOT study.
Figure 5
Cargo Ventures Silver Line Extension Concept
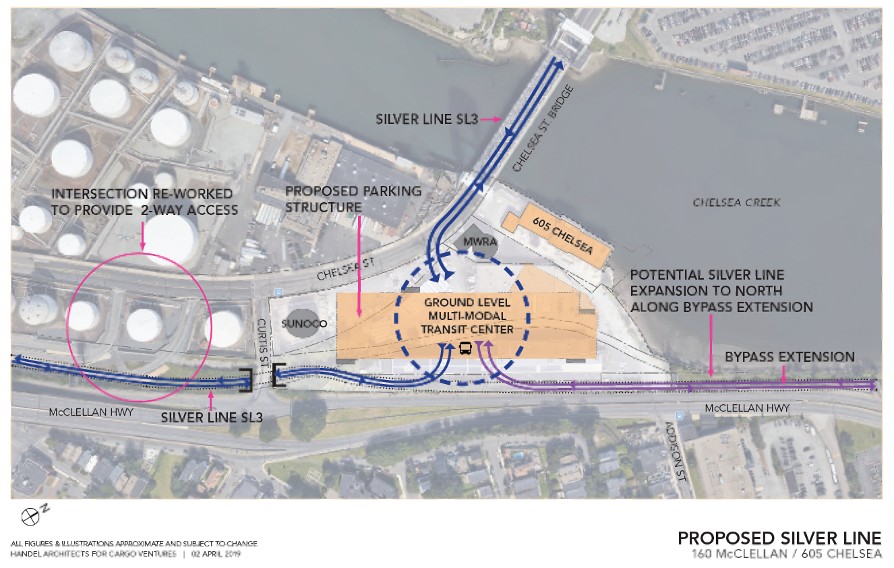
Source: Cargo Ventures, Visions for the Upper Chelsea Creek Industrial District: East Boston (2019).https://www.ebindustrial.com/wp-content/uploads/2020/03/Presentation-copy.pdf
As of November 2022, MassDOT has not published results and conclusions from its analysis and evaluation of alternatives. Whether the MassDOT study recommends a Bypass Road extension is still unclear, as are the outcomes of PLAN: East Boston, leaving considerable uncertainty about the interactions between various potential iterations of truck and bus infrastructure—including types of shared priority—in this part of East Boston.
The primary purpose of this memorandum is practical case studies rather than literature review, but it is worth reviewing what literature on this topic does exist, precisely because there is so little of it. Most American literature on truck priority lanes appears to focus on freeways and grade-separated highways. In the few existing shared bus and truck lane corridors, little has been invested to design and execute rigorous evaluations of their impacts. While none of these analyses provide a comprehensive look at the issues this memo tackles, each has interesting and potentially important ramifications for this project.
Author(s): Department for Transport (UK)
A document intended to familiarize local planning authorities with freight issues, this guide covers No Car Lanes both in principle and as a case study (using the Tyne and Wear area; see more in section 3.3). It finds that such lanes “have the potential to increase road capacity by improving lane utilisation, and also by segregating wider vehicles from standard vehicle lanes…[and] encouraging lorries [trucks] to use a higher standard route.” However, there are also concerns, including “impact on bus journey times, increased instance of lane contravention, difficulty of enforcement, maintenance and amount of signage clutter, and road safety implications.” The guide also reports that “‘no car’ lanes is an area that has been very much under-researched nationally” and calls for more research and analysis. It recommends that “in instances where a bus lane is converted to a ‘no car’ lane, the impacts on buses should also be measured.”
Author(s): New Zealand Transport Agency
This document examines implementation cases for priority lanes for modes of all types within New Zealand’s integrated planning process. It differentiates between “Heavy vehicle lanes” and UK-style “No-car lanes,” regarding the use case for each technique to be separate. However, it is perhaps worth noting that we have been unable to identify any actual implementations of either type of lane in New Zealand, meaning that the guidance is mostly hypothetical.
NZ Transport recommends implementation of heavy vehicle lanes (for vehicles of 3.5 tonnes or more) in strategically important locations “where road geometry makes them slower than the general traffic” and where their size and the road geometry create particularly unsafe conditions. It recommends including buses in heavy vehicle lanes, but classifies this technique as “not appropriate” for urban arterials, stating that, “An urban bus route that requires buses to stop and pick up passengers within the lane cannot be combined with a heavy vehicle lane. Additionally, urban arterials will have cyclists who will not be able to mix with heavy vehicles in a priority lane.” By implication, such guidance would not necessarily disqualify areas where trucks and buses share space, but there are no or few bus stops.
The document states very straightforwardly that “the principal reason for no-car lanes is to discourage car use.” Thus, the New Zealand definition of no-car lanes includes not just buses and trucks, but motorcycles and bicycles, as illustrated in Figure 6. They thus recommend implementing Travel Demand Management strategies along with no-car lanes.
Figure 6
No-car Lanes
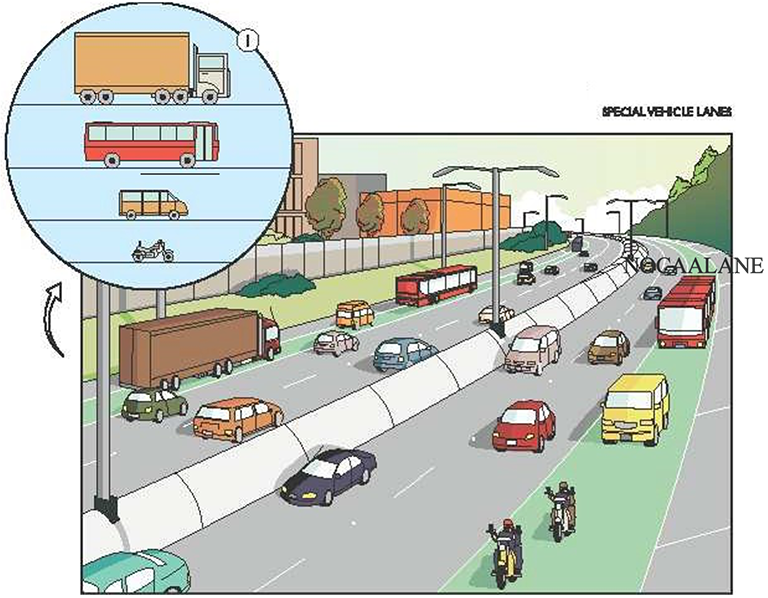
Source: New Zealand Transport Agency Integrated Planning Toolkit,
1st Edition (2010)
Author(s): Cambridge Systematics
This report summarizes research on truck-only lanes on Interstate highways as a strategy for congestion mitigation, cost-reduction, safety-enhancement, and mobility enhancement. It establishes a set of criteria for truck lane corridor selection and successful design, based on congestion, truck volumes, segment avoidability, and segment importance to the broader freight network. While not directly applicable to this research on shared-truck/bus lanes, it does lay out accepted planning principles around truck prioritization and lane management, and thus may be a useful reference for future research and/or implementing entities.
Author(s): Keith J. Bucklew
This article in a TRB newsletter by a former head of freight planning for Indiana Department of Transportation discusses the potential for (tolled) truck lanes to provide a solution to the safety and congestion problems caused and experienced by trucks. With a focus on Interstates, the author makes the case for truck lane implementation and additionally ties the implementation of truck lanes to potential further increases in max Gross Vehicle Weight. The article is of limited relevance to this research, except insofar as it signals some level of general conceptual interest in dedicated lanes in industry circles.
Author(s): Christopher R. Cherry, Abedola Adelakun
These researchers surveyed truckers in Knoxville to gauge interest in a variety of potential improvements (various dedicated truck lane configurations and associated tolling schemes). The survey found that truckers dislike driving in mixed traffic, especially when merging and erratic driving is high, and that while they roundly dislike required truck lanes, preferring the flexibility to use any lane depending on the circumstances, having an HOV-type left-side truck lane for through-truck traffic in urban areas would be popular with drivers. This result, though interstate and not arterial-based, would indicate optional dedicated lanes on urban arterials might be welcomed by urban truckers.
Author(s): Shahadat Iqbal, Taraneh Ardalan, Mohammed Hadi, Evangelos Kaisar
This study builds on a large body of literature that considers the benefits and applicability of Transit Signal Priority (TSP), and a smaller but still seemingly extant body that discusses Freight Signal Priority (FSP). It develops a decision tree for optimizing the implementation of TSP/FSP, based on the estimated dollar value of time savings from these measures. It then validates the tree against a travel corridor in Ft. Lauderdale, finding that in high-demand scenarios, TSP/FSP can work together to holistically improve travel time, but in low-demand scenarios, their effects on overall travel speeds are negative. The findings from this study may be of interest in developing a signal scheme for future shared-priority corridors, although implementing agencies should expect each corridor to have distinct characteristics.
Author(s): National Center for Freight and Infrastructure Research and Education, Xiao Qin, Most Afia Sultana, Madhav V. Chitturi, David A. Noyce
This extensive research and modeling project studies minor arterial streets and defines a multivariable approach to truck crash severity prediction on such roads. It finds that including access-related variables (e.g., the width and angle of commercial driveways) significantly alters what were previously thought to be significant predictors of crash risk. The study finds that the following factors contribute to predicting frequency of crashes:
The following factors contribute to truck crash severity:
These factors are joined to create an overall index of road truck accident risk. While this research does not directly address truck-bus priority, the analytical approach it lays out might be a useful complement to shared truck-bus priority schemes in corridor-level efforts to implement priority and improve overall road safety.
Author(s): Majed Al-Ghandour
This paper considers the implementation of truck or bus-only managed lanes at roundabouts, which historically have been sites of difficulty for these larger commercial vehicles. The study finds that such managed lanes can reduce travel times and recommends implementation of truck and bus lanes, though it analyzes truck lanes and bus lanes separately. This research might be particularly relevant to the Boston area given our high number of roundabouts, many of which are on significant truck and bus corridors. Anecdotally, MPO staff have observed truck and bus movements at the Wonderland roundabout in Revere, noting that trucks tend to move through the roundabout extremely slowly, which could delay other traffic (including buses) at peak periods.
Author(s): Fraser McLeod and Tom Cherrett
This study modeled the travel time impacts of a theoretical short bus lane with and without varying degrees of freight vehicle use, and with and without various amounts of unloading in a designated loading zone at the end of the bus lane. The analysis found that the lane had negative impacts on overall traffic speeds, and small, often statistically insignificant benefits for the buses and trucks allowed to use it. It further found that unloading would significantly reduce travel speeds, while also reducing the marginal negative impact of the bus lane, presumably because its users would have to disruptively merge with other traffic to avoid unloading trucks. The particular context and entirely simulation-driven approach (with a small sample, as well) should be grounds for caution on this study’s broader applicability. The results also apply more to applications of shared priority where the emphasis is on local traffic (like Western Avenue) than through traffic (like Summer Street).
Beginning with the implementation of the 14th Street busway in 2019, New York has rolled out a series of busway corridors, meant to give use of streets entirely over to buses with limited exceptions for local traffic. In an effort to speed truck traffic on these streets (which often are also designated truck corridors), all of these busways allow through-truck traffic, and are in fact labeled bus/truck priority corridors by the city. The impacts of these measures on truck traffic remains—at least publicly—unquantified, though dual use has seemingly not impaired the ability of these corridors to deliver significant benefits for transit passengers. The details of New York’s busways are below. Notably, this program of dual bus-truck priority only extends to busways, or streets dedicated entirely or primarily to bus traffic; the city’s bus lanes do not allow dual use.
Converted 14th Street between 3rd Avenue to 8th Avenue to bus and truck use between 6:00 AM and 10:00 PM, seven days per week
Local Delivery
As a major port city and logistics center that is also growing rapidly and seeing growing demand for transit, Seattle has long had an interest in freight planning, and in balancing competing demands for road space. Seattle Department of Transportation’s (SDOT) 2016 Freight Master Plan recommends exploring dedicated or quasi-dedicated truck lanes through policy development and several pilots. Unlike New York City, Seattle’s truck plans focus heavily on heavy trucks rather than local delivery. The Freight Master Plan is one of a series of modal master plans that the city has developed. As recently as August 2022, Seattle is in the middle of developing a Modal Integration Policy to unite these plans and define priority on each roadway segment. The Modal Integration Policy will then be integrated into the city’s upcoming comprehensive plan update, which is due in 2024.
This planning process has yielded two sub-processes informative for integrating transit and freight priority. As part of the demolition of the Alaskan Way viaduct in 2019, Seattle took the opportunity to test a Freight and Transit (FAT) lane, albeit under less-than-ideal conditions—the pilot was implemented on short notice, poorly signed and communicated to truckers, and relatively short-lived (we have been unable to find clear evidence of its duration). In addition, the city is in the process of developing a Freight Lanes Policy and defining where transit and trucks may share lanes and where they should be kept separate. Both efforts are profiled here.
Figure 7
Vehicles Using FAT Lane by Type
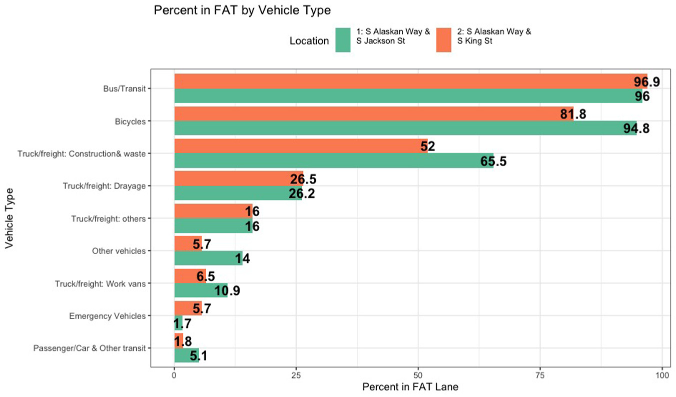
Source: Seyma Gunes, Anne Goodchild, and Venu Nemani. Evaluating Traffic Impacts of Permitting Trucks in Transit-Only Lanes (Transportation Research Record: Journal of the Transportation Research Board, Volume 2675, Issue 12, August 6, 2021).
FAT = freight and transit.
Ongoing
The following draft policies were proposed in the Draft Freight Lane Policy in February 2022:
According to SDOT staff, various city agencies are currently developing a potential pilot of shared priority pursuant to this policy on Westlake Avenue north of downtown Seattle (specifically, north from the intersection with Aloha Street). This pilot would consist of a full-time, side-running bus lane that would allow heavy trucks (Class 7 and above) during yet-to-be-determined off-peak hours. As of the publication of this memo, whether the pilot would proceed and the timing thereof are not entirely settled.
For 30 years, The Tyne and Wear region of the United Kingdom has implemented both standard bus lanes and “no-car lanes.” The latter are lanes that, quite literally, allow all types of vehicles except single-occupancy vehicles—most notably trucks (lorries in the local parlance). Several UK metropolitan areas experimented with no-car lanes as a result of the 1970s energy crisis, but none of those experiments appear to have lasted long as a result of opposition from drivers.
The Tyne and Wear metropolitan area comprises several local jurisdictions, of which the largest, Newcastle, took the lead on implementing the no-car lane approach from the 1990s through 2014, when many of the remaining no-car lanes were converted to standard bus lanes. Although now limited in scope, the implementation of shared transit and freight priority in Tyne and Wear is remarkable both for its extent and because there has been some effort at quantitative evaluation, albeit fundamentally limited by a lack of “before” data for comparison. In 2006–7 JMP Consulting and Newcastle University were hired within the context of the Tyne and Wear Local Transport Plan to evaluate the implementation of priority within the metropolitan area. They have produced several published products as a result of the analysis, which form the core of the case study here.
Figure 8
Map of Priority Lanes in Tyne and Wear, UK
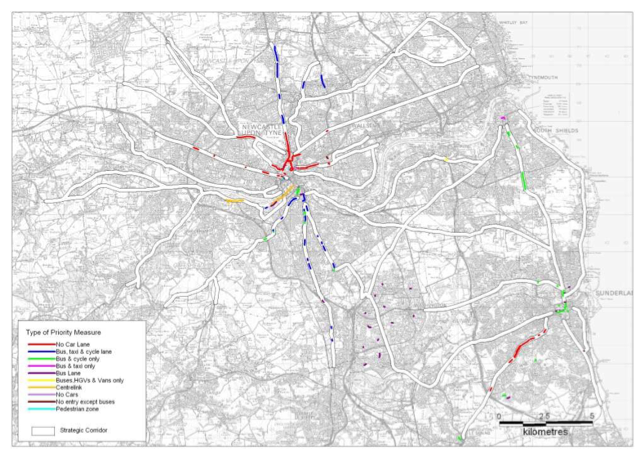
Source: Dr. Corinne Mulley (Newcastle University), Dr. Jessica Anderson, (JMP Consulting). No-car lanes in Tyneside –results from modelling and stakeholder analysis(7th BESTUFS II Workshop, Vilnius, September 2007).
These studies of priority schemes found that all priority schemes increased travel times for all vehicles, but of the various priority options no-car lanes increased, travel time increased for HGVs (trucks) by the least amount. The study methodology (relying on travel comparisons between priority and non-priority segments, rather than time series measurement bracketing lane implementation) is limited and questionable, and results on priority lanes reducing traffic speeds for all users mostly run counter to the bulk of research on the subject. Nonetheless, the evaluation team concluded that no-car lanes are the preferred form of priority lanes.
As is apparent from the “Planning Guidance” section above, the no-car lane concept has gained considerable theoretical traction in the Anglosphere but limited actual application. Even within Tyne and Wear, the no-car lanes faced occasional suggestions for repeal or modification, suggesting that they are not a consistent political masterstroke. Research suggests that allowing trucks in the lanes was, perhaps predictably, more popular with freight operators than with local officials. In 2013–14 Newcastle City Council changed the classification of many lanes from “no-car” to conventional bus lanes, banishing trucks from them.
Figure 9:
No-car Lane in Newcastle, UK
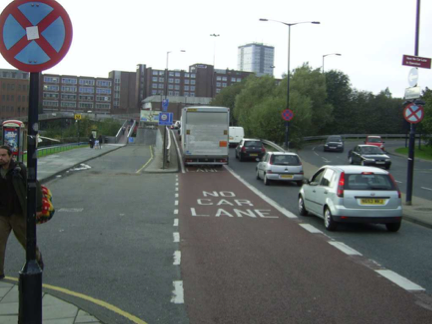
Source: Dr. Corinne Mulley (Newcastle University), Dr. Jessica Anderson, (JMP Consulting). No-car lanes in Tyneside –results from modelling and stakeholder analysis (7th BESTUFS II Workshop , Vilnius, September 2007).
This short, dedicated truck lane on an arterial street—the only one in Canada, as of 2014—has the primary purpose of deconflicting truck and bus traffic within the downtown Ottawa roadway network. Specifically, the lane was implemented to improve transit operations by removing slow-accelerating trucks from general travel lanes and reducing queues at key intersections. Between waterway crossing and legal restrictions on truck routings, options for trucks to travel through downtown Ottawa are limited. Waller Street serves as part of the only feasible route between the major freeways leaving into Ontario on one side of downtown and Quebec on the other, which do not physically connect. The lane almost exclusively serves through traffic. The Transportation Association of Canada has published a case study of this lane as a part of a broader survey of truck lane practice in Canada (with a focus on highway managed lanes and truck bypasses). While the lane seems to have been successful, poor markings and noncompliance significantly diminish its utility.
The Transportation Association of Canada case study does not provide a quantitative analysis, although the case remains a useful one for exemplifying integrated truck-bus street treatment strategies. It is interesting both because the situation is in many ways parallel to that in parts of the Boston region and in that the short length of the Waller Street lane, in some ways, provides a counterpoint to the conclusions of the Tyne and Wear modeling studies about the lack of utility of short segments. If strategically located, even indistinct and short stretches of truck priority can, it seems, have benefits for trucks and other users. However, the truck lane does not fully solve the unique situation of high numbers of heavy trucks traversing the disconnect between the provincial highway networks on surface streets, leading to proposals such as the 2016 feasibility study of a truck tunnel under downtown Ottawa.
Figure 10
Waller Street Truck Lane in the Context of Downtown Ottawa
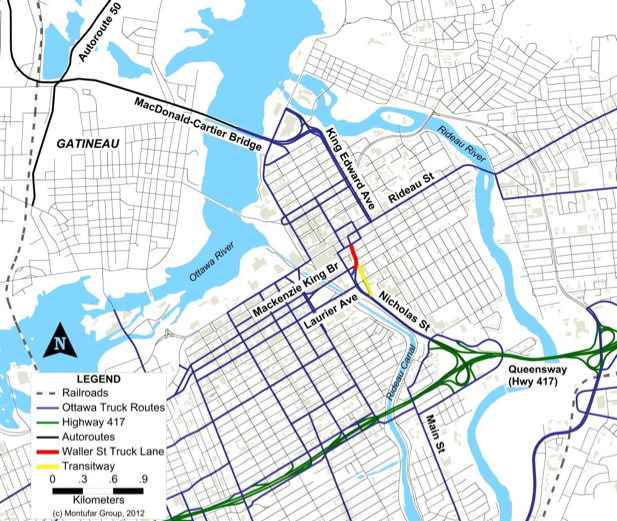
Source: Transportation Association of Canada, Truck Lanes in Canadian Urban Areas (2014)
As part of the city’s overall Rose Lanes project, the city has installed various forms of priority on SE Martin Luther King, Jr. Boulevard and NE Grand Avenue (a one-way arterial couplet). About one-half of the segment has been given red-painted transit-and-turn lanes, while the southern half, from SE Mill to E Burnside streets, is modified with lanes that jointly prioritize transit, commercial trucks, and turns, referred to in some documents as “Transit, Truck, and Turn lanes.” This corridor lays within one of Portland’s designated freight districts and is a designated freight corridor, serving as a key access route between local freight-generating industries and I-84.
These lanes have not been painted red as they are not exclusive bus lanes, but there is signage designating their status. There is little enforcement (Portland deemphasizes enforcement in traffic safety generally), but the Portland Bureau of Transportation (PBOT) did conduct some initial education efforts. The ability to conduct a formal evaluation was confounded by the COVID-19 pandemic and there are no plans for such work at this time.
This scan of shared freight and transit priority, while surely not fully comprehensive, provides a basis for identifying both several thematic lessons and avenues for future research.
As documented above, freight and transit movement on surface streets in metropolitan areas have many potentially shared interests, including roadway and intersection design; signal timing; challenges with reliability due to congestion; and conflicts, real or perceived, with people on bicycles and people walking. One potential framing of these shared interests is that rather than competing with each other, in many circumstances on city streets freight and transit are both competing with single-occupancy vehicles. The choice to implement shared priority, like priority dedicated to any one mode, is a choice to prioritize freight and transit over cars—and to prioritize overall efficiency in the transportation system. As New York City’s Smart Truck Management Plan, “Delivering New York,” states, “Creating bus and truck only streets or limited access streets for local delivery has the potential to maximize available road space for both efficient movement of people and goods.” While shared priority will likely always be a compromise, it may in many cases be the most efficient way to allocate road space.
The first and most dominant theme of this research is the severe shortage of reliable data on shared freight and transit priority. Implementations of this paradigm are relatively rare in any form, and even where it has been implemented evaluation has rarely been possible. Even where there has been evaluation, such as in Tyne and Wear and Seattle, it is compromised in some significant way. This is especially true on the freight side; new GPS technologies allow planners to track buses in detail, but the same information is only sporadically available for trucks. While it seems likely that initiatives in Seattle and Portland will yield more data in coming years, any shared priority project should be designed with the intention to collect detailed data of both the “before” and “after” varieties. In addition, experimentation such as pilot projects should be encouraged, as long as it can yield useful data.
Shared priority measures have to be smartly designed and implemented carefully in ways that fit project goals and local context, especially given the dearth of clearly identified best practices. As the case studies in this memo demonstrate, “shared freight and transit priority” is a diverse concept with numerous possible forms of implementation. The goals of each project will be specific to the needs of the area. In New York City, busways primarily serve local delivery, but each one has a slightly different design and rules. Seattle’s priority policy is closely tied to local land use. Evaluation of the Tyne and Wear priority network, a robust evaluation of shared priority, indicates that the system is hobbled by haphazard implementation without consistent clear relationship to goals or metrics. The Waller Street lane in Ottawa is short and visually undistinguished but serves a highly specific purpose that is arguably of strategic importance to two provinces.
Perhaps most importantly, the design elements of a particular implementation will vary according to needs on “both” modal sides. Policymakers and designers must consider factors such as the number of transit vehicles using the corridor; the number of trucks; the type; what turns each kind of vehicle makes and the number of bus stops within the project area. If the roadway has multiple lanes, which lanes do trucks preferentially use now, and what does that say about the choice of placement of future priority lanes? The utility of shared priority measures will vary based on existing need and style of implementation.
The lessons from other areas documented here point the way toward several potentially fruitful and important avenues for further research within the Boston region, to be undertaken by MPO staff, partners, or some combination. MPO staff will consider stakeholder interest in these topics while developing freight planning activities for federal fiscal year 2023 and beyond.
Given the relative lack of data on implementations of truck/bus priority, the relevant parties should collaborate to collect detailed data on the Summer Street corridor both before and after implementation, guided by this research. This effort would not only help evaluate this particular project but provide an important contribution to the overall literature. “Before” data collection priorities identified by MPO staff and stakeholders include
“After” priorities would include many of the same elements, and others identified by project stakeholders.
While this memo scans a large number of shared priority projects, it is mostly limited to document review. Spending additional time to contact people involved in these projects could yield additional insights and data to review. There is also potential to obtain a broader, more comprehensive sample set by expanding the analysis to include research and case studies from beyond the Anglosphere.
In addition to the three profiled above, there may be additional corridors or areas in the Boston region where shared priority is a possibility. There can be myriad ways to identify these corridors, including
Relevant entities should work together to identify metrics and characteristics that could allow identification of such corridors. This work could then lead to pilots of permanent projects along with detailed data collection.
cc: J. Barrera and S. Lee, Massport
W. Edwards and L. Gilmore, MBTA
M. Moran, BTD
J. Blankenship and J. Fitzgerald, BPDA
1 For more on the Conley Terminal and its role as a major regional freight generator, see Appendix B.
2 For more on Logan Airport and its role as a major regional freight generator, see Appendix B.
| Case | Date of Implementation | Length | Sharing Scheme | Span | Target Traffic | Primary Type of Truck | Priority Results | Source/More Reading |
| Fulton Mall (NYC) | 1970s | 0.5 mi | See above | 24h, 7 days/week. No through truck traffic permitted, and deliveries during overnight (7 PM to 7 AM) hours only | Buses and local deliveries nighttime only. | Local delivery | Impacts unknown | https://nyc.streetsblog.org/2011/03/14/the-fulton-street-mall-retail-success-on-nycs-original-transitway/ |
| 14 St Busway (NYC) | October 2019 (pilot); June 2020 (permanent) | 1.1 mi | Trucks and buses sharing a dedicated busway, or street with no through car traffic. | 6 AM to 10 PM, 7 days/week | Buses, local deliveries, and through truck traffic. Part of city designated truck route network. | Local delivery | 24% increase in bus speeds. Impacts on truck traffic unknown. | https://www1.nyc.gov/html/brt/html/routes/14th-street.shtml https://nyc.streetsblog.org/2021/11/19/thats-two-jay-street-busway-is-made-permanent-just-like-the-much-better-one-on-14th-street/ |
| Jay St Busway (NYC) | Aug-20 | 0.4 mi | See above | 7 AM to 7 PM, weekdays | See above | Local delivery | 30–50% increase in bus speeds. Impacts on truck traffic unknown. | https://nyc.streetsblog.org/2021/11/19/thats-two-jay-street-busway-is-made-permanent-just-like-the-much-better-one-on-14th-street/ https://www1.nyc.gov/html/dot/downloads/pdf/jay-st-busway-pilot-brochure-aug2020.pdf |
| Archer Ave/Jamaica Busway (NYC) | Nov-21 | 2 mi | See above | 24h, 7 days/week | See above | Local delivery | Impacts unknown | https://www1.nyc.gov/html/dot/html/pr2021/pr21-035.shtml https://www1.nyc.gov/html/dot/downloads/pdf/jamaica-archer-busway-brochure.pdf |
| 181 St Busway (NYC) | Apr-21 | 0.5 mi | See above | 6 AM to 10 PM, 7 days/week | See above | Local delivery | Impacts unknown | https://www1.nyc.gov/html/dot/downloads/pdf/181-st-broadway-ave-amsterdam-ave-brochure.pdf https://www1.nyc.gov/office-of-the-mayor/news/202-21/recovery-all-us-181st-street-busway-launch-april-26-bringing-faster-buses-66-000 |
| FAT Lane Pilot (Seattle) | Jan-19 | 700 ft | Trucks and buses in shared lane. | 24h, 7 days/week | Buses and trucks | Heavy trucks | Moderate increase in bus and truck speeds through area, though not all trucks used lane, and trucks were less likely to use lane when buses also present. | https://depts.washington.edu/sctlctr/sites/default/files/research_pub_files/SCTL_FAT_Lane_Report.pdf https://journals.sagepub.com/doi/abs/10.1177/03611981211031888?journalCode=trra |
| No-car Lanes (Tyne and Wear) | 1990s--2014 (most lanes) | 7.3 mi over an unknown number of individual lanes | Trucks and buses in shared lane. | 7AM-7PM (73% of lane-miles), 24h (27% of lane-miles) | Buses, trucks, and other commercial vehicles. | Local delivery | Found increase in travel time for all users using comparisons of averages for road segments with different priority treatments. | https://ses.library.usyd.edu.au/bitstream/handle/2123/19358/ITLS-WP-11-03.pdf?sequence=1&isAllowed=y |
| Waller St Truck Lane (Ottawa) | 1980s | 0.6 mi | Truck-only lane. | Unknown | Trucks, though designed to benefit buses by removing slow moving truck traffic from bus path. | Heavy trucks | Impacts unknown | https://www.metrolinx.com/en/regionalplanning/goodsmovement/Truck_Lane_Primer_April_2_2013.pdf |
| MLK/Grand Truck and Turn Lanes (Portland, OR) | 2020 | 1.8 mi (.9 mi in each direction) | Trucks and buses in shared lane. | Unknown | Buses, trucks, and other commercial vehicles. | Heavy trucks | Impacts unknown | https://www.portland.gov/transportation/pbot-projects/ccim/construction/mlk-grand-transit-lane-improvements |
The Conley Container Terminal, located in South Boston, is owned and operated by Massport. As the largest container terminal in New England, it connects more than 2,500 businesses in the Boston area and beyond to global markets. In recent years Massport has been continuously investing in the Conley Terminal and its connections to the land-based transportation network. Some of the projects are listed below.
For more on the Conley Terminal, please refer to Massport’s Fact Sheet and Annual Report.
Located in East Boston and operated by Massport, Logan Airport is a major freight facility in addition to its passenger role. It is the only airport in Massachusetts to have a significant air cargo presence, and the largest in New England. Air cargo through Logan is mostly for import or export, and is split approximately evenly between dedicated cargo flights and “belly” cargo carried in the cargo hold of passenger flights.
Most air freight is low-volume and high-value goods. Per MassDOT’s Freight Plan, Logan accounts for 0.2 percent of Massachusetts freight movements but seven percent of freight value. Data provided by Massport show that the highest-volume cargoes moving through Logan (in both directions) include commodities like seafood and computers and other industrial equipment. Given the high-value, high-priority nature of the cargo, freight volumes at Logan fell much less during the COVID-19 pandemic than their passenger counterparts. Overall, cargo volumes at Logan have fallen over the past couple of decades, and capacity is now maxed out, as improvements to passenger areas have taken some space previously used for freight.
To handle freight, Logan has two on-site intermodal facilities totaling 274,000 square feet: the North Cargo Area of one warehouse (17,000 square feet) and three aircraft positions, and the South Cargo Area of five warehouses (257,000 square feet) and six aircraft positions. In addition, the airport works with 33 businesses totaling a further 1.2m square feet in off-site locations ranging from East Boston to along Route 128.
For more on cargo at Logan Airport, please see the MassDOT Freight Plan and Massport’s environmental filings about Logan.
The lead author expresses his appreciation to the following people for their help with this research:
Uday Schultz, CTPS intern spring-summer 2022
Sarah Lee and Joel Barrera, Massport
Laura Gilmore and Wes Edwards, MBTA
Matt Moran, Boston Transportation Department
Jim Fitzgerald and Nick Schmidt, Boston Planning and Development Agency
Briana Orr and Gabriela Girón-Valderrama, Portland Bureau of Transportation
Joe Blankenship, Boston Planning and Development Agency
Ray Delahanty, former transportation consultant
Radcliffe Dacanay, Seattle Department of Transportation
The Boston Region Metropolitan Planning Organization (MPO) operates its programs, services, and activities in compliance with federal nondiscrimination laws including Title VI of the Civil Rights Act of 1964 (Title VI), the Civil Rights Restoration Act of 1987, and related statutes and regulations. Title VI prohibits discrimination in federally assisted programs and requires that no person in the United States of America shall, on the grounds of race, color, or national origin (including limited English proficiency), be excluded from participation in, denied the benefits of, or be otherwise subjected to discrimination under any program or activity that receives federal assistance. Related federal nondiscrimination laws administered by the Federal Highway Administration, Federal Transit Administration, or both, prohibit discrimination on the basis of age, sex, and disability. The Boston Region MPO considers these protected populations in its Title VI Programs, consistent with federal interpretation and administration. In addition, the Boston Region MPO provides meaningful access to its programs, services, and activities to individuals with limited English proficiency, in compliance with U.S. Department of Transportation policy and guidance on federal Executive Order 13166.
The Boston Region MPO also complies with the Massachusetts Public Accommodation Law, M.G.L. c 272 sections 92a, 98, 98a, which prohibits making any distinction, discrimination, or restriction in admission to, or treatment in a place of public accommodation based on race, color, religious creed, national origin, sex, sexual orientation, disability, or ancestry. Likewise, the Boston Region MPO complies with the Governor's Executive Order 526, section 4, which requires that all programs, activities, and services provided, performed, licensed, chartered, funded, regulated, or contracted for by the state shall be conducted without unlawful discrimination based on race, color, age, gender, ethnicity, sexual orientation, gender identity or expression, religion, creed, ancestry, national origin, disability, veteran's status (including Vietnam-era veterans), or background.
A complaint form and additional information can be obtained by contacting the MPO or at http://www.bostonmpo.org/mpo_non_discrimination.
To request this information in a different language or in an accessible format, please contact
Title VI Specialist
Boston Region MPO
10 Park Plaza, Suite 2150
Boston, MA 02116
civilrights@ctps.org
By Telephone:
857.702.3700 (voice)
For people with hearing or speaking difficulties, connect through the state MassRelay service:
For more information, including numbers for Spanish speakers, visit https://www.mass.gov/massrelay