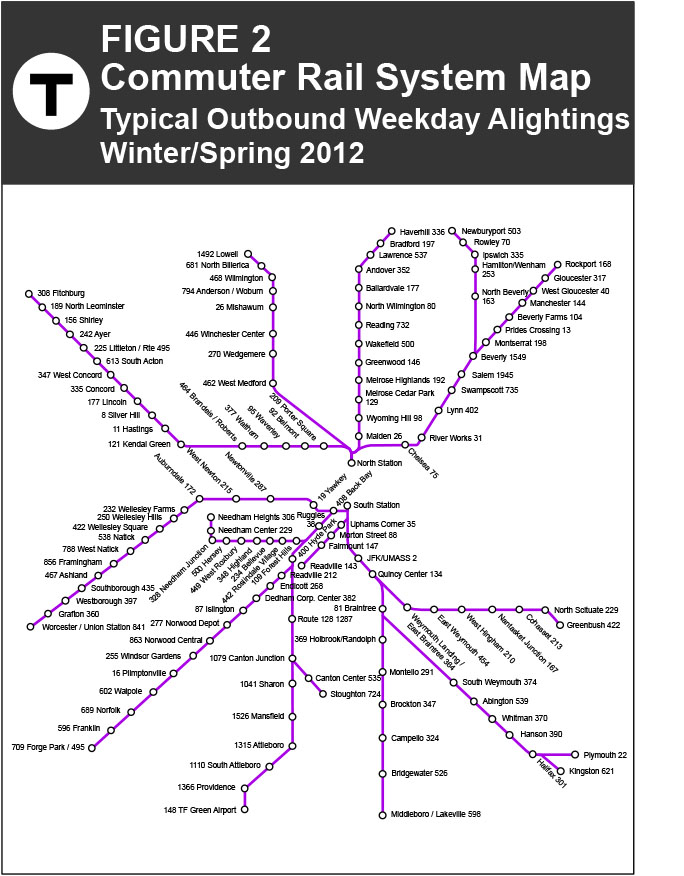
Figure 2
MEMORANDUM
DATE December 21, 2012
TO David Mohler, Executive Director of Planning
Office of Transportation Planning, MassDOT
FROM Thomas J. Humphrey, Chief Planner, Transit Service Planning
Central Transportation Planning Staff
RE MBTA Commuter Rail Passenger Count Results
This memorandum summarizes the results of passenger counts conducted by CTPS on the MBTA commuter rail system between January and June 2012, and provides recommendations concerning the nature and frequency of future counts. Those counts included the number of passengers boarding and alighting from each train in each direction at each station on each line on one weekday. This level of detail is useful for many planning purposes but is not currently obtainable by any method other than manual counting.
The data collected by CTPS were compared to several types of MBTA commuter rail ridership and ridership-related data that have historically been collected on an ongoing basis. The purpose of the comparison was to newly assess the accuracy of those ridership data and to inform recommendations regarding the nature and frequency of future counts. The data compared were:
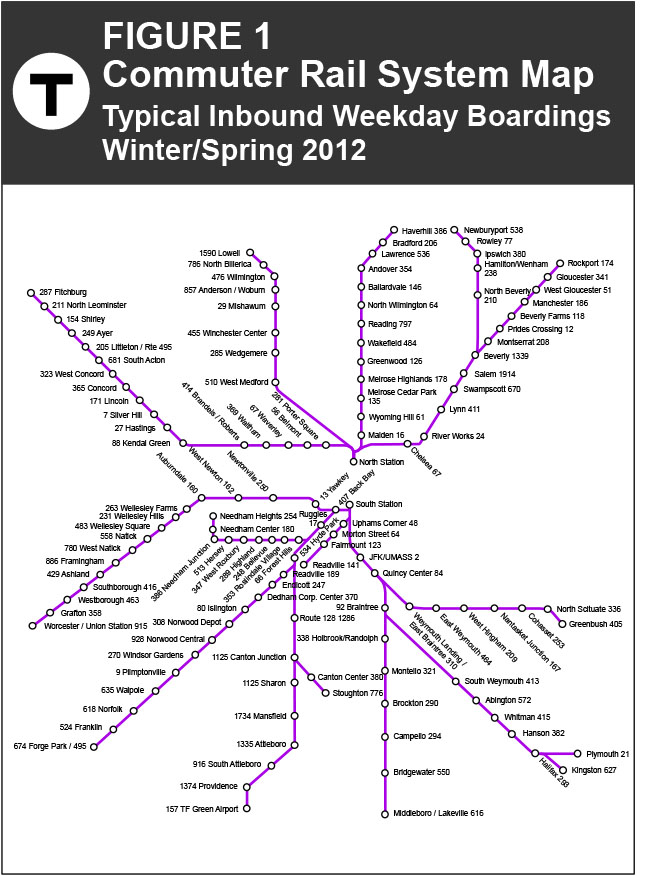
The complete CTPS 2012 count results for each commuter rail line are presented in an attached series of maps and tables. To the extent possible, counts were taken on what were believed to be representative days. The boarding and alighting counts were used to calculate loads on each train at each location along each route. In addition to the tables showing boardings, alighting and loads for each train at each station (Appendix A), CTPS produced a set of tables showing estimated all-day trips from each station to each other station on the same line (Appendix B). These estimates were based on the relative importance of each station on each line in total boardings and total alightings on that line, in the same way that trip tables for other services have been produced in the past. Finally, the CTPS 2012 composite one-day counts of passengers on the MBTA commuter rail system are summarized on two maps that show typical inbound weekday boardings and outbound weekday alightings by station (Figure 1 and Figure 2, respectively).
Analysis of these counts led to the following findings:
Figure 1
Figure 2
This memorandum is divided into the following parts:
Appendix A: Line-by-Line Count Results and Tables of Boardings, Alightings, and Loads for Each Train at Each Station
Appendix B: Tables of Estimated All-Day Trips from Each Station to Each Other Station on the Same Line
Appendix C: MBTA Commuter Rail Fare-Zone Map
Appendix D: Glossary of Terms and Data Sources
Appendix E: Line-by-Line Schedules
Ridership details for each commuter rail line in the Line-by-Line section include daily total boardings by direction, how the line is ranked compared with lines in other systems, the percent shares of peak versus off-peak boardings, the most heavily used stations, interzone ridership, and the locations of maximum load points.
Information on the distribution of ridership on the commuter rail system by station and by time of day is needed for many planning decisions, including optimizing the allocation of rolling stock among lines and trains; determining capacity requirements for upgrading station platforms, waiting areas, and parking facilities; and prioritizing projects. The ridership patterns observed on existing lines are used in predicting probable patterns on proposed service extensions.
In the past, it has often been necessary to rely on commuter rail ridership information that is either limited in detail or is of questionable accuracy. CTPS has conducted detailed counts for selected commuter rail trains or stations in conjunction with various planning studies, but has never before done counts for all stations in the system in a single project. The 2012 counts provide a much greater level of detail about commuter rail ridership by station than is obtainable from any other source. The limitations of the other available sources are discussed in detail in section 6 of this memorandum, Limitations of Other Commuter Rail Ridership Information Sources, and are summarized below:
As indicated above, the MBTA commuter rail system has no automatic devices for counting passengers. This necessitates using various manual counting methods or applying factors to monthly ticket and pass sales reports to measure ridership. Each of these methods has strengths and weaknesses. The CTPS 2012 passenger counts provide much more detail about ridership on the system than can be obtained from any other recent sources. However, ridership on any given day can vary from that on the day when counts for a particular train or station were conducted. Nonrepetitive, non-work trips account for a large share of ridership during off-peak hours, making counts for trains during those hours likely to vary much more from day to day than counts for peak-direction peak-period trains.
For the entire commuter rail system, the CTPS counts showed a total of 104,385 riders in both directions combined on a composite weekday. This figure appears to be somewhat below average when compared with revenue data. Estimates from ticket and pass revenue for the months when the counts were conducted indicate that ridership would have averaged around 112,000 per weekday. However, the latter figure includes some ridership on days with major sporting events or weather conditions likely to increase ridership, whereas CTPS avoided doing counts on such days. Revenue-based estimates also require some assumptions that cannot easily be verified about the frequency of trips made by pass users and the use of tickets on weekdays versus weekend days, because passes are valid for unlimited numbers of trips, and tickets are valid either on weekdays or on weekend days. It can, however, be stated with certainty that average ridership is lower than the total indicated by recent Train Audit reports, which indicate about 150,000 if outbound ridership, which is not included in those reports, is assumed to be about the same as inbound Train Audit totals.
The level of accuracy required for passenger counts depends to some extent on the kinds of decisions that may be made on the basis of those counts. For purposes of allocating rolling stock by line and trip, peak-load-point counts such as those conducted regularly by consultants for the contract operator of the commuter rail system are sufficient. If consideration is being given to adding supplemental short-turnback trains on a particular line, the distribution of ridership over the length of that line becomes more important. For decisions involving a major investment in upgrading station facilities or expanding parking capacity, it would be most desirable to have counts from several different days to determine the amount of typical day-to-day variation, seasonal variation, and variation due to extreme weather conditions or major events in Boston. Interzone ridership (that is trips not to, from, or via North Station, South Station, Back Bay, or another station in fare Zone 1A) account for a very small part of overall ridership on the commuter rail system. The CTPS counts showed that only 4.5% of the riders on the sample day were making such trips. Most interzone trips do not pass through the peak load points, so increasing interzone ridership could generate additional revenue without requiring additional train capacity. A detailed analysis of present interzone ridership could identify areas with the greatest potential for growth in such traffic.
The 2012 passenger counts were completed just prior to a fare increase that was expected to result in some loss in ridership. It will probably take several months until the long-run impact of the fare increase is known. The routine peak-load counts will show whether ridership has dropped at significantly different rates on different lines.
A major reason that passenger counts for the commuter rail system as detailed as those of the 2012 counts have not been done in the past is the expense of such a labor-intensive project. Unless ticket and pass sales figures or peak-load counts indicate that ridership is changing significantly, repetition on a regular basis of counts at the same level of detail as those of the 2012 counts is not recommended. Instead, until such time as other more accurate methods of monitoring ridership are in place, special counting projects should target specific lines or stations where better information is needed for planning purposes.
The CTPS 2012 passenger counts included a mix of on-platform and on-train counts. In general, counts for AM and PM peak trains were done by checkers on station platforms. One or two checkers were assigned to each station, depending on the station layout and approximate anticipated ridership levels. Midday and evening counts were mostly done by checkers riding on trains for the full route length. One checker was used for each onboard count assignment unless information from MBCR indicated that maximum loads would exceed 200; two checkers were assigned to the trains with the higher expected maximum loads. However, most trains with such loads were operated during peak hours, when counts were being done from platforms.
The combined platform and onboard counts included all trains at every station except for peak-period trains at North Station and South Station, in Boston. Experience from past CTPS count projects showed that the large number of inbound AM peak alighting volumes and outbound PM peak boarding volumes, and the simultaneous arrivals or departures of trains occurring on both sides of platforms shared by two tracks, make it much more difficult to get accurate counts at North and South Stations than at other locations. Therefore, instead of conducting direct counts, inbound AM peak alightings at North and South Stations were calculated as the difference between total inbound boardings and total inbound alightings at all other stations on its route for each train terminating there. Similarly, outbound PM peak boardings at North and South Stations were calculated as the difference between outbound boardings and outbound alightings at all other stations on its route for each train originating there.
Not all passenger trips are repeated every day, and even trips that are repeated are not always made on the same trains every day. Consequently, counts for any given train and station would be expected to show some day-to-day variation, even between representative days. Ideally counts would be repeated on several days and averaged, but the probable improvement in the results could not justify the much higher project cost this would have required.
Of the lines terminating at South Station, the Framingham/Worcester, Needham, Franklin, and Providence/Stoughton lines also serve Back Bay Station, and have significant inbound alighting and outbound boarding activity there. AM and PM peak-period counts at Back Bay were done at each of the entry and exit points to the platforms, supplemented with direct observations of passenger flows on the platforms at times of closely spaced arrivals or departures. Platform entries and exits by passengers observed to have been going to or from Amtrak intercity trains were subtracted from the totals. Any errors in allocation of Back Bay riders among trains would be offset in the calculations of South Station boardings or alightings for the same trains, since those were done by subtracting total alightings from total boardings at all preceding stations inbound and subtracting total boardings from total alightings at all subsequent stations outbound.
In most cases, there were no reliable sources of recent passenger boarding and alighting counts at individual stations to use as a basis of checking the accuracy of the CTPS 2012 counts. However, several reasonableness tests of the 2012 counts were conducted as the results for each station were completed. Based on past information on day-to-day ridership variation, if the total inbound boarding count at any station was more than 15% larger or smaller than the total outbound alighting count, the results were flagged for further scrutiny. Such imbalances occurred mostly between the AM peak inbound and PM peak outbound totals. If it appeared likely that the results in one direction were nonrepresentative or erroneous, a recount was done for either the AM peak or the PM peak, depending on which appeared least consistent with the overall ridership pattern on the line. If the recount agreed with the initial count, a recount was then done of the count in the other peak period. After all of the recounts, remaining imbalances of more than 15% in inbound boardings versus outbound alightings were mostly either at stations in the inner fare zones where passengers have options of alternating between commuter rail and other MBTA services, or at locations where passengers apparently use different stations on the same line for their inbound and outbound trips because not all trains stop at every station.
During the time that the 2012 CTPS counts were in progress, the most recent available MBCR peak-period passenger counts at North Station, South Station, Back Bay Station, and seven other stations had been done in the fall of 2011. Overall, the CTPS counts for the same stations were consistent with those MBCR counts, with the CTPS totals for all of these stations combined being about 4% lower than the MBCR totals. The CTPS and MBCR counts were both based on limited samples rather than averages over many days or weeks, and they were done in different months, so some differences between them would be expected. Because of the heavy peak-period passenger volumes, the MBCR counts at North and South stations may themselves have had some inaccuracies.
Due to the need to complete all of the CTPS counts between January 2012 and July 1, 2012, when the new fares were implemented, counts on some lines had to be done when ridership was expected to be lower than normal. In particular, temporary schedules on the Old Colony and Greenbush lines required by a tie replacement project and on the Fairmount Line by bridge replacement work are believed to have reduced the ridership on those lines.
On the Providence Line, an extension of the outer terminal for some trains to a new station at Wickford Junction, Rhode Island, was implemented on April 23, 2012, after the counts at the other stations on that line had been completed. CTPS did not attempt to do counts at Wickford Junction because it was expected that ridership there would still be building up during May and June. Some of this ridership would be new, and some would be diverted from other stations. It would be expected that ridership at the TF Green Airport Station, Providence Station, and South Attleboro Station would have decreased somewhat from the CTPS counts as a result of such diversions.
The CTPS peak-period counts at Back Bay Station and some recounts on the Framingham/Worcester Line were done after the implementation of new schedules on the Providence/Stoughton and Framingham/Worcester lines in the spring of 2012. These schedule changes affected the arrival times of some trains, but they had not been in effect long enough to have made changes of any significance in total ridership. Furthermore, almost all of the counts at outlying stations were completed under the old schedules.
For consistency with the other counts, the summary tables accompanying this memorandum are organized by the train times in effect prior to the spring 2012 schedule changes. Most of the changes in train times were fairly minor, but in some cases departure or arrival times changed so much that the distribution of passengers among trains had apparently shifted. Evidence of such shifting in the PM peak period included an unusually high ratio of Back Bay boardings to other station alightings on one train and an unusually low ratio on the preceding or following train. In such cases, some riders were reallocated among trains in the final tables to make the results more consistent with counts that predated the schedule changes.
The CTPS 2012 composite one-day counts of passengers on the MBTA commuter rail system showed a total of 104,385 passengers in both directions combined. For comparison, estimates based on pass and ticket sales for the same months in which the counts were conducted indicate an average of about 110,000 to 114,000 riders per weekday depending on the proportion of ticket riders allocated to weekdays versus weekends. These figures would be about 5% to 9% higher than the CTPS total. The variation from month to month in estimates based on pass and ticket sales, after taking into account differences in the number of weekdays, Saturdays, Sundays, and holidays, was not great enough to indicate that the CTPS counts need to be adjusted for the month in which they were conducted.
In comparing the CTPS peak-period totals with fall 2011 MBCR peak-period passenger counts at the downtown Boston terminals and eight other stations, it was found that the MBCR counts are about 4% higher. This suggests that the estimate based on ticket and pass sales should be closer to 110,000 than to 114,000.
The overall CTPS 2012 inbound and outbound count totals differed from each other by only about 1%, but results for individual stations showed larger variations. At most stations, the AM peak and PM peak counts, which included the majority of riders, were done on different days. Differences between boarding and alighting totals could reflect a combination of day-to-day variation and of actual directional imbalances in ridership. If the boardings and alightings at each station had both been equal to the higher of the two from the counts, this would have resulted in a total of 109,900 weekday riders for the entire system.
Most published reports of ridership on the commuter rail system are based on MBCR’s Train Audit figures, which show far greater ridership than can be accounted for by ticket and pass sales, and are also much larger than independent counts for the same ridership subsets. For example, a May 2011 audit report shows a systemwide total of 74,373 inbound boardings on a weekday. With an equal level of outbound ridership, this would have made a two-way total of 148,746. Based on ticket and pass sales figures, average two-way weekday ridership in May 2011 would have been about 113,500 to 116,500, depending on the proportion of ticket riders allocated to weekdays. The audit report figure is 28% to 31% higher than these totals.
Comparisons of the May 2011 audit figures with the CTPS 2012 counts at the station level show no set pattern in their ratios. The CTPS counts exceeded the audit figures at a few stations, but overall the audit totals exceeded the CTPS inbound counts by 42.6%. Some data processing errors were found in this audit report. For example, in a few cases, the audit showed large numbers of boardings for trains at stations they did not serve or still showed boardings for trains that had been discontinued prior to the audit date. Offsetting these errors to some extent were missing figures for some trains at stations where they stopped and would have been expected to have some boardings. Overall, however, such errors alone could not explain the discrepancies between the audit figures and the count totals or the revenue-based estimates.
Ridership is divided among four North Side routes terminating at North Station, and eight South Side routes, terminating at South Station. (In these totals the Rockport and Newburyport lines on the North Side are counted as one line, as are the Providence and Stoughton lines on the South Side.) Of the total 104,385 weekday riders observed in the CTPS counts, 38,545, or 36.9%, were on North Side lines and 65,840, or 63.1%, were on South Side lines. Passengers transferring between any two commuter rail lines were included in the totals for both lines, as they could not be readily distinguished. The results of passenger surveys conducted by CTPS in 2008-09 indicate that only about 1% of all riders on the commuter rail system transfer either directly or indirectly between two commuter rail lines to complete their trips.
For many years, the MBTA has designated certain inbound morning trains and certain outbound afternoon and evening trains as peak trains, with all others being designated as off-peak trains. These definitions have been used mostly in specifying when certain fares were valid. In recent years the surcharge for onboard ticket purchases was $2.00 on peak trains but only $1.00 on off-peak trains. Effective July 1, 2012, the surcharge was changed to $3.00 on all trains at stations where off-train ticket purchase is available, so the distinction between peak and off-peak now serves mostly as an indication of how crowded trains are likely to be.
The limits of peak and off-peak hours are based on scheduled inbound arrival times or outbound departure times at the downtown Boston terminals, but the definitions are not rigidly defined. Some arrival or departure times are currently designated as peak times on some lines but as off-peak times on others. For purposes of discussion in this memorandum, the designations of inbound AM peak and outbound PM peak trains on each line are those that were used in the schedules that were in effect when the 2012 CTPS counts were conducted (for line-by-line schedules, see Appendix E).
Ridership volumes on outbound morning trains and inbound afternoon and evening trains have never been heavy enough to call for a distinction between peak and off-peak trains. For purposes of discussion in this memorandum, outbound trains departing the Boston terminal on each line during the span of inbound AM peak arrivals on that line are designated as outbound AM peak trains. Similarly, inbound trains arriving at the Boston terminal during the span of departure of PM peak trains on that line are designated as inbound PM peak trains. Each line then has two or three off-peak time intervals in each direction. Any trains arriving at or departing from the downtown Boston terminal before the start of the AM peak span on each line are designated as pre-AM-peak trains. Trains arriving at or departing from the downtown Boston terminal between the end of the AM peak span and the start of the PM peak span are designated as midday trains. Trains arriving at or departing from the downtown Boston terminal after the end of the PM peak span are designated as evening trains.
Because of the importance of work trips in overall commuter rail patronage (as determined from passenger surveys), ridership is heavily concentrated on peak-direction peak-period trains. The 2012 CTPS counts found that for the commuter rail system overall, 81.2% of inbound ridership was on AM peak trains and 72.8% of outbound ridership was on PM peak trains. The lower concentration of PM peak ridership can be attributed to a combination of non-work trips made inbound during peak hours with outbound returns in off-peak hours, work trips to part-time jobs with early ending times, and work trips to jobs with long hours ending after the PM peak period.
During the 2012 CTPS counts, the first inbound train of the day on each North Side line was an AM peak train. Among South Side lines, the first trains of the day on the Middleborough/Lakeville Line and the Franklin Line were classified as pre-AM-peak, although their scheduled South Station arrivals were no earlier than the earliest scheduled AM peak arrivals on some North Side lines. The first Franklin train was routed via the Fairmount Line and was also classified as a pre-AM-peak train on that line. On each of the other South Side lines, the first inbound train of the day was an AM peak train. Ridership on all of the pre-AM-peak inbound trains combined accounted for only 0.7% of overall inbound ridership on the commuter rail system in the CTPS counts.
Outbound AM peak trips and inbound PM peak trips include some reverse-commuting work trips, but also include non-work trips such as going to and from suburban private schools and colleges. Outbound AM peak and pre-AM-peak trips also include some workers returning home from night-shift jobs. For the commuter rail system overall, the 2012 CTPS counts indicated that 5.1% of outbound ridership was on AM peak trains, but only 0.1% was on pre-AM-peak trains. The latter trains are operated primarily out of necessity for shifting equipment from yards in Boston to the outer ends of lines to cover inbound AM peak trips, and they might not be run if there were more layover facilities at outlying points.
The counts also indicated that overall 5.1% of inbound ridership was on PM peak trains. In addition to return halves of outbound trips made earlier in the day, inbound PM peak trips include passengers on the way to evening jobs or events. The CTPS PM peak and evening counts on North Side lines were done on days when there were no events at the TD Garden, which is located at North Station. Most counts were completed before the start of the baseball season. After the start of that season, counts were scheduled to avoid times when they might be affected by passengers going to or from Fenway Park.
Outside of AM peak hours, the heaviest concentration of ridership on inbound trains was in the midday. For the system overall, 10.2% of inbound ridership was on midday trains. Only 2.8% of inbound system ridership was on inbound evening trains. Some of these trains are run mostly to bring equipment back to Boston yards for the night, and might not be run if there were more layover facilities at outlying points. The 2008–09 CTPS surveys of commuter rail passengers did not include evening coverage, so the trip purposes of passengers on trains during these hours were not determined. The 1993 commuter rail survey covered inbound service all day on all lines then in operation. For the system as a whole, inbound evening passengers reported a wide variety of trip purposes. The largest group was trips from work to home (40.0%) followed by trips from school to home (15.3%), trips from home to “other” (14.9%), trips from home to work (8.2%), and trips from “other” to home (5.2%) About half of the passengers making inbound trips from work to home in the evening boarded their trains between 6:00 and 7:00 PM.
Midday ridership accounted for only a slightly smaller share of total ridership on outbound trains than on inbound trains, at 10.1% versus 10.2%. However, evening ridership accounted for 11.9% of total outbound ridership compared with only 2.8% of inbound ridership. CTPS has not conducted any surveys of outbound evening commuter rail riders. The main trip purposes for such riders would be expected to be returning home from long work days and from events in downtown Boston. As noted, above, the counts were conducted on days without major sporting events in Boston, in order to capture base-level ridership.
Under the fare structure in effect at the time of the counts, passengers traveling to or from North Station, South Station, Back Bay Station, or any other station in fare Zone 1A were classified as through passengers. Those making trips entirely between stations on the same line in Zones 1 through 9 were classified as interzone passengers. (Service to the only station in Zone 10, Wickford Junction in Rhode Island, began after the counts on the Providence Line were done.) For the commuter rail system overall, the 2012 counts found that 95.5% of riders were making through trips, and 4.5% were making interzone trips. These percentages varied among lines, depending partly on the number of intermediate stations and land use in proximity to these stations. On North Side lines overall, 5.9% of riders were making interzone trips. On South Side lines overall, only 3.7% of riders were making interzone trips.
Station-to-Station Ridership Estimates
Because of the low levels of interzone ridership found on most lines in the 2012 counts, as related above, the majority of passengers counted at individual outlying stations must have been riding to or from one of the downtown terminal stations or a station in Zone 1A. The counting methods used did not provide breakdowns of the specific number of riders traveling between each boarding station and each alighting station. However, these were estimated using a method similar to one used by CTPS to estimate station-to-station ridership on other services where direct information is not available. This method is described below.
The number of stations on MBTA commuter rail lines ranges from 5 on the Fairmount Line (including South Station) to 19 on the Newburyport/Rockport Line (including North Station). The more stations there are, the more potential station-to-station trip combinations there are. As distance from the starting point of a train increases, the number of possible boarding stations of the alighting passengers increases, and the number of possible alighting stations of boarding passengers decreases. For example, on the Framingham/Worcester Line, passengers boarding at Worcester, the first station, could be going to any of the 16 subsequent stations. Passengers boarding inbound at Grafton, the second station, could be going to any of 15 subsequent stations, but passengers alighting at Grafton inbound could only have boarded at Worcester. At the opposite end of the line, passengers alighting at South Station could have boarded at any of the 16 preceding stations. Passengers boarding at Back Bay Station could only be going to South Station, but passengers alighting at Back Bay could have boarded at any of the 15 preceding stations.
The method used to estimate station-to-station ridership was based on the relative number of boardings and alightings at each station, without regard to factors such as land use around stations that could make certain combinations more likely than others. Continuing with the example of the Framingham/Worcester Line, at the third inbound station, Westborough, alighting passengers could have boarded at either Worcester or Grafton. The estimation method divided the alightings at Westborough in proportion to the number of boardings at Grafton and the number of boardings from Worcester remaining after alightings at Grafton. Using actual all-day numbers from the counts, there were 915 inbound boardings at Worcester. At Grafton there were 7 alightings, leaving 908 passengers remaining on board from Worcester. Another 358 passengers boarded at Grafton. There were 14 inbound alightings at Westborough. Worcester passengers on board trains arriving at Westborough accounted for 908/(908 + 358) = 72% of the total on board. The estimation method allocated 72% of the 14 riders alighting at Westborough, or 10, to Worcester boardings, and the other 4 to Grafton boardings. This disregarded the possibility that passengers boarding at one of these stations might have been more likely than passengers boarding at the other station to alight at Westborough. Nevertheless, because of the small numbers involved, weighting the boarding stations differently would have had little impact on the absolute numbers.
The relatively small amount of Interzone ridership on each line was spread out over trips throughout the day. In many cases, the number of interzone alightings from an individual train at an individual station was too small for the station-to-station calculation method to be usable. For example, dividing a single alighting among 10 possible boarding stations would not produce meaningful results. Consequently, station-to-station totals were estimated only at the all-day level.
On the Framingham/Worcester, Needham, Franklin, and Providence/Stoughton lines, riders with downtown Boston destinations have a choice of alighting at either Back Bay Station, which has a direct rapid transit connection with the Orange Line, or South Station, which has direct connections with the Red Line and the Silver Lines. For destinations about the same distance from either Back Bay or South Station, alighting at Back Bay inbound saves the additional six minutes of scheduled time on board the train to South Station. For outbound trips, boarding at South Station provides more choice of seats. It also allows passengers to wait in the food court or on the train before departure time rather than on the platform or in the relatively small waiting room at Back Bay. Imbalances in the inbound and outbound splits of ridership between Back Bay and South Station in the 2012 counts and other counts indicate that significant numbers of passengers who use Back Bay inbound use South Station outbound.
At Back Bay Station, the Needham, Franklin, and Providence/Stoughton trains all use Tracks 1, 2, and 3. Tracks 1 and 3 share an island platform, but Track 2 has a separate platform. Some closely spaced inbound arrivals on Tracks 1 and 3 in the AM peak and some closely spaced outbound departures on these tracks in the PM peak make it difficult to determine with certainty which trains passengers are going to or from at some times. The CTPS totals for each train on these lines were calculated from the boarding and alighting totals at all stations other than Back Bay and South Station, so any misallocation of passengers among trains at Back Bay would result in an equal and opposite misallocation at South Station. For example, if a Needham train and a Franklin train were boarding at the same time at Back Bay and 25 of the riders included in the Needham train count were actually going to the Franklin Line, the calculated South Station total for the Needham train would be low by 25 and that for the Franklin Line would be high by 25.
For the Needham, Franklin, and Providence/Stoughton lines combined, Back Bay Station accounted for 41.2% of the Back Bay and South Station inbound alightings all day, but for only 34.1% of the outbound boardings. In addition to shifts between Back Bay and South Station, some passengers who alight at Back Bay inbound board at Ruggles outbound because more trains stop at Ruggles outbound than inbound. These shifts account for about 1% of the 7.1% difference between the inbound and outbound Back Bay/South Station splits.
When the 2012 count results for the Needham, Franklin, and Providence/Stoughton lines are separated, the Providence/Stoughton Line has the largest differential between the inbound and outbound Back Bay/South Station splits, with 45.1% of the combined inbound alightings but only 35.4% of the combined outbound boardings at the two stations taking place at Back Bay. For the Franklin Line, the Back Bay splits are 37.4% inbound and 34.4% outbound. For the Needham Line, they are 32.1% inbound and 30.1% outbound. The results of the 2008–09 passenger survey indicate that the small differential between inbound and outbound Back Bay shares on the Needham Line is partly a result of a smaller proportion of riders on that line having destinations accessed conveniently from both Back Bay and South Station.
On the Framingham/Worcester Line, 40.4% of the combined alightings at Back Bay and South Station in the 2012 counts took place at Back Bay, compared with 33.3% of the outbound boardings. The outbound Back Bay share was raised slightly by passengers who alighted at Yawkey Station inbound but boarded at Back Bay outbound because of the limited number of trains stopping at Yawkey.
The MBTA’s directly operated services now use an electronic fare collection system. Passengers can purchase either stored-value farecards or weekly or monthly passes valid for unlimited numbers of trips on specified services. At stations on the rapid transit system, the passes or farecards are used to open faregates, which record the exact time of each entry. On bus routes and surface segments of the light rail system, passes and farecards are used in conjunction with fareboxes on the vehicles, which also record the exact time of each fare transaction.
In contrast to the rapid transit and bus networks, the MBTA commuter rail system, operated under contract by MBCR, does not use mechanical fare-collection devices either at stations or on trains. Commuter rail passengers can pay their fares either on a per-ride basis with tickets or with unlimited-use monthly passes. All fare collection is done manually by conductors who walk through trains after each station stop, inspecting passes, collecting single-ride tickets from passengers who obtained them in advance, punching multiple-ride tickets, and selling tickets to passengers who do not have either tickets or passes. Of these fare transactions, the only kind that conductors are supposed to report on a daily basis is sales of tickets on board. Consequently, the commuter rail fare system does not generate information showing the number of riders using the system or any individual route or station on any given day.
Conductors are required to file headcount reports showing the total number of passengers on each trip each day, but these are usually estimates rather than actual counts. A few times a year, MBCR prepares more detailed ridership reports, called Train Audits. These are supposed to show the number of riders by type of fare payment boarding each inbound train at each station on one weekday, one Saturday, and one Sunday. To collect data for the Train Audits, the conductor on each inbound train is supposed to turn in a report showing the number of riders boarding that train at every station, as well as the type of fare paid by each boarding passenger. However it is not realistically possible for conductors to record all of this information in addition to their usual responsibilities of collecting tickets and monitoring doors at stops.
Assuming that Train Audits are done on days with average ridership, multiplying them by the respective number of weekdays, Saturdays, and Sundays in the audit month should provide monthly inbound ridership totals. Surveys of pass users show that on the days that they ride they make an average of 1.9 to 2.0 one-way trips. Even making allowances for ticket users, it can reasonably be stated that the majority of all riders each day make one round-trip, so outbound totals should be similar to inbound totals. However, for many years, the monthly figures projected from Train Audit days have indicated ridership that is significantly greater than is consistent with that finding or with what would be accounted for by total ticket and pass sales figures for the same months. Anecdotal reports claim that there is substantial fare evasion on the system as a result of passengers reusing tickets that have not been collected or punched when conductors are unable to get through crowded trains. Nevertheless, the ticket and pass sales figures show that the proportion of passengers with tickets that could even potentially be misused is much too small to account for the discrepancies with the Train Audit totals. Likewise, past spot-checks by CTPS and others of boardings at individual outlying stations, of passenger alightings at the downtown Boston stations, and of train loads at the maximum load points, have indicated that the Train Audit and headcount reports overstate ridership.
During the spring and fall of each year, direct counts of passengers at selected stations during peak hours are conducted for MBCR by consultants. These counts include passenger alightings from each inbound train during AM peak hours and passenger boardings on each outbound train during PM peak hours at North Station, South Station, Back Bay, and seven other stations where commuter rail lines connect directly with rapid transit lines. The latter are Malden Center and Porter Square on the North Side, and Ruggles, Yawkey, JFK/UMass, Quincy Center, and Braintree on the South Side.
These selected station counts do not include any riders who do not either alight from inbound AM peak trips or board outbound PM peak trips at one of the 10 stations listed above, but as discussed further below, only about 5% of all passengers on the commuter rail system make such trips. A more significant omission is trips made outside of peak hours. In the CTPS counts, 19% of all-day inbound trips were made outside of AM peak hours and 27% of all-day outbound trips were made outside of PM peak hours. The selected stations counts also do not provide any information about the boarding locations of the alighting passengers or the alighting locations of the boarding passengers.
At North Station, South Station, and Back Bay, the MBCR AM peak counts are taken on two days, and the results are averaged. PM peak counts are taken on either two or three days, and the results are also averaged. Counts at the other seven stations are done on only one day. Counts for all of the lines serving the same station are done on the same day, but counts at different stations on the same line are done on different days. The ridership patterns observed in the CTPS counts indicate that some passengers use one station for inbound alightings and another station for outbound boardings. If they make the same trade-offs each day, it does not matter if counts are done on the same day at every station. However passengers who use different stations on different days for either boardings or alightings, such as boarding at Back Bay on Tuesdays and South Station on Wednesdays, could be counted more than once or not at all. Compared with the MBCR counts, the CTPS counting method reduced the potential for such overcounting or undercounting at the inner stations by basing the North Station and South Station counts on the differences between boardings and alightings at all other stations.
Ridership estimates can be made using data on the number of commuter rail tickets and passes sold. However, these estimates are based on assumptions regarding how many rides are taken for each ticket and pass sold. These assumptions are discussed in the following sections.
The commuter rail system has a zone-fare structure with zone limits based more or less on the distance by rail from each station to North Station or South Station in Boston. Most zones include stations on more than one line. Tickets and passes are sold by zone rather than by station, so most sales records for tickets and pass sales do not reveal where they are used. Sales figures are reported on a monthly basis, with no separate breakdowns for weekdays, Saturdays, and Sundays, and tickets other than those purchased on board trains do not have to be used on the day of purchase. Tickets sold on board can be for one-way trips, round-trips, or for several people traveling together. The receipts for onboard ticket sales turned in by conductors each day along with the money collected can be used to determine the number of passengers and the number of zones traveled for each such ticket. However, with the ticket format that has been used historically, this would require manual tallying. With about 230,000 such receipts being turned in during a typical month, it would be prohibitively expensive to do such tallying. Consequently monthly reports of onboard ticket sales show only the number of transactions and the total dollar amount of sales.
Tickets sold on board commuter trains can be valid for one or more passengers who may be making one-way or round-trips, in any number of zones. The information provided to the MBTA Revenue Department regarding ticket sales shows only the total number of tickets sold on board and the total amount of revenue from these sales; it does not indicate the number of one-way, round-trip, or multipassenger tickets sold, nor does it indicate the number of tickets by zone. The Revenue Department currently assumes that each ticket sold on board pays for an average of 1.5 one-way passenger trips and, therefore, applies a factor of 1.5 to the monthly number of onboard ticket sales to estimate the total number of rides that these represent. This factor is consistent with the results of a detailed examination by CTPS of all the receipts from onboard ticket sales from one sample weekday, Saturday, and Sunday in 2002, but the rate of rides per ticket was slightly lower on weekdays and slightly higher on weekend days. Comparisons with a similar ticket sample from 1994 showed that the rates of rides per ticket had not changed significantly between the two sample years. It seems reasonable to assume that these rates would have been similar in the first half of 2012.
For purposes of calculating ridership from ticket and pass sales data to compare with passenger counts, estimates of weekday ridership are needed. This requires estimating the percentages of sold tickets used for travel on weekdays and the number of weekday trips made by pass users.
About two out of every three commuter rail riders use prepaid monthly passes that allow unlimited riding within the zones for which they are valid. The actual number of trips made by pass users must be estimated by applying factors such as those derived from responses to passenger surveys. Such surveys have generally asked respondents how many days they will use passes in a typical week or how many times they will use them on a typical day, but not how much their use may vary. Because of the relatively long lengths of the commuter rail lines, few passengers make more than one round-trip per day on the system. Under the fare structure in effect from 2007 through June 2012, the price of a monthly pass was about equal to that of 16 full-fare round-trips using one-way tickets. The average number of non-holiday weekdays per month was 21, and some passes were used for both weekday and weekend travel, so it was not necessary for a pass to be used for a round-trip every weekday to attain savings compared with using single-ride tickets. Passengers with their pass costs partly or fully subsidized by employers had even less incentive to use their passes every weekday than those paying for their own passes.
The MBTA systemwide passenger survey conducted by CTPS in 2008 and 2009 did not ask specifically about the frequency of pass use, but did ask respondents what their method of fare payment was, how many days per week they used the service they were riding when surveyed, and whether they used the service regularly on Saturdays or Sundays. Commuter rail passengers with passes would presumably use them for all of their trips on the lines on which they were surveyed, so the overall trip frequency reported by these passengers should be the same as their pass-use frequency. Some commuters have work schedules that include working on weekends with some weekdays off. This has to be taken into account in calculating weekday travel frequency. For example, survey respondents who report riding regularly on Saturdays and Sundays and riding seven days a week can be assumed to ride on five weekdays. Those who report riding regularly on Saturdays and Sundays but riding a total of only five days a week implicitly ride on only three weekdays. Adjustments are also needed for passengers reporting regularly riding on one weekend day but fewer than six total days. After adjustments for weekend use, the 2008–09 survey results indicated that commuter rail riders in each zone used the line on which they were surveyed approximately 4.65 weekdays each week. (Only 1.3% of all commuter rail pass users transferred between two commuter rail lines.)
The 2008–09 survey did not ask respondents how many commuter rail trips they made on a typical day. In prior pass-user surveys, reported averages have ranged from about 1.9 to 2.0 trips per day. With a rate of 1.9, the estimated total number of pass-user trips would be 5% less than with a rate of 2.0. Overall, commuter rail survey respondents would be more likely to overstate than to understate their trip frequencies because there are more possibilities for omitting trips by using alternate means of travel or taking days off than there are for making extra trips. In a typical month, with 21 weekdays, a passenger making one round-trip per weekday would make 42 trips. Each one-way trip less than this would be a 2.4% reduction.
In the composite weekday from the 2012 CTPS passenger counts, total inbound and outbound ridership for the system as a whole differed by only 1%. However, almost no stations had exactly the same number of passengers boarding inbound and alighting outbound or vice versa. At some stations boardings exceeded alightings, and at others the opposite was true. In order to assess the reasonableness of the data, the boarding and alighting numbers were examined in the following way. They were separated into two sets. The first set contained the boardings number or the alightings number, whichever was higher, for each station, and the second set contained the lower of the two numbers for each station. The sum of the higher numbers for all stations combined was about 12% greater than the sum of the lower numbers and was about 6% greater than the average of boardings and alightings. Because of logistical considerations, none of the stations had all boardings and all alightings counted on the same day, and at the majority of stations, AM and PM peak ridership was counted on different days. Differences between the inbound and outbound ridership totals at a given station could reflect day-to-day variation or actual imbalances between typical inbound and outbound ridership. Some of the latter could reflect shifts among stations, especially by passengers who are dropped off at one station on the initial trip of the day but picked up at a different station after the return trip.
Monthly passes are valid for unlimited numbers of trips, so the use of a pass on a weekend day does not reduce the number of trips for which it could be used on a weekday. In contrast, tickets are valid for only a specified numbers of trips. Except for improper reuse of tickets that have not been collected or punched on previous trips, each use of a ticket on a weekend day results in one less possible ticket use on a weekday. Under the rules in effect prior to July 2012, tickets sold on board trains were valid only on the day of purchase, but tickets bought at stations or other ticket outlets were valid for several months. Ticket sales figures show when tickets are sold rather than when they are used, but carryovers from one month to the next would be expected to be offset by carryovers from the previous month.
Weekend ridership consists largely of nonrepetitive non-work trips. Many of these are probably made by people who do not use the commuter rail system regularly on weekdays. Therefore, survey responses by weekday ticket users concerning their weekend use of commuter rail are likely to understate the overall weekend ticket use. (The cost of a monthly pass would not be justified for a passenger traveling only on weekend days, so it can be assumed that riders who use passes on weekend days are also among those using passes on weekdays.) In the absence of survey data or direct observations, Train Audit reports are the main data source from which the proportions of tickets used on weekdays versus weekend days can be calculated.
As noted above, Train Audit reports weighted by the number of weekdays, Saturdays, Sundays, and holidays in a month indicate far higher ridership than can be accounted for by ticket and pass sales. In the May 2011 audit, the largest discrepancies were in trips made with adult full-fare and 12-ride tickets. If the error rates in the audit reports are about the same on weekdays, Saturdays, and Sundays, the ratios of Saturday and Sunday to weekday ridership can be applied to the number of Saturdays and Sundays to calculate an equivalent number of weekdays over which to distribute ticket rides. For example, in a month with 22 weekdays, 5 Saturdays, and 4 Sundays, if an audit report is correct in indicating that for one-way tickets the number of Saturday rides was 60% as great as the number of weekday rides, and the number of Sunday rides was 30% as great as the number of weekday rides, then for this ticket type monthly sales would have been the equivalent of 22 x 1 + 5 x 0.60 + 4 x 0.30 = 26.2 weekday sales. Continuing with this example, if the reported number of sales of this type of ticket during the month was 100,000, the average number of rides per weekday would have been 100,000/26.2 = 3,817.
Because there are fewer Saturdays and Sundays than weekdays, and the number of weekend trips shown in the audit reports is smaller than the number of weekday trips, an error in the weekend ticket proportion would result in a smaller error in the weekday estimate. In the example above, if Saturday and Sunday sales were each underestimated by 50% relative to weekday sales and the true ratios should have been 90% on Saturdays and 45% on Sundays, then the equivalent number of weekdays would have been 22 x 1 + 5 x 0.90 + 4 x 0.45 = 28.3. The average number of weekday rides would then have decreased to 100,000/28.3 = 3,533, or a reduction of 7.4% compared with the original calculation. Similarly, if Saturday and Sunday sales relative to weekday sales were reduced by 50% each, to 30% and 15%, the equivalent number of weekdays would be reduced to 22 x 1 + 5 x 0.30 + 4 x 0.15 = 24.1. The average number of weekday rides would then increase to 100,000/24.1 = 4,149. This would be a gain of 8.7% compared with the original calculation.
Applying survey pass-use factors to pass sales figures, and factors from Train Audits to ticket sales figures, about 7% of weekday commuter rail trips in the first four months of 2012 were made using single-ride or round-trip full-fare tickets purchased off-train, and about 30% of weekday trips were made using all ticket forms combined. Each 1% increase or decrease in the number of off-train full-fare tickets allocated to weekday trips would therefore change total weekday ridership estimates by only 0.07%. An average change of 1% in all ticket forms combined allocated to weekdays would change total weekday ridership estimates by 0.3%. In the example above, reducing the estimated number of weekday rides on all ticket forms combined by 7.4% would reduce the total estimated number of weekday rides by 2.2%.
Discrepancies between the number of passengers shown in Train Audit reports and the number who can be accounted for by ticket and pass sales are sometimes attributed to unauthorized free rides or fraudulent reuse of tickets that are not collected or punched because conductors may be unable to get to all passengers on heavily patronized trains. However, unless ticket collection rates are always much higher on audit days than on other days, uncollected fares or reused tickets could not explain the large difference between ridership projected from ticket sales and that shown in the audit reports. A passenger who is checked by a conductor will either be found to have a pass or a through ticket to Boston purchased in advance and valid from the boarding zone, or will have to buy a ticket from the conductor. The volume of interzone riders is low enough that the conductor is not likely to forget that there are passengers who claim that they will be making interzone trips and notice that they ride through to Boston. A passenger paying the wrong fare would nevertheless be included in the total passenger count.
Passes are valid for unlimited riding, so pass users cannot get any extra rides as a result of not having their passes checked. As discussed above, pass rides account for about 70% of the weekday ridership estimated from combined monthly ticket and pass sales. About 12% of weekday rides would be taken on tickets sold on board trains. These are used at the time of purchase if they are for a one-way trip. If they are for a round-trip, the return half of the ticket is valid only on the day of purchase. Therefore, the only potential for fare evasion in this type of ticket is by passengers who board trains without tickets and are never seen by conductors.
With no fare evasion, about 8% of weekday rides would be taken on all forms of single-ride or round-trip tickets purchased prior to boarding, and about 10% would be taken on 12-ride tickets. Missed ticket collection is most likely to occur on peak-period peak-direction trains in the zones nearest to downtown Boston, where trains are most crowded. Based on survey data, about 35% of single-ride, round-trip, and 12-ride ticket trips are made on off-peak trains, and about 65% on peak trains. Based on ticket sales reports, about 17% of 12-ride tickets are for fare zones 1A, 1, or 2, and about 12% of single-ride and round-trip tickets sold off-train are for these zones. Therefore on an average weekday, out of all trips paid for with passes or tickets the percent accounted for by single-ride, round-trip, or 12-ride tickets for peak-period trips in Zones 1A, 1, or 2 can be calculated as 65% x (8% x 12% +10% x 17%) = 1.7%.
It is improbable that on an average day, the number of peak-period Zone 1A, 1, or 2 riders who did not have their tickets collected or punched or who were reusing tickets that should have been collected or punched on a previous day would account for a greater percent of all riders than the 1.7% holding valid tickets for these zones that day. Consequently, fare evasion due to uncollected or unpunched tickets could not come close to accounting for the discrepancies of around 30% between ridership shown in Train Audit reports and ridership estimated from ticket and pass sales.
Appendix A: Line-by-Line Count Results
and Tables of Boardings, Alightings, and Loads
for Each Train at Each Station
The results of the CTPS 2012 passenger counts for individual lines are discussed in detail below. The lines are addressed in counterclockwise order, starting with the Newburyport/Rockport Line on the North Side and ending with the Greenbush Line on the South Side. In general, this is the same sequence as that of the train numbers used by the MBTA.
Following the line-by-line narrative is a series of tables that show the weekday boardings and alightings counted for each inbound and outbound train on each of the 12 MBTA commuter rail lines. The counts for any given train and station are observations from a single sample day; the counts were not done on all lines, nor at all stations on the same line, on the same day. In addition to the counts for individual trains, these tables summarize boardings and alightings by line for four time periods: AM peak, midday, PM peak, and evening. Where applicable, these summaries also include totals for pre-AM-peak trains. For each train, the loads when departing each station have been calculated. Also shown are the maximum load point and the ridership at that location, the percentages of passengers on each train going to or from North Station or South Station, and the percentages of passengers making interzone trips (trips not to or from North Station, South Station, or any other station in fare Zone 1A).
The tables are arranged in the same counterclockwise geographical order used in the text. The tables for each line take up several pages, with the number of pages for each line varying with the number of trains. To assist in finding the tables for an individual line, the tables have page numbers in separate series, as follows:
Newburyport/Rockport Line NR-1 to NR-14
Haverhill Line HV-1 to HV-12
Lowell Line LO-1 to LO-13
Fitchburg Line FI-1 to FI-8
Framingham/Worcester Line WO-1 to WO-10
Needham Line NE-1 to NE-8
Franklin (Forge Park) Line FP-1 to FP-10
Providence/Stoughton Line PS-1 to PS-16
Fairmount Line FA-1 to FA-8
Middleborough/Lakeville Line ML-1 to ML-6
Kingston/Plymouth Line KP-1 to KP-6
Greenbush Line GB-1 to GB-6
These tables are not in a screen-readable format. If you need assistance accessing the data in these tables, please contact CTPS via email at publicinformation@ctps.org.
In the CTPS 2012 counts, the Newburyport/Rockport Line had the highest ridership total among North Side lines and the second-highest total among system lines, with 6,958 riders inbound and 7,045 outbound. Of these riders, 78.1% inbound rode AM peak trains, and 69.4% outbound rode PM peak trains. Excluding North Station, the most heavily used stations on the line were Salem, with 1,914 inbound boardings, and Beverly, with 1,339. Swampscott was a distant third, with 670 inbound boardings. All three of these stations are served both by trains originating on the Rockport Line and by trains originating on the Newburyport Line. Of the stations served only by trains on one of these two lines, Newburyport had the highest inbound boarding total, at 538. The most heavily used station on the Rockport Line was Gloucester, with 341 inbound boardings. Divided by segments, the stations between Beverly and Chelsea, which are served by trains from both the Rockport and Newburyport branches, accounted for 63.6% of the inbound boardings, with 4,425. Stations from Newburyport through North Beverly, which are served only by Newburyport Line trains, accounted for 20.7% of the boardings, at 1,443. Stations from Rockport through Montserrat, which are served only by Rockport Line trains, accounted for 15.7% of the boardings, at 1,090.
The Newburyport/Rockport Line had the highest interzone trip rate among North Side lines and the second-highest rate in the entire system, at 9.2% for both directions combined. The most common inbound alighting and outbound boarding stations for interzone trips were Lynn, Salem, and Beverly. Inbound alightings and outbound boardings at Chelsea Station, in Zone 1A, are classified as through trips, but have more in common with interzone trips. They accounted for about 1.5% of all trips on the Newburyport/Rockport Line.
The maximum load point on the Newburyport/Rockport Line varied among trains, mainly because of differences in turnover rates due to interzone travel. When the 2012 counts were conducted, the first 11 inbound trains of the day were classified as AM peak trains. Of these, 6 had maximum loads departing Lynn Station, including 5 that stopped at River Works and had more offs than ons there, and one that did not stop at River Works but had more offs than ons at Chelsea. Three trains had maximum loads between Chelsea and North Station. The other 2 ran nonstop between Salem and North Station, and had their maximum loads when they left Salem. Among the trains that had maximum load points departing Lynn, the difference between the load there and the load arriving at North Station ranged from 4 to 15 riders, with an average of 8.5. Therefore, alighting counts at North Station would have been reasonably close to maximum load totals. Total alightings before North Station on the 11 inbound AM peak trains ranged from 11 to 96, with an average of 32.2. On the 18 inbound trains running through to Boston after the end of the AM peak, alightings before North Station ranged from 0 to 70 per train, with an average of 23.6.
Ten Newburyport/Rockport trains, departing North Station between 4:00 and 6:45 PM, were classified as outbound PM peak trains. Among these, maximum loads occurred on 4 leaving North Station and on 3 each leaving Chelsea and River Works. On the six trains with maximum loads greater than North Station departing loads, differences ranged from 3 to 14 riders, with an average of 7.8. Total boardings at stations after North Station on the 10 outbound PM peak trains ranged from 7 to 51, with an average of 24.8. On the 14 trains leaving Boston between the start of service and the start of the PM peak, boardings at stations after North Station ranged from 0 to 58, with an average of 26.2. On the 5 trains leaving Boston after the end of the PM peak, boardings at stations after North Station ranged from 4 to 27, with an average of 14.2.
The Haverhill Line had the lowest total ridership among North Side lines, but was seventh out of all 12 commuter rail system lines, with 3,489 riders inbound and 3,502 outbound. Of these riders, 81.2% inbound rode AM peak trains and 67.8% outbound rode PM peak trains. Excluding North Station, the most heavily used stations on the line were Reading, with 797 inbound boardings, and Lawrence, with 536. Wakefield was third, with 484 inbound boardings. The stations between Reading and Malden Center, which are served both by through trains from Haverhill and by peak-period short-turn trains from Reading, accounted for 51.5% of the inbound boardings, at 1,797. Stations between Haverhill and North Wilmington, served by through trains from Haverhill and one short-turn train from Andover, accounted for 48.5% of the inbound boardings, at 1,692.
Some Haverhill trains are routed via the Lowell Line south of Ballardvale Station. Passengers boarding these trains at stations on the Lowell Line are included in the totals for that line. Passengers riding from Haverhill Station to North Station or the reverse can ride Amtrak Downeaster trains instead of MBTA trains. CTPS counted boardings on the one inbound AM peak Downeastertrainand alightings from the 2 outbound PM peak Downeastertrains at Haverhill separately from the MBTA train counts, but did not count off-peak Downeaster riders. The inbound AM peak Downeastertrain had 26 boardings at Haverhill, compared with 239 AM peak and 386 all-day boardings there on MBTA trains. The outbound PM peak Downeastertrains had a combined total of 51 alightings, compared with 190 PM peak and 336 all-day alightings there from MBTA trains. These peak imbalances suggest that some commuters ride MBTA trains from Haverhill to Boston but return on Downeaster trains to save time. At present, the Downeaster fare between Haverhill and Boston is $13.00 for a single ride, $96.00 for a 10-ride ticket, or $259 for an unlimited-ride monthly pass, At the time the survey was conducted, the MBTA commuter rail fare between Haverhill and Boston was $7.25 for a single ride, with the same unit cost for a 12-ride ticket, or $235 for a monthly pass. Since July 1, 2012, the MBTA fare has been $9.25 for a single ride or $291 for a monthly pass.
On the Haverhill Line, only 2.6% of riders in both directions combined made interzone trips, but 5.2% of inbound alightings and 2.5% of outbound boardings took place at Malden Center Station, in Zone 1A. More detailed counts at Malden Center in the past have shown that imbalances between commuter rail inbound alightings and outbound boardings there resulted from some passengers transferring to the Orange Line to complete inbound trips but boarding outbound Haverhill Line trains at North Station. The percentage of inbound passengers alighting at Malden was much smaller in 2012 than in previous CTPS counts. This may have been partly because increased passenger volumes on the Orange Line north of North Station have reduced the attractiveness of transferring from commuter rail at Malden. The low inbound Malden alighting figure also appears to have been weather-related. The count at Malden was done on a day when the temperature was below freezing. Passengers transferring to the Orange Line there have to wait outdoors or rush up to the platform as the train is arriving. At North Station, the Orange Line platform is in the subway.
On most trains on the Haverhill Line, the maximum load inbound was on trains approaching Malden Center Station, and the maximum load outbound was on trains departing that station. Because of the amount of passenger turnover at Malden Center, it is necessary to have ridership figures for both there and North Station in order to calculate peak loads. A few Haverhill Line trains in each direction are routed over the Lowell Line between Wilmington and North Station and stop at some of the stations on that line. The maximum loads on those trains occur as they are approaching North Station inbound or departing outbound. The summary tables for the CTPS counts for these trains follow the MBCR convention of including only boardings and alightings north of Wilmington in the Haverhill Line totals and the rest in the Lowell Line totals.
Most of the limited interzone ridership on the Haverhill Line is on through trains to or from Haverhill rather than on Reading or Andover short-turns. When the 2012 counts were conducted, the first 8 inbound weekday trains were classified as AM peak trains, and 5 of these originated at Haverhill. On the 5 Haverhill trains, alightings before Malden Center ranged from 1 to 10 per train, with an average of 5.2. On the 8 inbound trains from Haverhill after the end of the AM peak, alightings before Malden Center ranged from 1 to 12 per train, with an average of 6.8.
Six Haverhill Line trains, departing North Station between 4:30 and 6:20 PM, were classified as outbound PM peak trains. On the 4 of these that ran through to Haverhill, boardings after Malden Center ranged from 6 to 17, with an average of 9.8. On the 5 trains to Haverhill leaving North Station between the start of service and the start of the PM peak, boardings after Malden Center ranged from 4 to 14 per train, with an average of 7.6. On the 4 trains to Haverhill leaving North Station after the end of the PM peak, boardings after Malden Center ranged from 2 to 7 per train, with an average of 4.3.
The Lowell Line had the second-highest ridership total among North Side lines and the fifth-highest total among system lines, with 4,988 riders inbound and 4,639 outbound. (These totals include riders using Haverhill Line trains to travel between pairs of stations on the Lowell Line). Of the total riders on the Lowell Line, 79.3% inbound rode AM peak trains and 71.8% outbound rode PM peak trains. Excluding North Station, the most heavily used stations on the line were Lowell, with 1,590 inbound boardings, and Anderson/Woburn, with 857. North Billerica was a close third, with 786 inbound riders.
The stations from Anderson/Woburn to West Medford, which are served by through trains from Lowell, by peak-period short-turn trains from Anderson/Woburn, and by some Haverhill Line trains, accounted for 42.8% of the inbound boardings, at 2,136. Lowell, North Billerica, and Wilmington, which are served by through trains from Lowell, and in the case of Wilmington by some trains from Haverhill, accounted for 57.2% of the inbound riders, with 2,852.
The Lowell Line has the fewest stations of all the North Side lines, with only eight if North Station is excluded. This limits the possibilities for interzone trips. Consistent with this, the Lowell Line had the lowest interzone trip rate on the North Side in the 2102 counts, at 1.9% in both directions combined. Another 1% of inbound alightings and outbound boardings on the Lowell Line took place at West Medford in Zone 1A.
On most trains in either direction on the Lowell Line, the maximum load point was between West Medford and North Station. In a few cases, inbound alightings at West Medford exceeded inbound boardings there or outbound boardings exceeded outbound alightings, but the net turnover there was usually small. Therefore, for most trains, either boarding or alighting totals at North Station would suffice to determine peak loads.
From the start of service to the end of the AM peak, 6 trains originated at Lowell, and 2 short-turns originated at Anderson/Woburn. The Anderson/Woburn trains each had only 1 or 2 alightings before North Station. One of the Lowell trains ran nonstop between Anderson/Woburn and North Station. On the other 5 trains from Lowell, alightings before North Station ranged from 5 to 11 per train, with an average of 8.2. After the end of the AM peak, 16 inbound trains originated at Lowell and 2 at Anderson/Woburn. None of the latter had any alightings before North Station. The trains from Lowell had 1 to 13 alightings each before North Station, with an average of 5.4.
Seven Lowell Line trains, departing North Station from 4:10 to 6:25 PM, were classified as PM peak trains. One of these was an Anderson/Woburn short-turn, with 4 boardings after North Station. The other 6 were Lowell trains, of which 1 ran nonstop from North Station to Anderson/Woburn and had only 1 boarding after North Station. The other 5 had 5 to 11 boardings each after North Station, with an average of 8.4. Between the start of service and the start of the PM peak, 11 trains left North Station for Lowell. For these trains, boardings after North Station ranged from 3 to 11, with an average of 6.8. After the end of the PM peak, 5 trains left North Statin for Lowell. For these trains, boardings after North Station ranged from 2 to 9, with an average of 4.2.
The Fitchburg Line had the third-highest ridership total among North Side lines and the sixth-highest total among system lines, with 3,955 riders inbound and 3,969 outbound. Of these riders, 72.3% inbound rode AM peak trains and 64.1% outbound rode PM peak trains. These were the lowest concentrations of peak-direction peak-period ridership in the system. This reflected high rates of reverse-commuting on the Fitchburg Line, especially by college and private-school students. On the Fitchburg Line, 14.3% of outbound boardings were made in the AM peak and 14.0% of inbound boardings were made in the PM peak, compared with the system averages of 5.1% for each of these groups.
Excluding North Station, the most heavily used stations on the Fitchburg Line were South Acton, with 681 boardings, and Brandeis/Roberts, with 414. The stations between South Acton and Porter Square, which are served both by through trains from Fitchburg and by peak-period short-turn trains from South Acton, accounted for 72.0% of the inbound boardings, at 2,849. The stations between Fitchburg and Littleton/Rte. 495, which are served only by through trains from Fitchburg, accounted for 28.0% of the inbound boardings, at 1,106.
The Fitchburg Line had the second-highest interzone trip rate on the North Side, at 7.8% in both directions combined. The most common inbound alighting and outbound boarding stations for interzone trips were Waltham, Brandeis/Roberts, and Belmont, but in absolute terms they had much lower interzone activity than the most important interzone stations on the Newburyport/Rockport Line. Inbound alightings and outbound boardings at Porter Square Station, in Zone 1A, are classified as through trips. They accounted for 40.5% of inbound alightings and 33.6% of outbound boardings on the Fitchburg Line in the 2012 counts. Passengers using Porter Square Station can go either to or from locations in the station vicinity or transfer to or from the Red Line or MBTA buses. The difference between inbound alightings and outbound boardings in the 2012 counts is consistent with patterns observed in previous CTPS counts at this station. It is mostly attributable to inbound alighting passengers with destinations in Boston who complete their trips by transferring to the Red Line but make their outbound return trips by boarding Fitchburg Line trains at North Station.
Despite the high interzone trip rate on the Fitchburg Line, there was little variation among trains in the location of the maximum load point. On all inbound trains between the start of service and late afternoon, the maximum load point was between Belmont Station and Porter Square. On the final seven trains of the day, maximum loads were after Waltham. However, 2 of those trains ran nonstop from Waltham to Porter Square. For the rest, the difference between the load leaving Waltham and that leaving Belmont was at most 6 riders per train. On most outbound trains all day, the maximum load point was departing Porter Square. On a few trains, the maximum load point was either leaving Belmont or leaving Waverley. In most of the latter cases, the maximum loads were only 1 to 3 riders greater than the loads leaving Porter Square, but the first train of the day had 31 more riders aboard after Waverley than after Porter Square because of reverse-commuters. With the amount of passenger turnover at Porter Square, it is necessary, at minimum, to have ridership totals both there and at North Station in order to calculate peak loads.
When the 2012 counts were conducted, the first 6 inbound weekday trains were classified as AM peak trains. The first 5 of these originated at Fitchburg, but the last was a South Acton short-turn. The number of alightings before Porter Square varied widely among trains. For the first 4 Fitchburg trips, these alightings ranged from 6 to 22 per train, with an average of 28, but the fifth train had 47. The South Acton train had 8 alightings before Porter Square. For the rest of the day, 8 inbound trains originated at Fitchburg and 3 at South Acton. On the Fitchburg trains, alightings before Porter Square ranged from 5 to 26, with an average of 13.1. On the South Acton trains, alightings before Porter Square ranged from 7 to 28, with an average of 17.0.
The 6 Fitchburg Line trains departing North Station between 4:00 and 6:25 PM were classified as PM peak trains. The first of these terminated at South Acton, and the rest ran through to Fitchburg. The South Acton train had 20 boardings after Porter Square. On 4 of the Fitchburg trains, boardings after Porter Square ranged from 9 to 18, with an average of 14.0, but the 4:50 Fitchburg train had 54 such boardings.
Between the start of the service day and the start of the PM peak, 3 outbound trains were South Acton short-turns and 4 were through trains to Fitchburg. The first outbound train of the day, which was a South Acton trip, had 72 boardings after Porter Square. The other 2 South Acton trains had only 12 and 10 boardings after Porter. On the outbound Fitchburg trains, boardings after Porter ranged from 14 to 38, with an average of 24.3. All 4 outbound trains after the end of the PM peak ran through to Fitchburg. On these trains, boardings after Porter Square ranged from 2 to 13, with an average of 7.8.
The Framingham/Worcester Line had the second-highest ridership among South Side lines and the third-highest among total system lines, with 6,451 riders inbound and 6,336 outbound. Of these riders, 81.1% inbound rode AM peak trains and 74.3% outbound rode PM peak trains. Excluding South Station and Back Bay, the most heavily used stations on the line were Worcester, with 915 inbound boardings, Framingham, with 886, and West Natick, with 780. The stations between Framingham and Yawkey, which are served by through trains from Worcester and short-turns from Framingham, accounted for 58.7% of the inbound boardings, with 3,786. Stations between Worcester and Ashland, which are served only by Worcester trains, served 40.0% of the inbound boardings, at 2,581. Back Bay Station had 1.3% of the inbound boardings, at 84.
The Framingham/Worcester Line had the third-highest interzone trip rates among South Side lines, at 4.7% for both directions combined, but had a higher absolute number of interzone trips than either of the South Side lines, with higher rates of such trips. Framingham Station alone was the inner endpoint for one quarter of the interzone trips on the Framingham/Worcester Line. Framingham was probably also one of the more important outer endpoints for interzone trips, but in the counts those could not be distinguished directly from through trips to and from Framingham.
Yawkey Station, in Zone 1A, accounted for 6.9% of inbound alightings and 5.5% of outbound boardings on the Framingham/Worcester Line. The main inbound destinations and outbound origins of riders using this station are the Longwood Medical Area and Boston University. Because of very limited outbound midday service at Yawkey, some passengers who alight there inbound may take the Green Line to Copley Station and walk to Back Bay Station to catch outbound trains. Yawkey Station does not have a direct connection with the Green Line, but it is within walking distance of Kenmore Station, which is on the B, C, and D lines, and Fenway Station, which is on the D Line.
On the Framingham/Worcester Line, service at the time of the 2012 counts was provided by trains originating or terminating either at Worcester or at Framingham, with various combinations of local stops and express service. With few exceptions, the maximum load point on inbound trains was approaching Yawkey Station on trains that stopped there, or approaching Back Bay Station on trains that didn’t stop at Yawkey. For trains with maximum loads farther out than Yawkey, those loads and the loads at Yawkey or Back Bay differed by only 1 to 3 riders. Similarly, for almost all outbound trains, the maximum load point was departing Yawkey on trains that stopped there, or departing Back Bay on trains that did not stop at Yawkey. When the peak load point was west of Yawkey, the difference between that load and the load at Yawkey was negligible. Because of the high passenger turnover volumes at Back Bay and Yawkey, it is necessary to have ridership totals at these stations and at South Station in order to calculate peak loads.
When the 2012 counts were conducted, the first 8 inbound weekday Framingham/Worcester trains were classified as AM peak trains. Six of these trains originated at Worcester and 2 were Framingham short-turns. The number of alightings before Yawkey varied widely among trains. For 3 trains from Worcester that stopped at all stations, such alightings ranged from 15 to 42 per train, with an average of 26.7. For the 3 Worcester trains that omitted some stops, alightings before Yawkey ranged from 7 to 21, with an average of 12.0. The 2 Framingham trains had 12 and 14 alightings before Yawkey. For the rest of the day. Seven inbound trains originated at Worcester and 6 at Framingham. On the Worcester trains, alightings before Yawkey ranged from 2 to 36, with an average of 20.0. On the Framingham trains, alightings before Yawkey ranged from 2 to 8, with an average of 5.2.
The 7 Framingham/Worcester Line trains that departed South Station between 4:05 and 6:30 PM were classified as PM peak trains. Of these trains, 4 ran through to Worcester and 3 terminated at Framingham. Only the fourth Worcester trains made all stops; the other 3 ran nonstop between Back Bay and West Natick. The first 2 Worcester express trains had 23 and 30 boardings at West Natick and beyond, but the third express train, had only 2. The Worcester local train had 26 boardings after Yawkey, with 19 of these at stations before West Natick. On the Framingham trains, boardings after Yawkey ranged from 5 to 28, with an average of 18.0. Some passengers who boarded the 4:27 Framingham train west of Back Bay may have transferred to the 5:00 Worcester train at West Natick or Framingham, putting them among the 24 boardings on that train at those stations.
Between the start of service and the start of the PM peak, there were 5 outbound trains to Worcester and 4 to Framingham. The first Worcester train was run mostly for equipment shifting. It left South Station at 4:00 AM, with no stops between Back Bay and Worcester except at Framingham and Grafton. It had no boardings at Grafton and only 4 alightings at Worcester, assumed to have boarded in Boston. For the other 4 Worcester trains, none of which stopped at Yawkey, boardings after Back Bay ranged from 18 to 29, with an average of 23.0. On the 4 Framingham trains, only 1 of which stopped at Yawkey, boardings west of Yawkey ranged from 3 to 8, with an average of 4.5.
After the end of the PM peak, 3 outbound trains ran through to Worcester and 1 terminated at Framingham. On the Worcester trains, boardings after Yawkey ranged from 10 to 20, with an average of 14.3. The Framingham train had only 2 boardings after Yawkey.
The Needham Line had the fourth-highest ridership among South Side lines and the eighth-highest total among system lines, with 2,724 riders inbound and 3,090 outbound. Most of the stations on this line are also served by feeder bus routes to MBTA rapid transit lines or have direct rapid transit service. The imbalance between inbound and outbound ridership appears to have been largely attributable to passengers who used bus and rapid transit inbound but commuter rail outbound. Of the riders on the Needham Line, 87.5% inbound rode AM peak trains and 74.3% outbound rode PM peak trains.
Excluding South Station and Back Bay, the most heavily used stations on the line were Hersey, with 518 inbound boardings, Needham Junction, with 386, Roslindale Village, with 353, and West Roxbury, with 347. All trains on this line run through, to, or from Needham Heights. The outer four stations from Needham Heights through Hersey are all in the town of Needham. These stations accounted for 48.9% of the inbound boardings, at 1,333. The six stations from West Roxbury through Ruggles are all within the city of Boston. They accounted for 48.1% of the inbound boardings, at 1,309. Back Bay Station, also in Boston accounted for 3.0% of the inbound boardings, at 82.
Only 1.3% of the Needham Line riders in each direction were making interzone trips. The inner stations for the majority of these trips were Roslindale Village or West Roxbury. Trips to and from Ruggles Station, in Zone 1A, accounted for 9.7% of inbound alightings and 8.9% of outbound boardings on the Needham Line. The main inbound destinations and outbound origins of riders using this station are the Longwood Medical Area and Northeastern University. Forest Hills Station, also in Zone 1A, accounted for 1.4% of inbound alightings and 1.0% of outbound boardings on the Needham Line. The 2008–09 commuter rail survey had too few responses from Needham Line passengers alighting at Forest Hills to determine where they were going. Connections can be made at Forest Hills with the Orange Line and with several MBTA local bus lines.
At the time of the 2012 counts, all service on the Needham Line was provided by trains running through between Needham Heights and South Station. Most of these trains stopped at all intermediate stations, but inbound trains due at South Station at 3:50 to 6:17 PM and outbound trains leaving South Station before noon did not stop at Ruggles. Inbound trains due at South Station at 6:17 and 8:36 PM omitted stops at Highland, Bellevue, and Roslindale Village, as did the outbound train leaving South Station at 7:25 AM. The outbound train leaving South Station at 8:40 AM did not stop at Forest Hills.
Of the 16 inbound trains a day on the Needham Line, 8 had maximum loads leaving Forest Hills, with the next stop for each of these trains being Ruggles. Another 5 trains had maximum loads leaving Roslindale Village, but the differences between these loads and those leaving Forest Hills on the same trains ranged from only 2 to 5, with an average of 3.2. On 2 trains, the maximum loads were on board leaving Bellevue. On 1 of these this load was greater than that at Forest Hills by 4, but on the other it was greater by 12. One inbound train, in the PM peak, had its maximum load between Back Bay and South Station.
On all 12 of the outbound Needham Line trains that stopped at Ruggles Station, the maximum loads were on board leaving Ruggles. None of the 4 outbound Needham trains leaving South Station before noon stopped at Ruggles. On the first of these, the maximum load was reached leaving Highland Station mostly because of students going to schools near West Roxbury Station and it exceeded the load leaving Back Bay by 21. On the second and third outbound morning trains, maximum loads occurred between South Station and Back Bay. On the fourth outbound morning train, the peak load was reached leaving Roslindale Village, but it exceeded the load leaving Back Bay by only 4 passengers. Because of the high passenger turnover volumes at Back Bay and Ruggles, it is necessary at minimum to have ridership totals at these 2 stations and at South Station in order to calculate peak loads.
When the 2012 counts were conducted, the first 5 inbound weekday trains were classified as AM peak trains. The number of inbound alightings from these trains before Ruggles ranged from 1 to 7, with an average of 3.8. During the rest of the day, there were 11 inbound trains. For 10 of these, alightings before Ruggles ranged from 0 to 9, with an average of 4.2. The train due at South Station at 5:50 PM had 14 alightings before Ruggles, including 9 at Forest Hills.
The 5 Needham trains departing South Station between 4:00 and 6:25 PM were classified as PM peak trains. On these trains, boardings after Ruggles ranged from 2 to 8, with an average of 3.6. Between the start of service and the start of the PM peak, there were 7 outbound Needham trains. The first of these, which carried students to West Roxbury, as noted above, did not stop at Ruggles and had 22 boardings after Back Bay. The other 6 had 4 to 6 boardings after Ruggles if they stopped there, or after Back Bay if they did not, with an average of 5.0. After the end of the PM peak, there were 4 outbound Needham trains, of which 3 had no boardings after Ruggles and 1 had only 1 boarding.
The Franklin Line had the third-highest ridership among South Side lines, and the fourth-highest among total system lines, with 4,959 riders inbound and 5,121 outbound. To avoid double counting, inbound boardings or outbound alightings at Fairmount Line stations for Franklin Line trains routed over the Fairmount Line north of Readville are included in the Fairmount Line totals but not the Franklin Line totals. Of the Franklin Line riders, 83.7% inbound rode AM peak trains and 78.2% outbound rode PM peak trains. Another 2.5% rode the first inbound train of the day, which was due at South Station at 6:15 AM but was classified as an off-peak train in the published schedule.
Excluding Back Bay and South Station, the most heavily used stations on the Franklin Line were Norwood Central, with 928 inbound boardings, Forge Park/ 495, with 674, Walpole, with 635, and Norfolk, with 618. Most of the trains on this line run through, to, or from Forge Park, but there are a few short-turns from Norwood Central and Walpole. Stations from Norwood Central through Ruggles accounted for 43.6% of the inbound boardings, with 2,162. Stations from Forge Park through Windsor Gardens accounted for 55.0% of the inbound boardings, with 2,730. Back Bay Station had 1.4% of the inbound boardings, at 68.
The Franklin Line had the third-lowest interzone trip rate among South Side lines, at 1.6% for both directions combined. The only stations that were the inner ends of more than 10 interzone trips each were Norwood Central, Dedham Corporate Center, Readville, and Islington. Most of the interzone ridership at Islington consisted of students going to and from Xaverian Brothers High School in Westwood, and was concentrated on one inbound AM peak train and one outbound afternoon train.
Ruggles Station, in Zone 1A, accounted for 9.6% of the inbound alightings and 9.8% of the outbound boardings on the Franklin Line. The main inbound destinations and outbound origins of riders using this station are the Longwood Medical Area and Northeastern University.
At the time of the 2012 counts, most Franklin Line trains originated or terminated at Forge Park/ 495 Station, but there was one round-trip between South Station and Walpole Station in the AM peak, and between South Station and Norwood Central, there was one round-trip in the AM peak and one in the PM peak. Most of the Franklin Line trains were routed over the Providence Line via Ruggles and Back Bay stations between Readville and South Station, but 4 inbound trains and 3 outbound trains were routed over the Fairmount Line north of Readville.
On all 15 inbound Franklin Line trains routed via the Providence Line, the maximum load was approaching Ruggles if the train stopped there, or approaching Back Bay if it did not stop at Ruggles. The last stop before the maximum load point was Readville for 10 of these trains, Dedham Corporate Center for 3, Endicott for 1, and Hyde Park for 1. Of the 4 Franklin Line trains routed via the Fairmount Line tracks, only the first, due at South Station at 6:15 AM, stopped at all stations on that line. That train had its maximum load as it approached South Station, and its maximum load of Franklin Line passengers as it approached Readville. Of the other 3 Franklin Line trains routed via the Fairmount Line tracks, 1 did not serve any stations on that line, 1 stopped only at Readville, and 1 stopped at Readville and Fairmount Station. The maximum load point for all of these trains was approaching South Station.
Of 15 outbound Franklin trains routed via the Providence Line, 12 stopped at Ruggles and had maximum loads leaving that station. Of the others, 2 had maximum loads leaving Back Bay and 1 had a slightly higher load leaving South Station than leaving Back Bay. Of the 3 outbound trains routed via the Fairmount Line tracks, 1 served no Fairmount Line stations and 2 served no Fairmount Line stations except Readville. All 3 had maximum loads leaving South Station. Because of the high passenger turnover volumes at Back Bay and Ruggles, it is necessary at minimum to have ridership totals at these stations and at South Station in order to calculate peak loads for Franklin Line trains routed via the Providence Line north of Readville.
When the 2012 counts were conducted, the first inbound Franklin Line train of the day, which was routed via the Fairmount Line tracks and was due at South Station at 6:15 AM, was classified as an off-peak train. This train had its maximum load approaching South Station, and only 3 passengers alighted at previous stations on either the Franklin Line or the Fairmount Line. The next 7 inbound weekday trains were classified as AM peak trains. Of these, 5 originated at Forge Park, 1 at Walpole, and 1 at Norwood Central, and all were routed via the Providence Line tracks north of Readville. The train from Forge Park due at South Station at 7:59 AM made limited stops, and had only 1 alighting before Ruggles. On the other 4, inbound alightings before the peak load point ranged from 4 to 17, with an average of 8.0. The train from Walpole and the train from Norwood Central each had only 1 alighting before the peak load point.
Between the last inbound AM peak train and 5:08 PM, all 5 inbound trains from Forge Park were routed via Back Bay. Alightings from these trains before the peak load point ranged from 2 to 8, with an average of 4.8. The inbound train from Norwood Central, due at South Station at 6:05 PM, had no alightings before South Station. The Forge Park trains due at South Station at 6:50 and 8:45 PM and routed via the Fairmount Line tracks had 9 and 4 alightings before the peak load point. The last 3 inbound trains from Forge Park were routed via Back Bay with no stop at Ruggles. Of these trains, 1 had a single alighting before Back Bay and the others had none.
The 6 Franklin Line trains departing South Station between 3:55 and 6:15 PM were classified as PM peak trains. All of these were routed via the Providence Line tracks north of Readville, with 5 running through to Forge Park/ 495 and 1 terminating at Norwood Central. The Forge Park trains had 2 to 11 boardings each after the peak load point, with an average of 6.8. The Norwood Central train had 4 boardings after the peak load point.
Between the start of the service day and the start of the PM peak, there were 6 outbound trains to Forge Park along with 1 to Walpole and 1 to Norwood Central. The first Forge Park train was run mostly for equipment shifting. It left South Station at 4:00 AM, with no intermediate stops except at Norwood Central, Walpole, Franklin, and Forge Park. This train had only two passenger boardings: 1 at South Station and 1 at Franklin. The next 4 Forge Park trains had 2 to 5 boardings each after the peak load point, with an average of 3.3. The Forge Park train leaving South Station at 2:40 PM had 27 boardings after the PM peak, with most of these being students from Xaverian Brothers High School boarding at Islington Station. The Walpole train had no boardings after the peak load point, and the Norwood Central train had only 1. After the end of the PM peak there were 4 trains to Forge Park, all stopping at Back Bay and Ruggles. Boardings after Ruggles on these trains ranged from 0 to 5, with an average of 2.3.
The Providence/Stoughton Line includes the main line from Boston to Providence and beyond, and the Stoughton Branch, which diverges from the main line at Canton Junction and serves the Canton Center and Stoughton Stations. Trains on the main line and Stoughton Branch combined had the highest ridership among all MBTA commuter rail lines, with 10,887 riders inbound and 10,610 outbound. The counts were done prior to the extension of the line to Wickford Junction in Rhode Island, so they do not reflect any changes in ridership or ridership distribution related to it. Of the inbound riders on the line, 81.3% rode AM peak trains, and of the outbound riders, 71.3% rode PM peak trains. The PM peak concentration was the lowest among all South Side lines, but was higher than the average for North Side lines. In general, the lowest concentrations of ridership in PM peak hours were found on the lines with above-average service frequency in midday and evening hours, providing outbound riders with more opportunity to travel outside of peak hours.
Excluding South Station and Back Bay, the most heavily used stations on the Providence/Stoughton Line were Mansfield, with 1,734 inbound boardings, Providence, with 1,374, Attleboro, with 1,335, and Route 128, with 1,286. When the 2012 counts were conducted, some Providence Line trains originated at Providence and some at TF Green Airport Station. There was also one Mansfield short-turn and one Attleboro short-turn. Most Stoughton Line trains originated at Stoughton Station, but there was one Canton Center short-turn train (subsequently replaced with a Providence train). Stations from Canton Junction to Ruggles were served partly by Providence Line trains and partly by Stoughton Line trains. Stoughton and Canton Center were served only by Stoughton Line trains. Stations between TF Green Airport and Sharon were served only by Providence Line trains. Stations from Canton Junction through Ruggles accounted for 26.8% of Providence/Stoughton Line boardings, at 2,917. Slightly over half of the riders boarding at stations on this segment used trains originating on the Stoughton Line. Stations from TF Green through Sharon accounted for 61% of the inbound boardings, at 6,641. Stoughton and Canton Center accounted for 10.6% of the inbound boardings, at 1,156. Back Bay Station had 1.6% of the inbound boardings, at 173.
The interzone trip rate on the Providence/Stoughton Line was below the overall average for South Side lines, at 3.2% of both directions combined. However, with the heaviest total ridership of any line, the Providence/Stoughton Line had the largest absolute number of interzone riders on the South Side, with 378 inbound and 310 outbound. The largest concentrations of inner endpoints for interzone trips were at Mansfield, Attleboro, and Route 128.
Ruggles Station, in Zone 1A, accounted for 6.0% of the inbound alightings and 8.5% of the outbound boardings on the Providence/Stoughton Line. The higher outbound percentage reflected the greater percentage of outbound trains stopping at Ruggles. The main inbound destinations and outbound origins of riders using this station are the Longwood Medical Area and Northeastern University.
The passenger counts on the Providence/Stoughton Line preceded the opening of the extension to Wickford Junction Station in Rhode Island. Most trains that served stations south of Canton Junction on the main line originated or terminated either at the TF Green Airport Station or at Providence Station, but there was 1 round-trip each to Mansfield Station and to Attleboro Station. Most Stoughton Line trains ran to or from Stoughton, but there was 1 Canton Center round-trip.
On almost all inbound trains from either the main line or the Stoughton Line, the maximum load point was leaving the last station before Ruggles if the train stopped there or the last station before Back Bay if the train did not stop at Ruggles. Some trains ran nonstop through some stations, so the last stop before Ruggles varied among Hyde Park, Route 128, Canton Junction, and Mansfield. On one train that stopped at Hyde Park, the maximum load was higher by 1 leaving Canton Junction. On the inbound train due in Boston at 6:20 PM, the maximum load was between South Attleboro and Attleboro because of Providence reverse-commuters returning home to stations near the south end of the line. Similarly the maximum loads on the trains due in Boston at 7:03, 10:15, and 11:42 PM were all between Attleboro and Mansfield.
On 26 of the 34 outbound trains, the maximum load was leaving either Ruggles, if the train stopped there, or Back Bay, if it did not. On 4 trains, the maximum load point was leaving South Station because there were more alightings than boardings at Back Bay. On the first outbound Stoughton train of the day, the only boarding was at South Station. On 2 trains, the peak load point was leaving Hyde Park, but each of these trains had a net gain of only 2 riders at that station. On the first outbound main line train, the peak load point was leaving Attleboro, due to reverse-commuters going to Providence. Because of the high passenger turnover volumes at Back Bay and Ruggles, it is necessary at minimum to have ridership totals at these stations and at South Station in order to calculate peak loads on Providence/Stoughton Line trains.
When the 2012 counts were conducted, the first 12 inbound Providence/Stoughton Line trains of the day were classified as AM peak trains. Of these, 4 originated at the TF Green Airport Station, 3 at Providence, 1 at Mansfield, and 4 at Stoughton. The number of inbound alightings from the TF Green trains before the peak load point ranged from 10 to 21, with an average of 15.0. From the Providence trains, the range was 8 to 18, with an average of 13.3. From the Stoughton trains, the range was 1 to 16, with an average of 6.8. The Mansfield train had 6 alightings before the peak load point.
During the rest of the day there were 22 inbound trains, including 5 from TF Green, 3 from Providence, 1 from Attleboro, 12 from Stoughton, and 1 from Canton Center. From the TF Green trains, alightings before the peak load point ranged from 10 to 47, with an average of 22.4. From the Providence trains, the range was 16 to 64, with an average of 36.3. From the Stoughton trains and the Canton Center train, the range was 0 to 6, with an average of 1.2. The Attleboro train had 4 alightings before the peak load point.
The 10 Providence/Stoughton Line trains departing Boston between 3:45 and 6:30 PM were classified as PM peak trains. These included 2 trains to TF Green, 3 to Providence, and 5 to Stoughton. The number of boardings after the peak load point varied greatly among trains. The 2 TFGreen trains had 8 and 9 such boardings, or an average of 8.5. For the Providence trains, the range was 6 to 42, with an average of 22.0. For the Stoughton trains, the range was 1 to 11, with an average of 5.2.
Between the start of service and the start of the PM peak there were 16 outbound trains on the Providence/Stoughton Line, including 3 to the TF Green Airport Station, 2 to Providence, 1 each to Attleboro, Mansfield, and Canton Center, and 8 to Stoughton. As was the case in the PM peak, the number of boardings after the peak load point varied widely among trains. For the TF Green trains, such boardings ranged from 5 to 36, with an average of 19.3. The Providence trains had 36 and 28 boardings after the peak load point, for an average of 32, but the Mansfield train had none and the Attleboro train had only 2. For the Stoughton trains, boardings after the peak load point ranged from 0 to 4, with an average of 0.8, but the Canton Center train had 20.
After the end of the PM peak there were 8 outbound trains on the Providence/Stoughton Line, including 2 to TF Green Airport Station and 3 each to Providence and to Stoughton. The 2 TF Green trains had 9 and 13 boardings after the peak load point, for an average of 11.0. The Providence trains each had 8 or 9 such boardings, with an average of 8.3. Of the 3 Stoughton trains, 2 had no boardings after the peak load point, and 1 had 2 making the 3-train average 0.7 boardings after the peak load point.
The Fairmount Line had by far the lowest ridership of any route in the MBTA commuter rail system, with 376 riders inbound and 413 outbound in the 2012 counts. Of these riders, 80.1% inbound rode AM peak trains and 78.9% outbound rode PM peak trains. Another 7.2% rode the first inbound train of the day, which was due at South Station at 6:15 AM but was not classified as a peak train in the published schedule.
This is the only commuter rail line located entirely within Boston city limits. It currently has four stations, excluding South Station. Readville, the outermost station on the line, is also served by Franklin Line trains routed to South Station via Back Bay. Ridership on the Fairmount Line has been negatively impacted for the past several years by ongoing construction projects that have required reduced service frequency and longer running times. These projects have included replacement of six bridges and repairs to four others. In the spring of 2012, three additional stations were under construction on the Fairmount Line, with projected completion in 2013, and a fourth new station was under design. Ridership on the line is expected to increase significantly when all of the construction work has been completed. Of the four existing stations on the line, Readville had the highest ridership in the 2012 counts, with 141 inbound boardings, followed by Fairmount, with 123. (Another 189 inbound riders boarding at Readville took Franklin Line trains routed via Back Bay.)
Of the four existing stations on the Fairmount Line, excluding South Station, Uphams Corner and Morton Street are in Zone 1A, so interzone trips are possible only between Readville and Fairmount. The 2012 counts showed only one inbound interzone rider and two outbound, for a two-way rate of 0.4%. Uphams Corner and Morton Street combined had 8 outbound boardings and 11 inbound alightings.
On almost all of the inbound trains on the Fairmount Line, the maximum loads were on board as the trains arrived at South Station. One evening train had a peak load of 5 entering Uphams Corner, but only 1 passenger continuing to South Station. On the majority of outbound trains. maximum loads were on board departing South Station. On 3 trains, the maximum load exceeded the load out of South Station by 1 rider each, and on 1 train the maximum load was 3 greater than at South Station.
When, the 2012 counts were conducted, the first inbound Fairmount Line train, due at South Station at 6:15 AM, was a through train from the Franklin Line. This train had its maximum load approaching South Station, but 3 passengers had alighted before that. The next 4 trains were classified as AM peak trains. Of these, 3 had 1 alighting each before South Station and 1 had no alightings, for an average of 0.8. After the end of the AM peak, excluding Franklin Line trains routed over the Fairmount Line, there were 10 inbound Fairmount Line trains. Of these, 7 had no alightings before South Station and the others had 1, 2, and 5. For all 10 of these trains combined, the average number of alightings before South Station was 0.8.
The 4 Fairmount Line trains departing South Station between 4:30 and 6:30 PM were classified as PM peak trains. Of these, 3 had no boardings after South Station and 1 had 3 boardings, for an average of 0.8. Between the start of service and the start of the PM peak there were 8 outbound Fairmount Line trains, excluding a through-routed Franklin Line train. Of these, 4 had no boardings after South Station, 3 had 1 boarding each, and 1 had 3. The overall average number of boardings after South Station for these 8 trains was 0.8. After the end of the PM peak there were only 2 outbound Fairmount Line trains, of which 1 had 1 boarding after South Station and the other had none.
The Middleborough/Lakeville Line ranked sixth in ridership among the eight South Side lines, with 2,461 riders inbound and 2,545 outbound in the CTPS counts. Of these riders, 72.8% inbound rode AM peak trains and 76.7% outbound rode PM peak trains. Another 9.1% rode the first inbound train of the day, which was due at South Station at 6:15 AM but was not classified as a peak train in the published schedule.
Excluding South Station, the most heavily used stations on the Middleborough/Lakeville Line were Middleborough/Lakeville, with 616 inbound boardings, Bridgewater, with 550, and Holbrook/Randolph, with 338. All of the trains on this line run through. to, or from Middleborough/Lakeville, providing no obvious breakpoints for discussing ridership by segment. However, it is interesting to note that almost half (47.3%) of the inbound boardings took place at the two outermost stations, Middleborough/Lakeville and Bridgewater, combined. Ridership on this line has been negatively impacted recently, including during the time that the counts were conducted, by an emergency tie replacement program that required some temporary service reductions and lengthened running times.
The Middleborough/Lakeville Line had the highest interzone trip rate for the entire commuter rail system, at 9.4% for both directions combined, but several other lines had higher absolute numbers of interzone trips. About one-third of the interzone activity was accounted for by trips to or from Quincy Center Station. These would have included some transfers to or from the Red Line or buses. The 2008–09 survey results for passengers alighting from Middleborough/Lakeville trains at Quincy Center included some responses from passengers making such transfers, but the sample size was too small to allow statistically significant conclusions about the relative importance of transfers and final exits. The 1998 passenger survey on this line, which obtained a much larger sample of passengers alighting at Quincy Center from a larger all-day total, showed that at that time 46% of the riders alighting there were transferring to the Red Line and 9% to MBTA buses. About one-third of those transferring to the Red Line were going to JFK/UMass Station, which is now served directly by most Middleborough/Lakeville Line trains. Most of the rest were going to Red Line stations in Quincy.
In the 2012 counts, JFK/UMass Station, in Zone 1A, had 6.4% of the inbound alightings but only 3.1% of the outbound boardings on the Middleborough/Lakeville Line. Ridership at this station is made up largely of students going to or from UMass Boston or Boston College High School. Most inbound AM peak trains on the Middleborough/Lakeville Line stop at JFK/UMass, but there is very limited outbound service on that line during the afternoon hours, when some students would be going home. Imbalances between all-day inbound alightings and outbound boardings indicate that some of the JFK/UMass alighting passengers make their outbound trips using other alternatives, such as taking the Red Line to South Station and boarding outbound Middleborough/Lakeville trains there after a stopover in downtown Boston.
At the time of the 2012 counts, all service on the Middleborough/Lakeville Line was provided by trains running between Middleborough/Lakeville Station and South Station. All trains in both directions stopped at all stations between Middleborough/Lakeville and Holbrook/Randolph, inclusive. The Braintree, Quincy Center, and JFK/UMass stations were served in various combinations by some, but not all, Middleborough/Lakeville trains. There was more variation in the location of the maximum load point on this line than there was on most of the other lines in the system. On 6 of the 12 inbound weekday trains, the maximum loads were on board leaving Holbrook/Randolph Station, with the next stop being either Braintree or Quincy Center. Three trains had peak loads leaving Montello Station, and 1 each had peak loads leaving Campello, Brockton, and Braintree. However, on each train where the maximum load occurred at a location other than leaving Holbrook/Randolph, it exceeded the load there by only 1 to 3 passengers.
The maximum load points on outbound Middleborough/Lakeville Line trains showed similar variation in location. Of the 12 outbound weekday trains, 6 had maximum loads leaving Quincy Center, 2 each had maximum loads leaving Holbrook/Randolph and JFK/UMass, and 1 each had maximum loads leaving South Station and Montello. On the trains with maximum loads leaving Holbrook/Randolph, these loads exceeded those leaving Quincy Center by 4 and 7. The train with the maximum load leaving Montello, did not stop at Quincy Center, but the load leaving Montello exceeded the load leaving Braintree by 11. Because of the turnover in riders at Braintree, Quincy Center, and JFK/UMass, it is necessary to have ridership totals there as well as at South Station to be sure of finding the maximum loads on all trains. When the 2012 counts were conducted, the first inbound Middleborough/Lakeville train of the day, due at South Station at 6:15 AM, was classified as an off-peak train. It had only 2 alightings before Braintree. The next 4 trains were classified as AM peak trains. The first 3 of these stopped at Quincy Center but not Braintree, and the last stopped at Braintree but not Quincy Center. Alightings from these trains before Quincy Center or Braintree ranged from 6 to 11, with an average of 8.5. During the rest of the day, there were 7 inbound Middleborough/Lakeville trains of which 2 stopped at both Quincy Center and Braintree, 2 at Quincy Center but not Braintree, and 3 at Braintree but not Quincy Center. On 6 of these, alightings before Braintree ranged from 4 to 15 per train, with an average of 8.3. The train leaving Middleborough/Lakeville at 4:54 PM had 31 alightings before Braintree, with Bridgewater Station accounting for the largest share of boardings for these trips.
The 4 Middleborough/Lakeville trains departing Boston between 3:38 and 5:57 PM were classified as PM peak trains. All of these stopped at Quincy Center but not Braintree. On 3 of these there were only 3 or 4 boardings after Quincy Center, but the train leaving Boston at 4:40 PM had 24 such boardings. Between the start of service and the start of the PM peak there were 5 outbound trains on the Middleborough/Lakeville Line, of which 1 stopped at both Quincy Center and Braintree, 3 stopped at Quincy Center but not Braintree, and 1 stopped at Braintree but not Quincy Center. Boardings after Braintree on these trains ranged from 4 to 16, with an average of 10. After the end of the PM peak there were 3 outbound trains on the Middleborough/Lakeville Line, all of which stopped at Quincy Center but not Braintree. Boardings after Quincy Center on these trains ranged from 1 to 5, with an average of 2.3.
The Kingston/Plymouth Line ranked fifth in ridership among the 8 South Side lines, with 2,802 riders inbound and 2,711 outbound in the CTPS counts. Of these riders, 93.3% inbound rode AM peak trains and 78.8% outbound rode PM peak trains. The high concentration of ridership on inbound AM peak trains was partly a reflection of the relatively limited off-peak service provided on this line.
Excluding South Station, the most heavily used stations on the Kingston/Plymouth Line were Kingston, with 682 inbound riders, Abington, with 572, Whitman, with 415, and South Weymouth, with 413. All trains on the Kingston/Plymouth Line run through, to, or from either Kingston or Plymouth, providing no obvious breakpoints for discussing ridership by segment. Nearly half (47.2%) of the inbound boardings took place at the four outermost stations (Plymouth, Kingston, Halifax, and Hanson). Ridership on this line has been negatively impacted recently, including during the time that the counts were conducted, by an emergency tie replacement program that required some temporary service reductions and lengthened running times.
Plymouth Station, which had no inbound AM peak service and only one outbound train in the PM peak, had only 21 inbound boardings and 22 outbound alightings all day. Three of the four outbound Plymouth trains ran first to Kingston Station, which is on a separate branch that requires a back-up move before continuing to Plymouth. This added 24 to 25 minutes to the running time to Plymouth compared with a trip omitting Kingston.
The Kingston/Plymouth Line had the second-highest interzone trip rate among South Side lines, at 5.5%. Another 6.5% of the inbound alightings and outbound boardings on this line were made at JFK/UMass Station. Most of the interzone trips were to or from Braintree Station, and many of them were probably by riders transferring to or from the Red Line rather than having final destinations in the station vicinity. The 2008–09 survey did not get a large enough sample of passengers alighting at Braintree to determine egress modes, but the 1998 survey showed that 60% of the Kingston/Plymouth Line passengers alighting at Braintree were transferring to the Red Line. Of these, 80% were going to other Red Line stations in Quincy and only 13% to JFK/UMass.
At the time of the 2012 counts, 8 of the 12 round-trips on this line ran between Kingston and Boston without serving Plymouth. Another 3 trips ran outbound from Boston to Plymouth with a side trip to Kingston on the way, but returned to Boston from Plymouth without stopping at Kingston. One round-trip ran between Boston and Plymouth without serving Kingston in either direction. On 9 of the inbound trains, the maximum loads were on board leaving South Weymouth. For 8 of these the next stop was Braintree, but for 1 it was JFK/UMass. On 2 trains, the maximum loads were departing Braintree, and on 1 it was departing Abington. Because of the turnover in riders at Braintree, Quincy Center, and JFK/UMass, it is necessary to have ridership totals there as well as at South Station to calculate maximum loads. If these loads occur north of Braintree, the calculations will show that. On the train that had its maximum load leaving Abington, the load there was only 2 greater than the load leaving South Weymouth. On 8 of the outbound Kingston/Plymouth Line trains, the maximum load point was leaving Braintree. On the other 4 it was leaving South Station.
When the 2012 counts were conducted, the first 5 inbound trains of the day were classified as AM peak trains. Each of these trains had either 1 alighting or none before Braintree, for an average of 0.4. During the rest of the day alightings before Braintree ranged from 0 to 4, with an average of 2.4.
The 4 Kingston/Plymouth trains departing South Station between 4:20 and 6:20 PM were classified as PM peak trains. Three of these stopped at Braintree but not Quincy, and 1 stopped at both. Boardings after Braintree on these trains ranged from 0 to 2, with an average of 1.3. Between the start of service and the start of the PM peak there were 5 outbound trains on the Kingston/Plymouth Line. Boardings after Braintree on these trains ranged from 1 to 5, with an average of 3.4. After the end of the PM peak there were 3 outbound trains, none of which had any boardings after Braintree. For trains that ran to Plymouth with a side trip to Kingston, passengers who boarded at Kingston, remained on board at Plymouth, and traveled inbound, were counted as inbound Kingston boardings.
The Greenbush Line ranked second-lowest in ridership among South Side lines and in the entire commuter rail system, with 2,191 riders inbound and 2,162 outbound. Of these riders, 92.9% inbound rode AM peak trains, and 88.0% outbound rode PM peak trains. These high concentrations reflect the limited amount of off-peak service operated on the line. The most heavily used stations on the line were East Weymouth, with 464 inbound riders, Greenbush, with 405, and North Scituate, with 336. This line attracts riders from the same towns as the Hingham commuter boat. Weather conditions can significantly impact the relative ridership shares of these two services, with good weather favoring the boat and bad weather favoring the train.
All trains on the Greenbush Line run through, to, or from Greenbush, providing no obvious breakpoints for discussing ridership by segment. Slightly over half (53.0%) of the total daily boardings took place at the four outermost stations—Greenbush, North Scituate, Cohasset, and Nantasket Junction.
The interzone trip rate on the Greenbush Line was below the South Side average, at 2.5% for both directions combined. Quincy Center Station alone was the inner endpoint for 1.4% of all trips on the line. Many of these probably included transfers to or from the Red Line or buses. The 2009 passenger survey on this line was the first survey taken after it opened in 2007, but the sample of passengers alighting at Quincy Center was too small to allow reliable conclusions about their egress modes.
In the 2012 counts, JFK/UMass Station, in Zone 1A, had 12.0% of the inbound alightings but only 7.6% of the outbound boardings on the Greenbush Line. Only two trips on this line in each direction stopped at JFK/UMass. For many of the students who used this station to go to UMass Boston or Boston College High School in the morning, the earlier of the two outbound trips, at 4:06 PM, would have been too late to use conveniently. They may have taken the Red Line inbound to South Station or outbound to Quincy Center to connect with an earlier Greenbush train.
At the time of the 2012 counts, all 12 round-trips on the Greenbush Line ran all the way between Greenbush and Boston. All but 2 of the inbound trains and 3 of the outbound trains stopped at Quincy Center. For 6 of the inbound trains, the maximum load was on board leaving Weymouth Landing, with the next station being Quincy Center, JFK/UMass, or South Station. The other 6 had maximum loads leaving Quincy Center. Outbound maximum loads were leaving Quincy Center outbound on 6 trains, leaving South Station on 3 trains, and leaving JFK/UMass on 2 trains. On 1 outbound train the maximum load point was Weymouth Landing, but the volume there exceeded that at South Station (the only preceding stop) by only 2. Because of the turnover in riders at Quincy Center and JFK/UMass, it is necessary to obtain ridership totals there as well as at South Station to calculate maximum loads. If these loads occur north of Quincy Center ,the calculations will show that.
When the 2012 counts were conducted, the first 5 inbound trains of the day on this line were classified as AM peak trains. All but 1 of these stopped at Quincy Center. Alightings before Quincy Center ranged from 0 to 4, with an average of 1.8. During the rest of the day, alightings before Quincy Center ranged from 0 to 4, with an average of 1.1
The 5 Greenbush trains departing South Station between 4:00 and 6:38 PM were classified as PM peak trains. Boardings on these trains after Quincy Center ranged from 3 to 6, with an average of 3.8. The largest share of these boardings took place at Weymouth Landing. Between the start of service and the start of the PM peak there were 5 outbound trains on the Greenbush Line. Boardings on these trains after Quincy Center ranged from 0 to 3, with an average of 1.6. After the end of the PM peak there were 2 outbound trains, of which 1 had no boardings after Quincy Center and the other had 2.
Published ridership figures for the commuter rail system usually include only inbound boardings. This significantly understates the importance of stations that are used predominantly for inbound alightings and outbound boardings, and does not provide any information on ridership at the inner terminal stations. All South Side lines terminate at South Station. The 2012 counts showed a total of 19,942 inbound alightings and 21,772 outbound boardings there, making it by far the most heavily used station in the commuter rail system. The counts did not include riders on Amtrak intercity trains that also terminate there.
All North Side lines terminate at North Station. The 2012 counts showed a total of 16,321 inbound alightings and 16,436 outbound boardings there, making it the second most heavily used station in the commuter rail system. As at South Station, the counts did not include riders on Amtrak intercity trains that terminate at North Station.
Back Bay Station is served by four of the eight South Side lines. It had a combined total of 407 inbound boardings and 408 outbound alightings in the 2012 counts, but had 9,156 inbound alightings and 7,588 outbound boardings. This made it the third-most-heavily used station in the commuter rail system.
Published ridership figures that show only inbound boardings also substantially understate the usage at several other stations in fare Zone 1A. Although all of them have much lower ridership than South Station, Back Bay, or North Station, they are nevertheless much more important than the inbound boardings alone reveal.
On the South Side lines, Yawkey, Ruggles, and JFK/UMass are three such stations. In absolute numbers, in the 2012 counts, Yawkey had 446 inbound alightings and 349 outbound boardings, compared with 13 inbound boardings and 19 outbound alightings. (These counts were done on a day when there was no ballgame at Fenway Park.) At Ruggles Station, the three lines stopping there had a combined 1,392 inbound alightings and 1,673 outbound boardings, versus 17 inbound boardings and 38 outbound alightings. At JFK/UMass Station, the three lines stopping there had a combined 602 inbound alightings and 419 outbound boardings, but only 2 inbound boardings and 2 outbound alightings.
On the North Side, Malden Center Station, on the Haverhill Line, had only 16 inbound boardings in the 2012 counts, but had 182 inbound alightings and 86 outbound boardings. Porter Square Station, on the Fitchburg Line, had 281 inbound boardings and 209 outbound alightings, but had 1,600 inbound alightings and 1,335 outbound boardings.
Appendix B: Tables of Estimated All-Day Trips from Each Station to Each Other Station on the Same Line
This appendix consists of a series of summary tables that show, for each commuter rail line, all-day station-to-station trip totals estimated from the boarding and alighting counts. The estimation method is described in the subsection Station-to-Station Ridership Estimates within section 5.4 of this memorandum. These tables are arranged in the same counterclockwise geographical order used in the text of this memorandum. For all but one of the commuter rail lines, there are two pages of tables, one for each direction; for the Fairmount Line, the tables for both directions are on a single page.
The tables in this appendix are not in a screen-readable format. If you need assistance accessing the data in these tables, please contact CTPS via email at publicinformation@ctps.org.
Appendix C: MBTA Commuter Rail stations by Fare-Zone
Station |
Fare Zone |
Fitchburg |
8 |
North Leominster |
8 |
Shirley |
8 |
Ayer |
8 |
Littleton/Route 495 |
7 |
South Acton |
6 |
West Concord |
5 |
Concord |
5 |
Lincoln |
4 |
Silver Hill |
3 |
Hastings |
3 |
Kendal Green |
3 |
Brandeis/Roberts |
2 |
Waltham |
2 |
Waverly |
1 |
Belmont |
1 |
Porter Square |
1A |
North Station |
1A |
Station |
Fare Zone |
Lowell |
6 |
North Billerica |
5 |
Wilmington |
3 |
Anderson/Woburn |
2 |
Mishawum |
2 |
Winchester Center |
1 |
Wedgemere |
1 |
West Medford |
1A |
North Station |
1A |
Station |
Fare Zone |
Haverhill |
7 |
Bradford |
7 |
Lawrence |
6 |
Andover |
5 |
Ballardvale |
4 |
North Wilmington |
3 |
Reading |
2 |
Wakefield |
2 |
Greenwood |
2 |
Melrose Highlands |
1 |
Melrose/Cedar Park |
1 |
Wyoming Hill |
1 |
Malden Center |
1A |
North Station |
1A |
Station |
Fare Zone |
Newburyport |
8 |
Rowley |
7 |
Ipswich |
6 |
Hamilton/Wenham |
5 |
North Beverly |
5 |
Rockport |
8 |
Gloucester |
7 |
West Gloucester |
7 |
Manchester |
6 |
Beverly Farms |
5 |
Prides Crossing |
5 |
Montserrat |
4 |
Beverly |
4 |
Salem |
3 |
Swampscott |
3 |
Lynn |
2 |
Riverworks |
2 |
Chelsea |
1A |
North Station |
1A |
Station |
Fare Zone |
Worcester/Union Station |
8 |
Grafton |
8 |
Westborough |
7 |
Southborough |
6 |
Ashland |
6 |
Framingham |
5 |
West Natick |
4 |
Natick |
4 |
Wellesley Square |
3 |
Wellesley Hills |
3 |
Wellesley Farms |
3 |
Auburndale |
2 |
West Newton |
2 |
Newtonville |
1 |
Yawkey |
1A |
Back Bay |
1A |
South Station |
1A |
Station |
Fare Zone |
Needham Heights |
2 |
Needham Center |
2 |
Needham Junction |
2 |
Hersey |
2 |
West Roxbury |
1 |
Highland |
1 |
Bellevue |
1 |
Roslindale Village |
1 |
Forest Hills |
1A |
Ruggles |
1A |
Back Bay |
1A |
South Station |
1A |
Station |
Fare Zone |
Forge Park/495 |
6 |
Franklin/Dean College |
6 |
Norfolk |
5 |
Walpole |
4 |
Plimptonville |
4 |
Windsor Gardens |
4 |
Norwood Central |
3 |
Norwood Depot |
3 |
Islington |
3 |
Dedham Corporate Center |
2 |
Endicott |
2 |
Readville |
2 |
Hyde Park |
1 |
Ruggles |
1A |
Back Bay |
1A |
South Station |
1A |
Station |
Fare Zone |
Readville |
2 |
Fairmount |
1 |
Morton Street |
1A |
Uphams Corner |
1A |
South Station |
1A |
Station |
Fare Zone |
Wickford Junction |
10 |
T.F. Green |
9 |
Providence |
8 |
South Attleboro |
7 |
Attleboro |
7 |
Mansfield |
6 |
Sharon |
4 |
Stoughton |
4 |
Canton Center |
3 |
Canton Junction |
3 |
Route 128 |
2 |
Hyde Park |
1 |
Ruggles |
1A |
Back Bay |
1A |
South Station |
1A |
Station |
Fare Zone |
Middleborough/Lakeville |
8 |
Bridgewater |
6 |
Campello |
5 |
Brockton |
4 |
Montello |
4 |
Holbrook/Randolph |
3 |
Braintree |
2 |
Quincy Center |
1 |
JFK/Umass |
1A |
South Station |
1A |
Station |
Fare Zone |
Plymouth |
8 |
Kingston |
8 |
Halifax |
7 |
Hanson |
6 |
Whitman |
5 |
Abington |
4 |
South Weymouth |
3 |
Braintree |
2 |
Quincy Center |
1 |
JFK/Umass |
1A |
South Station |
1A |
Station |
Fare Zone |
Greenbush |
6 |
North Scituate |
5 |
Cohasset |
4 |
Nantasket Junction |
4 |
West Hingham |
3 |
East Weymouth |
2 |
Weymouth Landing/East Braintree |
2 |
Quincy Center |
1 |
JFK/Umass- |
1A |
South Station |
1A |
Appendix D: Glossary of terms and data sources
CTPS 2012 passenger counts: The CTPS counts were conducted between January and June 2012 and included the numbers of passengers boarding and alighting from each train in each direction at each station on each line on one weekday; the exception was peak-period trains at North Station and South Station in Boston. Inbound AM peak alightings for a train at North and South Stations were calculated as the difference between total inbound boardings and total inbound alightings at all other stations on the train’s route. Similarly, outbound PM peak boardings for a train at North and South Stations were calculated as the difference between outbound boardings and outbound alightings at all other stations on the train’s route.
The individuals, or “counters,” hired by CTPS to conduct the 2012 passenger counts stood either on the train or on the platform and counted the number of passengers who boarded and alighted using hand-held mechanical devices that tally the number of times the counter clicks the device. The tallies were then recorded as boardings and alightings on a sheet of paper that indicated the name of the commuter rail line, the station, the train number, the scheduled arrival time, the observed arrival time, and the direction of the train, the number of boardings, and the number of alightings.
Direct counts: The CTPS 2012 passenger counts and the MBCR peak-period passenger counts are “direct counts,” as the actual number of passengers is counted rather than estimated.
Fare zones: The commuter rail system has a zone-fare structure with zone limits based more or less on the distance by rail from each station to North Station or South Station in Boston. Most zones include stations on more than one line.
Interzone trips: Trips that are not to, from, or via North Station, South Station, Back Bay Station, or another station in fare Zone 1A are considered interzone trips.
Massachusetts Bay Commuter Railroad (MBCR) Company: MBCR currently operates the commuter rail system under contract to the MBTA.
MBCR conductor headcounts (or conductor counts): Conductors are required to file headcount reports showing the total number of passengers on each trip each day, but these are usually rough estimates based on visual scans of the passengers on the train rather than direct counts, as the conductors do not use hand-held mechanical tally devices and are generally quite busy with their usual responsibilities of collecting tickets and monitoring doors at stops.
MBCR peak-period passenger counts: Direct counts of passengers at selected stations during peak hours are conducted for MBCR by consultants twice each year (during the spring and fall). These counts include passenger alightings from each inbound train during AM peak hours and passenger boardings on each outbound train during PM peak hours at North Station, South Station, Back Bay, and seven other stations where commuter rail lines connect directly with rapid transit lines. The latter stations are Malden Center and Porter Square on the North Side, and Ruggles, Yawkey, JFK/UMass, Quincy Center, and Braintree on the South Side. Similarly to the CTPS counts, the MBCR peak-period counts are conducted by individuals who stand on the platform and use hand-held mechanical devices to count the passengers directly.
MBCR Train Audits: MBCR conductors conduct Train Audits a few times each year, counting the number of riders by fare-payment type boarding each inbound train at each station on one weekday, one Saturday, and one Sunday in a given month. Assuming that these are done on days with average ridership, multiplying them by the respective number of weekdays, Saturdays, and Sundays in the audit month should provide monthly inbound ridership totals. Conductors complete these passenger counts as they collect the fares.
Monthly ticket and pass sales figures: Monthly reports of onboard ticket sales show the number of transactions and the total dollar amount of sales; they do not indicate the number of one-way, round-trip, or multipassenger tickets sold, nor do they indicate the number of tickets by zone. A ticket sold on board a train can be for a one-way trip or a round-trip by one person or for one-way or round-trips by several people traveling together, but the monthly sales figures do not distinguish among these. Reports for most forms of off-train ticket sales show the number of passenger trips by zone that they represent but do not include breakdowns of weekday versus weekend travel. Monthly passes offer an unlimited number of rides. Therefore, because none of the sales figures provide the information required to determine ridership directly, the MBTA Revenue Department applies factors to the number of sales of each type to estimate the total number of rides that they represent.
Pass-use rates: About two out of every three commuter rail riders use prepaid monthly passes that allow unlimited riding within the zones for which they are valid. The frequency with which a pass holder rides commuter rail using an unlimited-ride pass is the pass-use rate. The actual number of trips made by pass users must be estimated by applying assumptions regarding the pass-use rate. These assumptions are generally developed through customer surveys that ask questions about pass usage.
Appendix E: Line-by-Line Schedules
The schedules in this appendix are not in a screen-readable format. If you need assistance accessing this information, please contact CTPS via email at publicinformation@ctps.org.
1 A description of each type of data can be found in Appendix D, Glossary of Terms, and a full explanation of the various types of commuter rail passenger count methodologies can be found in section 6 of this memorandum, Limitations of Other Commuter Rail Ridership Information Sources.