TECHNICAL MEMORANDUM
TO: Boston Region Metropolitan Planning Organization
FROM: Erin Maguire and Shravanthi Gopalan Narayanan
RE: Freight Decarbonization Strategies in the North Suffolk Area
Conversations between the Boston Region Metropolitan Planning Organization (MPO) staff, the City of Chelsea, and the North Suffolk Office of Resilience and Sustainability (NSORS) revealed a need for investigating the environmental and economic considerations of enhancing sustainability in the local freight and industrial sectors. MPO staff, with support from the Metropolitan Area Planning Council (MAPC), worked with the City of Chelsea and surrounding communities to explore and incorporate the perspectives of diverse stakeholders in this study. We reviewed existing literature on freight decarbonization strategies and ongoing developments in the North Suffolk area, in addition to conducting stakeholder engagement with municipalities, community-based organizations, and industry actors.
A summary of key findings and recommendations are listed below, followed by a full discussion of the study.
Key Current Challenges
Three key current challenges have been identified through stakeholder interviews:
Decarbonization Strategies
The literature review and stakeholder engagement has highlighted a need to focus on the following decarbonization strategies to address the key challenges highlighted above:
Next Steps
Drawing on the findings, two major avenues for follow-up work to build on this study and keep making progress towards decarbonizing the freight sector are outlined:
The idea for this study originated in conversations with the City of Chelsea and the North Suffolk Office of Resilience and Sustainability. These conversations highlighted the need for more nuanced research on the various environmental and economic considerations of enhancing sustainability in the local freight and industrial sectors, including the existing burdens faced by communities.
MPO staff, with support from the Metropolitan Area Planning Council, worked with the City of Chelsea and surrounding communities to define the study area and explore and incorporate the perspectives of municipalities, businesses, advocates, and environmental justice (EJ) stakeholders throughout the study’s development. This memorandum discusses existing conditions in the study area and strategies for the decarbonization of freight based on stakeholder input, a preliminary data analysis, and a literature review. The intent of this work is to lay a foundation for future research and initiatives to take actions to achieve local, state, and national decarbonization goals.
This memorandum summarizes the results of the Federal Fiscal Year (FFY) 2023 Unified Planning Work Program study #13808, the Sustainability and Decarbonization in the Freight and Logistics Sector in the North Suffolk Area study. The work scope for this study was approved by the Boston Region MPO board on November 3, 2022.
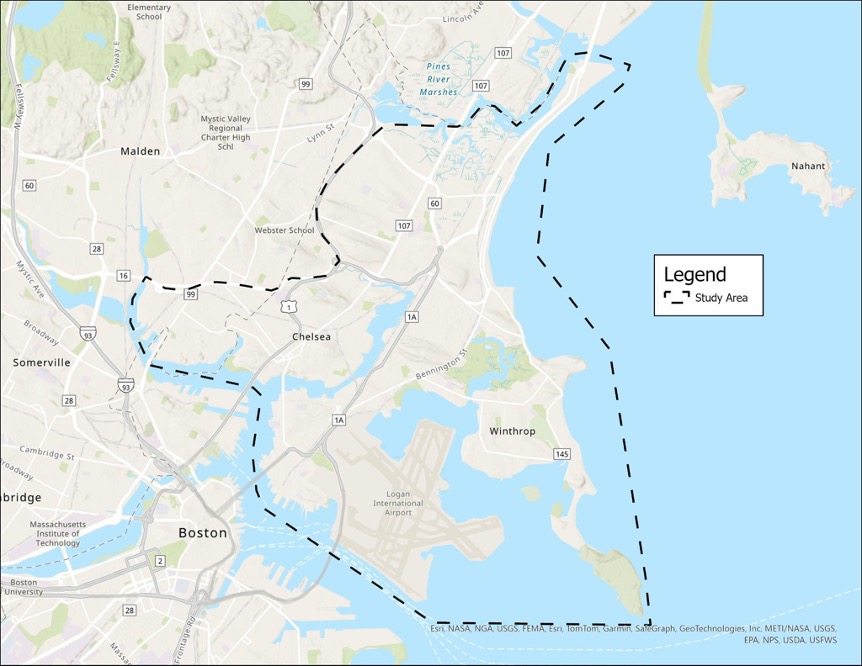
The study area, seen in Figure 1, contains northern Suffolk County and a small part of southern Middlesex County, including portions of Chelsea, Everett, Revere, East Boston, and Winthrop. The study area sits at an important and complex intersection of disadvantaged communities and long-standing industry and related infrastructure, all of which face various challenges related to climate change.2
Figure 1
North Suffolk Study Area
Source: Central Transportation Planning Staff.
The study area’s population has a high concentration of EJ communities.3 According to NSORS’s North Suffolk Zero Carbon Action Plan (ZCAP), 85 percent of Chelsea, Revere, and Winthrop’s population lives within an EJ census block. The total study area is home to approximately 158,000 residents, of which approximately 60 percent identified as minorities and 30 percent reported having a limited English proficiency.
The area’s navigable waterways include the Mystic River, Chelsea Creek, and Boston Harbor. The study area includes commuter and freight rail lines, Interstates 90 and 93, and Routes 1, 1A, 16, and 99.
The transportation sector, including freight and industry activities, is part of a complex system that was developed with a reliance on carbon-based fuels and products such as petroleum, gasoline, and diesel. Cross-jurisdictional agencies from across the nation have outlined plans to achieve carbon neutrality, commonly by 2050. To achieve this, collaborative and innovative strategies are required to collectively promote sustainability and decarbonization. In this study, we were focused on exploring approaches aimed at reducing vehicular and transportation-related greenhouse gas (GHG) emissions. This includes fleet and infrastructure electrification, promotion of mode shift, investment in rail and transit, and other policy efforts.
The City of Chelsea, in partnership with the Town of Winthrop and City of Revere, launched the regional NSORS in 2021 with funding from the Barr Foundation. In the same year, the City received a grant from the State to support the development of the first ZCAP. Through a regional planning process, NSORS created a regional climate action plan to reduce carbon pollution, improve community health, and mitigate the impacts of climate change. The strategies included in this plan are centered on local and regional actions to reduce GHG emissions. Recommendations in the plan include improving building codes and creating a safer environment for walking, bicycling, and transit use to help reduce the carbon footprint in the area.
The body of work presented in this memorandum functions to document the experiences and needs of communities living near freight activity. Similar regional studies have discussed concerns about pollution. The North Suffolk Public Health Collaborative’s 2022 Community Health Needs Assessment Report notes that “participants, particularly in Chelsea and Winthrop, pointed out the impact of toxins and pollutants on air quality in their communities.”4
The freight and logistics sector in the study area includes major distribution hubs for various product types and services, including cargo, food, scrap metal, liquid fuel, e-commerce, and livery services. For the purpose of this study, transportation-related freight and related industrial activities are defined as the transportation of bulk goods by truck, air, sea, or train and the facilities that freight vehicles operate out of.5 Local freight companies provide last-mile connections to transport goods, such as e-commerce purchases, directly to consumers and food and merchandise to grocers and retailers. These trips are conventionally serviced with medium-duty vehicles such as step vans. These local trips are contrasted with long-haul freight transportation, which uses heavy-duty vehicles to connect the study area with the New England region as a whole.
A simplified model of freight movements in the North Suffolk study area can be seen in Figure 2. Operations rely on freight modes including air, truck, and rail transportation. According to the Federal Highway Administration’s (FHWA) Freight Analysis Framework, more than 75 percent of all freight movement in Massachusetts in 2019 was by truck and 2.5 percent was by rail.6
Figure 2
Simplified Model of Freight Activity
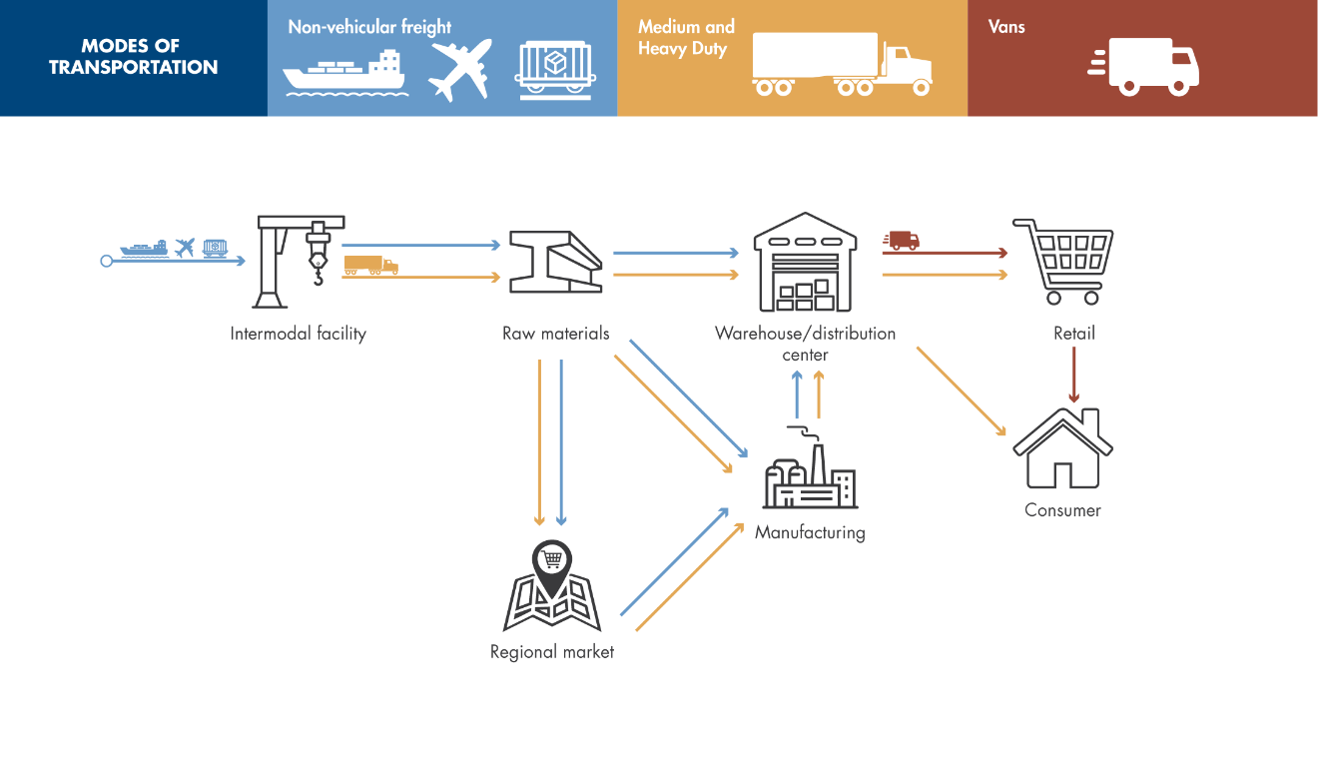
Source: Central Transportation Planning Staff.
The freight corridors and infrastructure in the study area can be seen in Figure 3. MPOs, in coordination with the State, are responsible for designating Critical Urban Freight Corridors (CUFC), or public roads in urbanized areas that provide access and connection to the primary freight network, ports, public transportation, or intermodal transportation facilities. In Everett, Alford Street, Broadway, Beacham Street, and 2nd Street have been identified as CUFCs. In Chelsea, Williams Street, Marginal Street, Eastern Avenue, and the Chelsea Street Bridge have been identified. In East Boston, Chelsea Street and its connections to Route 1A and the Coughlin Bypass Road are also CUFCs.
Figure 3
Freight Corridors and Infrastructure in Study Area
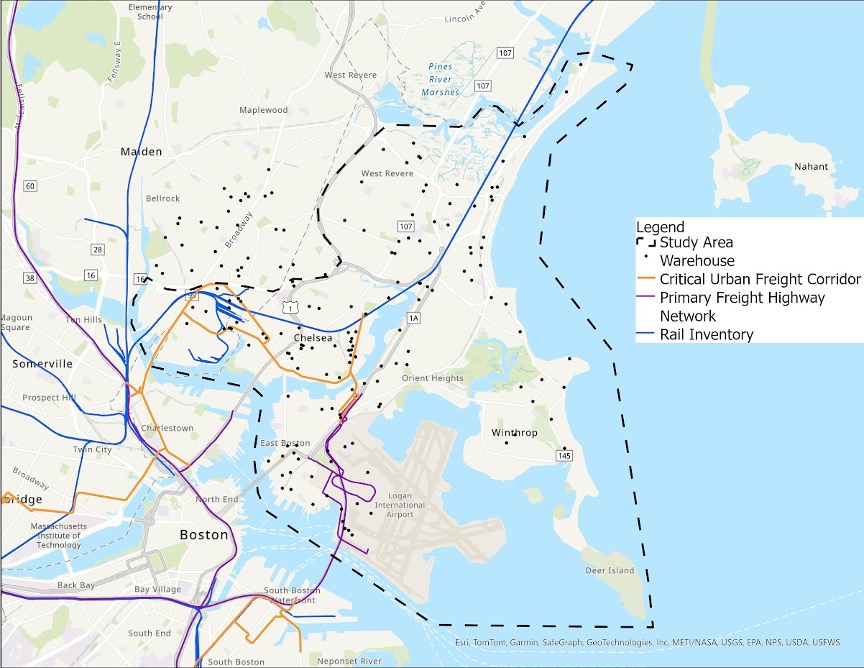
Source: Central Transportation Planning Staff.
Rail infrastructure is present south of Route 16 in Everett, which extends from the Mystic River, through Everett, into Chelsea along the Island End River and north through Revere parallel to Route 1A. CSX operations serve the New England Produce Center in Chelsea and Everett, as well as a construction aggregate facility, cold storage warehouse, and recycling facility in the Mystic River Designated Port Area (DPA). Other industrial sites that currently benefit from rail access include Schnitzer Steel Recycling, Quebec Cement, and Preferred Freezer Services. Notably, there is no rail infrastructure that connects directly to the airport; however, there are unused railroad rights-of-way that could potentially provide connections. Goods that travel through air cargo can be of high priority or be time-sensitive, which would necessitate the use of vehicular freight travel.
General Edward Lawrence Logan International Airport, owned and operated by the Massachusetts Port Authority (Massport), is a significant economic engine for the New England region. The airport has six on-site air-to-truck facilities to support freight activity. The economic activity generated by the airport has resulted in its strong influence over the surrounding area, attracting a large amount of industrial business activity. According to the Massachusetts Department of Transportation’s 2019 Massachusetts Statewide Airport Economic Impact Study Update, Logan Airport supported approximately 162,000 jobs and generated more than $16 billion annually.7
The airport is “one of the most land-constrained” in the United States. 8 It is considered an origin and destination (O&D) airport, where an estimated 90 percent of passenger air trips begin or end, resulting in a large demand for pick-up and drop-off services and long-term parking. This percentage is much higher than O&D rates of other connecting airports, such as Chicago O’Hare. Boston Logan Airport is ranked 25th nationally for the total air cargo volume transported in 2021, accounting for 649 million pounds of cargo.
The City of Everett’s waterfront hosts a variety of industrial activities to support maritime commerce. Industrial waterfronts in the study area, which are designated as DPAs under State regulation in contrast to the surrounding municipal land, include the Mystic River DPA, Chelsea Creek DPA, and East Boston DPA.
When asked about future visions for the study area, some business representatives stated that their businesses are unlikely to move elsewhere soon. This is due to the immediate proximity of the airport and the surrounding communities, which offer strong customer and employee pools. Businesses shared that they view many transportation issues, such as congestion, as unavoidable within the study area. In conversations, they said that scheduling and operational policies often account for congestion delays. In practice, they said they would work to improve efficiencies by adjusting employee schedules and scheduling deliveries during non-peak hours.
Municipal representatives within the study area shared their perspectives about the future of industry and freight activity. The City of Chelsea’s economic development goals work to preserve and transform the existing industrial base, while mitigating related externalities. The City of Everett expressed support for developments that capitalize on the use of the limited rail infrastructure. It is important to note that many industrial sites are located within DPAs, which limits the direct influence that municipalities can have on their ports and waterfront.
Community-based and advocacy organizations also shared perspectives about the future of freight and industrial activity in the study area, highlighting the importance of balancing local economic priorities and projected future land use and demographic changes with environmental justice considerations throughout decarbonization processes. Centering engagement, building trust and local support, and grounding decarbonization strategies and policies in holistic environmental and economic justice frameworks is essential to advancing equitable and effective outcomes.
This section discusses some of the existing decarbonization actions taken by industry stakeholders within the study area. Note that this is not a comprehensive account of all the decarbonization activities underway.
The main strategy that industry stakeholders are currently using to achieve decarbonization goals is transitioning to electric or alternative fuel fleets. Stakeholders reported that medium-duty vehicles used for last-mile deliveries, such as step vans, are best suited to run efficiently with current technologies. Challenges that businesses are having with fleet conversions include the heavy weight of electric vehicles, limited fast charging for long-haul trips, and battery range. Industry stakeholders expressed the need for financial programs to incentivize and support fleet replacements.
On March 12, 2024, the U.S. Department of Transportation (USDOT) released a National Zero-Emission Freight Corridor Strategy.9 This strategy outlines four stages between 2024 and 2040 to buildout and connect zero-emissions infrastructure along the National Highway Freight Network. In this strategy, the primary implementation responsibilities are left to state and federal governments, utility companies, industry actors, and communities. Phases One and Two identify key ports and intermodal facilities to focus initial investments on. The intermodal air-to-truck facility in East Boston and the Port of Boston have been included as part of this phase. This strategy is designed to bolster decarbonization efforts of public and private actors alike.
Massport owns and operates Boston Logan Airport and Conley Terminal, located in South Boston. As of 2021, Logan Airport produced 1,739 tons per year of carbon dioxide emissions.10 Massport has set a goal to achieve carbon neutrality by 2031. Efforts to reduce carbon emissions from port facilities and operations include the conversion of Massport’s fleet and equipment, such as shuttles, ground service vehicles, and electric-vehicle-charging stations.
In June 2023, the City of Chelsea released the Eastern Avenue Climate Resilience Vision, funded by the Municipal Vulnerability Preparedness Program. Eastern Avenue, designated as a CUFC, extends from Central Avenue to Crescent Avenue. The project corridor extends from the Chelsea Street Bridge north to Broadway, is contained within the Chelsea Creek DPA, and is the site of a variety of industrial activities. This corridor is vulnerable to coastal flooding. In response to these challenges, the City has proposed two alternatives to incorporate green infrastructure, roadway improvements, and protected pedestrian and bicycle facilities. Short-term proposed improvements include a raised shared-use path, a coastal flood wall, and tree plantings. The long-term vision for this corridor includes the development of a shared community path along the waterfront with raised berms to counteract flooding, in addition to the improvements from the short-term vision.
The themes below document current challenges in the study area, as they were consistent points of interest raised during multiple interviews with community-based organizations, municipalities, and industry stakeholders. A high-level summary of themes from these discussions can be found in Figure 4.
Figure 4
Stakeholder Interview Themes
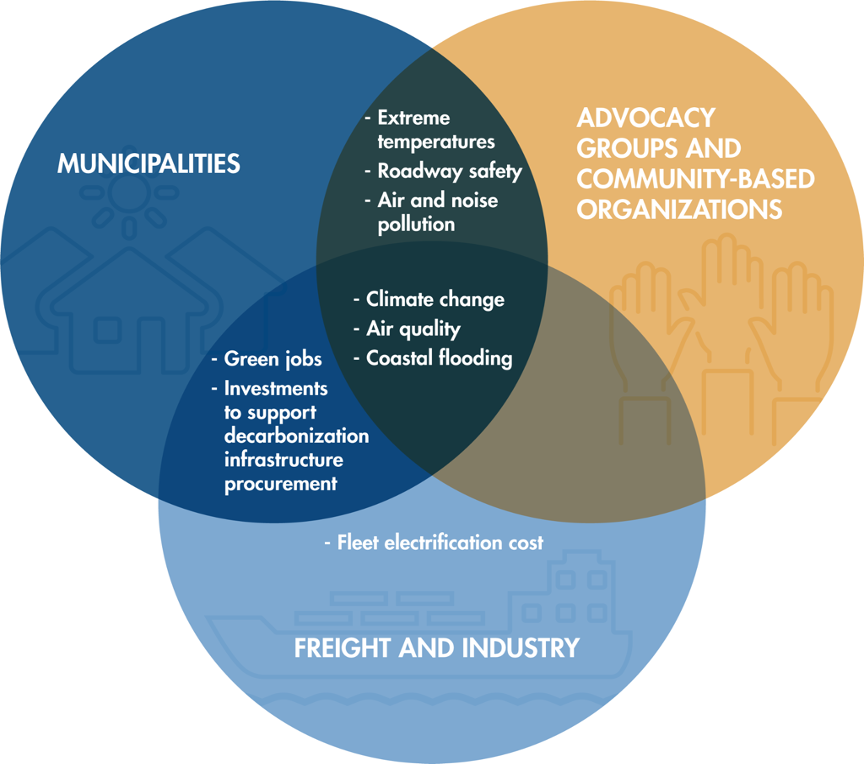
Source: Central Transportation Planning Staff.
Routes 1, 1A, and 16 all experience significant congestion, which contributes to air pollution, noise pollution, road deterioration, and vehicular idling. Stakeholders mentioned that based on their observations, traffic consists of medium- and heavy-duty vehicles travelling locally as well as through traffic connecting to Logan Airport or downtown Boston via the Zakim and Tobin Bridges. Chelsea connects to East Boston across Chelsea Creek through Pearl Street on the Andrew P. McArdle Bridge to the west and the Chelsea Street Bridge to the east. The estimated freight traffic volume for points of interest throughout the study area can be found in Table 1, generated from the MPO’s travel demand model TDM23.12
Table 1
TDM23 Freight Estimates
Location |
Travel Direction |
Jurisdiction |
Estimated Total Volume |
Percent Freight Vehicles |
Route 1A Callahan Tunnel |
NB |
MassDOT |
31,469 |
4.03% |
Route 1A Sumner Tunnel |
SB |
MassDOT |
36,505 |
4.24% |
Route 1 at Lee Burbank Highway |
NB |
MassDOT/ |
23,226 |
7.02% |
Route 1 at Lee Burbank Highway |
SB |
MassDOT/ |
19,960 |
7.82% |
Route 1 at Tobin Bridge |
NB |
MassDOT |
45,295 |
7.6% |
Route 1 at Tobin Bridge |
SB |
MassDOT |
44,391 |
7.86% |
Interstate 90 Exit 137 Off-Ramps |
N/A |
MassDOT/ |
23,609 |
1.9% |
Interstate 90 Ted Williams Tunnel |
EB |
MassDOT |
58,188 |
4.57% |
Interstate 90 Ted Williams Tunnel |
WB |
MassDOT |
53,797 |
4.96% |
Route 16 at Mill Street |
EB |
MassDOT/ |
32,384 |
2.91% |
Route 16 at Mill Street |
WB |
MassDOT/ |
25,043 |
2.58% |
Chelsea Street Bridge |
NB/SB |
Local |
23,115 |
3.99% |
Andrew McArdle Bridge |
NB/SB |
Local |
25,736 |
1.94% |
EB = Eastbound. NB=Northbound. SB=Southbound. WB=Westbound.
Source: MassDOT Road Invemtory Viewer.
The study area contains numerous roadway crash clusters, identified by the Massachusetts Department of Transportation (MassDOT) in its Highway Safety Improvement Program (HSIP).13 The intersections connecting the Chelsea Street Bridge and Andrew McArdle Bridge to Chelsea were identified as Top 5 Percent Intersection Crash Clusters from 2018 to 2020. Roadways with additional crash clusters are identified in Table 2.
Table 2
Crash Clusters in the Study Area
Roadway with Crash Cluster |
Crash Type |
Municipality |
Broadway |
Pedestrian, Bicycle, and Intersection |
Chelsea |
Everett Avenue |
Pedestrian, Bicycle, and Intersection |
Chelsea |
Park Street |
Pedestrian and Bicycle |
Chelsea |
Washington Avenue |
Pedestrian |
Chelsea |
Webster Avenue |
Pedestrian |
Chelsea |
Sweetser Circle |
Bicycle |
Everett |
Williams Street |
Intersection |
Chelsea |
Marginal Street |
Intersection |
Chelsea |
Eastern Avenue |
Intersection |
Chelsea |
Route 16 (Revere Beach Parkway) |
Pedestrian and Intersection |
Everett and Chelsea |
Broadway |
Pedestrian, Bicycle, and Intersection |
Revere |
Shirley Avenue |
Pedestrian |
Revere |
North Shore Road |
Pedestrian |
Revere |
Winthrop Avenue |
Intersection |
Revere |
Park Avenue |
Pedestrian |
Revere |
Source: Massachusetts Department of Transportation, Top Crash Locations (2024). https://gis.massdot.state.ma.us/topcrashlocations/
The demand for utilizing the roadway network is significant in part due to limited public transit choices. This reliance on vehicular travel results in bottlenecking along the main corridors in the area, increasing congestion, and according to community-based organizations results in vehicles diverting to local or residential roads to bypass congested areas.
In a 2016 study of the Everett-Chelsea industrial area, Central Transportation Planning Staff (CTPS) conducted heavy-duty vehicle counts on roadways and found that between eight and 11 percent of vehicles entering and exiting this area from Routes 1 and 16 were freight trucks. On the local roads, such as Carter Street, Spruce Street, and Arlington Street, this percentage ranges from one to three percent, which is approximately 30 one-way truck trips through these roads a day.14
Community advocates and residents have raised concerns about deteriorating local road conditions in addition to safety for vulnerable roadway users. People walking and biking are exposed to hazards from sharing roadways with trucks and vehicles passing through. High truck traffic volumes, with a large proportion of heavy trucks, can have impacts on roadway conditions.
The study area is expected to be impacted by the urban heat island effect and poor air quality exists there already. This has led to public health concerns about heightened rates of asthma. According to the USDOT, strategies to improve air quality include reducing the distance between destinations through land use planning, converting to a green fleet, and supporting the implementation of clean fuel infrastructure.15
The map in Figure 5 shows the census tracts where EJ populations are at most risk for extreme heat effects. According to the MAPC's Climate Vulnerability in Greater Boston study, Everett, Revere, Chelsea, and East Boston have moderate to extreme vulnerability to high heat. 16 Large, paved, impervious surfaces, such as parking lots and roadways, exacerbate the impacts of extreme temperatures and also increase the area’s susceptibility to flooding. When coupled with limited shade, this worsens the impacts of the urban heat island effect on residents and reduces the resiliency of these communities to climate change.
Figure 5
Boston Region MPO Heat Exposure Percentiles
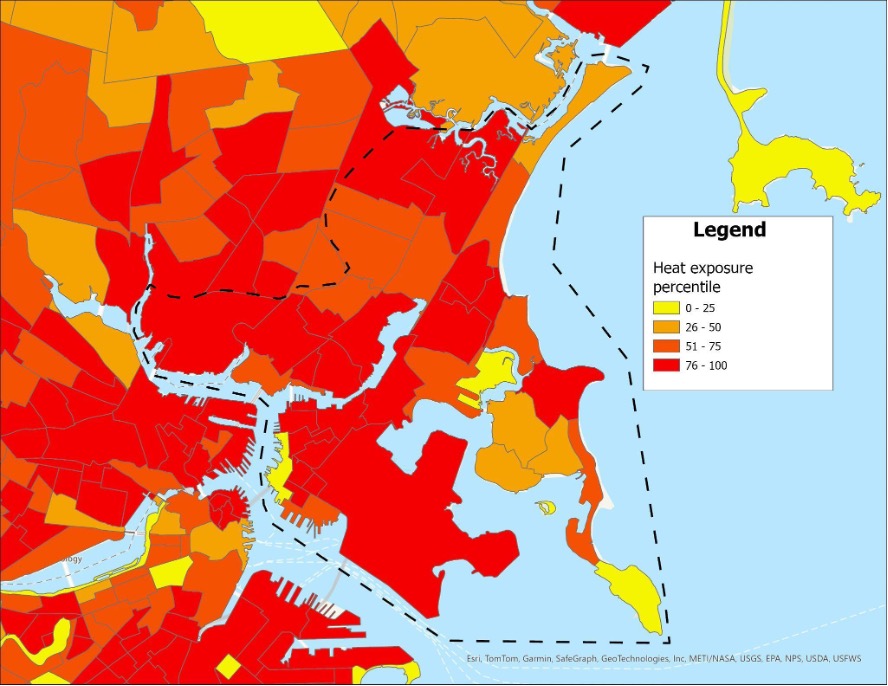
Source: Metropolitan Area Planning Council, "Climate Vulnerability in Greater Boston: Vulnerability to Extreme Heat” (2019). https://climate-vulnerability.mapc.org/
Some advocates suggest limiting the expansion of industrial activities in the study area due to existing health and safety challenges. Local agencies have been exploring ways to begin transitioning the land use within the study area. For example, the Boston Planning and Development Agency (BPDA) is creating redevelopment proposals for the industrial and waterfront portions of East Boston. One proposed adjustment is to expand economic development areas in zoning districts along McClellan Highway (Route 1A) to “support essential economic activity.”17 Similarly, there has been a growing interest in redeveloping the land currently occupied by fuel tank farms, most notably in Everett and Revere. Some property owners have initiated discussions about redevelopment. For example, Exxon has sold its Everett property to the Davis Cos., and the property will be rezoned to accommodate mixed-use and research and development uses, in addition to limited uses for warehousing. Global has sold its Revere complex, but it will be leasing it back for a few years.
Many of the freight and logistics hubs in the area are at risk of coastal flooding due to sea level rise. Businesses in the area have expressed their desire to remain at their current locations, leading to a need to improve the resilience of the roadway network, especially to support the heavy-duty vehicle traffic required for operations levels to be maintained. According to the Massachusetts Coast Flood Risk Model developed by Woods Hole Group, coastal flooding is expected by 2050 along the Mystic River and Chelsea Creek, impacting Everett, Chelsea, and East Boston, as shown in Figure 6. 18
Flood depths are anticipated to range from three to five feet during a 100-year coastal flood event in Everett, west of the Mystic River and in Chelsea, west of the Chelsea Creek. The Mystic Mall, at the head of the Island End River in Chelsea at the Everett city line, is expected to flood to approximately 10 feet during storm surges associated with 100-year coastal flood events. This flooding may impact vital community resources, including the Bunker Hill Community College Chelsea Campus, Chelsea High School, Chelsea Opportunity Academy, Community Health Center: Satellite Center, Excel Academy, New England Produce Center, Mass General Hospital (MGH) Chelsea Healthcare Center, and the Silver Line 3 Chelsea Station. In addition, consistent flooding with depths ranging from three to 10 feet is anticipated along Winthrop’s main roadway connections to the west and north, and in Revere along the Sales Creek, jeopardizing the Revere Fire Department’s Station One.
Figure 6
Coastal Flood Risk by 2050
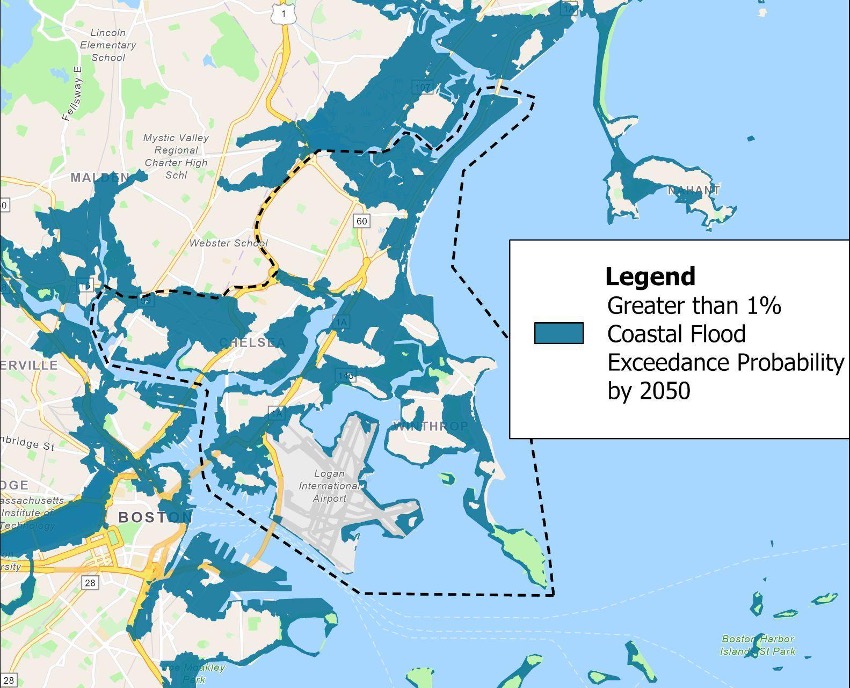
Source: Woods Hole Group, Massachusetts Coast Flood Risk Model (2021).
In an effort to begin responding to these concerns, the City of Chelsea released the Chelsea Creek Municipal Harbor Plan and Designated Port Area Master Plan. These plans document existing conditions along the Chelsea Creek and outline strategies to address transportation challenges, evolving demand on land use, climate change, and pollution.19 As part of its PLAN: East Boston initiative, the BPDA released a phase two study examining the potential impacts of coastal flooding and investments the City of Boston can make to protect against flooding in its 2022 Coastal Resilience Solutions for East Boston and Charlestown (Phase II) report.20 In 2018, the Cities of Chelsea and Everett, and the Town of Winthrop applied for and received a Municipal Vulnerability Preparedness program planning grant from the Massachusetts Executive Office of Energy and Environmental Affairs to conduct a vulnerability assessment and create action-oriented resilience plans.
In 2022, the City of Boston released its Coastal Resilience Solutions for East Boston and Charlestown (Phase II) study. This report outlines resilience strategies for the area’s neighborhoods, squares, and industrial waterfront. Transportation recommendations in residential areas include the addition of crosswalks leading to open spaces, clear visibility of pedestrians at crosswalks, new bikeshare stations, revised intersection geometry, and higher frequency bus and transit services throughout the area. Corridor improvements include optimizing curb space, implementing green infrastructure, and prioritizing the pedestrian experience. Finally, recommendations for the industrial waterfront include increasing public access, providing equitable connection opportunities to the region, and intersection redesigns to prioritize safety.
The transportation sector is responsible for 37 percent of all GHG emissions in the state of Massachusetts, and steps towards renewable energy sources for fleet vehicles and facilities to reduce these emissions are essential.21 The Commonwealth’s Clean Energy and Climate Plan for 2050 establishes an 86 percent emissions reduction benchmark by 2050 from 1990 levels of pollution. 22 To achieve this, the plan proposes that 93 percent of all medium- and heavy-duty trucks produce low or no emissions. The transition to an entirely electric fleet is a long and expensive process. The American Transportation Research Institute estimated the national cost of truck electrification equipment and charging to be more than $35 billion.23
Decarbonization can begin advancing while the technology and market for electric freight vehicles is developing by pursuing existing alternative fuel options, such as renewable natural gas, compressed natural gas, biodiesel, renewable diesels, and hydrogen fuel cells. Each alternative fuel vehicle type has differing characteristics; most notably, renewable diesel and hydrogen fuel cell heavy-duty vehicles are lighter than electric heavy-duty vehicles, which would place lower loads on roadways.
Massachusetts has adopted California’s Advanced Clean Trucks (ACT) regulation which sets a timeline for the manufacturers of medium- and heavy-duty trucks of different vehicle classes to gradually produce and sell an increasing percentage of zero-emission vehicles. Beginning with model year 2025, this rule applies to vehicles greater than 8,500 pounds gross vehicle weight (Classes 2b-8) and requires manufacturers to gradually produce and sell an increasing percentage of vehicles. By 2035, zero-emission truck and chassis sales would need to be 55 percent of Class 2b–3 truck sales, 75 percent of class 4–8 straight truck sales, and 40 percent of truck tractor sales.24
Business stakeholders in the study area reported that it would be challenging to comply with overarching decarbonization goals and regulations, as the market for these vehicles and related infrastructure has not reached maturity. They suggested that additional market incentives similar to the Massachusetts Offers Rebates for Electric Vehicles (MOR-EV) programs, such as a truck rebate program, are necessary to successfully usher low-emission fleets into the Commonwealth. It is worth noting that the technology for light-duty electric vehicles, such as Amazon delivery vans, is already available.
Our conversations illuminated the mismatch between the current needs of medium- and heavy-duty trucks and the supply and features available on the market. The initial cost of investment for battery-electric vehicles is about two-and-a-half times the cost of diesel vehicles, despite having diminished and unpredictable performance in colder temperatures during winter. Industry stakeholders noted that other states, such as California, supplement incentives with penalties for diesel vehicles that remain in the fleet; such incentives merit further exploration by the Massachusetts Legislature.
Fleet electrification is a commonly proposed strategy to accelerate decarbonization and improve sustainability. For example, some local businesses, such as Cargo Ventures, are investigating strategies to encourage tenants to convert to electric vehicle fleets by installing necessary infrastructure, such as charging stations. According to the Massachusetts Vehicle Census, 3.3 percent of electric or hybrid vehicles in the study area are commercial vehicles. The census includes electric vehicles, hybrid-electric vehicles, and plug-in hybrid-electric vehicles. Common barriers to adopting this technology include high up-front costs, nascent technology, grid capacity, and vendor timelines.
It was frequently emphasized in our interviews that fleet electrification will be a long and complex process and is unlikely to resolve all existing challenges in the study area. Electrification does not address concerns associated with traffic, safety, noise, and road condition impacts, and it might allow freight activity to expand. While electric vehicles are becoming cost-effective for light-duty vehicles, this is not yet the case for medium- and heavy-duty electric vehicles. Based on the type and category (light-, medium-, or heavy-duty and short-haul or long-haul), the needs and ease of electrification may vary and may become challenging. For instance, fewer resources are required to implement fleet conversions of light- and medium-weight vehicles, as the market has reached parity with diesel and gasoline vehicles.
Furthermore, vehicles active in the North Suffolk area are not all registered in Massachusetts and thus are subject to regulations that may differ from that of the Commonwealth. Regulations and incentives for medium- and heavy-duty vehicles must be coordinated on the local, regional, state, and national levels whenever possible to ensure that the implementation of the regulations advances the goal of reducing emissions.
A comprehensive multi-pronged effort is needed to successfully implement a strategy to facilitate the transition to electric vehicles, coordinating infrastructure developments, regulations, and public and private investments. Potential action items toward making this transition include an exploration of incentives for electrification, finance opportunities for zero-emissions infrastructure from the Bipartisan Infrastructure Law and other grant opportunities, and investments in electric vehicle infrastructure such as charging stations at truck stops and delivery hubs. Subsidies and tax credits could be explored to reduce the capital burden of initial private electrification efforts and encourage reduced timelines for electrification. Mandates for carbon sinks such as new tree plantings, industrial site remediation, and the enhancement of pedestrian and bicyclist safety measures could be examined as an approach to further mitigate carbon emissions from industrial activity.
Studies that investigate the costs and benefits of various industrial electrification strategies for the different forms of freight transportation could help determine the best investment strategies to pursue in the North Suffolk area. In addition, further coordination is needed, especially with utility companies and ISO-NE, to ensure that the electric grid can accommodate the projected increased demand for electricity. For electrification to successfully achieve decarbonization goals, the grid must also source energy from renewable sources.
A recurring theme from interviews and our literature review is the call for more specific local air quality monitoring that can enable identification of the point sources of particulate matter. Contributing factors to poor air quality include vehicle traffic on Routes 1, 1A, and 16 and activities from industrial sites. In 2021, GreenRoots collaborated with various partners and stakeholders, including the City of Chelsea, Massachusetts Department of Environmental Protection, and the U.S. Environmental Protection Agency, to install air quality monitors throughout the city. The data from these monitors are updated every 10 minutes on the PurpleAir Air Quality Monitor website.25 Similar efforts across the entire study area could advance the creation of a real-time local air quality database that could track the effectiveness of policy mechanisms and consistently monitor areas of concern.
Conversations with community-based groups encouraged expanding the reporting requirements for warehouses and other industrial activities. They voiced concerns relating to harmful emissions from the freight industry’s transportation activities and stationary, auxiliary freight facilities, such as warehouses. Clarity on the point source of air pollution will allow for more effective regulations, emissions caps, and low- or no-emissions zones to be developed and implemented. While there are challenges related to connecting local air quality concerns to specific sources, increasing the number of monitors in impacted areas can help identify priority areas and potential contributors. Municipalities could consider enforcing emission regulations on industrial and related uses.
Municipalities also expressed interest in data on truck traffic, such as origin-destination flows, and its impact on air quality. As part of this study, staff to the Boston Region MPO estimated the generation of freight and service trips using a freight trip demand model developed by the Transportation Research Board (TRB). This model estimates trip generation based on industry codes and the number of employees at each establishment and the results are sorted by zip code. Trips included in these estimates are calculated at a daily establishment-level.26 Results for the study area can be seen in Figure 7. The most freight trips in this area begin and terminate in East Boston. Everett, Revere, and Chelsea follow closely with a high volume of freight trips, while the town of Winthrop experiences a significantly lower number of freight trips beginning and ending in the municipality.
Figure 7
Daily Freight and Service Trip Generation Estimations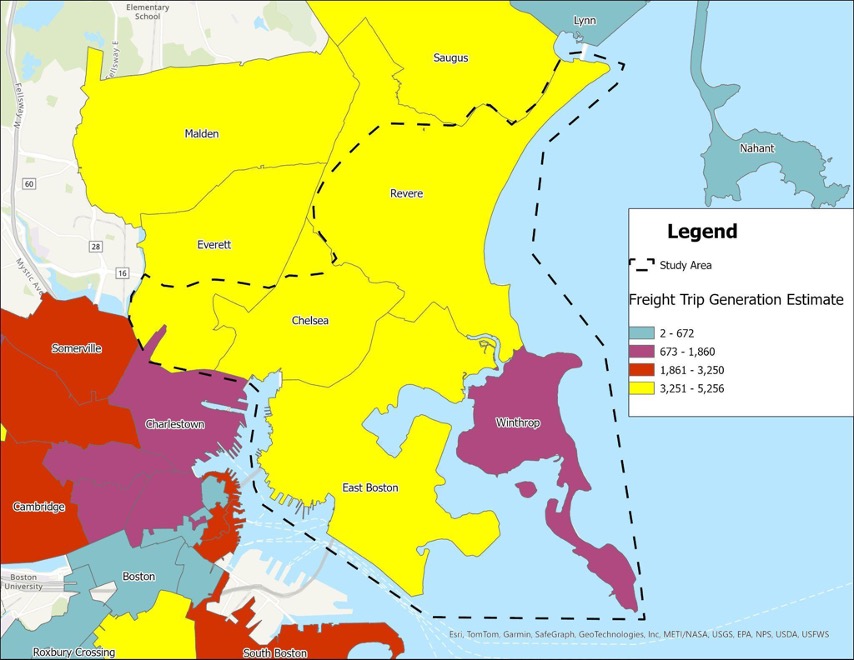
Source: Central Tranportation Planning Staff.
In addition, the desired land use of the study area is shifting. The Cities of Everett, Chelsea, and Revere have pursued different strategies to redevelop parcels of land that previously were industrial sites. These redevelopment sites provide an opportunity to integrate green infrastructure in the study area and develop mitigation strategies to combat the effects of coastal flooding and sea level rise.
California has implemented Rule 2305, the Warehouse Actions and Investments to Reduce Emissions (WAIRE) Program. WAIRE is a menu-based system in which warehouse operators are required to participate in activities to reduce facility and transportation emissions and incentivize the adoption of zero emissions or near-zero emissions (ZE/NZE) freight vehicles. Activities that earn WAIRE points include acquiring ZE/NZE trucks and yard trucks, supporting operations with ZE/NZE vehicles, installing and using solar panels, and installing or replacing air filtration systems. The program calculates a specific number of points every year that operators are required to earn annually based on the annual number of truck trips to and from a facility, weighing Class 8 vehicles more to account for their additional size. Warehouse operators can earn points by completing actions from the WAIRE menu to reduce fees, establishing a custom plan, or opting to pay a mitigation fee. Revenue generated from the mitigation fee has been designated for incentives to promote the adoption of ZE/NZE vehicles.
Investments to improve the safety of pedestrians and bicyclists are necessary to achieve meaningful mode shift. Strategies to support mode shift largely focus on establishing connections to promote active and sustainable modes of transportation. This can potentially reduce conflict faced while sharing curb space and reduces the exposure of vulnerable road users to delivery trucks. CTPS’s Route 16 Priority Corridor Study recommends short-term improvements such as continuous, connected sidewalks; pedestrian refuge areas; and signalized pedestrian crossings.27 Longer-term improvements were proposed in the BPDA’s PLAN: East Boston, including the construction of a separated, multiuse path for pedestrians and bicyclists to provide refuge from the heavy vehicular traffic congestion.28
The City of Chelsea has begun looking at strategies to connect Chelsea to East Boston: removing barriers for public transit, bicycle, and pedestrian modes of transportation; connecting freight facilities between the two communities; and making safety improvements to a crash cluster along the freight corridor on the Chelsea Street Bridge.
To further enable mode shift, a cargo electric-bicycle delivery service could be considered in the North Suffolk area to help reduce local, last-mile delivery traffic for smaller goods and services and potentially reduce the number of commercial vehicles parked in bike lanes. A pilot project could be similar to the City of Boston’s “Boston Delivers” cargo e-bicycle deliveries pilot, which was launched in Allston in fall 2023. The stated goals of this program are to support local businesses, reduce congestion, improve safety, and reduce pollution.29 Outcomes from this pilot can be valuable in shaping effective last-mile delivery options in the study area.
A pilot in the North Suffolk area would require the establishment of a local delivery hub, e-bike management logistics, and funding support. Additional policies would need to accompany such a pilot, including expanded guidance on whether cargo e-bikes are permitted within bicycle lanes and short-term loading areas near businesses. The implementation of a pilot that deploys small-scale vehicles or delivery bicycles would provide an opportunity to reduce the usage of heavy-duty vehicles depending on the size of the product that the business provides.
The existing rail infrastructure in Everett provides a unique opportunity to begin shifting commodity and wholesale freight activity from trucks to rail. Infrastructure to facilitate connections between truck, rail, and maritime freight is necessary to support this mode shift, as the closest intermodal rail facilities are in Worcester and Ayer. Shifting to accommodate additional freight transportation by rail would reduce the number of large freight vehicles starting and ending trips in the study area. As the industrial sector in the study area undergoes several transformations, municipal stakeholders noted that it is imperative that the rail infrastructure present in the area be preserved. The preserved rail infrastructure could be used by interested businesses thereby resulting in mode shift of some truck traffic to rail.
Electric cargo bicycles are an evolving strategy to reduce the number of vans on the roads that are completing last-mile deliveries. E-cargo bicycles occupy less of the valuable curb space in urban environments, can reduce the number of vehicle-miles traveled per package delivery, limit roadway safety concerns, and significantly reduce associated carbon emissions. E-cargo bicycle delivery offers the most benefits in dense urban environments.
In Seattle’s pilot, a single e-cargo bicycle is loaded with packages at a microhub, which is serviced by cargo vans. A microhub is most effective when located at the periphery of residential areas. Study authors noted that planners should be mindful of van traffic on roads surrounding the microhubs. Successful microhubs would integrate neighborhood features, such as electric-vehicle-charging stations, into their design.
Another recurring theme from our interviews was the need to coordinate policies at the regional, state, and national levels. Freight sites send and receive deliveries from a large network of vendors using their respective vehicle fleets. Intensive regulations and rezoning within the North Suffolk area may induce businesses to invest in future locations outside of the study area. This would affect the employment prospects of many low-income, blue-collar workers in the study area and drive businesses to relocate to more affordable sites. Collaborative efforts across agencies, municipalities, and subregions is necessary to mitigate resulting challenges from these transitions.
Furthermore, many planning and policy activities have been produced independent of one another. Conversations with stakeholders have illuminated the need to establish an on-going dialogue to achieve an actionable plan to implement decarbonization goals. Transportation and land use are interconnected fields that significantly impact one another, and regulations should be developed in this context. There is a possibility of a transportation and land use mismatch when freight patterns and zoning are not integrated in the planning and decision-making process. The 2023 Massachusetts Freight Plan discusses policies and strategies that include planning with consideration to freight, land use, and zoning. Potential impacts of a greater dialogue between planning and policy efforts could permeate to more effective zoning policies and building regulations.
As part of the Bipartisan Infrastructure Law, various competitive federal funding programs were introduced. These funding and grant programs help communities to identify specific challenges and overcome them. USDOT maintains a dashboard which provides an overview of all the programs. 30 Some programs and grant opportunities relevant to freight and sustainable transportation at the federal or state level are listed below.
Rebuilding American Infrastructure with Sustainability and Equity (RAISE) 31 :
RAISE provides funding on a competitive basis for road, rail, transit and port projects that aim to achieve national objectives. The RAISE grant was previously known as the Better Utilizing Investments to Leverage Development (BUILD) and Transportation Investment Generating Economic Recovery (TIGER) Discretionary Grants. In 2023, RAISE funding supported 162 projects. Ideas explored in this study that can be funded through this program include surface transportation projects that reduce GHG emissions, improve safety, and support workforce development.
Massachusetts Department of Environmental Protection Electric Vehicle Incentive Program (MassEVIP)32:
MassEVIP is a competitive MassDEP grant program to promote electric vehicles across Massachusetts. This grant provides incentives for the purchase or lease of electric vehicles for their fleets by public entities, such as municipalities, state agencies, or state colleges and universities. MassEVIP is categorized into fleets, public access, workplace and fleet, and multiunit dwelling and educational campus programs. This program helps to lower the financial burden required in electric fleet conversions.
The SMART discretionary grant program was established by the Bipartisan Infrastructure Law, with $100 million appropriated annually for fiscal years (FY) 2022–26. This competitive grant program promotes purpose-driven innovation related to delivery, logistics, traffic signals, and more. In FY 2022, USDOT awarded these grants to 59 projects. Topics explored in the North Suffolk study that could be addressed with this grant include air quality challenges from port and logistics activities, reducing congestion, and air quality monitoring.
IRAP is a competitive grant program and projects that receive a grant are expected to be completed within two years of starting the project. Eligible applicants for IRAP grants include municipalities, freight railroad operators, rail shippers, and economic development corporations. The goal of the program is to stimulate economic development and job growth by expanding and improving rail and freight access. Sixty percent of the funds are supported by the state IRAP funds and 40 percent of the project costs are to be provided by railroad operators and industry sponsors. This program supports the industrial development of rail freight activities.
Conducting a second phase of this study that builds on the findings of this initial exploration is recommended. Further work could include an analysis of regional freight patterns drawing on infrastructure siting (both public and private) and land use (both existing and planned industrial, commercial, and logistics uses), leading to better insights on vehicle emissions and informing potential locations for charging infrastructure. Staff are well-positioned to conduct a preliminary investigation of existing technology, needs, and support required for deployment of electric trucks (and other alternative modes), in addition to assessing the feasibility of conducting a pilot e-bike delivery service program to establish a local delivery hub in the study area. These efforts would benefit from increased community engagement and participation so EJ communities can be included in freight planning processes.
Broader regional efforts that build an interdisciplinary coalition of stakeholders to collaboratively pursue decarbonization strategies are also recommended. We encourage setting regional GHG emissions reduction targets and working together to outline pathways to achieve those targets. Staff can assist by conducting regional-level analysis of freight patterns and volumes, and assessing the impacts of the freight sector on EJ communities. Future efforts can include investigating the feasibility of using alternative fuels for medium-duty or heavy-duty vehicles as a means to reduce emissions, examining what infrastructure upgrades may be necessary to support fleet electrification, and exploring potential funding streams to increase the rate of fleet electrification.
Longer-term activities could include exploring the potential to adopt a multimodal approach by moving freight by ship, rail, and truck. Potential areas of research are assessments of existing rail infrastructure and development of strategies to preserve and restore more rail right-of-way to allow freight movement by rail as an alternative to freight trucks. MassDOT’s Industrial Rail Access Program could be an appropriate avenue to fund rail-based freight infrastructure improvements. We also recommend future studies on challenges to mode shift goals, such as the risks posed to pedestrians and bicyclists by rising temperatures brought about by climate change.
Finally, the need to generate awareness and educate the public about decarbonization strategies, especially electrification and mode shift is necessary. Successful decarbonization of the freight sector will require a combination of innovative strategies, regional coordination, and stakeholder engagement and representation. The MPO staff are uniquely positioned and remain interested in assisting, and at times leading, future efforts towards this shared goal for the region.
This appendix outlines the engagement that was conducted as part of the study. A wide range of stakeholders were interviewed, which included 10 municipalities and state agencies, four chambers of commerce, six businesses, and four advocacy and community-based organizations (CBOs).
The goals of the engagement included the following:
The findings and recommendations included in this memorandum sought to incorporate and contextualize the variety of stakeholder perspectives that emerged during the interviews, but do not necessarily reflect the position or opinion of individual stakeholders. The following is a list of stakeholders who were interviewed.
| Stakeholder |
Category |
|---|---|
City of Chelsea |
Municipality |
City of Everett |
Municipality |
City of Revere |
Municipality |
Town of Winthrop |
Municipality |
City of Boston (Boston Planning and Development Agency) |
Municipality |
City of Boston (Climate and Environment) |
Municipality |
City of Boston (Boston Transportation Department) |
Municipality |
Massachusetts Port Authority (Massport) |
State Agency |
Massachusetts Department of Transportation (Office of Transportation Planning) |
State Agency |
North Suffolk Office of Resilience and Sustainability |
Municipal Organization |
Amazon |
Business |
Cargo Ventures |
Business |
Market Basket |
Business |
NorthEase Consulting Group |
Business |
Prolerized New England |
Business |
Peterbuilt/The Pete Store |
Business |
Global Partners |
Business |
GreenRoots |
Advocate/CBO |
La Comunidad, Inc. |
Advocate/CBO |
Sierra Club Massachusetts |
Advocate/CBO |
Airport Impact Relief (AIR Inc.) |
Advocate/CBO |
CIVIL RIGHTS NOTICE TO THE PUBLIC
Welcome. Bem Vinda. Bienvenido. Akeyi. 欢迎. 歡迎

You are invited to participate in our transportation planning process, free from discrimination. The Boston Region Metropolitan Planning Organization (MPO) is committed to nondiscrimination in all activities and complies with Title VI of the Civil Rights Act of 1964, which prohibits discrimination on the basis of race, color, or national origin (including limited English proficiency). Related federal and state nondiscrimination laws prohibit discrimination on the basis of age, sex, disability, and additional protected characteristics.
For additional information or to file a civil rights complaint, visit www.bostonmpo.org/mpo_non_discrimination.
To request this information in a different language or format, please contact:
Boston Region MPO Title IV Specialist
10 Park Plaza, Suite 2150
Boston, MA 02116
Phone: 857.702.3700
Email: civilrights@ctps.org
For people with hearing or speaking difficulties, connect through the state MassRelay service, www.mass.gov/massrelay. Please allow at least five business days for your request to be fulfilled.
1 Multimodal freight transportation trips use at least two different modes of transport in movement of goods and services from one point to another. For example, this could involve road, rail, sea, or air.
2 The Massachusetts Clean Water Trust, The Disadvantaged Community Program, Mass.gov. https://www.mass.gov/info-details/the-disadvantaged-community-program#disadvantaged-community-designation-
3 Massachusetts Executive Office of Energy and Environmental Affairs, Environmental Justice Populations in Massachusetts, Mass.gov. https://www.mass.gov/info-details/environmental-justice-populations-in-massachusetts
4 North Suffolk Public Health Collaborative, 2022 Community Health Needs Assessment Report (2022). https://drive.google.com/file/d/1u3it_of9sCHiI_4qE4530YgT2nL8eKyX/view
5 Massachusetts Department of Transportation, 2023 Massachusetts Freight Plan (2023). https://www.mass.gov/doc/2023-massachusetts-freight-plan/download
6 Federal Highway Administration, Freight Analysis Framework (2024). https://ops.fhwa.dot.gov/freight/freight_analysis/faf/
7 Massachusetts Department of Transportation, Massachusetts Statewide Airport Economic Impact Study Update (2019). https://www.mass.gov/doc/aeronautics-economic-impact-study-2019/download
8 Massachusetts Port Authority, 2020/2021 Environmental Data Report (2022). https://www.massport.com/sites/default/files/2023-12/2020-2021-logan-environmental-data-report.pdf
9 Joint Office of Energy and Transportation, National Zero-Emission Freight Corridor Strategy (2024). https://driveelectric.gov/files/zef-corridor-strategy.pdf
10 Massachusetts Port Authority, 2020/2021 Environmental Data Report (2022). https://www.massport.com/sites/default/files/2023-12/2020-2021-logan-environmental-data-report.pdf
11 City of Chelsea, Eastern Avenue Climate Resilience Vision (2023). https://cms5.revize.com/revize/chelseama/Document_Center/Departments/Housing%20&%20Community%20Development/Environment%20and%20Climate%20Resilience/Eastern%20Avenue%20Climate%20Resilience%20Vision%202023.pdf
12 Boston Region MPO, TDM23: The Boston Region’s Travel Demand Model (2023). https://www.ctps.org/travel-demand-model
13 Massachusetts Department of Transportation, Highway Safety Improvement Program (2024). https://www.mass.gov/info-details/highway-safety-improvement-program
14 Central Transportation Planning Staff, Improving Truck Travel in the Everett-Chelsea Industrial Area (2016). https://www.ctps.org/data/calendar/htmls/2016/MPO_0121_Freight_Memo.html
15 U.S. Department of Transportation, Cleaner Air (2015). https://www.transportation.gov/mission/health/cleaner-air
16 Metropolitan Area Planning Council, Climate Vulnerability in Greater Boston (2019). https://climate-vulnerability.mapc.org/
17 Boston Planning and Development Agency, PLAN: East Boston Community Meeting (August 9, 2023). https://www.bostonplans.org/documents/planning/downtown-neighborhood-planning/plan-east-boston/2023-08-09-community-meeting-(english)-waterfront/waterfront-and-evolving-industrial-areas-chelsea-c
18 Massachusetts Office of Coastal Zone Management, Massachusetts Coastal Flood Risk Model (2021). https://experience.arcgis.com/experience/23d861b79aed450eb8972013dd28579b/page/Introduction/?data_id=dataSource_17-184befd6a4b-layer-28-1860e50335b-layer-36-2%3A124&views=2050-Flood-Depths---1%25
19 City of Chelsea, Chelsea Creek 2022 Municipal Harbor Plan and DPA Master Plan (April 2022). https://cms5.revize.com/revize/chelseama/Document_Center/Departments/Housing%20&%20Community%20Development/Sustainable%20Economic%20Development/chelsea_creek_mhp_and_dpa_master_plan_-_summer_2022_-_final.pdf
20 City of Boston, Coastal Resilience Solutions for East Boston and Charlestown (Phase II) (August 2022). https://drive.google.com/file/d/1iCqRC4GGlkuBJYLFc7P95MyZRHnK2iOS/view?usp=sharing
21 Executive Office of Energy and Environmental Affairs, Massachusetts Clean Energy and Climate Metrics, Mass.gov. https://www.mass.gov/info-details/massachusetts-clean-energy-and-climate-metrics
22 Massachusetts Executive Office of Energy and Environmental Affairs, Clean Energy and Climate Plan for 2050 (December 21, 2022). https://www.mass.gov/doc/2050-clean-energy-and-climate-plan/download
23 American Transportation Research Institute, Charging Infrastructure Challenges for U.S. Electric Vehicle Fleet (2022). https://truckingresearch.org/wp-content/uploads/2022/12/ATRI-Charging-Infrastructure-Challenges-for-the-U.S.-Electric-Vehicle-Fleet-12-2022.pdf
24 Zero Emissions Vehicle (ZEV) Commission, Advanced Clean Trucks and Advanced Clean Cars II, ZEV Commission (April 15, 2022). https://www.mass.gov/doc/zev-commission-april-15-2022-meeting-slides/download
25 PurpleAir, Real-Time Air Quality Map (2024). https://map.purpleair.com/1/mAQI/a10/p604800/cC5#13.24/42.39607/-71.02496
26 Transportation Research Board, Using Commodity Flow Survey Microdata and Other Establishment Data to Estimate the Generation of Freight, Freight Trips, and Service Trips: Guidebook (2016). https://nap.nationalacademies.org/catalog/24602/using-commodity-flow-survey-microdata-and-other-establishment-data-to-estimate-the-generation-of-freight-freight-trips-and-service-trips-guidebook
27 Central Transportation Planning Staff, Route 16 Priority Corridor Study (2016). https://www.ctps.org/data/pdf/studies/highway/2019-priority-corridors/Route-16-Chelsea-Everett-Priority-Corridor-Study.pdf
28 Boston Planning and Development Agency, PLAN: East Boston (2024). https://www.bostonplans.org/getattachment/ce2b7495-6808-4a4d-8bdc-74a5c20664fd
29 City of Boston, Mayor Wu Announces “Boston Delivers,” an E-Cargo Bike Delivery Pilot Program (2023). https://www.boston.gov/news/mayor-wu-announces-boston-delivers-e-cargo-bike-delivery-pilot-program
30 U.S. Department of Transportation, DOT Discretionary Grants Dashboard. https://www.transportation.gov/grants/dashboard
31 U.S. Department of Transportation, RAISE Discretionary Grants (2023). https://www.transportation.gov/RAISEgrants
32 Massachusetts Department of Environmental Protection, Apply for MassEVIP Fleets Incentives (2024). https://www.mass.gov/how-to/apply-for-massevip-fleets-incentives
33 U.S. Department of Transportation, Strengthening Mobility and Revolutionizing Transportation (SMART) Grants Program (2023). https://www.mass.gov/how-to/apply-for-massevip-fleets-incentives
34 Massachusetts Department of Transportation, Industrial Rail Access Program. https://www.mass.gov/industrial-rail-access-program