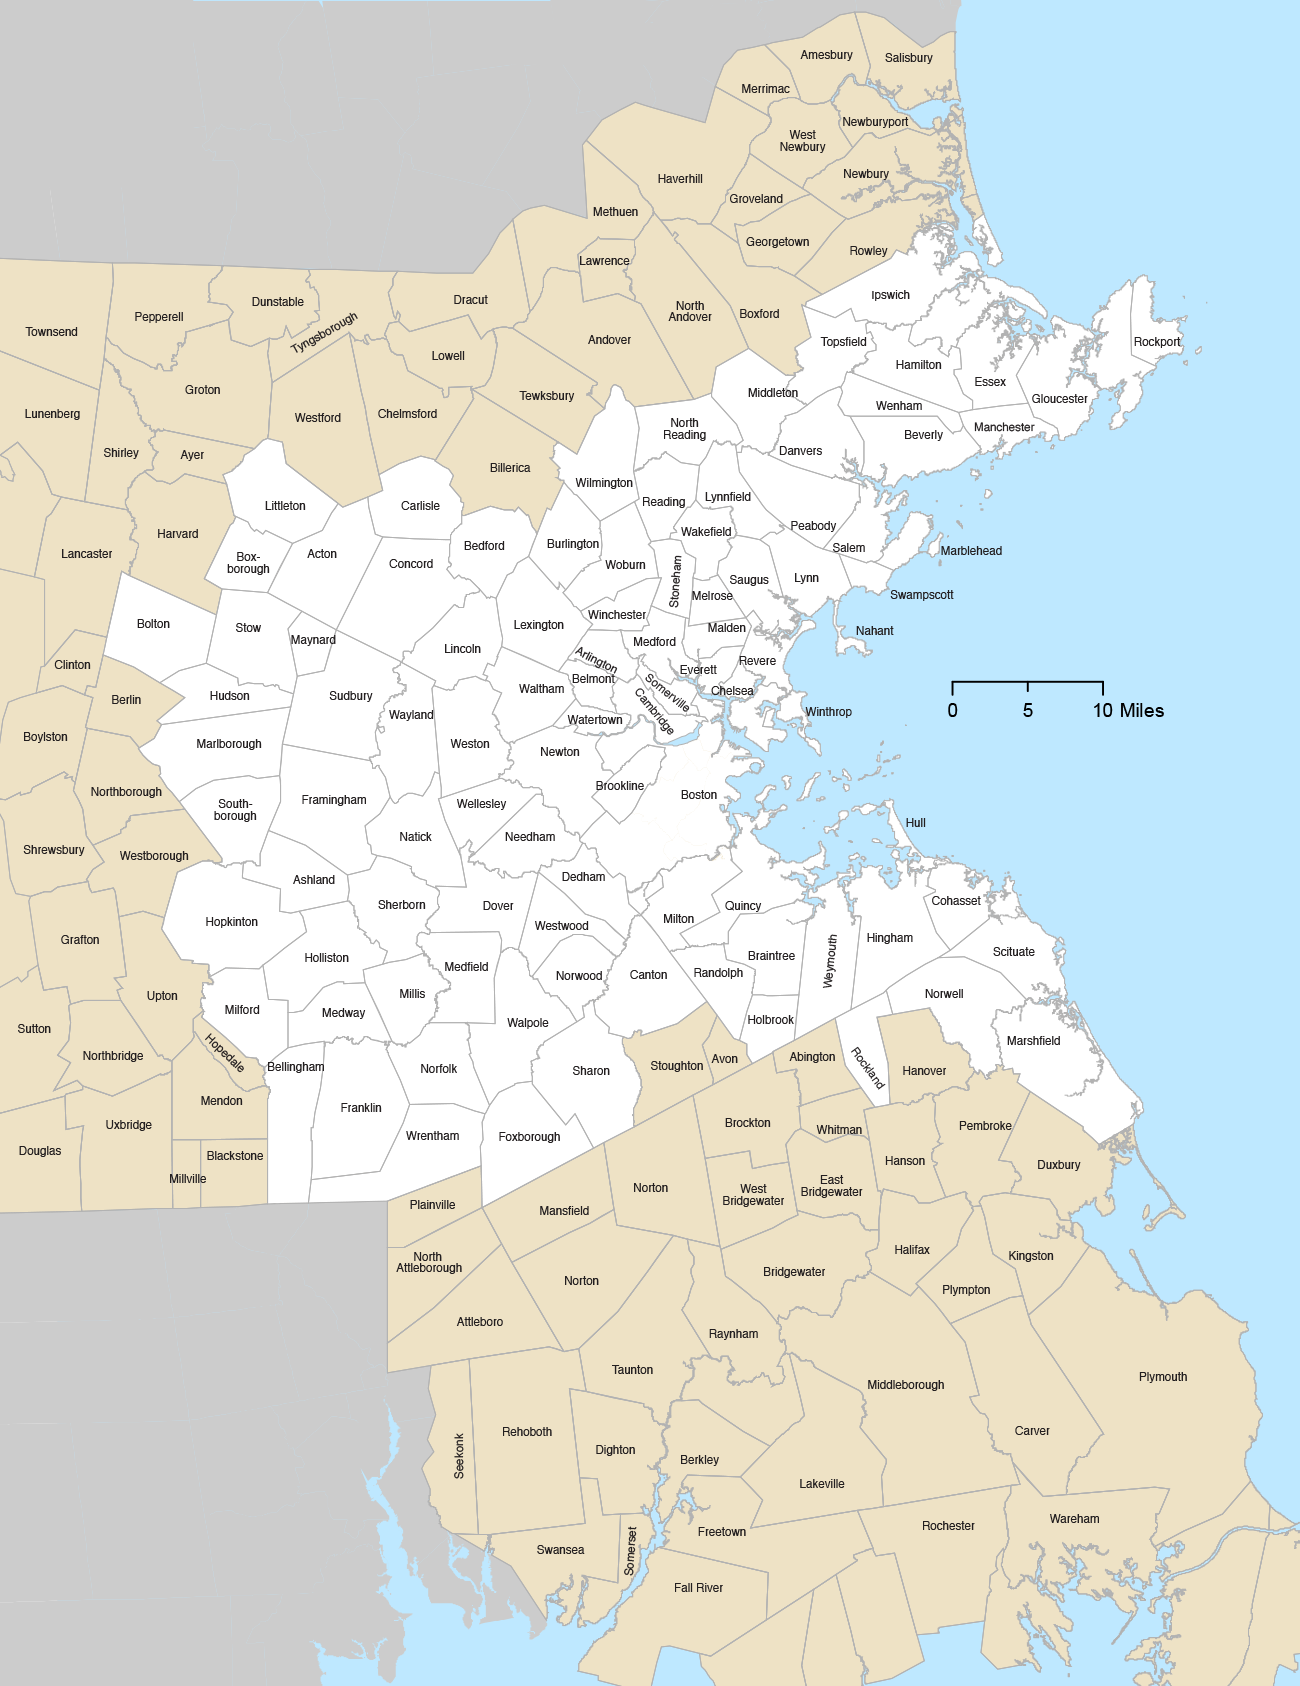
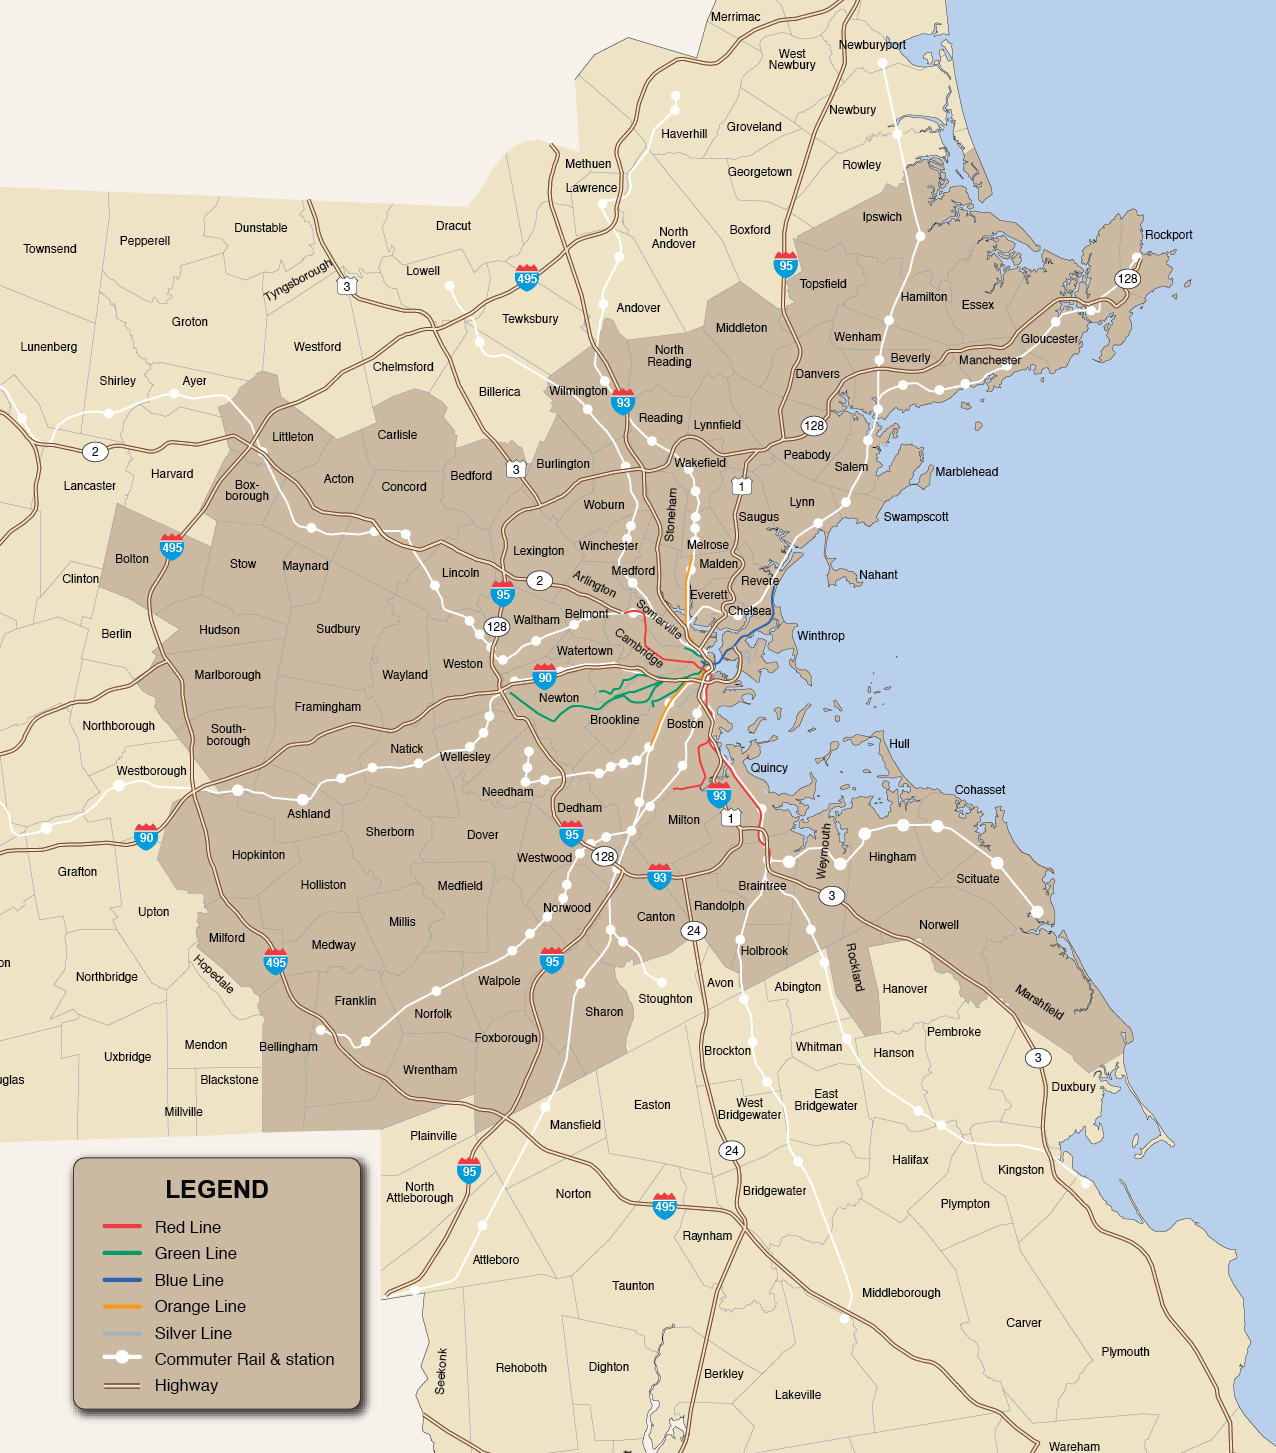
The Boston Region Metropolitan Planning Organization (MPO) encompasses 97 municipalities extending from Ipswich on the North Shore to Marshfield on the South Shore as shown in Figure 2-1. The region’s outer circumferential highway, Interstate 495, passes through 11 MPO municipalities. In 2010, the population of the MPO was 3,086,000 making it the fifteenth most populous MPO in the country. The MPO’s land area, however, is a comparatively small 1,381 square miles, the ninety-third largest MPO in geographical size.
The MPO’s small land area has important implications for transportation planning. For example, out of the 139 stations in the Massachusetts Bay Transportation Authority’s (MBTA) commuter rail system, 35 are located outside of the Boston Region MPO area. Also, many warehouses and logistic centers serving the Boston Region MPO are located in neighboring MPOs. Therefore, there is a heightened need for coordination with the Commonwealth and other MPO’s across the state.
This chapter describes the existing land use as well as the land use projected for 2040 in the Boston Region MPO area. It also describes the existing transportation system including:
Figure 2-1
Boston Region MPO Area
Source: Boston Region MPO.
The Boston Region MPO area is a mature region with the majority of jobs and population located in a dense urban core. This region is composed of 97 cities and towns, each with its own land use regulatory authority.1 These municipalities are connected by a diverse network of local roads, highways, rail lines, bus routes, and rapid transit services.
In order to understand how regional trends will affect the region’s diverse communities over the coming decades, the Metropolitan Area Planning Council (MAPC) has identified four basic community types (shown in Figure 2-2) as the Inner Core, Regional Urban Centers, Maturing Suburbs, and Developing Suburbs. While each city and town is unique, communities within each community type share important characteristics that will influence their development in the coming decades. The criteria used to define community types include land use and housing patterns, recent growth trends, and projected development patterns.2 The following sections describe the four basic community types in detail, along with Priority Development Areas, Priority Preservation Areas, and transit-oriented development in the Boston Region MPO area.
Figure 2-2
Metropolitan Area Planning Council Community Types
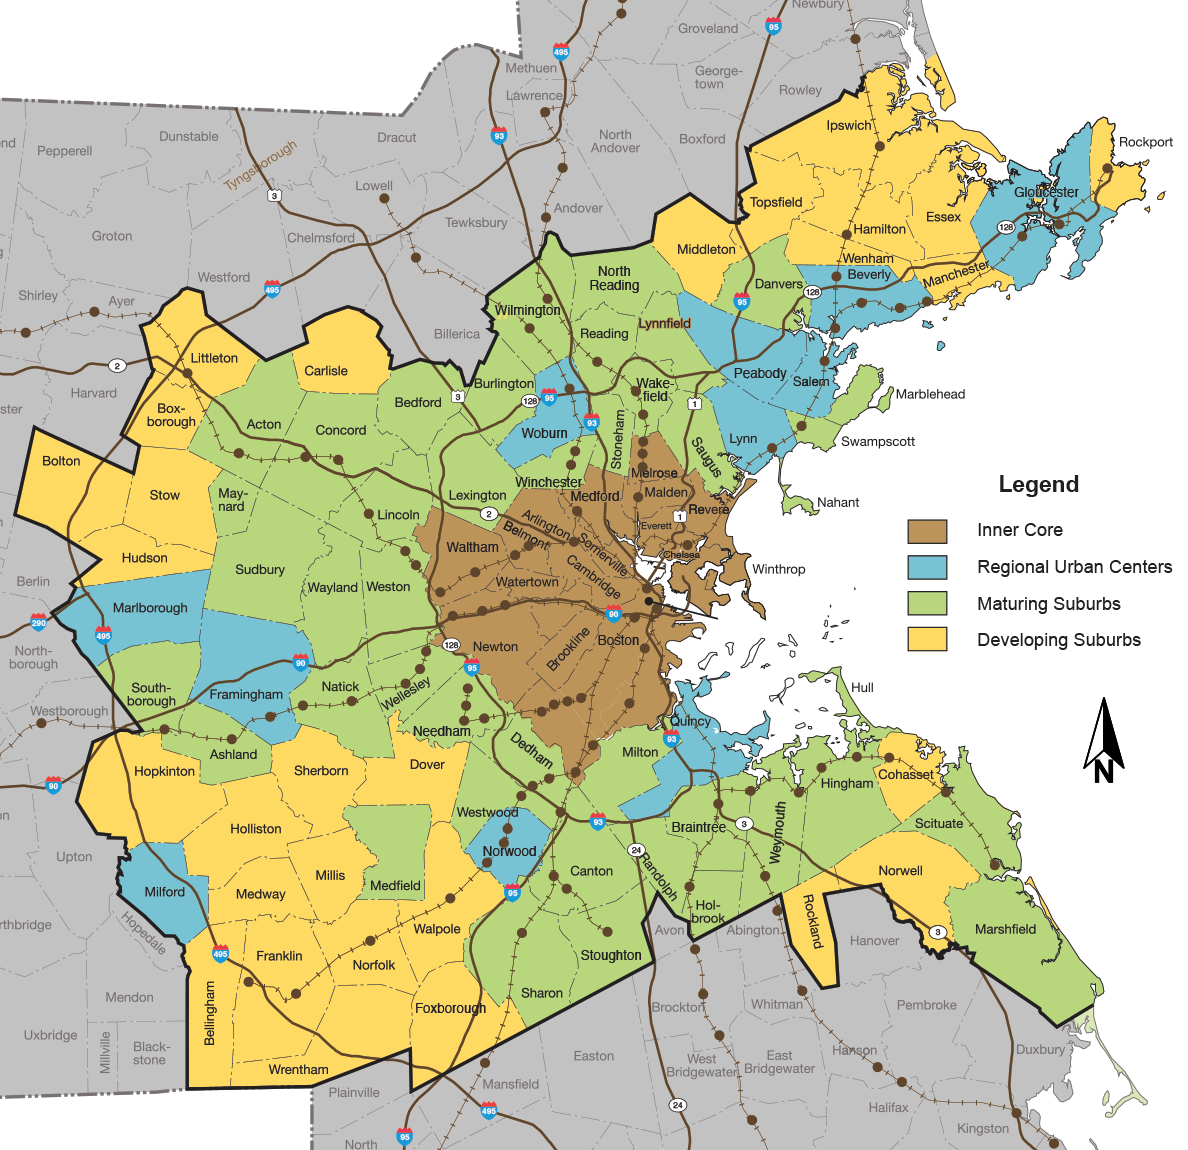
Source: Metropolitan Area Planning Council.
The Inner Core consists of the high-density cities of Boston, Cambridge, Somerville, Revere, Everett, and Chelsea, as well as more residential streetcar suburbs, such as Arlington and Brookline. There are 16 cities and towns in the Inner Core (within Route 128) that are classified as Streetcar Suburbs, which are built around village-scale commercial districts. The Inner Core has little vacant developable land, yet has experienced large gains in employment and residents in recent years as households shift to prefer dense, walkable areas. Virtually all recent development has occurred through infill and reuse of previously developed land. Multifamily housing is a significant component of the housing stock, as are rental and subsidized housing. Most employment is concentrated in downtown Boston and portions of Cambridge.
This community type includes urbanized municipalities (both cities and towns), located outside of the Inner Core. Eleven Regional Urban Centers are located in the Boston Region MPO area. These communities are characterized by an urban-scale downtown core with multiple blocks of multistory and mixed-use buildings. Moderately dense residential neighborhoods surround this core; in some cases, lower-density, single-family residential development surrounds these neighborhoods. Some of these communities are considered “built out,” while other communities still have undeveloped but potentially developable land. Rental housing and multifamily structures compose a significant portion of the housing stock, and many of these communities have large or growing immigrant populations, such as Framingham and Lynn.
There are 43 towns classified as Maturing Suburbs in the Boston Region MPO area. These municipalities are moderate-density residential communities that have a very limited supply of currently undeveloped but potentially developable land (less than 25 percent of the land area). Most Maturing Suburbs are predominantly “bedroom communities” where less than 20 percent of the land area is devoted to commercial and industrial uses, although a few of these towns are significant job centers. More than half of the housing units are owner-occupied single-family homes.
There are 27 towns in the Boston Region MPO area classified as developing suburbs. Most of these municipalities are located along Interstate 495 and on the North and South Shores. These are less-developed towns that have large expanses of currently undeveloped land that could be converted to developable uses. While the vast majority of housing is in single family homes, some of these towns have a locally significant stock of rental units in larger complexes and in modestly sized multifamily structures. Many of these towns have a well-defined, mixed-use town center surrounded by moderately dense neighborhoods. Others areas are more rural, with sparse residential development and town or village centers that have historical and civic significance but little commercial or neighborhood function. The extent of economic development varies, but generally is quite limited.
Many cities and towns in the developing suburbs have planned ahead by identifying and prioritizing areas for growth and preservation. In many cases, identification of these priority areas has occurred through a subregional process involving multiple adjacent municipalities, the MAPC, and participating state agencies. This process entails
Priority Development Areas (PDAs) may range in size from a single lot to many acres, and may include sites that are appropriate for housing, commercial development, industrial uses, or some combination of the above. PDAs may be considered “greenfield” sites,3 major redevelopment areas, infill opportunities, or adaptive reuse of existing buildings to preserve a sense of place.
While localities generally identify a wide range of priority sites, the screening process for select regionally-significant PDAs is designed to identify those with the following features:
In addition to PDAs identified through a subregional planning process, the MPO and MAPC also recognize areas designated under state programs such as Chapter 43D (expedited permitting), Chapter 40R (smart growth zones) or Economic Opportunity Areas.
Priority Preservation Areas’ features include
Transit-oriented development (TOD) has been a large part of Boston’s growth since the earliest horse-drawn railways, and many of the region’s city and town centers reflect the influence of former streetcars that stretched throughout the area. The Boston Metropolitan area (Metro Boston) is also experiencing a new wave of growth near transit service with hundreds of residential and commercial developments under way and more on the horizon. MAPC’s database of recent, current, and future development indicates that 60 percent of inventoried housing development and 71 percent of commercial development planned for 2018 and after are located within one-half mile of commuter rail or transit service.4 Cities and towns are creating plans for developing areas near transit stations, and are also updating their zoning to unlock development potential. The MBTA is accepting proposals for major developments on MBTA-owned parcels; state agencies are using transit proximity as a criterion for prioritizing infrastructure or housing resources; and the development community is finding a strong market for residential and commercial space near MBTA stations and stops.
The forces of an aging population, growing diversity, and economic restructuring will intersect to create a markedly different region in 2040 from the one that exists in the Boston Region MPO area today. The next section describes these differences by breaking them out into key trends.
The MAPC, the region’s land use planning agency, is responsible for preparing detailed transportation analysis zone (TAZ)-level socioeconomic and land use projections to the year 2040 to support the Long-Range Transportation Plan (LRTP). The Massachusetts Department of Transportation (MassDOT) helped lead the process for this LRTP by creating a projections committee with members from each of the state’s MPOs, MAPC, Central Transportation Planning Staff (CTPS), and other relevant government agencies. This committee oversaw the development of regional population, labor force, household, and employment projections for each MPO in the state. MAPC and the University of Massachusetts Donahue Institute (UMDI) were contracted as technical leads for the production of these projections. The UMDI developed population and employment projections while MAPC developed household and labor force projections. CTPS served as a member of the committee and contributed to the development of the methods as well as preparation of specific deliverables such as group quarters projections and auto availability estimates. To advise this process and the methods used for creating these projections, MAPC convened a projections advisory group with representatives from state agencies, academic experts, and staff from Boston and Cambridge.5
The process to create the regional projections relied on the consistency between population, households, labor force, and employment. UMDI relied on recent rates of births, death, and migration to create a future year population for each MPO region and municipality using a traditional cohort component method. These estimates were calibrated to match the 2015 municipal and regional population estimates. With those population projections as the input, MAPC relied on age-specific headship rates, and labor force participation rates specific to age, sex, and educational attainment to produce regional projections of workers and households for the forecast years.6
MAPC was then tasked with allocating the Boston Region MPO’s projected population, households, workers, and employment to TAZs. First, the region’s households were grouped into “agents” based on demographic characteristics such as age, income, and presence of children. MAPC then allocated these household agents and employment types based on four key inputs:
Overall, the land use scenario created for the LRTP, Destination 2040, involves key assumptions about the future and reflects large-scale, long-term land use trends in the region due to an aging population, a restructured economy, and the investment in development projects already planned. These key trends are described in the following sections.
The aging of the population will have large impacts, not just on the number of households in the future, but on the type of households that will exist. In 2010, the majority of households in the region were headed by someone born before 1965, with the baby boomers comprising the largest share of householder. As shown in Figure 2-3, as this generation ages, it will result in a large increase in senior households, and eventually outmigration and mortality will cause a steady decline in the number of baby boomer-headed households. Meanwhile, millennials (born 1981–2000) and generation Z (post-2000) will form new households in great numbers, and by 2040, the majority of the region’s households will be headed by someone born after 1980. While it is hard to say exactly what location and travel preferences these households will exhibit, it is likely that the habits of these householders, shaped by a near-lifelong availability of the internet, mobile devices, and on-demand mobility, will differ substantially from their predecessors.
Figure 2-3
Households by Householder Year Born: 2010–40
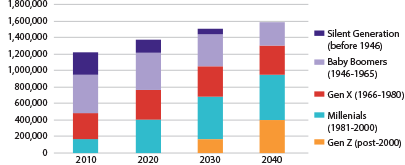
Source: Boston Region MPO.
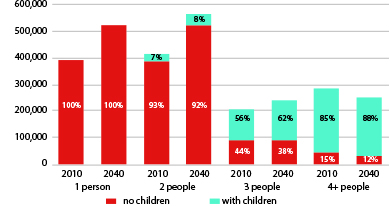
As this demographic transformation takes place, the projections suggest that the number of households with children under the age of 18 will remain relatively stable. However, families with children will comprise of a smaller share of total households (28 percent in 2010, 26 percent in 2040), and the average number of children per family will decline 15 percent from 1.8 to 1.6 across the same time period.
Figure 2-4
Households by Household Type: 2010–40
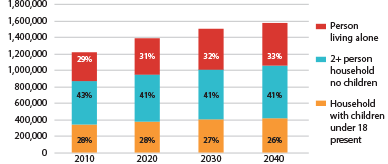
Source: Boston Region MPO.
Since seniors comprise a larger share of households, the region’s demand for housing units will outpace its population growth. A large part of this demand is due to the increase in single-person households, which are projected to grow from 362,000 in 2010 to 514,000 in 2040. Average household size would likely decline by 8.4 percent from 2010 to 2040 as the number of one- and two-person households increase by 41 percent and 48 percent, respectively. This change is driven largely by the growth in smaller senior households, which occur as baby boomers age out of their family-rearing years into their senior years. The region’s population is projected to grow by 20 percent from 2010–40 while the number of households will grow by 30 percent. Statewide, the population is projected to grow 13 percent and households are projected to grow 24 percent over that same time period.
Figure 2-5
Households by Size and Type: 2010–40
Source: Boston Region MPO.
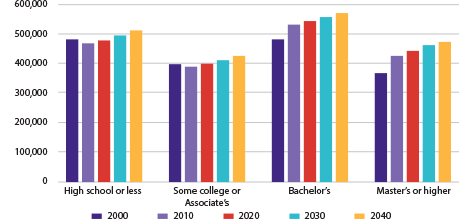
Labor force projections for the region anticipate larger increases in those with a Bachelor’s degree or higher (23 percent) than labor force participants with either an Associate’s degree or less (7 percent). This could benefit the region as both retail and basic employment opportunities shrink. These projections assume current rates of educational attainment level by age (while current rates of labor force participation by age, sex, and educational attainment), which means these numbers could be underestimating education levels of the labor force as millennials continue to accumulate more degrees than their parents.
Figure 2-6
Labor Force Projections by Educational Attainment
Source: Boston Region MPO.
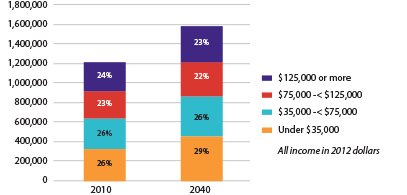
Households earning less than $35,000 in 2012 dollars are projected to increase 41 percent from 2010 to 2040 while the total household growth is only projected to increase by 30 percent. This is largely due to the increase in senior-headed households, which are largely comprised of retired workers on a fixed income. These projections do not trend forward any continued wage polarization in the region, which could dramatically alter these projections and make the growth in low-income households even greater.7
Figure 2-7
Projected Households by Income
Source: Boston Region MPO.
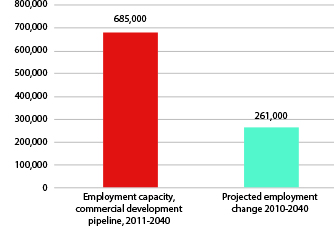
Economic forecasts based only on recent growth rates suggest that the region’s employment could grow by leaps and bounds over the coming decades. However, a limited supply of workers are likely to be a major constraint on growth. Even with labor force participation rates rising for older adults, the baby boomers will eventually leave the labor force, diminishing the supply of workers and the corresponding job growth potential. MAPC’s labor force projections estimate a labor force growth of 15 percent over a 30-year period, averaging about 0.4 percent per year from 2020–30 and 0.3 percent per year from 2030–40. A statewide analysis indicates that the problem may be worse for other regions of Massachusetts than for the Boston MPO area, where seven out of 13 regional planning agencies show no growth or declines in their labor force over the coming decades. However, it is projected that jobs in the Boston MPO area will increase by 14 percent, or 261,000 jobs, from 2010 to 2040.
One way to compare these projections against market activity is by looking at MAPC’s MassBuilds dataset. MassBuilds is a collaborative inventory of recently completed, in-construction, or planned commercial or residential development across Massachusetts. Projects in MassBuilds are inputted by municipal planning staff, regional planning agencies, and engaged residents. Most project information input is based on local news sources, planning board documents, or local planning knowledge. MAPC’s MassBuilds dataset shows that there is more commercial real estate development planned or envisioned for the region than there are projected jobs for the same area. This information suggests that the supply of commercial development in the pipeline may exceed demand. As a result, it is likely that some of the region’s major planned office and commercial projects may not materialize or may not reach full occupancy; or that existing commercial real estate may experience higher vacancy rates, or some combination of the two scenarios.
Figure 2-8
MassBuilds Job Capacity vs. Projected Employment
Source: Boston Region MPO.
Given the relatively slow pace of overall job growth projected for the coming decades, the growth and decline of certain sectors may have more impact on the region’s economy than the absolute change in the number of jobs. Based on historical trends and national projections by sector, UMDI forecasted that certain sectors would most likely grow rapidly while others would experience continued declines. Specifically, the educational services sector, including colleges and universities, is projected to grow 44 percent in the Boston MPO area and health care and social assistance jobs are projected to grow 40 percent. Together these sectors are projected to gain over 160,000 jobs. Meanwhile, the share of jobs in financial activities and insurance are expected to decrease, while the manufacturing, wholesale trade, retail trade, and utilities sectors are also projected to decline substantially. This reflects long-term trends in production and commerce, with more overseas manufacturing and online purchasing, and fewer labor-intensive retail operations. The slight declines in both basic and retail employment with a growth in service employment could result in the need to repurpose existing buildings and dramatically alter the land use in areas that have large employment centers in these sectors.
Past trends show that many urban municipalities—both in the Inner Core and outlying regional urban centers—experience a large influx of young people but lose them to suburban communities as those residents form families. However, those trends have changed in recent years. When compared to the 1990s, more young people have been moving to urban communities and only a slight number have moved out once they turn 20. An increasingly diverse population attracted by the job proximity, transit access, vibrancy, and cultural assets of urban areas will likely drive continued population growth. MassBuilds data collected since 2010 shows commercial development is more likely to be built near public transportation. From 2010 through 2014, 48 percent of commercial development was within half a mile of public transportation, and 57 percent from 2015 through 2018. Looking out to 2030, 68 percent of commercial development projects in the pipeline are located near public transit.
Figure 2-9
Households by Community Type
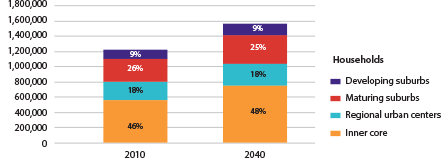
Source: Boston Region MPO.
Figure 2-10
Employment by Community Type
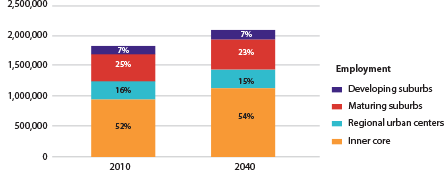
Source: Boston Region MPO.
As described above, losses are projected for both basic and retail employment in the region between 2010 and 2040. To both account for projected development in these sectors in MassBuilds and avoid any major municipal employment loss, MAPC allocated employment in both the basic and retail sectors based on the 2010 employment numbers and any proposed projects in the development pipeline. Due to the difficulties in predicting which industrial and retail centers are better positioned to weather the coming economic changes, and which are more likely to see substantial declines, MAPC adjusted basic and retail employment downward across the region. As a result, no specific employment center is projected to experience catastrophic decline or revival. Instead, this land use scenario reflects the thought that all retail and basic sites will experience slight declines with the overall decline in regional employment. It was projected that the declines in retail were more likely in Maturing Suburbs and Developing Suburbs than the Inner Core or Regional Urban Centers as online retail takes a larger share of purchases previously made at suburban malls and big-box stores. It was projected that the declines in basic employment (for example, manufacturing) were more likely in the Inner Core and Regional Urban Centers given the demand for land for other uses in these areas.
The previous sections defined the Boston Region MPO study area and its existing and projected land use and trends in population, housing, and economic growth in the region. The following section describes the existing transportation system in the MPO region.
Ground transportation systems in the MPO region include roads and associated bridges and tunnels, railroads, rapid transit and light rail lines, multiuse bicycle and pedestrian paths, sidewalks, and navigable waterways. Most of these routes are publicly owned and managed by agencies including MassDOT Highway Division, the MBTA, the Department of Conservation and Recreation (DCR), and individual municipalities. Some railroad lines within the MPO area are owned by freight railroads, and all railroads in Massachusetts connect with the national railroad system, most of which is also privately owned.
Entering, leaving, and transferring between these extensive and interconnected route networks takes place at millions of terminals, ranging in size from residential doorways and driveways at homes and businesses to North and South Stations and the Massachusetts Port Authority’s (Massport) Logan Airport and Conley Container Terminal. These terminals are specialized based on the modes served and types of passenger trips or freight commodities. The simplest intermodal terminal is arguably a bus stop or a parking lot. Origin and destination terminals are publicly or privately owned. Passenger intermodal terminals tend to be publicly owned and freight distribution and consolidation centers are usually privately owned.
Passengers and freight use a mode or combination of modes to travel between origin and destination terminals using available routes. Providers of the transportation service fall into three broad groups:
The discussion of the transportation system in this chapter is organized generally around the major route systems, starting with the roadway system, for which the MPO has a major role in programming investments for improvement and reconstruction. The remainder of this chapter describes the elements of the existing transportation system in the Boston region, including:
The roadway system is the most extensive part of the regional transportation system. It connects with all the other route systems and allows them to operate as part of the overall transportation system. The roadway system consists of rights-of-way (ROW) (owned by MassDOT, local municipalities, independent agencies such as the DCR, or Massport), and a limited number of privately owned roads that allow general traffic.
Roadway system ROW contain roadway pavement, and may also contain medians, traffic islands, sidewalks, or protected paths designated for bicycles. The pavement can be striped for motor vehicle travel lanes of varying width and varying restrictions such as high-occupancy vehicle lanes, bus lanes, bicycle lanes, or parking. ROW pavement markings are reconfigured at intersections and interchanges to maximize safety while optimizing operations. The use of the curb and parking spaces can be regulated based on time of day or class of vehicle. The creation of curb cuts, small ramps built into sidewalks making it easier for strollers and wheelchairs to pass into the road, is governed by laws and regulations. Medians and other parts of ROW are often landscaped and the roadway is an important part of the public realm, with respect to appearance as well as transportation.
The modes and users traveling on the roadway system include
The design of each roadway system ROW determines the access, capacity, efficiency, and safety that members of these user groups will experience when using that part of the system.
Many trip origins or destinations are at facilities very close to or physically connected to a public transportation facility. This type of configuration dates back to the invention of modern rapid transit systems over 100 years ago. However, today new developments are actively encouraged to build in close proximity to fixed-guideway transit services, a practice commonly referred to as transit-oriented development (TOD). However, for the foreseeable future, the vast majority of trips, motorized or nonmotorized, will begin or end at some point on the roadway system.
For purposes of planning and analysis, roadways are grouped into functional classes. Functional classes reflect the role that groups of roadways play in the overall transportation system rather than their physical attributes. The Federal Highway Administration and MassDOT define functional classes and subclasses slightly differently, however, there is congruence between the two systems at a higher classification level using four overarching groups; interstate highways, arterials, collectors, and local roads and streets.
Interstate highways are defined by United States statute that, as the name implies, forms a system whose components extend from state to state across the contiguous 48 states. At the opposite extreme are local roads and streets that can be as limited as a dead end cul-de-sac, or more likely, a street that goes for one or a few blocks. Collector roads may not be physically larger than local streets, but they are more important because they connect with arterials. Arterials are a broad class of roads that include express highways built to interstate standards that are not designated as part of the interstate system. These important distinctions are reflected in the various arterial subclasses used in federal or state level analyses.
The composition of the region’s roadway system is summarized in Table 2-1. Federal recordkeeping guidelines require that roads be characterized by both lane-miles and centerline miles, which reflects the geographical distance that the roads cover. For the system as a whole, there are 10,966 centerline miles which comprise a total of 22,982 lane-miles in the Boston region. Most regional roads have two lanes. However, with a small number of one-lane roads and the added lanes of multi-lane roads and highways, the average is 2.1 lanes.
Table 2-1
Boston Region MPO Roadway Miles by Functional Class
Functional Class |
Centerline Miles |
Percent |
Lane Miles |
Percent |
Average Lanes |
All Functional Classes |
10,966 |
100.0 |
22,982 |
100.0 |
2.1 |
Local |
7,403 |
67.5 |
14,162 |
61.6 |
1.9 |
Collector |
1,208 |
11.0 |
2,414 |
10.5 |
2.0 |
Arterial |
2,179 |
19.9 |
5,252 |
22.9 |
2.4 |
Interstate |
176 |
1.6 |
1,154 |
5.0 |
6.6 |
MPO = Metropolitan Planning Organization.
Source: Massachusetts Road Inventory Report, 2017.
More than half of the roadway miles in the region, whether measured by centerline or lane miles, are local streets and roads. Because there are very few local streets with more than two lanes, and a sizeable number with only one lane, the average local street averages 1.9 lanes. Collectors, the smallest group of non-interstate roadways, are almost entirely two-lane streets.
There are 2,179 miles of arterial roadways in the Boston Region MPO. The primary function of an arterial road is to deliver traffic from collector roads to freeways or expressways, and between urban centers at the highest level of service possible. Some arterial roadways are also limited-access roads.
There are only 176 centerline miles of interstate highways in the Boston region, 1.6 percent of the total, but these comprise of 1,154 lane miles, or 5.0 percent. This represents an average of 6.6 lanes, reflecting the mix of six- and eight-lane sections, plus the four-lane section of Interstate 90 through the Ted Williams Tunnel.
All of the interstate highways in Massachusetts are owned by MassDOT. However, MassDOT only owns 23 percent of the arterial centerline miles in the Boston Region MPO area, with the municipalities owning 72 percent and the DCR owning 5 percent. The municipalities own 98 percent of the collectors and 87 percent of the local roads and streets. The remaining 13 percent of local roadways are privately owned public ways. These public ways are often referred to as “unaccepted,” because the municipality at some point declined to accept ownership of the roads and the associated maintenance commitment. Altogether, 84 percent of roadway miles in the MPO region are owned by local municipalities.
It is possible to travel by different modes while staying entirely within the roadway system. Travelers can drive, walk, or ride a bicycle for the entire length of a trip. Travelers can also use transportation services such as taxis, TNCs, public transit buses or private shuttle buses that operate within the roadway system. For these trips, the terminals can be quite simple—the vehicle stops at a curb or parking lot, and the users enter or leave the vehicle.
Transferring between the roadway route system and another transportation system, such as transit, civil aviation, or navigable waterways, can be more complex and may include a variety of connections. The effectiveness of any transportation service is dependent on its connection with the roadway system.
The Boston Region MPO’s transit system includes three forms of rail transit: heavy rail, light rail, and commuter rail, as shown in Figure 2-11. Heavy rail and light rail are operated directly by the MBTA; the commuter rail is operated under contract for the MBTA, which owns the rolling stock and most of the fixed facilities. The transit system also includes a network of bus routes operated by or for the MBTA, and various regional transit authorities (RTAs) that also operate in the region, as well as passenger ferryboat service.
The present transit system has evolved over a span of nearly 200 years. Predecessors of most of the commuter rail lines were opened by 1850, and the histories of many present day bus routes can be traced to horse-drawn street railways built in the latter half of the nineteenth century. Although the system has always served passengers with a variety of trip purposes, the major focus has been to serve people traveling to and from work in downtown Boston.
At present, all of the commuter rail and heavy rail rapid transit lines, and all but one of the light rail lines serve downtown Boston directly. The majority of bus routes do not run into downtown Boston, but connect with one or more heavy rail, light rail, or commuter rail lines that do. All ferryboat routes funded by the MBTA serve terminals on the downtown Boston waterfront.
Figure 2-11
Rail Transit in the Boston Region
Source: Boston Region MPO.
Service frequency on all lines is greatest during the traditional commuting hours of Boston arrivals between 6:00 AM and 9:00 AM, and departures between 3:30 PM and 6:30 PM. Some commuter rail lines have intervals of more than two hours between off-peak trains, and some routes have no off-peak service.
The MBTA’s heavy rail system has three lines: the Red, Orange, and Blue Lines. These operate over a mix of surface private ROW, subways, open cuts, embankments, bridges, and highway medians. All segments are fully separated from road traffic. South of downtown Boston, the Red Line divides into the Ashmont and Braintree Branches, while the Orange and Blue Lines have only one route.
All stations on these lines have off-train fare collection via electronic fare gates. Power for the Red and Orange Lines is supplied exclusively via third rail. Power for approximately one-third of the Blue Line is supplied via third rail and the rest via overhead catenary.
For historical reasons, the cars on the Red, Orange, and Blue Lines are not interchangeable, and there are no track connections between any of them. However, the stations in downtown Boston include one shared by the Orange and Blue Lines (State) and one shared by the Orange and Red Lines (Downtown Crossing), where free transfers can be made within the paid areas. The Red and Blue Lines have no stations in common.
The light rail system has five lines: the B, C, D, and E branches of the Green Line, and the Mattapan Trolley. Power for all five lines is supplied via overhead wires. The Green Line branches all operate through some portion of what is known as the Central Subway, but also include approximately 0.8 miles on viaduct and elevated structures.
All Central Subway stations (from Kenmore and Symphony to Lechmere) have off-train fare collection. One Central Subway station (Park Street) is shared with the Red Line and one (Government Center) with the Blue Line. Two stations (North Station and Haymarket) are shared with the Orange Line. A pedestrian tunnel within the paid station areas connects Park Street on the Green and Red Lines with Downtown Crossing on the Orange and Red Lines.
Outside the Central Subway, fares are collected on-board the cars at all stops except Riverside Station on the D Branch, which has fare gates. The surface portion of the D Branch runs on a private ROW of a former commuter rail line, with no vehicular grade crossings. The surface segments of the B and C Branches and approximately 60 percent of the E Branch operate in center-of-street reservations, with many at-grade crossings of other streets. The rest of the E Branch has in-street running with no separation from other traffic.
The Mattapan Trolley operates over the private ROW of a former commuter rail line. It has two grade crossings of streets. The inner terminal of the Mattapan Trolley is the Red Line Ashmont Branch outer terminal. The fare system allows free transfers between the two lines, but not within a paid area. Unlike the Green Line, which uses modern light rail vehicles, the Mattapan trolley uses World War II era streetcars.
The MBTA commuter rail system has 14 lines that were all historically owned and operated by railroad companies that were part of the national rail network. The term commuter rail originated in the mid-1800s, in reference to railroad lines that offered discounted or “commuted” fares to frequent riders, especially those making daily trips between home and work. In recent years, commuter rail operating entities in some North American cities have switched to using terms such as regional rail to emphasize that their service is not just for people going to and from work.
After initially subsidizing commuter service run by railroad companies in the 1960s, the MBTA gradually took ownership of most of the ROW and stations, bought new rolling stock, and hired management companies other than the railroads to run the service. The current operator is Keolis Commuter Services. All trains are run with diesel-electric locomotives and coaches in push-pull configuration, with a control cab at the opposite end from the locomotive.
Five of the MBTA commuter rail lines were formerly part of the Boston and Maine (B&M) Railroad system, and terminate at North Station in Boston. These are the Newburyport and Rockport Lines, which share track south of Beverly Junction, and the Haverhill, Lowell, and Fitchburg Lines. A cross-connection called the Wildcat Branch links the Lowell Line at Wilmington with the Haverhill Line at Wilmington Junction.
Except for the Newburyport and Rockport Lines north of Salem Station, all of these lines also have some freight service, run by Pan Am Railways, successor to the B&M. Amtrak intercity Downeaster service between Boston and Brunswick, Maine uses the Lowell Line south of Wilmington, the Wildcat Branch, and the Haverhill Line north of Wilmington Junction.
The other nine commuter rail routes terminate at South Station in Boston. The Worcester Line was historically part of the New York Central Railroad system. The Needham, Franklin, Providence, Stoughton, Fairmount, Middleborough/Lakeville, Kingston/Plymouth, and Greenbush Lines were all historically part of the New York, New Haven and Hartford (New Haven) Railroad system.
The Providence and Stoughton Lines share tracks north of Canton Junction, and also share tracks with the Franklin Line, north of Readville and with the Needham Line, north of Forest Hills. The Middleborough/Lakeville and Kingston/Plymouth Lines share tracks north of South Braintree, and both also share tracks north of Braintree with the Greenbush Line.
From Memorial Day weekend through Labor Day weekend, the MBTA runs one round trip train per day, Friday through Sunday, between Boston and Hyannis on Cape Cod. This service, called the Cape Flyer, uses the route of the Middleborough/Lakeville Line between South Station and Middleborough/Lakeville Station.
An 11-month pilot program of commuter rail service to Foxborough is expected to begin in 2019. This service will be an extension of selected Fairmount Line trains, using the Franklin Line between Readville Station and Walpole Station, and a line between Walpole Station and Gillette Stadium in Foxborough that is used for special trains to football games and other events at the stadium.
CSX Transportation operates freight service on the Worcester, Franklin, and Stoughton Lines, the Providence Line between Readville and Attleboro, the Middleborough/Lakeville Line south of Braintree, and the line between Walpole and Gillette Stadium. The Providence and Worcester Railroad operates freight service on the part of the Providence Line in Rhode Island. The Fore River Railroad operates freight service on the Greenbush Line between Braintree and East Braintree. The Massachusetts Coastal Railroad operates freight service on the Cape Flyer route south of Middleborough/Lakeville Station. The other lines emanating from South Station have no freight service at present.
The Providence Line is also part of Amtrak’s Northeast Corridor, which carries intercity passenger trains between Boston, New York City, Washington, D.C., and points in Virginia. Amtrak also operates one daily round trip on the Worcester Line as part of a route to Chicago.
Six MBTA bus routes are classified as Bus Rapid Transit (BRT). These routes are branded as the Silver Line (SL) and are divided into two sub-groups.
The Silver Line Washington Street group includes Routes SL4 and SL5. Both routes use articulated hybrid diesel-electric buses. The outer terminal of Routes SL4 and SL5 is at Dudley Square in Roxbury. They share the same alignment, mostly on Washington Street, as far north as Essex Street. From there, Route SL5 continues to Temple Place and Route SL4 diverges to South Station. Most of the alignment outside downtown Boston has reserved bus lanes designated by pavement markings but with no physical barriers separating them from other traffic. The inbound segment unique to Route SL4 also has a reserved bus lane. Otherwise, within downtown Boston Routes SL4 and SL5 operate in mixed traffic.
The Silver Line Waterfront group includes Routes SL1, SL2, and SL3. These routes use articulated dual-mode vehicles that can run either on electric power supplied through overhead wires or with power from diesel engines. Buses on all three routes run in electric mode through a subway and open cut between South Station and Silver Line Way in South Boston, where they switch to diesel mode. From Silver Line Way, Routes SL1 and SL2 continue in mixed traffic to their respective endpoints at Logan Airport and at the Boston Design Center. Route SL3 runs in mixed traffic from Silver Line Way to Eastern Avenue in Chelsea then continues on private ROW on a former freight railroad line to its endpoint at Everett Avenue.
Excluding the Silver Line BRT routes, the MBTA bus network consists of 164 directly operated routes and five routes operated for the MBTA by private contractors. These routes operate in 44 of the 176 cities and towns in the MBTA district. Other RTAs provide bus service to some cities and towns in the MBTA district that do not have MBTA bus service.
Of the MBTA bus routes, all but seven have at least one direct connection to the heavy rail rapid transit or light rail system. The seven routes that do not have heavy- or light-rail connections have direct connections to commuter rail stations, and to bus routes that have rapid transit connections.
The MBTA classifies all non-BRT routes as either local or express. Of the 169 directly operated or contracted routes, 23 are classified as express. All but one of the express routes runs between a suburb and downtown Boston or Back Bay, and includes a segment on a limited-access highway. Some of the express buses can also be used for local travel on the suburban end.
In addition to the five bus routes operated for the MBTA by private carriers, the MBTA provides partial funding for town-based fixed-route local bus systems in Bedford, Beverly, Burlington, and Lexington, and a community-based route in the Mission Hill neighborhood of Boston. A local bus system in Dedham was formerly funded by the MBTA but now operates with town funds.
Other than the MBTA, most of the RTAs in Massachusetts only serve cities and towns outside the Boston region, but there are a few exceptions. The state enabling legislation for the RTAs requires them to contract with private carriers to operate their services rather than running services directly.
The MetroWest Regional Transit Authority (MWRTA) is one of only two RTAs operating entirely within the Boston Region MPO area. The MWRTA currently provides fixed-route local bus service in Ashland, Framingham, Holliston, Hopkinton, Hudson, Marlborough, Milford, Natick, Sherborn, Southborough, Wayland, and Wellesley, and also provides service from Natick and Wellesley to Newton-Wellesley Hospital and the MBTA Woodland Station in Newton, and from Massachusetts Bay Community College in Wellesley to Riverside Station in Newton. The MWRTA is planning a trial service to Riverside Station from Marlborough and intermediate towns along Route 20.
The MWRTA also runs the MetroWest Ride, a shared-ride paratransit service for residents of Framingham, Natick, Wellesley, and Dover with disabilities that prevent them from using the MWRTA’s fixed-route bus service. MetroWest Ride service includes connections at Riverside Station with the MBTA’s THE RIDE service, discussed below. A separate MWRTA Dial-A-Ride system serves residents of Ashland, Marlborough, Southborough, and Wayland who have disabilities certified, according to the Americans with Disabilities Act.
The Cape Ann Regional Transit Authority (CATA) provides year-round weekday and Saturday bus service in Gloucester and Rockport, and Saturday-only service between Gloucester and shopping malls in Danvers and Peabody. CATA also provides summer weekend and holiday bus service between the Ipswich commuter station, Crane Beach in Ipswich, and the town of Essex. All of the CATA routes are entirely within the Boston Region MPO area.
CATA also operates Dial-A-Ride service in Gloucester, Rockport, Essex, and Ipswich for persons over 60 years of age and for adults with physical, mental, or cognitive disabilities. A separate CATA paratransit service, only in Gloucester and Rockport, is for individuals who are unable to use fixed-route service because of physical, mental, or cognitive disabilities.
The Merrimack Valley Regional Transit Authority provides bus service to cities and towns outside the Boston Region MPO area, but also provides weekday express bus service to downtown Boston during commuting hours on one route from North Andover, Methuen, Lawrence, and Andover.
The Lowell Regional Transit Authority provides bus service to cities and towns outside the Boston Region MPO area, but also provides service outside the Boston Region MPO area from Lowell and Billerica to the Burlington Mall and the Lahey Clinic in Burlington, and to other employment locations in Burlington and Bedford.
The Greater Attleboro Taunton Regional Transit Authority (GATRA) provides bus service primarily to cities and towns outside the Boston Region MPO area. However, GATRA also runs some local bus services in Bellingham, Franklin, Norfolk, Wrentham, Foxborough, Marshfield, and Scituate.
The Brockton Area Transit Authority provides bus service primarily to cities and towns outside the Boston Region MPO area, but has one route from Brockton to Ashmont Station with stops in Boston MPO communities, Randolph, and Milton.
THE RIDE is a demand-responsive transit service operated by private carriers under contract with the MBTA that provides transportation to people who cannot use fixed-route public transportation because of a disability, either all or some of the time. THE RIDE operates sedans and lift-equipped vans within 58 municipalities in the MBTA district and small portions of six other municipalities within three-quarters of a mile of MBTA fixed-route service. It is a shared-ride service provided 365 days a year from 6:00 AM to 1:00 AM. About 6,600 passengers use THE RIDE on an average weekday.
Passenger ferryboat service in the Boston Region MPO area includes a mix of year-round routes operated under contract for the MBTA or other public agencies, seasonal routes sponsored by municipalities, and unsubsidized routes run by for-profit companies.
At present, Nolan Associates, also known as Boston Harbor Cruises (BHC), is the largest ferry operator in the Boston area. BHC runs three year-round routes under contract with the MBTA: Route F1 from Hingham to Rowes Wharf, Route F2H from Hingham to Long Wharf via Hull and Logan Airport, and Route F4 from Charlestown to Long Wharf. For historical reasons, BHC owns the boats used on Routes F1 and F4 and the MBTA owns the boats used on Route F2H.
In January 2019, Bay State Cruise Company (Bay State) began running a route called the North Station/Seaport Ferry between Lovejoy Wharf near North Station and a wharf near the Institute of Contemporary Art (ICA) in South Boston. This service is a one-year demonstration under contract from the Massachusetts Convention Center Authority with funding from several large employers in the Seaport District. It replaces shuttle buses that previously ran between North Station and the Seaport. Bay State has leased two boats from a New York Harbor ferry operator for this service. The service is intended for employees of the sponsoring companies, but a few seats on each trip are available (by advance reservation) for members of the general public.
The Town of Winthrop runs a seasonal ferry service between a town-owned landing and Boston. Most recent service was run from mid-April to the end of November. The Boston stops have varied, but in 2019, the expected stops will be the Aquarium Wharf and the wharf at the ICA. Some trips also serve a wharf at Marina Bay in Quincy. The boat used for this service is owned by the town and was acquired partly with federal funds obtained by the state. The service is unusual in that it is run by permanent and seasonal town employees rather than by a ferry company.
BHC also runs a seasonal ferry service between Salem and Long Wharf in Boston by arrangement with the City of Salem, which owns the Salem terminal and the boat used on the route. These were funded partly with federal and state grants. BHC leases the boat from the city and does not receive any operating subsidy. One trip on weekdays in each direction is scheduled for commuting to and from work in Boston. Residents of Salem or nearby North Shore communities are eligible for discounted fares on these trips.
BHC and Rowes Wharf Water Transport, also known as Rowes Wharf Water Taxi, each run year-round on-demand water taxi service between several designated stops on the downtown Boston waterfront and South Boston, East Boston, and Charlestown. The Logan Airport Ferry Terminal is the largest single source of ridership for these services.
From mid-May to mid-October, BHC runs unsubsidized seasonal ferry service from Long Wharf to Spectacle Island and Georges Island in the Boston Harbor Islands State and National Park. BHC also runs connecting service from Georges Island to Peddocks Island and Lovells Island, and service from Hingham to Bumpkin, Grape, Peddocks, Lovells, and Georges islands. During the months of service, BHC also adds an intermediate stop at Georges Island on MBTA ferry route F2H for passengers traveling between the island and Hingham.
The Thompson Island Outward Bound Education Center runs summer weekend ferry service for the general public from the EDIC Pier on the Reserved Channel at Summer Street in South Boston to Thompson Island. Year-round service on the same route is provided for staff and students of Education Center programs on the island.
As noted above in “The Public Transit System” section, the lines on which MBTA commuter rail trains currently run were historically owned and operated by railroad companies that were a part of the national rail network. When the MBTA bought these lines, the companies that sold them, and later successors to these companies, retained perpetual rights to operate freight service on them. However, much of the rail-dependent industry formerly located on these lines has given way to other kinds of enterprises for which shipping or receiving freight directly in carload volumes is not a consideration anymore. In response, the railroads have discontinued freight service on several of the MBTA-owned lines and have given up their rights to reinstate it.
Some of the lines on which freight service has been discontinued are now used exclusively for MBTA passenger service. Other lines have been converted to rail trails, with the MBTA retaining the right to convert them back to active rail lines if the need should arise in the future. Several cities and towns are in various stages of planning additional rail trails on MBTA-owned ROW. The MBTA has also sold a few parcels of former railroad property for redevelopment.
The National Railroad Passenger Corporation (Amtrak) was created by the federal government in 1971 to relieve the private railroad companies of the responsibility to operate intercity passenger trains. While Amtrak has statutory authority to run its trains over lines still owned by railroads, public agencies, or other parties, it must pay for the use of these lines.
In 1976, ownership of the segments of the Northeast Corridor rail line between Boston and Washington, D.C., not already owned by public agencies was transferred from private ownership to Amtrak. This excluded the section from Boston to the Rhode Island border, which the MBTA had bought previously. The MBTA also owns all the lines between Boston and the New Hampshire border used for Amtrak’s Downeaster service, and the segment of Amtrak’s Boston–Chicago route between Boston and Worcester. CSX transportation owns the rest of this line from Worcester to the New York border.
Rail is an important freight mode in the United States, New England, and the Boston Region MPO area. This importance is not immediately apparent, however, because of the widespread adoption of intermodal rail technology, where truck trailers and shipping containers are carried over long distances by rail, and then lifted from trains and hauled to customers by truck tractors. CSX Transportation operates a large intermodal lift facility in Worcester. Pan Am Southern, LLC, a joint venture of Pan Am Railways and the Norfolk Southern Corporation, operates the Ayer Intermodal Facility in the former Fort Devens space in Ayer. Both Worcester and Devens are outside the Boston Region MPO area, but many containers lifted at these facilities begin or end their journeys in the MPO region.
Some freight is still moved by freight cars delivered directly to shippers or receivers facilities. Carload rail is an especially competitive freight mode for bulk commodities such as cement, gravel, or chemicals, and construction materials such as lumber and steel. In some instances, boxcars are still competitive for moving manufactured goods. Freight cars are also picked up and dropped off for a number of MPO region industrial customers located near one of the regional rail lines, including both lines with passenger service and freight-only branches.
Airspace forms a route system in two respects. First, commercial air carriers, both passenger and freight, operate flights according to published schedules to non-stop, multi-stop, and connecting destinations across the world. The second route system is the approach and departure corridors, conditions, and rules that govern the safe operation of an airfield. Different wind and visibility conditions require the use of specific runways by specific types of aircrafts for landing or takeoff. These runway and approach patterns are defined in advance in consultation with the Federal Aviation Administration and have the force of law, which means no tradeoff of safety for operational convenience is acceptable.
Under certain circumstances, light aircraft and helicopters are allowed to file flight plans where they can operate using what are called Visual Flight Rules (VFR). Near Logan Airport, an aircraft using VFR must avoid the active takeoff and approach corridors. The traffic helicopters that frequent Boston’s airspace during rush hour are operating under VFR. These small aircrafts are often collectively referred to as general aviation.
Logan Airport, located in East Boston, is owned and operated by Massport and is the sixteenth busiest airport in the United States for passenger travel, serving about 41 million passengers in 2018. It has a similar rank in terms of flight operations and air cargo handled.
Logan Airport operates on 1,700 acres of land. Within this area, less than 2.7 square miles, Logan has 8.8 miles of runways and paved overrun areas. These include four runways at least 1.5 miles in length and two shorter auxiliary runways. As the airport is surrounded by water and residential neighborhoods, Logan’s owner, Massport, has been forced to use its limited real estate as efficiently as possible to accommodate growth in air travel.
Logan Airport is also acknowledged to have one of the most convenient locations with respect to the city center and other important local venues. It is within two miles of downtown Boston. To a large degree, public transportation access to Logan Airport utilizes the same fixed-guideway transit routes that are used by daily commuters. The rapid transit Blue Line Airport Station is located on the perimeter of the airport, with free Massport shuttle bus connections to all the airline terminals and to Massport offices. In downtown Boston, the Blue Line connects with the Green and Orange Lines in the Government Center area and the northern end of the financial district. The Silver Line SL1 route connects Logan Airport with the Boston Convention and Exhibition Center (BCEC) in the Seaport District, and also with South Station, which includes the Red Line, south side commuter rail lines, Amtrak Northeast Corridor and Chicago trains, and large employment centers at the southern end of the financial district.
Access to Logan Airport by employees via public transportation is also important. Massport and individual employers at the airport have considerable influence over the type of vehicle access that is available to the various classes of employees. Use of parking spaces at the airport by air travelers is viewed as a priority. The airport also has a ferry terminal served by MBTA ferries running between Hingham, Hull, and Long Wharf and by privately operated water taxis from points throughout the Inner Harbor.
The fixed-guideway transit route system plays an important role in the work travel market. The Blue Line extends to several residential neighborhoods in Revere, where it also connects with buses. The recently implemented SL3 route originates on a busway in Chelsea and connects with the Newburyport/Rockport commuter rail line at Chelsea Station. The SL3 does not stop at any of the airline terminals or Massport offices, but it connects with the Massport shuttle buses at Airport Station. Massport also runs an employee-only shuttle bus that shares some of the SL3 route from an off-airport garage it owns.
Logan Airport is not New England’s only airport, but it is certainly the most important. From outside of the urban core, an extensive network of bus services brings passengers and employees from many points in New England directly to Logan Airport. Some of these buses also carry commuters to the Boston intercity bus terminal, located above the commuter and intercity rail platforms at South Station. Massport also funds Logan Express bus service to the airport from four terminals outside the Route 128 circumferential corridor in Peabody, Woburn, Framingham, and Braintree, where secure long-term parking is offered for travelers.
The necessary roadway system to support efficient operations at Logan Airport is complicated. Some of the transit services, mostly using buses, have already been described. A partial list of specific vehicle moves supported by Logan’s roadway system helps illustrate the challenges facing the roadway system:
As previously described, because the physical constraints prevent the roadway and other access systems at Logan from growing outwards, alternatively, they must grow upwards. The circulation system is now two levels at all terminals and at the consolidated car rental facility. A third roadway level would be impractical, however, an automated on-airport fixed guideway system (to move passengers across terminals—also referred to as a people mover) is under consideration.
Hanscom Field, located 20 miles northwest of Boston, just outside of Interstate 95/Route 128 in the towns of Bedford, Concord, Lexington, and Lincoln, is the busiest general aviation airport in New England. With no scheduled commercial flights, Hanscom Field has attracted office and light industrial development along nearby roads, appealing to firms that value access to convenient business, charter, private, and air-taxi flights. Massport operates Hanscom Field.
In addition to Logan Airport and Hanscom Field, the MPO region includes other public-use airports: three municipally owned in Beverly, Norwood, and Marshfield, and one privately owned in Stow. The business of these airports is supporting general aviation with facilities such as tie-down rentals and services such as flight instruction, fuel sales, and light repair.
The locations of shipping channels are not as obvious as the locations of transportation arteries on land. However, to avoid running aground, waterborne vessels of all sizes must travel in designated lanes suitable for their dimensions, especially in port areas. The US Army Corps of Engineers (the Corps) is responsible for maintaining the major navigable waterways of the United States.
The basic structure of Boston Harbor has not changed since colonial times and is similar to other coastal port systems. There is a main shipping channel entering from the ocean that meets navigable tributary rivers. The ability of these channels to accommodate navigation gradually decreases as one moves father from the ocean. As described by the Corps, the Boston main channel is six miles long and 40 feet deep, extending from Massachusetts Bay, also referred to in the description as “the sea, to the entrance of the Mystic and Chelsea Rivers.” The eastern end of the channel is near the eastern limit of the Boston Harbor Islands State and National Parks.
The history of navigation has been characterized by steady increases in vessel sizes. Improvements in metallurgy, propulsion, and construction practices have allowed larger ships to be built, carrying both passengers and freight. Larger ships generally reduce the unit costs or the cost per passenger or pound, an economic condition called economies of scale. To be a competitive port, Boston must accommodate vessels of all sizes that are currently operating in its target markets.
In July 2018, a project to increase the depth and width of the Boston main shipping channels between the sea and the Conley container terminal at Castle Island got underway, under a partnership between Massport and the Corps. The depth of the North Channel will be increased to 51 feet at mean low water. The depth of the main channel and the Reserved Channel at the Conley terminal will be increased to 47 feet. This $122 million project is expected to take three years. Future plans include increasing the depth of the Chelsea River channel to 38 feet, and the depth of the Mystic River channel to 40 feet.
Increasing the depth of the main channel to greater than the present 40 feet west of Castle Island is not feasible because of the depth of the Interstate 90 Ted Williams Tunnel under the channel. Before this tunnel was built, the channel depth was constrained farther upstream by the Blue Line rapid transit tunnel and the Sumner and Callahan highway tunnels. Consequently, there is limited potential for the Port of Boston to serve large modern container ships such as the “Post Panamax” class, which draw 51 feet of water.
Massport operates two modern terminal facilities on the Reserved Channel (described below): the Paul W. Conley Container Terminal and the Raymond L. Flynn Cruiseport Boston Terminal (formerly Black Falcon Terminal).
The shoreline of the inner harbor is now almost entirely nonindustrial, but Mystic and Chelsea River tributaries still host important ocean-going commerce. The existing Charles River Dam locks allow for industrial barges to enter the Charles River, but no remaining industries on the river use waterborne freight transportation. The water-dependent industries on the Mystic River are located between the Tobin Bridge and the Alford Street Bridge. The riverbanks farther upstream have been made into parks.
The working waterfront is lined with specialized wharves and terminals that support specific types of ships and cargoes. Several of these terminals are owned by Massport, and the rest are privately owned.
The Conley Terminal is a regional facility. All containers entering or leaving this terminal are hauled by truck to or from locations almost exclusively in eastern Massachusetts, Rhode Island, and southern New Hampshire and Maine. Use of the terminal has grown steadily, however, and programs to expand and improve the terminal have been ongoing. A recently completed truck access road has removed about 1,000 daily truck trips from South Boston residential streets.
With the completion of the dredging project, the Conley Terminal will be able to accommodate larger container vessels. Importantly, these vessels do not completely unload when they visit Boston. Containers are stacked on vessels in order to allow the Boston-bound containers to be easily removed, and then the ship can proceed on to its next port of call. The intent of the harbor dredging is to allow the major world shipping alliances to route most vessels in their fleets through Boston.
The Flynn Cruiseport shares the Reserved Channel with the Conley Terminal, and is designed to accommodate the largest cruise vessels. Modern cruise ships, used almost exclusively for leisure travel, would dwarf the great ocean liners of the pre-aviation travel era. Boston has enjoyed steady growth in cruise ship activity, both as a cruise stop and as an originating port. Cruises originating in Boston provide a boost to the local hospitality industry as travelers typically arrive in the city a few days before the cruise.
Massport owns several other waterfront facilities. The Moran Terminal on the Mystic River is used for importing automobiles and light preparation before shipment to regional auto dealers. Massport also owns properties that support the fishing industry, including Boston’s historic Fish Pier. Massport also owns land on the nearby North Jetty that has been leased to build modern seafood processing plants. These facilities are near the water but are served by refrigerated trucks.
The private waterfront terminals mostly handle bulk cargoes. Terminals on the Chelsea River unload, store, and arrange to deliver road salt and refined petroleum products. Terminals on the Mystic River receive cement, fish, liquefied natural gas, and some refined petroleum products. There is also an export terminal on the Mystic River for scrap steel.
The roadway system is the most important route system for pedestrians and bicyclists because it is a complete system reaching virtually any spot in Massachusetts that is possible to travel to. This is the case even if many parts of the roadway system are still substandard with respect to safely accommodating the nonmotorized modes.
There are a growing number of paths for nonmotorized users, some of which are on former railroad ROW. These have been improved to varying degrees but do not benefit from regular maintenance and upgrade programs because they are not generally part of the roadway system.
Few of these paths connect with each other directly, and most trips using these paths require travelers to use the roadway system for some portion of the trip. However, these paths are an important extension of the ubiquitous roadway system for the nonmotorized user. Some of the best known and most heavily used paths include the Minuteman Commuter Bikeway between Cambridge and Bedford on a former railroad ROW, and the Dr. Paul Dudley White Bike Path, along the banks of the Charles River in Boston and Cambridge.
1 Throughout this chapter, the term “Boston Region MPO area” and “Metropolitan Area Planning Council (MAPC)” both refer to the 97 municipalities in the Boston Region MPO area, which are the same as MAPC’s 101 cities and towns excluding Hanover, Duxbury, Pembroke, and Stoughton, which are now members of the Old Colony Planning Council MPO.
2 Please reference http://www.mapc.org/wp-content/uploads/2017/09/Massachusetts-Community-Types-Summary-July_2008.pdf for more documentation on Massachusetts community types.
3 A greenfield site is an undeveloped site being considered for development.
4 MassBuilds: A visual database for detailed information on real-estate developments in Massachusetts.www.massbuilds.com
5 Advisory group participants included representatives from the Federal Reserve Bank of Boston, Massachusetts Housing Partnership, Northeastern University’s Dukakis Center for Urban and Regional Policy, City of Cambridge, UMDI, MassDOT, Executive Office of Labor and Workforce Development, City of Boston, Joint Center for Housing Studies at Harvard University, and the Executive Office of Energy and Environmental Affairs.
6 Headship rates relate to the number of households and the number of adults living in those households. A high headship rate means fewer adults are living in the households. Headship rates by age were derived from 2008–12 American Community Survey Public Use Microdata Sample (PUMS) data so that recent headship rates influenced by the tight housing market were not continued forward. Labor force participation rates were derived from 2012–16 PUMS data to reflect most recent trends in delayed retirement. Please refer to the technical documentation Massachusetts Regional Labor Force and Household Projections Prepared for MassDOT Office of Transportation Planning for more details.
7 Economists refer to the polarization of the labor force when middle-class jobs (requiring a moderate level of skills) seem to disappear relative to those at the bottom, requiring few skills, and those at the top, requiring greater skill levels.
< Chapter 1 - Introduction to the Needs Assessment | Chapter 3 - Travel Patterns in the Boston Region >