An important part of understanding the Boston Region Metropolitan Planning Organization’s (MPO) transportation needs is an understanding of the travel patterns in the region. The information used to analyze travel patterns for the Long-Range Transportation Plan (LRTP), Destination 2040 Needs Assessment was obtained from several sources. Information on highway, transit, freight, bicycle, and pedestrian travel modes was derived from the MPO’s travel demand model, which uses base year (2016) conditions and projects future travel patterns. In addition, information from MPO studies and activities, including freight studies and the 2011 Massachusetts Travel Survey, were used to obtain information on travel patterns in the region.
For transportation planning purposes, the MPO maintains a travel demand model set (referred to as the “model” throughout this report). Because the MPO region travel patterns are strongly influenced by travel demand outside the MPO, the MPO travel demand models have always included a number of neighboring municipalities. For Destination 2040, a newly developed statewide model is being used which includes all 351 Massachusetts municipalities, all of Rhode Island, and 56 municipalities in southern New Hampshire. A detailed description of the modeling process may be found here: https://www.ctps.org/travel_modeling_101.
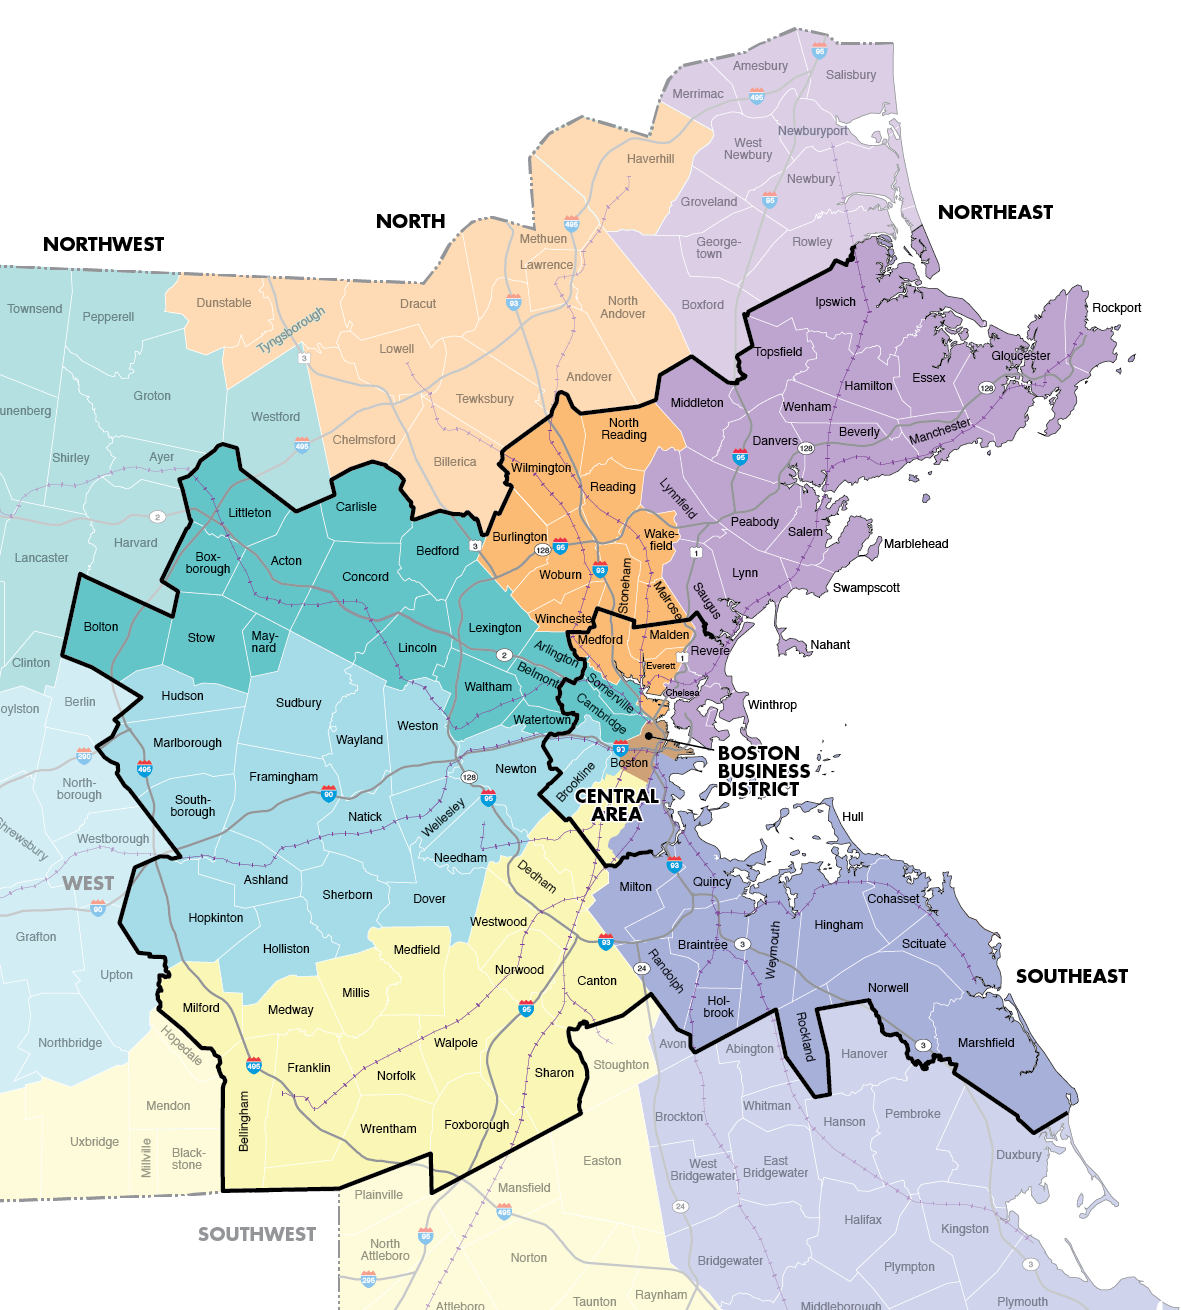
For the purposes of this Needs Assessment, the MPO region has been divided into six radial corridors as shown in Figure 3-1. The municipalities in the Boston Region MPO are shown in darker colors, and adjoining municipalities are indicated with lighter shading of their associated sectors.
Figure 3-1
Radial Corridors, Central Area, and the Boston Business District within the Boston Region MPO Area
Source: Boston Region MPO.
The radial corridors are generally defined by the rail and highway facilities that connect them with Boston. Key infrastructure serving these corridors includes:
The MPO’s model has always included a defined central area where the radial transit services meet and total employment in the area exceeds the total population. The Central Area, as shown in Figure 3-1, includes most of Boston and nine nearby municipalities: Brookline, Cambridge, Somerville, Medford, Malden, Everett, Revere, Chelsea, and Winthrop. Four Boston neighborhoods, Hyde Park, West Roxbury, Roslindale, and Mattapan are not included in the Central Area because their density and travel patterns more closely resemble the neighboring suburban communities.
At the heart of the Central Area is a very densely developed area designated as the Boston Business District (BBD); shown below in Figure 3-2. This area includes “Boston Proper” (as it is known) and the developing South Boston waterfront. More specifically, Boston Proper includes Boston south of the Charles River but bounded by Massachusetts Avenue and Interstate 93 on the west and southeast. The Fort Point Channel separates Boston Proper from the South Boston waterfront. The line separating the South Boston waterfront follows Broadway from the Fort Point Channel to the South Boston Bypass Road, to Cypher Street, to D Street, and then Summer Street as far as the Reserved Channel.
Figure 3-2
The Boston Business District within the City of Boston
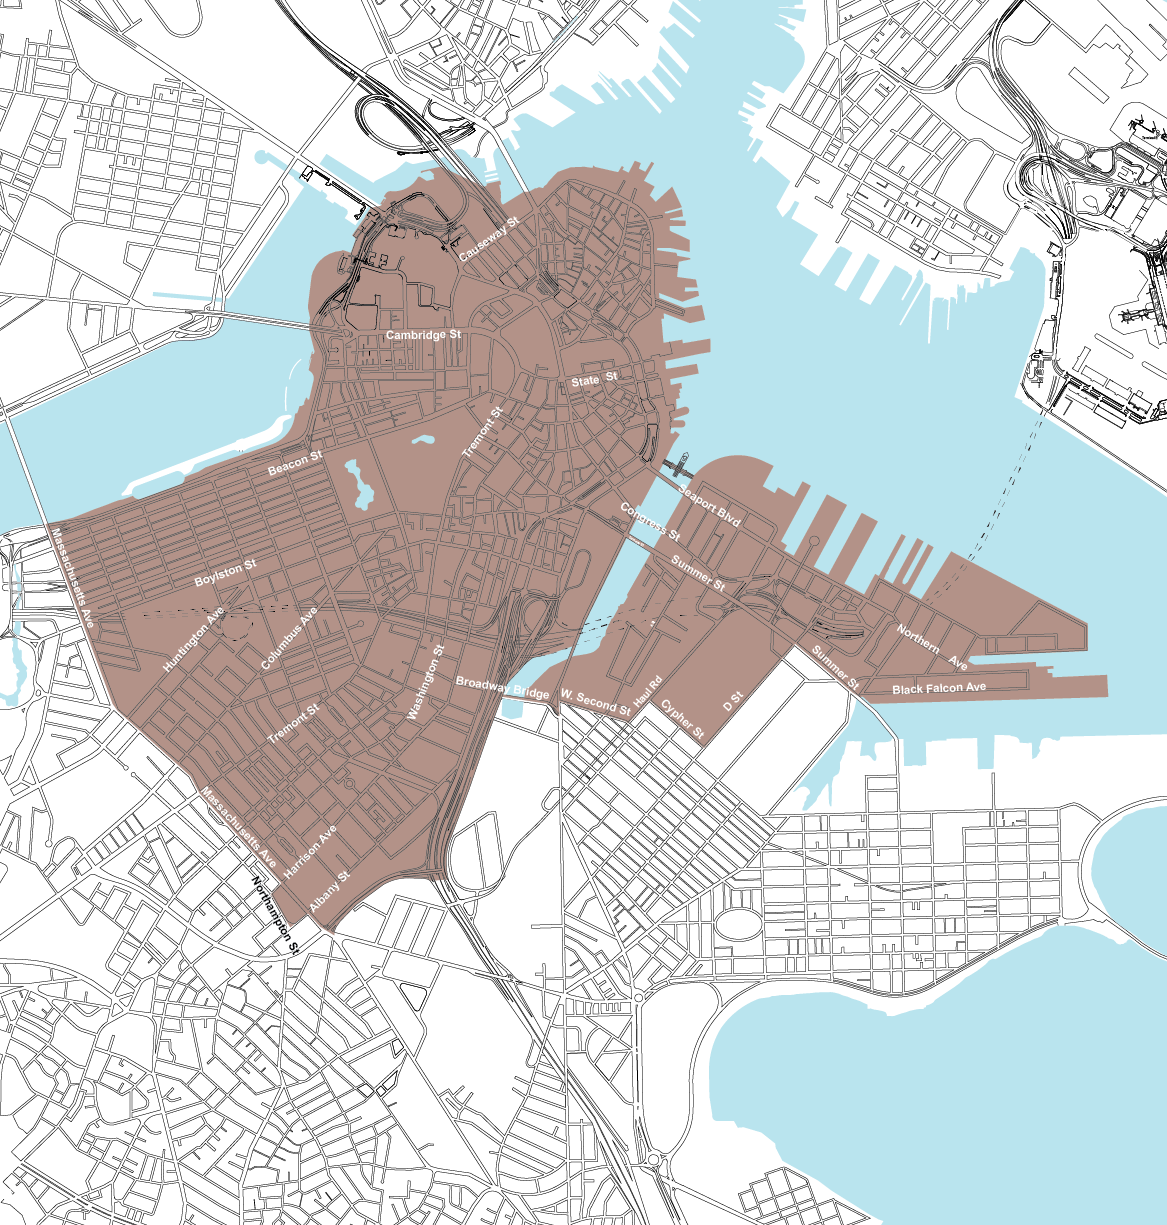
Source: Boston Region MPO.
Land use patterns, growth in employment and population, and trends in travel patterns will affect the demand on the region’s transportation system in different ways. The model is used to assess potential projects and programs in terms of air quality benefits, travel-time savings, and congestion reduction.
The model was used to estimate 2016 base year travel conditions and project future-year 2040 No-Build travel conditions for the Destination 2040 Needs Assessment. No-Build conditions assume that there are no new improvements to the existing transportation system other than those that are currently under construction, advertised for construction, or included in the first year of the Federal Fiscal Years (FFYs) 2019–23 Transportation Improvement Program (TIP) of the Boston Region MPO and TIPs of adjacent MPOs. Base- and future-year travel conditions were estimated for highway, transit, bicycle, and pedestrian travel into the Central Area and into the Boston Business District for an average weekday.
The 2040 socio-economic projections are based on the numbers of households, residents, workers, and available private vehicles in the Boston MPO area. Table 3-1 provides 2016 baseline demographic information and 2040 projections showing population, employment, and household vehicle ownership assumptions in the Boston Region MPO’s 97 municipalities.
The locations and types of the region’s jobs are important factors in regional transportation planning. The many types of professions are divided into three large groups for model development and transportation analysis. Current and projected employment in these three sectors—basic, retail, and service—are shown in Table 3-1. Employment characterized as basic includes manufacturing, warehousing, and transportation. Retail employment includes stores and restaurants. The service sector accounts for almost half of the workforce and includes education, health care, government, finance, and real estate, to name a few.
Table 3-1
Boston Region MPO Current and Projected Demographic Assumptions
Variable |
2016 Base Year |
2040 No-Build |
2016 to 2040 Percent Change |
Population |
3,245,900 |
3,704,500 |
14.1% |
Households |
1,312,000 |
1,582,600 |
20.6% |
Average Household Size |
2.5 |
2.3 |
-5.4% |
Total Employment |
1,923,600 |
2,084,700 |
8.4% |
Basic |
365,400 |
344,600 |
-5.7% |
Retail |
308,700 |
297,600 |
-3.6% |
Service |
1,249,500 |
1,442,500 |
15.4% |
Households with Vehicles |
|
|
|
0 Vehicle |
15% |
15% |
0% |
1 Vehicles |
38% |
40% |
2% |
2 Vehicles |
31% |
33% |
2% |
3+ Vehicles |
16% |
12% |
-4% |
Source: Boston Region MPO.
The Boston Region MPO area is an important center for employment and other activities and the area both influences and is influenced by travel activity over much of New England, even though it is a comparatively small MPO with only 97 municipalities. To understand the area, the extensive Massachusetts statewide travel demand model is used to project future travel. MPO-wide travel statistics developed using this model are summarized in Tables 3-2 and 3-3.
Table 3-2
Boston Region MPO Weekday Person-Trips by Travel Mode
Travel Mode |
2016 Base Year |
2040 No-Build |
2016 to 2040 Percent Change |
All Modes |
13,960,900 |
15,861,700 |
13.6% |
Auto |
11,096,700 |
12,421,900 |
11.9% |
Transit |
1,021,900 |
1,183,700 |
15.8% |
Nonmotorized |
1,842,300 |
2,256,100 |
22.5% |
Source: Boston Region MPO.
Table 3-3
Boston Region MPO Average Weekday Mode Shares
Travel Mode |
2016 Base Year |
2040 No-Build |
All Modes |
100% |
100% |
Auto Share |
80% |
79% |
Transit Share |
7% |
7% |
Nonmotorized Share |
13% |
14% |
Source: Boston Region MPO.
As shown in Tables 3-2 and 3-3, person-trips for all modes in the Boston Region MPO are projected to increase. However, the auto share is projected to decrease slightly and the nonmotorized modes (for instance, walking and cycling) are projected to increase. The transit share is expected to change very little. Increasing congestion, especially in the inner core, likely contributes to this trend in mode shares.
This shift could also be a consequence of shifting demographics whereby people are moving into urban areas. This is consistent with the Metropolitan Area Planning Council’s (MAPC)plan (entitled MetroFuture) for the region which suggests that younger households may be more inclined toward urban living and living closer to where they work. Another factor contributing to the decrease in auto mode share is the decrease in the share of three-plus vehicle households (see Table 3-1). Less access to automobiles along with increased usage of Transportation Network Companies (TNC) and car sharing services also contributes to a decrease in the auto share.
Recent and projected travel on the Boston MPO area’s road system is summarized in Table 3-4. The number of auto and truck trips, vehicle-miles traveled, and vehicle-hours traveled are all projected to increase between 2016 and 2040. Average speeds are expected to decrease in the future because of the increase in the number of vehicles exacerbating congestion. Average trips lengths derived from this table show a slight decline from 6.8 miles in 2016 to 6.6 miles in 2040, with the average travel time staying steady at 17 minutes.
Table 3-4
Boston Region MPO Estimated Weekday Highway Use Statistics
Vehicle use Statistic |
2016 Base Year |
2040 No-Build |
2016 to 2040 Percent Change |
Vehicle Trips |
10,834,400 |
12,119,600 |
11.9% |
Auto |
8,682,000 |
9,723,700 |
12.0% |
Trucks |
2,152,400 |
2,395,900 |
11.3% |
Vehicle-Miles Traveled |
73,688,400 |
80,496,600 |
9.2% |
Auto |
60,774,000 |
66,121,200 |
8.8% |
Trucks |
12,914,400 |
14,375,400 |
11.3% |
Vehicle-Hours of Travel |
3,004,700 |
3,372,400 |
12.2% |
Auto |
2,556,500 |
2,846,800 |
11.4% |
Trucks |
448,200 |
525,600 |
17.3% |
Average Speed |
24.5 |
23.9 |
-3.8% |
Auto |
23.8 |
23.2 |
-2.3% |
Trucks |
28.8 |
27.4 |
-5.1% |
Note: Trucks include vehicles with at least six wheels except buses, plus some four-wheeled vehicles such as plumbers’ vans.
Source: Boston Region MPO.
Table 3-5 details the results of the air quality analysis while considering the demographic projections with no additional transportation improvements other than those that are currently in place, under construction, advertised, or in the first year of the 2019–23 TIP. Even though there is an increase in vehicle-miles traveled, improvements are projected in all pollutants in 2040. Due to increased use of electric vehicles and more stringent emission standards for gasoline and diesel vehicles, the average car will be cleaner in the future.
Table 3-5
Boston Region MPO Current and Projected Air Quality Statistics
Variable |
2016 Base Year |
2040 No-Build |
2016 to 2040 Percent Change |
Volatile Organic Compounds (kg) |
5,777 |
2,012 |
-65.2% |
Nitrogen Oxides (kg) |
28,805 |
5,087 |
-82.3% |
Carbon Monoxide (kg) |
220,344 |
84,675 |
-61.6% |
Carbon Dioxide (kg) |
38,666,496 |
25,271,965 |
-34.6% |
Source: Boston Region MPO.
Recent and projected transit ridership is summarized in Table 3-6 for the Boston Region MPO area. The number of transit person-trips is projected to increase about 15 percent by 2040, and the unlinked trips, or transit vehicle boardings, are projected to increase 18 percent as transit trips gradually become more complex and require more transfers.
Table 3-6
Current and Projected Weekday Transit Ridership Statistics
Transit Service |
2016 Base Year |
2040 No-Build |
2016 to 2040 Percent Change |
Transit Trips (linked) |
1,172,200 |
1,346,400 |
14.9% |
Transit Trips (unlinked) |
1,473,500 |
1,739,200 |
18.0% |
Local Bus |
398,700 |
422,300 |
5.9% |
Bus Rapid Transit |
32,300 |
61,900 |
91.6% |
Express Bus |
12,700 |
14,200 |
11.8% |
Non-MBTA Bus Routes |
147,900 |
198,600 |
34.3% |
Rail Rapid Transit |
751,000 |
888,400 |
18.3% |
Commuter Rail |
126,000 |
145,200 |
15.2% |
Ferry |
4,900 |
8,600 |
75.5% |
Average Transfer Rate |
1.26 |
1.29 |
|
Source: Boston Region MPO.
Rail rapid transit is expected to see about 18 percent more boardings while commuter rail ridership is projected to increase about 15 percent. Local buses have the lowest projected growth, possibly reflecting the impact of increased congestion. In contrast, bus rapid transit has the highest projected growth as it serves the growing Seaport District. The Seaport District was recently expanded to add the new SL3 route (added after 2016) and has key sections in dedicated rights-of-way. Non-MBTA services include buses operated by regional transit authorities, Logan Express and airport shuttle services, private regional bus services, and selected employee shuttles that allow use by the general public.
Travel and traffic are seemingly everywhere in the region, moving in all directions simultaneously. The traditional notion of radial commuting into city centers during typical rush hour periods is always an over-simplification. It is even more so today with the spread of jobs throughout the region, the increased interest in urban living, and the flexible work schedules of knowledge-based industries.
It is possible, however, to identify and estimate the size of important regional travel flows. The MPO’s model is informed by broad-based travel surveys and can generate plausible estimates of current travel activity at a fine level of detail. By applying demographic growth assumptions, it enables the model to estimate future travel activity at a comparable level of detail.
Some of the strongest travel patterns are observed in the travel network with the greatest concentration of travel activity which include the major employment centers of the urban core, specifically, the Boston Business District (BBD) and nearby parts of the Central Area, such as Kendall Square and the Longwood Medical area. This section begins with an analysis of travel in the BBD, followed by a discussion of the significantly larger Central Area. It concludes with descriptions of travel in the outer parts of the region, as well as the specialized movement patterns characteristic of freight and trucks.
The analysis of regional travel begins by dividing the entire travel market into four geographical realms.
The analyses of BBD and Central Area travel will use these four geographical realms to show how travel patterns can be discerned based on the distance from the dense urban core.
Travel is a major function dependent on the numbers of residents, workers, and available private vehicles. In addition, the locations and types of jobs are important factors in establishing travel patterns. The BBD is a very densely developed mixed-use area and is a major destination for the Boston region. Figure 3-3 shows the numbers of trips ending in the BBD in 2016 and 2040 by three major mode groups: auto, transit, and nonmotorized. In the figure, auto refers to private passenger vehicles owned by households traveling with one or more occupants. Transit refers to services operated by the MBTA plus selected private fixed-route shuttles that allow use by the general public. Nonmotorized travel includes walking and bicycling.
The 2016 and 2040 trip estimates in Figure 3-3 are shown as pairs of columns. Each pair of columns shows current and projected trips between the BBD and one of the four geographical realms. The first pair of columns are trips that both begin and end within the BBD, and the last three column pairs show trips of increasing distance to the BBD—from the Central Area, from the rest of the MPO region, and from outside of the MPO region. The vertical scales are the same for each of the modes.
Within the BBD, the nonmotorized modes are dominant. The density and mixture of land uses in the BBD reflects a rich variety of housing, jobs, stores, schools, and recreation opportunities in very close proximity. Projections show 117,000 more nonmotorized trips in 2040 (a 38 percent increase) compared with 18,400 more transit trips (29 percent) and 14,800 more auto trips (49 percent).
It is expected that TNCs will accommodate much of the increase in auto trips within the BBD. It should not be assumed, however, that TNCs will accommodate all of the growth. Given the congestion, parking scarcity and cost, and relatively short distances, many people do not drive between two points within the BBD unless the trip is part of a more extensive itinerary. The driver may need to make a midday trip or go someplace after work. In some cases, a person could get a ride from a friend or family member within the BBD, and after dropping the passenger off, the driver leaves the BBD for a more distant destination.
The projected percent increase in auto trips (49 percent) is significant and may mean that much of the new development will be in the less accessible parts of the South Boston waterfront, where use of an auto, especially as part of a trip chain, may be an attractive mode choice. Growth in TNC use will also contribute to this increase.
Figure 3-3
Travel Mode Projections for the Boston Business District
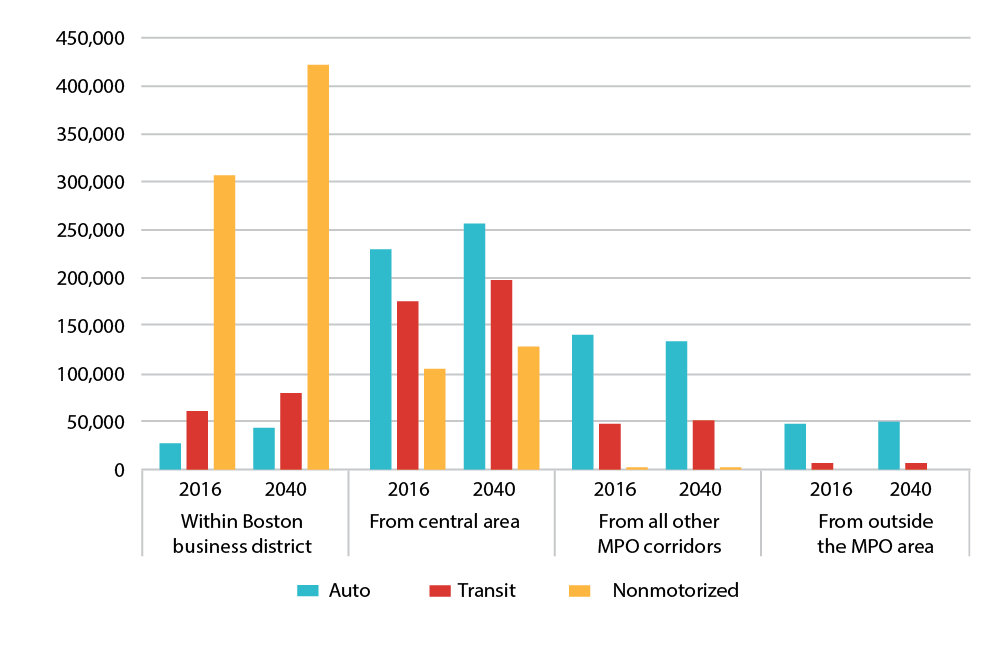
Source: Boston Region MPO.
The second set of column pairs in Figure 3-3 detail travel between the Central Area and the BBD. The Central Area is roughly 10 miles across; and for about 45 percent of people making an up to six-mile journey to reach the BBD, a private auto is the primary mode of choice, sometimes in conjunction with a chained trip. Most of the fixed guideway transit routes are within the Central Area and transit accounts for 34 percent of the trips to the BBD. For trips between the Fenway and Back Bay, Lower Roxbury and the South End, South Boston and the South Boston waterfront, and Charlestown and Government Center, the nonmotorized modes are very practical and are used for 21 percent of trips between the Central Area and the BBD.
For trips between the Central Area and the BBD, each of the mode groups is projected to increase between 22,000 and 27,000 users in 2040. Because the nonmotorized modes have the fewest users today, they show the largest increase—about 20 percent. This is understandable because much of the current development activity is mixed use near the boundary of the BBD (such as near North Station and in the South Boston waterfront) and attracts trips from the neighboring parts of the Central Area.
The next column pair is travel to the BBD from the rest of the MPO region. The use of nonmotorized modes is almost non-existent for these trips. Walking from Watertown or Quincy to the BBD is not practical, but some people do ride bicycles from the inner suburbs outside of the Central Area to the BBD. Transit service for this market would include the Riverside Branch of the Green Line, the Braintree Branch of the Red Line, and most of the commuter rail system. Transit is also expected to take some market share from auto by 2040.
The last column pair is for trips to the BBD from outside the MPO. Auto is the dominant mode, with a small amount of travelers using one of the 35 commuter rail stations outside the MPO area, or one of the regional bus services.
Figure 3-4 shows the numbers of trips ending in the Central Area in 2016 and 2040 by the three major mode groups. This figure is organized in the same manner as Figure 3-3 except that the scale extends to 3,000,000 instead of 450,000 to accommodate the larger number of trips. While the BBD is much denser than the Central Area, the Central Area is geographically far more extensive and includes major employment centers—notably Kendall Square, the Longwood Medical Area, and Logan Airport.
Figure 3-4
Travel Mode Projections for the Central Area
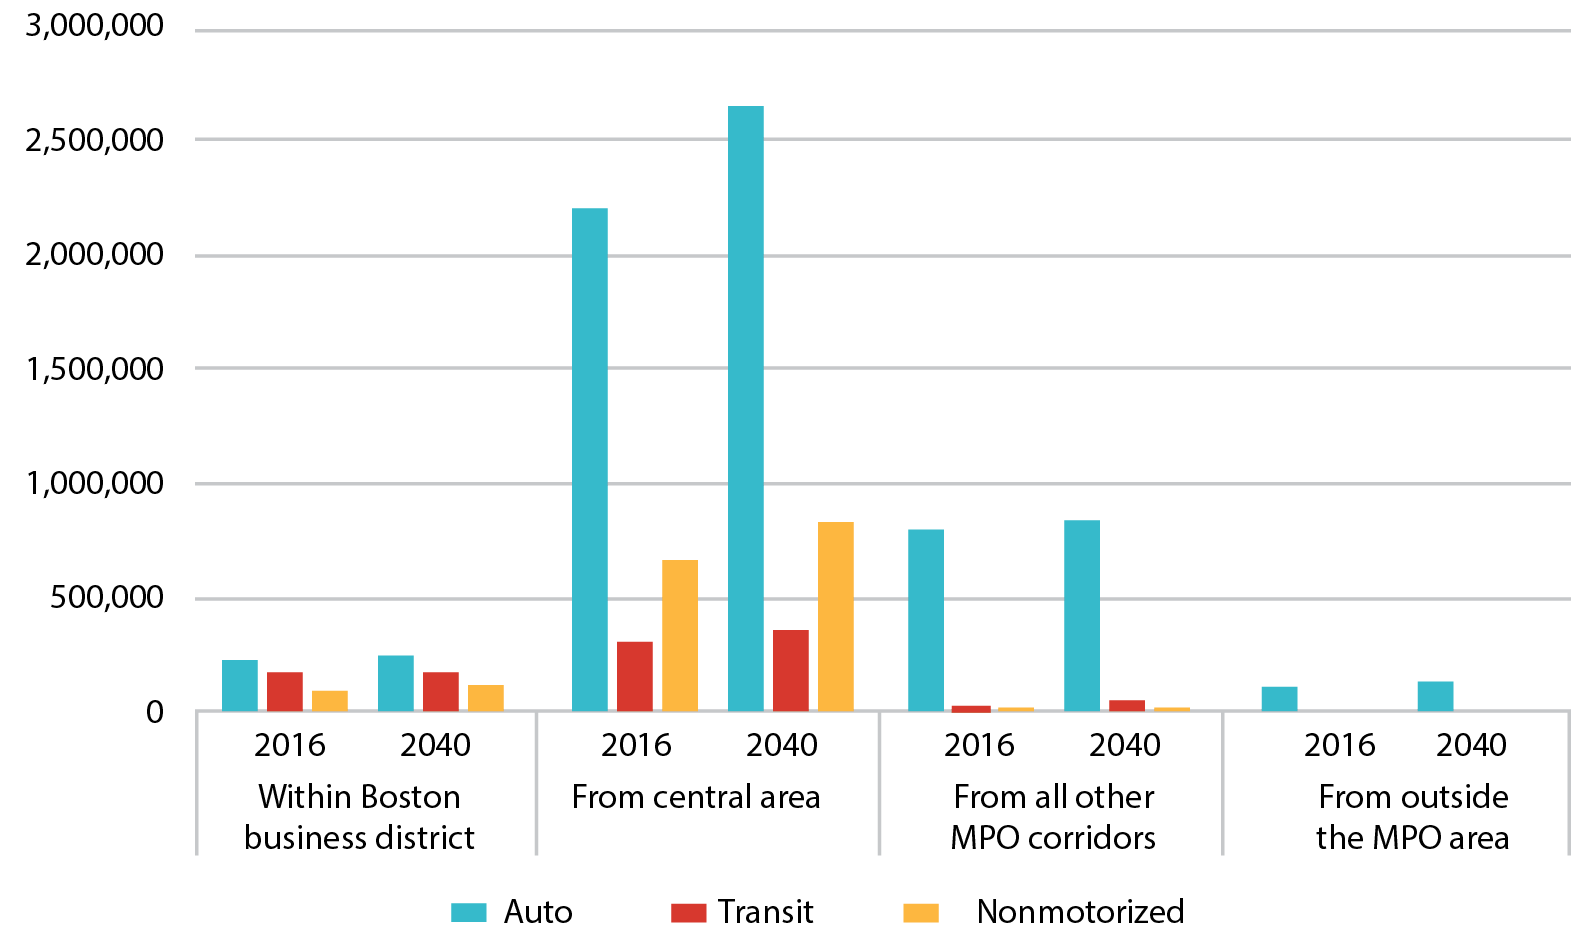
Source: Boston Region MPO.
The values are the same for the trips from the Central Area to the BBD, shown in the second set of column pairs of Figure 3-3, and the trips to the Central Area from the BBD, shown in the first set of column pairs of Figure 3-4. The differences in the column heights between the two figures are solely attributable to the differences in the figure scales. This difference illustrates that the flow of trips between the BBD and the Central Area, which is so important to the BBD (Figure 3-3), is only a very small part of travel in the Central Area, as illustrated in Figure 3-4.
As Figure 3-4 shows, the most important Central Area travel market is trips that both begin and end within the Central Area. Auto is used for about 69 percent of these trips, while transit is used for only 10 percent. The nonmotorized modes account for 21 percent of trips, reflecting the relative density and the abundant nearby destinations of the diverse Central Area neighborhoods.
Transit use is actually much more important in the Central Area than Figure 3-4 implies. The travel estimates in Figures 3-3 and 3-4 are for all trips over the entire day, which includes trip purposes and time periods where autos may offer advantages. However, many of the transit trips are made by commuters and students traveling during the peak periods. Peak-period traffic congestion and the need to pay for parking for an entire work shift makes transit an attractive alternative to driving for commuters. Transit use by commuters frees up roadway and parking capacity use by vehicles for which transit might not be a practical option.
The third column pair in Figure 3-4 shows trips between the Central Area and areas of the MPO region outside the Central Area and BBD. Most of these trips are by auto. This number exceeds the amount of trips to the BBD by all modes.
The last column pair in Figure 3-4 shows that the smallest Central Area travel market is trips outside the Boston MPO area, and these are almost exclusively by auto.
The attractiveness of the nonmotorized modes depends largely upon the proximity of useful destinations. Walking and bicycling can be used within the outer areas of the MPO region, but to reach Boston’s urban core from the outer areas, auto or transit is usually required. Reverse commuting from a Central Area or BBD residence to a suburban workplace is growing, however, unless the workplace happens to be convenient to a transit service, auto will continue to be the commuting mode of choice. Figures 3-5 and 3-6 summarize the mode shares for travel to the two parts of Boston’s urban core.
Figure 3-5
Mode Share Comparisons to the Boston Business District
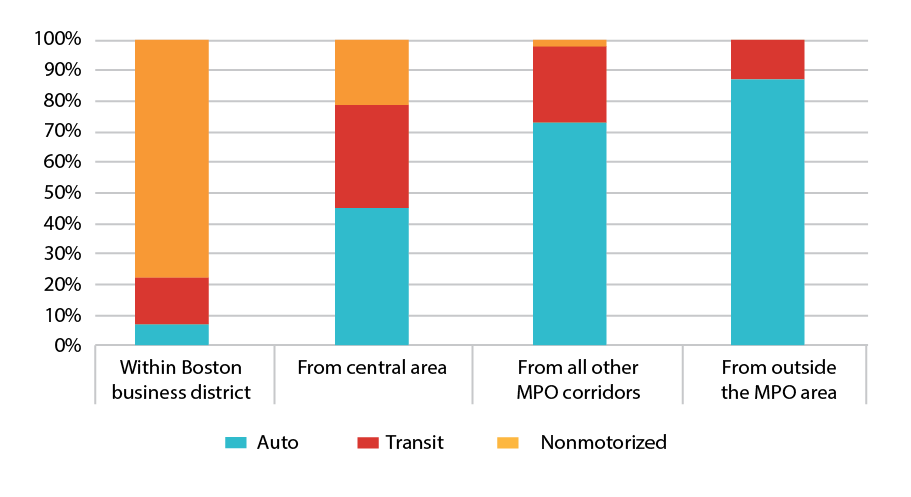
Source: Boston Region MPO.
Figure 3-6
Mode Share Comparisons to the Central Area
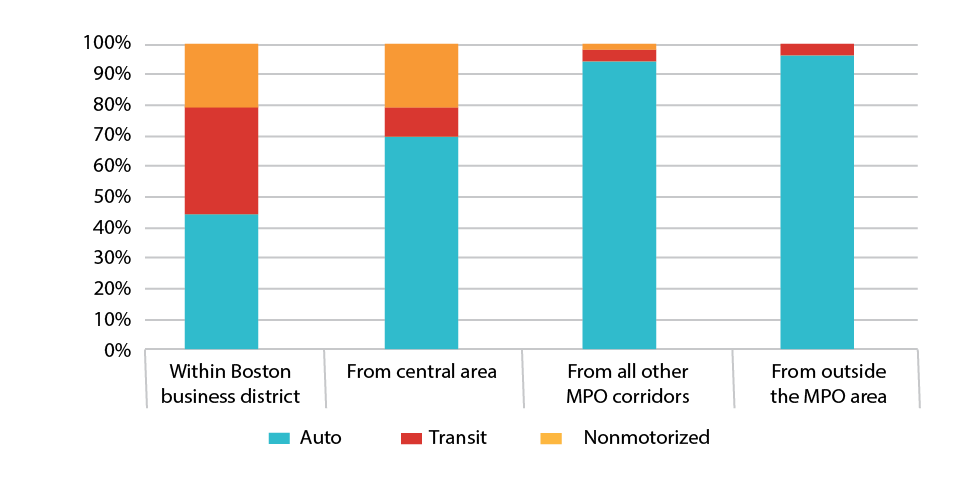
Source: Boston Region MPO.
Travel patterns for trips that both begin and end outside of the urban core are much less clearly defined. Workers with a primary workplace outside their residence travel on average 10 miles to work. Unlike commuting to the urban core, with its high-capacity radial transportation route systems, traveling from a suburban residence to a suburban workplace might be in any direction. There are about three times as many non-work as work trips, but these trips are often shorter than work trips. In addition to frequent and necessary shopping trips, non-work trips include trips for medical appointments, taking children to school or other activities, or going to social or recreational activities.
However, it is possible to discern some interesting suburban travel patterns, and the MPO’s statewide model is the key tool for quantifying these flows. The model region has been divided into subareas referred to as districts, which (outside the urban core) consist of groups of municipalities. The projected trip flows between districts presented in this section have been derived from the calibrated model.
The results indicate that the districts with the largest trip flows to other districts outside the urban core were areas containing the important non-core area cities, Beverly, Salem, and Framingham. These areas and their strongest trip flow partners are shown in Figure 3-7, and also includes the MAPC community types. The community type depiction shows the Inner Core which includes the Central Area plus several adjacent municipalities. Outside of the inner core, the municipalities are characterized as Regional Urban Centers, Maturing Suburbs, or Developing Suburbs.
A major finding of this analysis is that the Regional Urban Centers function as suburban mini-downtowns, generating a significant amount of travel with adjacent areas. Table 3-7 summarizes some of the region’s largest suburb-to-suburb trips flows. Travel to the Beverly/Salem area from the adjacent Peabody area (75,600 person-trips by auto) and to the Framingham area from the Natick area (78,900 auto trips) had the greatest numbers of trips between them in the suburban districts.
Trip flows from the Lynn, Gloucester, and Marlborough areas are also shown in Table 3-7 to provide a clearer picture of the importance of the Beverly/Salem and Framingham areas as regional trip generators. Other regional urban centers, notably Woburn and Quincy, also attract large numbers of trips from nearby suburbs. However, the proximity of Beverly/Salem and Framingham to other regional urban centers results in a larger number of trip flows to these areas.
Also presented in Table 3-7 are the intra-area trips for the Beverly/Salem and Framingham areas. These intra-area trips far exceed the trips to neighboring areas—a disparity that is even more pronounced for the non-auto modes. The comparative size of intra-area trips is largely attributable to the design of the districts used for model calibration. By grouping together several municipalities, many residents simply find that many of their daily destinations are located within these multi-municipality areas.
Figure 3-7
Metropolitan Area Planning Council Community Types
with Notable 2040 Suburban Trip Flows
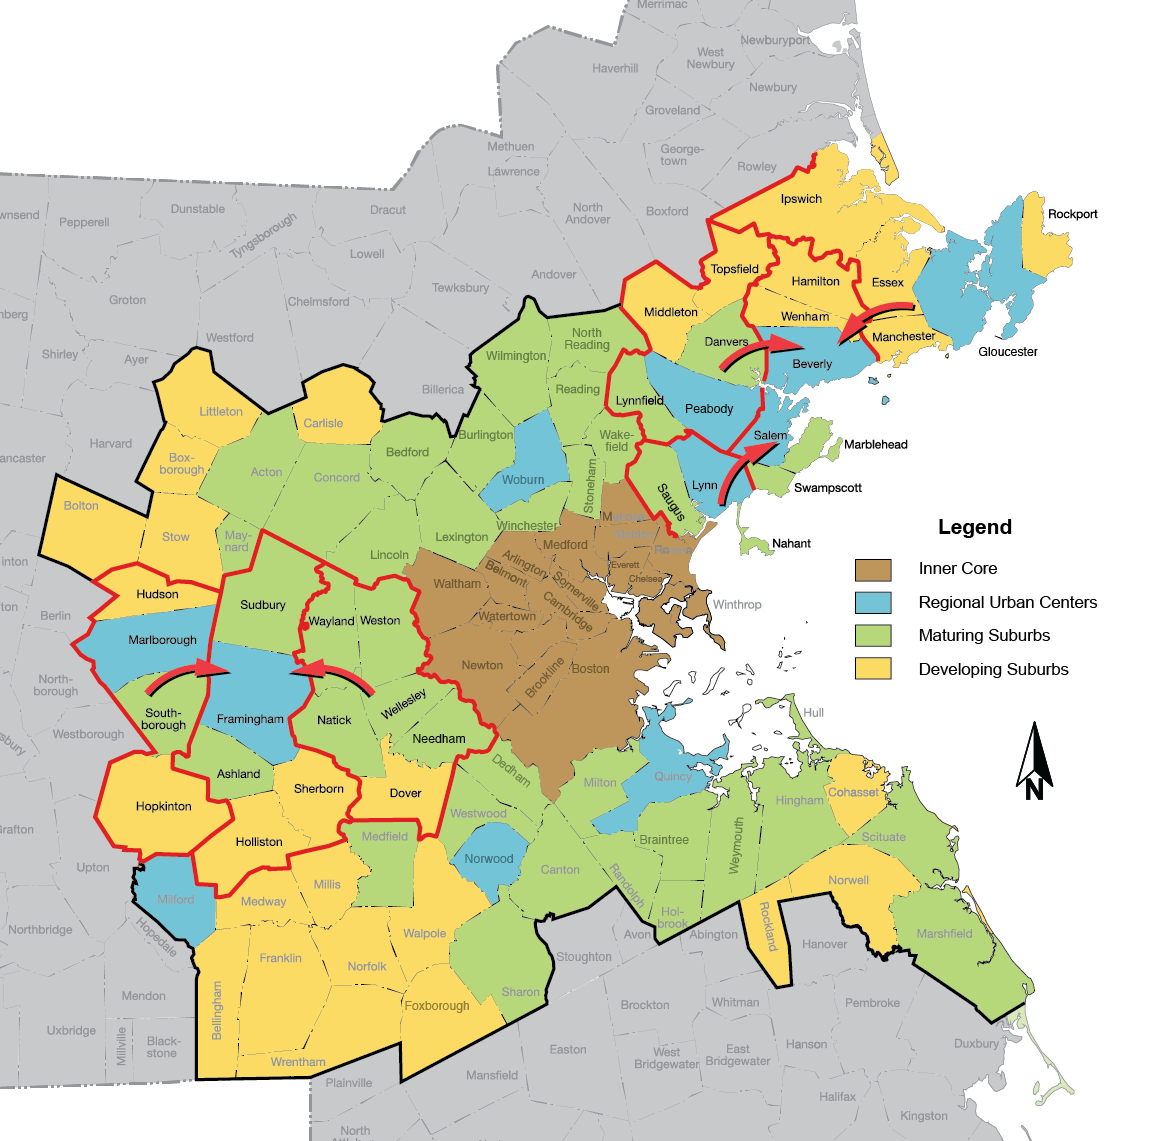
Sources: Boston Region MPO and Metropolitan Area Planning Council.
Table 3-7
Notable Suburban Trip Flows
Suburban Area-Pairs |
Auto |
Transit |
Bicycle |
Walk |
Trips to Beverly/Salem Area from: |
|
|
|
|
Peabody area |
75,600 |
300 |
700 |
800 |
Lynn area |
51,200 |
1,100 |
800 |
1,300 |
Gloucester area |
31,600 |
200 |
100 |
NM |
Neighboring areas total |
158,400 |
1,600 |
1,600 |
2,100 |
Beverly/Salem area (intra-area) |
283,700 |
9,700 |
5,000 |
47,100 |
Trips to Framingham Area from: |
|
|
|
|
Natick area |
78,900 |
1,000 |
800 |
1,700 |
Marlborough area |
56,500 |
200 |
NM |
100 |
Neighboring areas total |
135,400 |
1,200 |
800 |
1,800 |
Framingham area (intra-area) |
250,300 |
6,500 |
3,600 |
20,600 |
NM = Not meaningful
Source: Boston Region MPO.
Table 3-8 shows the mode shares of the Table 3-7 trip flows. Auto is the most dominant mode for travel from one suburban area to another, even for the adjacent area-pairs described above. For trips entirely within a suburban area, the walk mode is used for a significant number of trips—14 percent in the Beverly/Salem area and seven percent in the Framingham area. Even in the less-dense suburban communities, there will always be a large number of origins and destinations in close enough proximity to each other that use of a nonmotorized mode is feasible.
The suburban trip flows shown in Table 3-7 are expected to increase about nine percent by 2040, with the intra-area trips increasing slightly more than trips from the neighboring areas. The mode shares are expected to change only slightly. The auto share between Beverly/Salem and the neighboring areas is projected to decrease from 97 to 96 percent and within Beverly/Salem from 82 to 81 percent. Within the Framingham area, the auto share is expected to drop from 89 to 88 percent, but will stay at 97 percent for trips to neighboring areas.
Table 3-8
Selected Suburban Mode Shares
Suburban Area-Pairs |
Auto |
Transit |
Bicycle |
Walk |
Mode shares between Beverly/Salem Area and: |
|
|
|
|
Peabody area |
98% |
0% |
1% |
1% |
Lynn area |
94% |
2% |
1% |
2% |
Gloucester area |
99% |
1% |
0% |
0% |
Neighboring areas combined |
97% |
1% |
1% |
1% |
Beverly/Salem area (intra-area) |
82% |
3% |
1% |
14% |
Mode shares between Framingham Area and: |
|
|
|
|
Natick area |
96% |
1% |
1% |
2% |
Marlborough area |
99% |
0% |
0% |
0% |
Neighboring areas combined |
97% |
1% |
1% |
1% |
Framingham area (intra-area) |
89% |
2% |
1% |
7% |
Source: Boston Region MPO.
The travel patterns described in previous sections have been those of individuals conducting their personal lives around their primary residence, often a primary workplace, and other travel destinations of their choosing. However, a significant fraction of traffic consists of vehicles traveling for a commercial reason. These components of traffic are sometimes referred to generically as trucks or freight. This section divides these vehicles into four subgroups and suggests some broad travel patterns to help to understand this diverse traffic mix. The four subgroups are:
Long-distance freight almost exclusively uses the tractor and semi-trailer combination. This is true whether or not the cargo was hauled from a distant origin or was transferred off a rail car or ship at one of the major intermodal terminals in or near the Boston Region MPO area. (Most air cargo is consolidated into trailers and hauled out of the airport to distribution centers.) Trailers and containers have the advantage of being suitable for intermodal movements. For long-distance highway-only shipments, using the largest allowable equipment reduces the unit cost of transportation.
The destination of these long-distance shipments is usually a large customer, warehouse, or distribution center. These facilities tend to be located near major highways and at locations farther from the urban center where large industrial parcels are available. Long-distance shipments can reach the MPO area at any time of day or night and it may be necessary for drivers to find a place to park while waiting for the terminal to open or for a pre-arranged customer delivery time.
The trucks that the public are most likely to notice in an urban area are making deliveries, and to a lesser extent, picking up packages or freight. These trucks range in size from the maximum allowed 53-foot semi-trailer to four-wheeled delivery vans.
Smaller, single-unit delivery vehicles come in several configurations. A common type has six wheels, with the wheels on the rear axle doubled. This six-wheel configuration meets the common definition of a truck, and these vehicles are not permitted to use roads that do not allow for trucks. Some trucks have a second rear axle with doubled wheels, making 10 wheels altogether. These trucks are useful for heavy loads such as beverages or home heating oil.
The four-wheel delivery van is becoming a more common sight in residential neighborhoods with the increasing popularity of online shopping. The automakers have responded by developing new generations of larger, four-wheeled delivery vehicles.
The distribution centers of several supermarket chains are located outside the Boston Region MPO area, and every supermarket in the area is visited by several semi-trailers daily. Semi-trailers also deliver to restaurants and convenience stores, delivering only a part of the load at each stop. Commercial deliveries tend to begin early in the day, continue through the midday, and tail off as the evening peak-period builds. Consequently, most trucks tend to travel more during the midday.
Many vehicles with six or more wheels are not carrying freight. This is especially true in urban areas where vehicles such as garbage trucks, cement trucks, dump trucks, and bucket trucks (for servicing above-ground utilities) are common sights. Many of these have the 10-wheel configuration characteristic of especially heavy loads.
These vehicles are often dispatched from motor pools closer to the urban core than the large distribution centers. The motor pool only needs to be large enough to store the vehicles and does not need to be near a large warehouse-type facility. However, similar to the practices of commercial distribution, these vehicles tend to begin their routes early and finish up before the evening peak.
Four-wheeled vans and pickup trucks are mainstays of utility motor pools and the distribution fleets mentioned above, often emblazoned with the corporate logo. They are also popular with self-employed people in trades such as contractors, plumbers, and electricians. Many of these tradespeople stencil their company name on the vehicle, but the vehicle is garaged at home and at the end of the work day, is often used as a family car. Conversely, some pickup trucks observed in traffic are going to the day’s building site, but there is no indication of its business purpose directly on the vehicle.
Taken altogether, light commercial vehicles are usually more numerous than the heavier trucks with six or more wheels. These vehicles also tend to get started early and avoid the evening peak, if possible.
For road and traffic planning purposes, MPO staff considers vehicles involved in logistic and commercial activities in five broad groups generally based on the types of roadways they are allowed to use. Trips by these groups are summarized in Table 3-9, along with applicable road restrictions. Altogether these vehicles make up almost 20 percent of regional traffic.
Table 3-9
Estimated Weekday Truck Trips in the Boston Region MPO Area
Truck Groups |
Road Use Prohibitions |
Trips |
Vans and pickup trucks |
None |
1,510,000 |
Single-unit trucks with six or more wheels |
DCR Parkways and local restrictions |
373,000 |
Semi-trailers |
DCR Parkways and local restrictions |
119,000 |
Single-unit trucks with hazardous cargo |
Parkways, local restrictions, and tunnels |
11,000 |
Semi-trailers with hazardous cargo |
Parkways, local restrictions, and tunnels |
4,000 |
DCR = Department of Conservation and Recreation
The information presented in this chapter helped to inform MPO staff of the various travel patterns in the region. Information on each of the modes—auto, transit, freight, bicycle, and pedestrian travel modes—was considered when staff identified the transportation needs by goal area (Chapters 4–9) and recommendations presented in Chapter 10 of this Needs Assessment. Travel patterns were important to consider when identifying transportation needs in each of the MPO goal areas but particularly important in the capacity management and mobility, transportation equity, and economic vitality goal areas. This information was used to identify issues throughout the region, such as congestion on roadways, access to and the reliability of the transit system, and access to households and employment by transportation equity populations.1
1 MPO staff uses 2010 United States Census and 2010–14 American Community Survey (ACS) data to identify Transportation Equity (TE) populations as follows:
< Chapter 2 - Land Use and the Transportation System | Chapter 4 - Safety Needs >