Chapter 3: Curb Management Foundations
Chapter 5: Strategies for Implementing Curb Management Plans
Blake Acton
Paul Christner
Emily Domanico
Meghan O’Connor
Kim DeLauri
Kim DeLauri
The preparation of this document was supported by the Boston Region MPO through MPO Planning and §5303 Contract #112310.
Central Transportation Planning Staff is directed by the Boston Region Metropolitan Planning Organization (MPO). The MPO is composed of state and regional agencies and authorities, and local governments.
October 2021
For general inquiries, contact
Central Transportation Planning Staff
State Transportation Building
Ten Park Plaza, Suite 2150
Boston, Massachusetts 02116
857.702.3700
The Boston Region Metropolitan Planning Organization (MPO) operates its programs, services, and activities in compliance with federal nondiscrimination laws including Title VI of the Civil Rights Act of 1964 (Title VI), the Civil Rights Restoration Act of 1987, and related statutes and regulations. Title VI prohibits discrimination in federally assisted programs and requires that no person in the United States of America shall, on the grounds of race, color, or national origin (including limited English proficiency), be excluded from participation in, denied the benefits of, or be otherwise subjected to discrimination under any program or activity that receives federal assistance. Related federal nondiscrimination laws administered by the Federal Highway Administration, Federal Transit Administration, or both, prohibit discrimination on the basis of age, sex, and disability. The Boston Region MPO considers these protected populations in its Title VI Programs, consistent with federal interpretation and administration. In addition, the Boston Region MPO provides meaningful access to its programs, services, and activities to individuals with limited English proficiency, in compliance with U.S. Department of Transportation policy and guidance on federal Executive Order 13166.
The Boston Region MPO also complies with the Massachusetts Public Accommodation Law, M.G.L. c 272 sections 92a, 98, 98a, which prohibits making any distinction, discrimination, or restriction in admission to, or treatment in a place of public accommodation based on race, color, religious creed, national origin, sex, sexual orientation, disability, or ancestry. Likewise, the Boston Region MPO complies with the Governor's Executive Order 526, section 4, which requires that all programs, activities, and services provided, performed, licensed, chartered, funded, regulated, or contracted for by the state shall be conducted without unlawful discrimination based on race, color, age, gender, ethnicity, sexual orientation, gender identity or expression, religion, creed, ancestry, national origin, disability, veteran's status (including Vietnam-era veterans), or background.
A complaint form and additional information can be obtained by contacting the MPO or at http://www.bostonmpo.org/mpo_non_discrimination.
To request this information in a different language or in an accessible format, please contact
Title VI Specialist
Boston Region MPO
10 Park Plaza, Suite 2150
Boston, MA 02116
civilrights@ctps.org
By Telephone:
857.702.3702 (voice)
For people with hearing or speaking difficulties, connect through the state MassRelay service:
Relay Using TTY or Hearing Carry-over: 800.439.2370
Relay Using Voice Carry-over: 866.887.6619
Relay Using Text to Speech: 866.645.9870
For more information, including numbers for Spanish speakers, visit https://www.mass.gov/massrelay
While curbs are a common feature in modern cities that may appear unremarkable, the curb inhabits a critical space. The space immediately adjacent to curbs known as “curb space” defines the edge between travelers and their destinations and provides direct and visible access to and from origins and destinations. Put simply, the Institute of Transportation Engineers (ITE) describes curb space “where movement meets access” (Mitman et al. 2018). Given its usefulness and the inability to increase supply on existing roadways, curb space becomes an increasingly valuable and contested resource as urban areas become denser. Examples of curb space uses include a vehicle travel lane, parking, pick-up/drop-off (PUDO) zones for people and goods, freight delivery, outdoor dining, bicycle lanes, and bus lanes. To complicate matters, demand for these uses vary by neighborhood, block, and street and through time by season, day, and hour.
The primary goal of curb management is to reframe curb space away from the tradition that parking is the default and everything else is an alternative. Rather, curb management treats curb space as a blank slate and seeks to find which curb use most effectively serves the needs of the community. Every curb policy represents a decision to prioritize the needs and desires of certain stakeholders, residents, and businesses. No curb policy can accommodate everyone or every desired use all the time, but planners can seek policies that maximize safety and balance accessibility for all people. While managing curb space may seem daunting, it is an often overlooked and effective way to pursue safety, equity, sustainability, and the economic goals of the city or town. Changing curb space rarely requires large capital costs and, in many cases, can be achieved with simple items including paint, bollards, and signs. Given the importance of curb space, planners can pursue impactful policies at a relatively low cost. The focus of this guidebook is to inform planners with curb management best practices, strategies, and examples to enable them to craft and implement curb space policies that balance these priorities.
The findings and recommendations in this guidebook are based on a literature review and interviews of Boston area municipal planners. MPO staff conducted 17 semi-structured interviews with 27 local professionals. Most interviewees were municipal planning, transportation, economic development, and public works officials representing 14 municipalities across the region (Table 1). Also included in the interviews were representatives from transportation network companies (TNC), chambers of commerce, and nonprofits.
This guidebook highlights best practices on issues important to curb management in the Boston region. It establishes a foundation for curb management by providing planners with examples, ideas, and recommendations to begin and improve their curb management practices.
The objectives of this guidebook are to
Table 1
Interview Participates Listed by Job Title and the City, Town,
or Organization Represented
| City, Town, or Organization |
Job Title or Description |
|---|---|
Arlington |
Transportation Planner, Senior |
Arlington |
Economic Development |
Bedford |
Economic Development, Director |
Bedford |
Transportation Manager |
Boston |
Transportation Planner, Senior |
Boston |
Transportation Planner |
Cambridge |
Transportation Planner, Director |
Cambridge |
Transportation Planner |
Chelsea |
Transportation Planner, Senior |
Everett |
Transportation Planner, Director |
Hull |
Town Manager |
Hull and Rockland |
Elected Official and Town Administrator |
Lexington |
Town Planner, Director |
Lyft |
Regional Operations, Director |
Lyft |
Regional Operations |
Medford |
Sustainability Planner, Director |
Medford |
Transportation Planner, Director |
Norwood |
Chamber of Commerce, President and CEO |
Rockland |
Transportation Manager |
Salem |
Transportation Planner, Director |
Somerville |
Transportation Planner |
Somerville |
Transportation Planner, Director |
Somerville |
Transportation Planner |
Uber |
Operations Manager |
Uber |
Policy |
Uber |
Operations Manager |
United Spinal |
Advocacy Representative |
As cars grew in popularity, so did demand for places to store them and thus, the curb became the default location in urban settings. With demand vastly outstripping supply, cities introduced parking meters for curb spaces and established off-street parking space minimums into zoning codes for new developments. Customers with personal cars preferred businesses with free parking and business owners resisted charging their customers for parking. With few exceptions, curb space in US cities quickly became synonymous with cheap or free curbside parking. Today, most US cities are the product of a self-reinforcing cycle where more cars demand more parking and more parking leads to more driving, which promotes car dependence, and thus more driving. After decades of this cycle, much of the urbanized land in the United States is characterized by car dependent, low-density development with significant off-street parking that discourages walking, cycling or transit. Car ownership is effectively a requirement to access most jobs and services, and people who cannot afford a car or are unable to drive have severely reduced accessibility. Even in relatively dense walkable US cities, cars dominate city streets. In the neighborhood of Center City, Philadelphia and San Francisco, parking and car travel lanes comprise 92 percent and 94 percent of curb space respectively (CCD 2019; SFMTA 2020).
There is currently no comprehensive inventory of curb space around the Boston region; however, based on the curb space inventories in similar cities like Philadelphia and San Francisco, it can be assumed that parking and travel lanes compose most of the region’s curb space. In recent years however, there are signs the dominance of parking over the region’s curb space has changed. In the early 2000s, Boston began constructing a network of protected bicycle infrastructure and intends to have 175 miles of protected bicycle lanes by 2043 (City of Boston 2013). Since the region’s first bus-only lane in 2016, the region has built five miles of bus lanes and intends to complete an additional 14 miles by the end of 2021 (MBTA 2021). The City of Boston is also experimenting with novel curb management strategies and technology, such as pick-up/drop-off (PUDO) areas, dynamic curb pricing, and smart loading zones. The COVID-19 pandemic has accelerated these changes as people sought more socially distant travel and activities. Since June of 2020, the ongoing Massachusetts Department of Transportation (MassDOT) Shared Streets and Spaces grant program has awarded $33 million across 310 low-cost, quick intervention projects to build outdoor dining spaces, parklets, pedestrian infrastructure enhancements, protected bicycle lanes, dedicated bus lanes, and traffic calming measures. These recent changes to curb space demonstrate the region’s enthusiasm for moving beyond the tradition that curbs are static places for storing cars. Rather, curbs can be dynamic spaces in the city that can reflect the local needs of the community and promote more equitable and sustainable ways to travel.
The Boston region is characterized by its numerous dense town centers with many offering a variety of services, retail outlets, restaurants, schools, and community centers. With much of the region built before the car, drivers face higher congestion, narrower lanes, and more competition for limited curbside parking. This unique urban geography is both an argument for curb management and a challenge to its implementation. The region’s intense congestion and competition for curb space can impede changes to the status quo as communities may perceive curb management projects as limiting car accessibility. These concerns commonly manifest as the continuous and pervasive perception that there is never enough parking.
Curb management begins by developing community support, setting neighborhood priorities, and creating an inventory of curb uses. This chapter outlines the important first steps for municipal planners to build the foundations for effective, responsive curb management grounded in the needs and goals of the community. Planners looking to get started with curb management should start here.
Planners should have a clear message for the community about why curb management is important. This is a vital step before proposing or implementing any changes to the curb. Curb management is a new concept to many communities and involves changing the use of valuable public space. Planners can highlight the types of projects that are affected by curb management and describe improvements from curb management processes. Planners should establish clear curb management goals and priorities and should highlight the overall municipal planning goals that curb management supports.
A foundational element to curb management is developing a framework to engage the community and inform them on how they can participate. This can be accomplished through coalitions, ongoing communication, focused committees, and equitable and accessible public engagement.
Cities and towns are complex democratic places with various special interests, institutions, and personalities; therefore, each action of the city requires a diverse alliance of stakeholders to agree and move the action forward. Planners alone have little power to change the curb. This is especially true if planners are introducing curb management to the city for the first time since they likely do not have a coalition that agrees on a set of curb priorities and whether curb changes are necessary. As a result, planners must work to actively cultivate a coalition of residents, businesses, key actors, and public sector colleagues that believe in making change. This can be a slow process that can take years to accomplish.
A helpful method to obtain focused advice and feedback on how issues are handled within the community is to engage members of the community in issue-centered committees and commissions. Curb management could be an issue around which a committee is centered. Such committees can be chartered to produce planning recommendations, set management goals, and discuss, improve, and approve planning materials. Committee membership should be representative of those who will be impacted by projects and policies. Advisory committees should be open to residents but can also benefit from representation by community organizers and representatives of advocacy organizations. Additionally, broad representation of municipal staff strengthens recommendations from and discussions within committees. Municipal staff can include representatives from the public works, police, fire, and municipal planning departments. Other than creating an explicit curb management committee, curb space can also be managed through committees that focus on related issues, including:
The support of elected officials, especially mayors and city and town managers, is vital for ensuring the long-term success of curb management plans. Compared to other infrastructure investments, curb projects are relatively affordable and are highly visible. If a project has enough public and coalition support, curb projects are a great way for elected officials to demonstrate government accomplishments to voters. This fact may increase their interest in and support of curb projects.
The system of governance in a municipality informs the strategy of finding champions. In municipalities with a centralized governance system, it is vital that planners have the support of the mayor or key council members for curb use projects who are open to piloting new ideas. Planners should seek to develop a trusting relationship with the mayor, council members or selectmen so projects can more quickly gather the political capital they need to move forward. One effective strategy to begin building trust is to prioritize less controversial lower-risk projects to demonstrate success and build momentum. During interviews local planners occasionally described these as “low hanging fruit” projects where there are opportunities to improve curb uses without significantly impacting existing uses, such as bicycle lanes on wide corridors or bus lanes only during peak hours. In municipalities with less centralized governance systems planners need to rely more on developing a broader coalition of stakeholders to build support for projects.
Planners can most effectively identify the needs and goals of the community for curb management by establishing and maintaining connections through ongoing public outreach channels and communication tools to connect municipal planners, economic development coordinators, downtown associations, local businesses, and community members and organizations. By developing and maintaining open and ongoing communication channels, municipal planners and other municipal staff can establish a presence within the community where residents can raise issues regarding curb management. Planners can use these communication channels for specific information gathering/project communication while also having a platform to report back on survey results and explain how feedback shaped the decision-making process. Planners should also address the need to include traditionally underserved and underrepresented people in their communities (see Equity and Inclusion).
Opportunities to develop communication channels with the community for curb management can include:
To promote community engagement planners can connect curb management projects and outreach materials to broader community goals, such as promoting sustainability, equity, or safety. This encourages residents interested in these efforts to engage with curb projects. For example, a protected bicycle lane can be part of a municipality’s goal to achieve Vision Zero and improve sustainability by encouraging more travel by bicycle.
It is important to develop a practice of inclusive outreach and engagement to ensure that the diverse needs and desires of the community members affected by any proposed change are included in the decision-making process. Planners should address the need to include traditionally underserved and underrepresented people in their communities. They should explore barriers to participation, such as language and time of day of meetings. Interpreters should be provided for meetings and text should be provided in languages appropriate for the community members. Meetings should occur at times when most community members can attend and at an easily accessible location, as well as Americans with Disabilities Act of 1990 (ADA) accessible.
Planners should consider the following questions to foster an equitable and inclusive process:
All curb spaces in cities have an officially sanctioned use that promotes a particular set of activities and discourages others. For example, free parking at the curb benefits people who drive at the expense of people who use other modes, while a bus lane benefits people who use transit and can diminish the convenience of driving. These uses of curb space influence how people travel and interact with the public realm, so it is crucial these decisions reflect the values and priorities of the communities and neighborhoods that interact with them.
Different communities may also interact with and perceive the same curb uses differently. A bicycle lane may serve as an enhancement to recreational activities for some, while others may view it as an indispensable way to commute to work safely. Similarly, certain curb uses may invite certain people while discouraging or excluding others. For example, a public parklet near a restaurant may be officially available to everyone, but people using wheelchairs are excluded because, although the parklet is fitted with an ADA ramp, the chairs and tables are packed too tightly for a wheelchair to maneuver. Likewise, people may believe the parklet is exclusive to restaurant patrons and might not feel comfortable using them. Determining how different communities may perceive curb uses is a vital first step to designing an inclusive outreach program so differing perspectives are included throughout the planning process. For example, bus priority project proposals should seek feedback from riders through intercept surveys or by posting project meetings and surveys at bus stops.
To develop a practice of equitable and accessible engagement, planners should identify accountability criteria and set goals. Policy and project goals should be articulated in an accessible manner. Terminology should be clearly and consistently defined throughout outreach materials and in planning and policy documents. It is also important to move beyond explaining what something is, but also why it is important and how it impacts people and the use of public space.
Remote meetings have become an important part of outreach during the COVID-19 pandemic. These meetings remove the barrier of physical accessibility and reduce the time commitment needed to engage with the public process. In interviews, planners from multiple municipalities noted that transitioning to remote meetings increased attendance but did not necessarily result in more diverse voices. Planners using digital platforms like Zoom to hold community meetings should leverage the various aspects of the technology to improve engagement. For example, planners can issue polls during meetings to anonymously collect the opinions of everyone in attendance. Hosts may encourage participation from people who are uncomfortable speaking in a public setting by promoting the use of the chat box and quickly responding to comments and questions. Hosts can include non-English speaking communities by enlisting local interpreters to take advantage of simultaneous translation features. Planners should note the level of internet access in their communities and acknowledge that some citizens may only be able to participate by phone due to lack of high-speed internet service. As the pandemic recedes, remote meetings combined with in-person options may offer the greatest access for community members.
A fundamental component of a curb management plan is a priority matrix, which helps a city create and communicate its curb use priorities by neighborhood, street, or district. A simple priority matrix lists land uses or neighborhood types on the horizontal axis and curb management strategies on the vertical axis. Curb strategies are organized by priority with higher priority strategies above lower ones. Figure 1 shows an example of a priority matrix.
The priority matrix is essential to curb management because curb space is an inherently limited resource in the city. Planners have some control over the demand for curb space using pricing and other strategies, but additional curb space cannot be created as the supply is fixed. As a result, curb management plans should illustrate which curb uses have priority and where, and the priority matrix is a useful tool for accomplishing this. For example, the matrix could specify that in low density residential neighborhoods parking is a higher priority while in the high-density commercial areas, parklets are given priority. Examples of curb priority matrices can be found on page 9 of San Francisco’s Curb Management Strategy, page 82 of Seattle’s Comprehensive Plan, and on page 59 of Washington DC’s Curbside Management Study (SFMTA 2020; Nelson\Nygaard 2014; City of Seattle 2020).
The curb priority matrix is a flexible tool that can reflect the unique curb needs and geographies at varying scales. It can specify the priorities by neighborhood type in the entire city or for individual streets within a specific district. When cities and towns in the region begin creating curb management plans, the citywide matrix by neighborhood or land use is a natural place to start. Cities creating their first curb management plans should avoid being too specific as to exactly where and which curb uses take priority. As cities collect more curb data and become more familiar with curb management, plans and matrices can become progressively more specific. Eventually, every neighborhood and street may be classified with priority matrices and maps. However, in the early stages, it is more important to focus on establishing a foundation that can be improved in future iterations.
The priority matrix is composed of three primary elements: curb functions, land use/geography, and priorities.
Figure 1
Sample Curb Priority Matrices
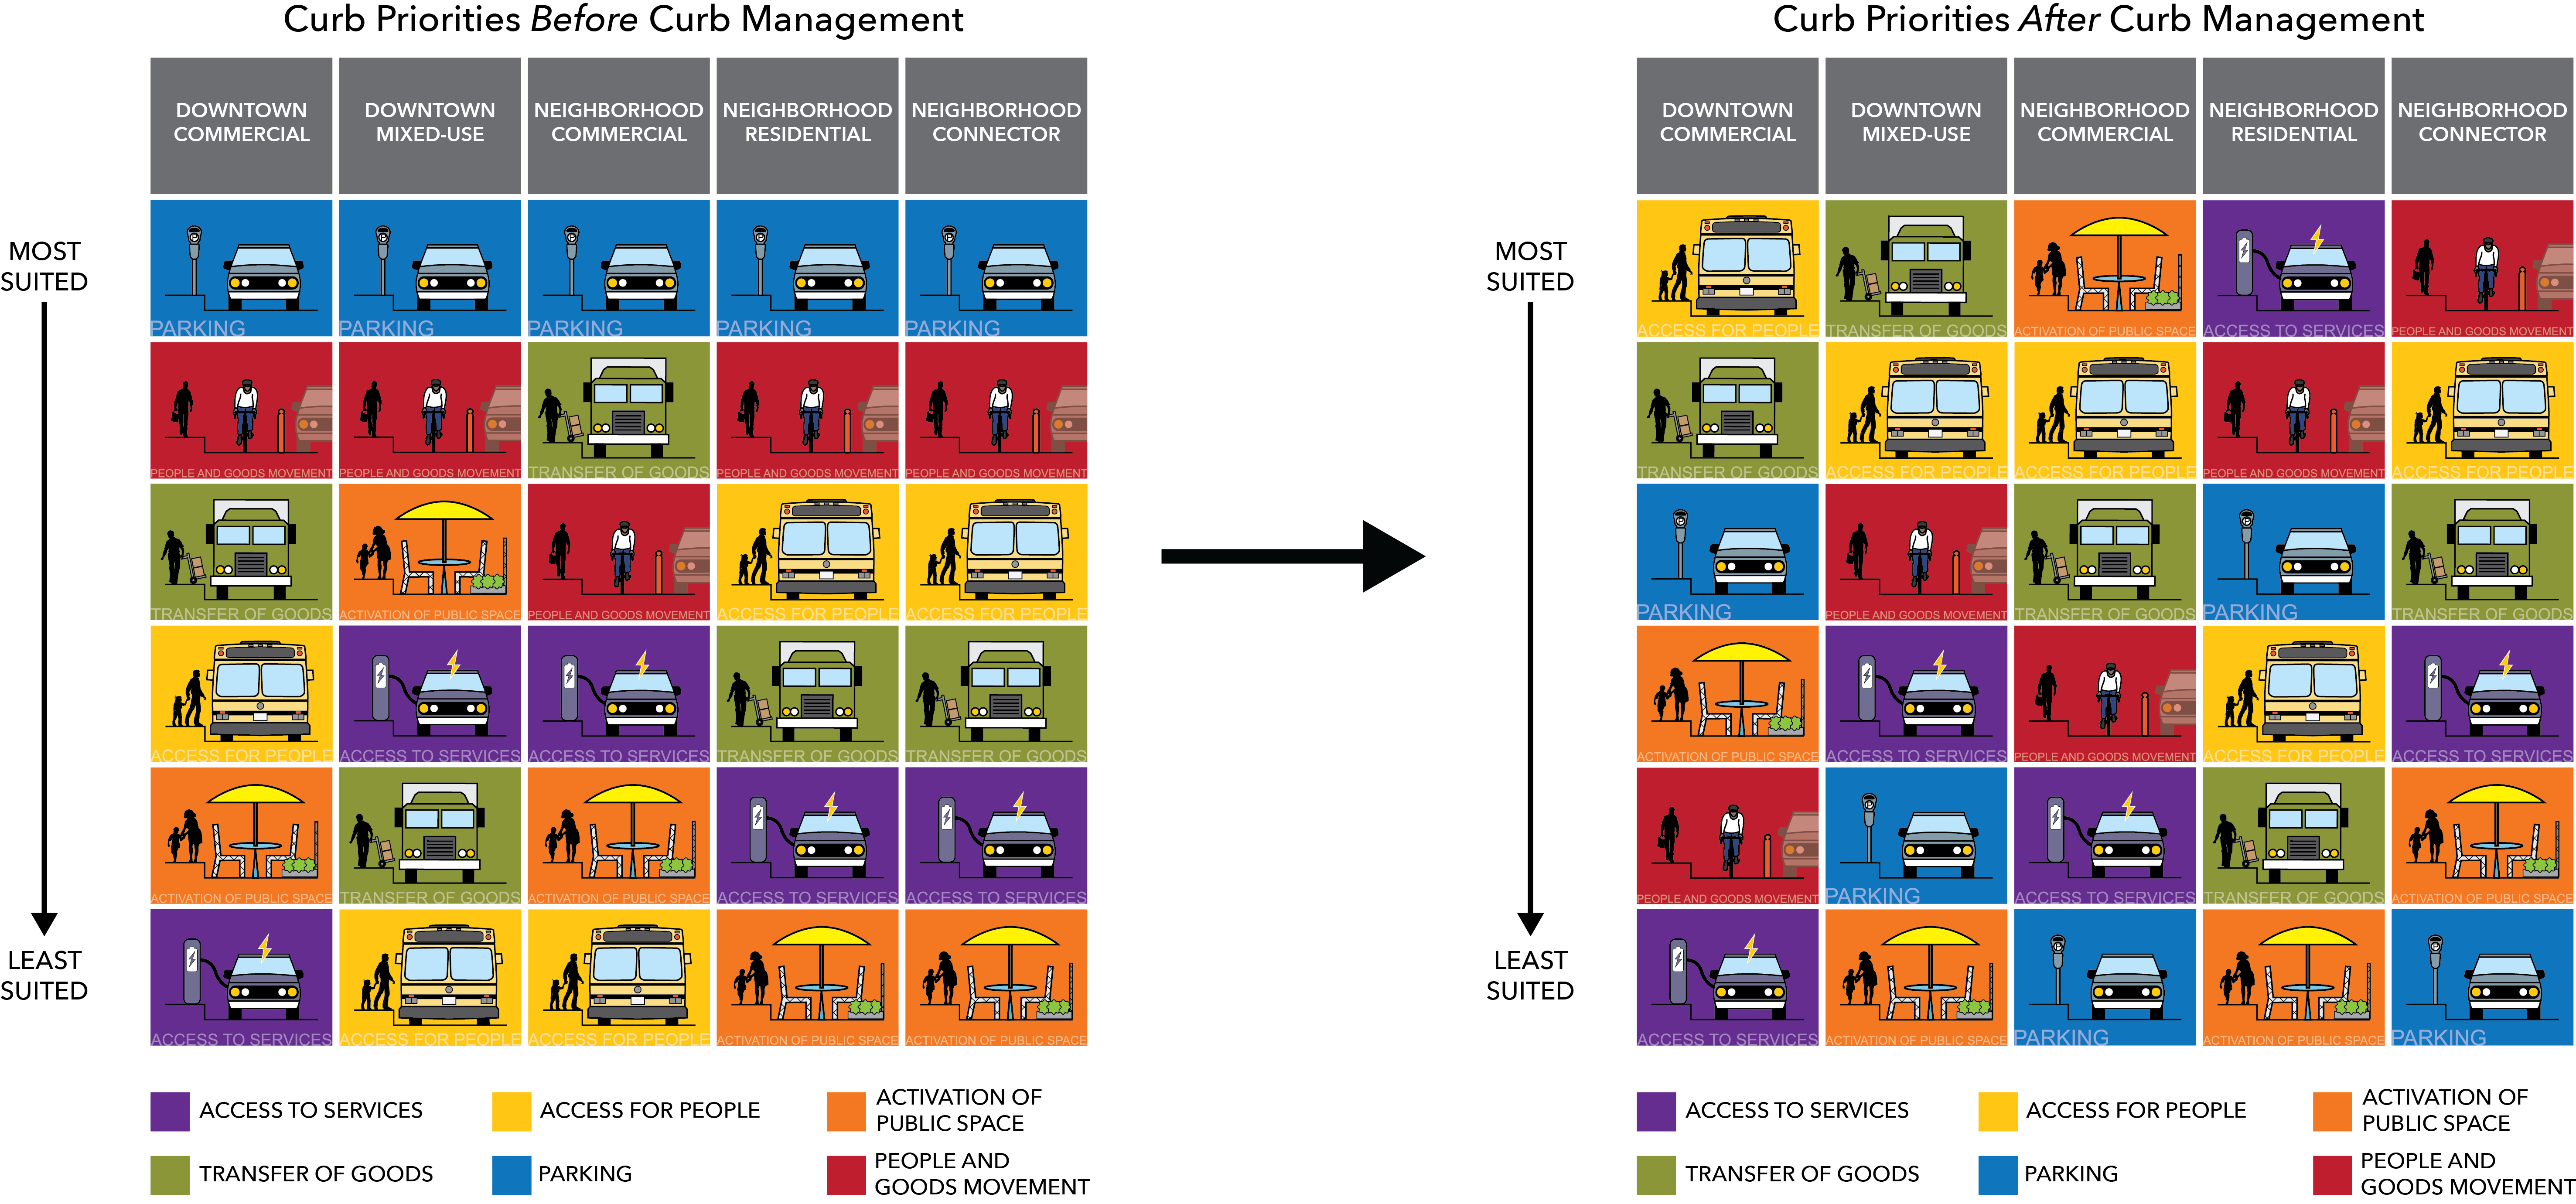
Below is a set of hypothetical curb priority matrices that illustrates the process a municipality might use to evaluate their current curb uses and construct a new priority matrix (Figure 1). The left matrix describes a municipality’s curb priorities before applying curb management goals and policies and the right matrix describes the priorities afterwards. The higher a priority is in a column, the higher the priority is for the specific land use. It is important to note that these matrices are not a recommendation of how municipalities should configure their own priority matrix. Each municipality should select land use categories and curb priorities that match their own unique geography, goals, and needs.
In this example, the land uses and priority changes as presented in Figure 1 are defined as:
Creating and maintaining a digitized inventory of curb space is a key step in informed, dynamic, and responsive curb management. A digitized curb inventory is a digital representation of physical assets and the legal regulations that govern the curb and adjacent curb lane. The inventory consists of both the location of physical elements, such as the location of signs as points, and the physical space and time constraints associated with the infrastructure.
There are many benefits to a digitized inventory including being able to effectively communicate curb use regulations to the public; to store and compare curb use data over time; to serve as a foundation for statistics in research and grant applications; and to provide an opportunity to coordinate curb inventory data with municipal permitting processes. Curb data should be publicly available and understandable in a consistent geospatial format. One example of this is the SharedStreets data model called CurbLR. Additionally, there are ongoing projects from the Open Mobility Foundation to coordinate what and how data management at the curb should look like, including What’s Next in Curb Management and the Mobility Data Specification.
There are two primary methods for generating a curb inventory. The first is an in-house option and the second is to form a public-private partnership with a third-party vendor. Each method has a different set of advantages and challenges. Municipalities should experiment with different data collection options and vendors before deciding which option works best.
Collecting data in-house is a familiar procedure that can rely on existing staff and expertise. This method is typically slower than vendor options, so it works best for smaller areas that do not need to be frequently updated. Unlike a vendor approach, in-house data collection gives municipalities full control over the data collection process and the resulting data. Municipalities looking to collect their own data should consider the CurbLR data standard by SharedStreets to maximize compatibility with other cities and potential vendors. SharedStreets recommends collecting curb data using FieldPapers with a camera or by using the CurbWheel to maximize accuracy (Eros 2019). It is inadvisable to rely on GPS for curb locations. GPS data points are often unreliable in urban areas (as buildings can disrupt signals) and are not accurate enough for curb data even under optimal conditions (Diehl, Ranjbari, and Goodchild 2021). While in-house data collection is not significantly onerous, the process is new so planners should budget more time for training staff and data processing than established data collection operations. Finally, for planners looking to collect curb utilization data in-house, the Urban Freight Lab offers a simple step-by-step guide that does not require any proprietary software (Urban Freight Lab 2020b).
Municipalities can consider public or private partnerships to digitize their curbs. There are numerous vendors and organizations to choose from to inventory, process, share, and monitor their curbs. A few of these companies include CurbFlow, Coord, Conduent, Numina, Streetline, IDAX, and SharedStreets. Each option offers different services and technologies at various stages of development.
As of mid-2021, the most popular curb inventory and management platform in the Boston region is Coord. Coord has partnered with Boston, Cambridge, and Somerville to digitize 33,400 curb spaces across all three cities (Coord 2021). Coord is a comprehensive platform that offers off-the-shelf storage, data collection, visualization, and analysis tools. Coord’s curb inventory application, known as “Collector,” is compatible with any iOS device and uses augmented reality to measure distances and automatic artificial intelligence (or AI) feature interpretation to speed up the data collection process. Coord allows curb data in its platform to interface with navigation, freight, and mobility services with an Application Programming Interface (or API). This allows curb features, such as PUDO and loading zones, to appear in navigation applications.
Many curb management vendors including Coord offer municipalities options to store curb data in cloud-based databases. When forming agreements with cloud-based curb management companies, planners should consider who owns the data, where the data are stored, how easily data can be downloaded, and how accessible the data are to the public. Municipalities should also be skeptical of curb management companies that collect inventory or usage data from sensors or cameras mounted to vehicles. Sensors are often unreliable; for instance, the City of Boston found them to malfunction in snow and have a short battery life in the cold weather (Diehl, Ranjbari, and Goodchild 2021). Vehicle-mounted camera systems are significantly faster than manual data collection but are often obstructed by traffic requiring multiple passes to fill in gaps. It is also worth noting that vendors, such as Coord, are compatible with curb data in CurbLR format. Municipalities hesitant to commit to a vendor can choose to collect data in-house and then find a vendor that is compatible with their data. Cities looking for further guidance can partner with the city-led nonprofit Open Mobility Foundation to explore and support digital tools for curb management and to connect with other cities.
This chapter provides tools, ideas, and strategies for municipal planners to approach curb management projects.
For nearly a century, parking has been the dominant curb use in US cities. Planners have traditionally regulated the curb with curbside parking. With a few exceptions, cities have prioritized providing available, cheap, and convenient parking everywhere. However, free or cheap curbside parking can be expensive for a municipality to provide and regulate, and it can be an inefficient use of valuable curb space.
Free car storage at the curb is:
While using curbs for storing cars is arguably an inefficient use of the valuable curb space, it is both unrealistic and impractical to pursue change everywhere. Instead, curb management plans should identify streets where car storage is most inefficient and prioritize practical solutions that can improve the productivity and value of the curb to the community.
Parking policy is one of the first considerations that must serve as the foundation of every curb management plan. The following strategies are intended to describe practical strategies for planners to manage curbside parking in their cities where parking is appropriate and desirable.
The simple supply-and-demand model is a useful approach for evaluating parking in the city (Shoup 2018). Once a city understands the parking supply by completing a curb inventory, planners can follow up with an evaluation of demand by measuring occupancy during peak and non-peak periods. An evaluation of a specific corridor or neighborhood should also evaluate off-street parking and parking within walking distance (approximately quarter of a mile) in adjacent neighborhoods. In general, residential areas will experience peak parking at night, office areas during the week from 9:00 AM to 5:00 PM, and commercial areas in the evenings and on weekends.
If the results of the parking study conclude:
Implementing curb changes that reduce the number of spaces can be difficult along urban streets with congested parking. If there is adequate road width, planners can consider transitioning parallel parking into reverse-angled parking. The geometry of angled-parking allows for 30 to 40 percent more parking spaces compared to parallel parking using the same curb length (City of Norwalk 2019). Planners could use the additional spaces to create loading zones, PUDO zones, or parklets without reducing the number of spaces. Angled parking allows planners concerned with the loss of spaces to introduce alternative curb uses.
Like traditional angled parking reverse-angled parking effectively narrows streets which slows traffic. However, unlike traditional front-angled parking, reverse-angled parking reduces safety risks to traffic and bicyclists since drivers no longer reverse into the travel lane. Reverse-angled parking provides a safer alternative since it allows drivers to enter the travel lane while moving forward and it eliminates the risk of bicycle collisions with open vehicle doors as the vehicles no longer enter bicycle lanes. Also, drivers leaving spaces enter the travel lane with the driver-side window facing on-coming traffic offering improved visibility. After converting front to reverse-angled parking, the City of Tucson reduced cycling accidents from about four per month to nearly zero (Speck 2012).
The biggest drawback from reverse-angled parking is temporary disruption and confusion as drivers adjust to the new parking configuration. For this reason, planners should consider proposing these projects as pilots and compare speed and accident data before and a few months after implementation, providing drivers time to adjust.
Somerville installed reverse-angled parking along a section of Bow Street in 2012. The project doubled the number of parking spaces, reduced traffic speeds by 10 percent, and received feedback from bicyclists who felt safer traveling on the street (City of Somerville 2012).
Other than aesthetic improvements, marking parallel parking spaces allows planners to control the exact number and size of spaces and discourages illegal parking by signaling to drivers where parking is allowed. Planners can also decrease traffic speeds by narrowing travel lanes with wider parking space markings. Conversely, leaving parallel parking unmarked generally allows for more spaces since car lengths are on average shorter than marked spaces. Unmarked spaces primarily work best in dense urban areas where demand is high.
Ideally, curbside parking prices should be higher on busier streets with the greatest demand for spaces; however, generating citywide utilization data are time consuming and expensive. As most New England municipalities have centers where demand for curb parking is the greatest, a simple approach is to use a pricing gradient by gradually tapering parking prices away from the center. Municipal lots and garages should follow the same pattern, but with lower prices than immediately adjacent curbside parking. This arrangement encourages turnover and attracts shorter trips to desirable curb spaces while lots and garages (along the fringes of downtown) attract longer trips. The City of Salem implemented this strategy following a downtown parking study in 2010, and it has been well received by downtown businesses (Nelson\Nygaard 2010). Curb parking prices should be set high enough so that there are always one or two spaces available on each block.
In some areas, curbside parking can be used to improve walkability. Along car-dependent wide corridors with multiple wide high-speed lanes and mostly off-street parking, consider introducing curbside parking in tandem with replacing parking lots with development that has fewer off-street parking spaces. This strategy can be paired with improvements to pedestrian, bicycle, and transit infrastructure as a part of a broader effort to reduce car dependency and improve walkability. Parked vehicles serve as a buffer between traffic and pedestrians and effectively narrow the road discouraging faster speeds. Also, pedestrians are less likely to be hit by vehicles entering or exiting off-street parking lots. Most people do not feel safe or comfortable walking with vehicles passing at or above 30 miles per hour (mph) with no buffer or the near constant vigilance to avoid being hit by cars entering and exiting parking lots at curb cuts (Speck 2018). Moving some parking to the curb promotes sidewalk life as drivers and passengers traverse the sidewalk between their vehicle and destinations (Duany, Speck, and Lydon 2009). After introducing on-street spaces but most of the parking supply is still free and off-street, planners should avoid charging for on-street parking and instead rely on time limits to induce turnover. Once sufficient transportation alternatives are mature and available parking becomes limited, planners can consider introducing metered spaces.
First introduced in Pasadena, California in the 1990s and popularized by the University of California, Los Angeles (or UCLA) professor Donald Shoup, the parking benefit district (PBD) is a powerful and practical tool to begin actively managing curb space (Shoup 1994). PBD characteristics vary depending on the local priorities and regulations of each municipality and neighborhood, but at its core, PBDs approach the challenge of pricing curb parking by localizing the revenue and management. A typical PBD describes a geographic boundary (or district) where parking revenue collected in the boundary is all or partly reinvested back into the district. Ideally, a local committee composed of municipal officials, businesses, and residents can prioritize this revenue to address the unique needs of the district. After paying for operating expenses, the remaining parking revenue can have a variety of uses, including funding sidewalk repair, curb cuts, crosswalks, parklets, street furniture, bicycle parking, public art, street cleaning, bus stop improvements, and lighting.
While parking revenue is a nice perk of PBDs, it is secondary to its primary purpose: to generate turnover. As discussed in Shoup’s The High Cost of Free Parking, free or too-low parking prices encourage visitors to crowd the limited spaces leading to more double parking, decreased turnover, and time spent searching for parking known as “cruising” (Shoup 2011). The obvious solution is to increase parking prices, but in practice this solution is often met with opposition from businesses and residents. PBDs are a practical tool that allows planners to realistically introduce curb pricing by permitting local businesses and residents to benefit from the revenue and influence local curb policy. Once in place, businesses experience the relationship between parking prices and turnover rates firsthand, which gives them the motivation and knowledge to advocate for parking policy that encourages turnover without turning visitors away. The PBD reinvestment mechanism creates a virtuous cycle where visitors generate revenue that is reinvested into improving the attractiveness of the district, which then leads to more visitors.
As PBDs became increasingly popular across the country, they remained rare in Massachusetts as state law limited the use of parking funds (Balik, Dimino, and Ortiz 2016). However, in 2016, the Massachusetts General Court enacted the Municipal Modernization Act explicitly permitting municipalities to establish PBDs and allowing parking revenue to fund “improvements to the public realm, and transportation improvements, including, but not limited to, the operations of mass transit and facilities for biking and walking”(Commonwealth of Massachusetts 2016). If planners are interested in bringing PBDs to their city or have questions, they should contact the Metropolitan Area Planning Council (MAPC) for help on getting started.
In 2017, the town of Arlington introduced metered parking in Arlington Center and subsequently established a PBD managed by a diverse array of local officials and stakeholders (Town of Arlington n.d.; Hanlon 2017). Initially, business owners were skeptical, but most were quickly persuaded by the sudden increase in turnover. After operating expenses, the PBD generated approximately $150,000 of annual revenue to improve local infrastructure and street amenities. Upon witnessing the success of the Arlington Center PBD, business owners in nearby commercial districts have expressed a desire to create their own.
Managing residential parking is an extremely challenging aspect of curb management. As a rule, residents wish to park as close to their homes for the lowest price possible. This desire, combined with a resident’s sense of ownership over the curb, can limit a planner’s options for managing curb space. Therefore, the most practical and effective strategies for managing residential curb space acknowledge or leverage this sense of ownership. A few strategies in this vein include residential permit programs, residential PBDs, and payment in lieu of parking.
Residential permit programs (RPP) can reduce demand for curb space by limiting the ability of nonresidents to park along residential streets. RPPs work best to limit “overflow” parking originating from adjacent districts with relatively high parking demand.
RPP best practices include:
RPPs are effective at decreasing parking demand by limiting spillover from nonresidents but are less effective at reducing demand from residents living in the permit district. This is because adjusting parking prices is the most efficient tool to manage demand but increasing permit prices in RPPs is generally unpopular and often politically infeasible. As RPP neighborhoods become more congested either from increased car ownership or density, the consequences grow more severe. Residential neighborhoods will increasingly view new housing, retail, or office proposals as potential competition for limited parking. Residents may also oppose reductions in off-street parking minimums or curb space projects that replace parking spaces with PUDO zones or bicycle or bus lanes. This can be especially frustrating as projects that may decrease car dependence, such as new mixed-use developments or bus lanes, become increasingly difficult to implement.
The residential parking benefit district or RPBD combines the residential permit program with the parking benefit district. At their core RPBDs resemble residential permit programs except that parking revenue collected in the district is set aside to fund improvements to the district.
The advantages of RPBDs over RPPs are:
Recommendations for developing RPBDs include:
Payment in lieu of parking or PILOP is a strategy that can increase the efficiency of the parking supply and decrease car dependency. An MAPC survey of 200 multifamily developments around the Boston region showed that 30 percent of off-street residential parking is unused (MAPC 2019). However, this parking is controlled by private entities, limiting the ability for planners to manage the parking supply more effectively. PILOP policies allow developers to pay the city in lieu of a portion of their minimum parking requirement. Municipalities can use PILOP revenue to fund new municipal parking garages that can add parking supply allowing off-street spaces to be shared among multiple tenants and giving planners more control to set prices. By moving parking off the street, curb space can be repurposed for other uses. PILOP revenue can also fund new transit and bicycle share or car share stations around participating developments to decrease car ownership among new residents. PILOP programs have been implemented in the Boston region in Lexington and Brookline (Town of Lexington 2017; Town of Brookline 2014).
The rapid rise of e-commerce platforms over the last decade has rapidly transformed freight in the United States. From 2010 to 2020, total annual e-commerce sales in the United States increased from $169 billion to $759 billion, representing an increase of 349 percent (US Census 2021). Over the same time period, the quantity of packages processed by the United States Postal Service increased by 121 percent from 3.3 to 7.3 billion (USPS 2020). As the volume of shipping increased, the destination of packages has changed as well. In 2017, UPS reported that for the first time commercial to residential deliveries represented the majority of the company’s shipping activity (UPS 2018). Since 2017, this ratio has continued to grow, reaching 64 percent by 2020 (UPS 2021).
This rapid rise of package volume in combination with a shift to residential deliveries is placing increasingly more demand on limited curb space. In urban areas, delivery drivers often cannot find convenient legal space to carry out deliveries, which compels them to obstruct travel lanes and other rights-of-way. A study of commercial vehicle parking found that only 48.5 percent of delivery vehicles in downtown Seattle park in authorized locations while delivering packages (Girón-Valderrama, Machado-León, and Goodchild 2019). While the Boston region lacks similar data, the problem is highlighted extensively in the local press (Turner 2019; Dungca 2019; Keniston 2020). As the demand for curb space continues to grow in the region, cities and towns will need to develop new curb management strategies to limit the impact on congestion and safety.
Managing commercial vehicles at the curb is arguably the most challenging aspect of curb management. The problem is growing and evolving rapidly, and planners have fewer tools to manage commercial vehicles. In contrast to passenger vehicle parking, curb demand from commercial trips is less sensitive to pricing. This is because the demand for commercial trips does not originate from the driver, rather it originates from the customers receiving deliveries. Therefore, adjusting curb prices will not influence customer decisions to order products. Additionally, commercial demand for curbs cannot be shifted to other modes like transit, walking, or bicycling. These trips are generally not optional, so the consequences of inadequately accommodating drivers are more severe since drivers will park regardless of whether there is enough space for them. As a result, freight and commercial vehicle management is a vital component of every curb management plan.
There are four primary types of commercial vehicles that demand space at the curb:
Before implementing freight curb management strategies, planners should measure freight activity and identify problem areas by surveying businesses and delivery drivers. The business owner survey should ask the day of the week, time of day, and duration of deliveries. In addition, this survey can ask if the business owner has issues receiving deliveries, if they would like a loading/delivery zone, and which type they prefer. Page 7 of the National Association of City Transportation Officials (or NACTO) Curb Strategies provides an example of a freight survey in New York City (Roe and Toocheck 2017).
Delivery drivers should also be surveyed since they are most knowledgeable about where and when there are problems making deliveries in the city. Willing business owners could help implement the driver survey. Another option is to interview drivers in combination with enforcement activity. Los Angeles employed this strategy with their “Tiger Teams,” by interviewing repeat illegal parking offenders to identify where to place loading zones (FHWA 2020). Using the survey results, planners can consider the following strategies.
In places with especially high curb congestion, planners can consider negotiating with businesses and delivery companies to move scheduled deliveries to off-peak hours (between 7:00 PM and 6:00 AM). New York City recently piloted a successful off-hour delivery program and found that delivery speeds increased by 50 to 130 percent (NYC 2019). Average service times dropped from 1.5 hours to 30 minutes since delivery personnel faced fewer delays during unloading. Delivery companies also saved money by reducing operational costs and parking fines equating to about $500 to $1,000 per truck per month. While effective, there are a few major drawbacks that hinder off-peak unloading. Not all businesses are suitable for off-peak unloading and some business owners may not feel comfortable receiving deliveries unattended. There is also the issue of noise to neighboring residents. Planners interested in off-peak unloading should proactively investigate noise reduction strategies with freight companies and include noise management as part of their proposal.
For certain repeat offenders, it may be possible to move truck unloading to an adjacent side street, parking lot, or alleyway. Planners can act as intermediaries to negotiate with surrounding businesses when locating alternative unloading locations. Alternatives can sometimes be too small or difficult to navigate, so it may be possible to negotiate with freight companies to send smaller trucks. Freight companies may be more cooperative if alternative unloading locations with smaller trucks would reduce the frequency of parking violations.
Flex zones are clearly marked, time limited PUDO zones that allow use from any vehicle. These flex zones need to be long enough to allow larger commercial vehicles to easily enter and exit. Flex zones can be placed near intersections with angled bulb outs near the rear with a curb cut to accommodate cargo ramps and hand cart access.
Common carrier lockers are a promising way to increase efficiency and concentrate delivery activity away from congested areas. These lockers are identical to the Amazon lockers and package lockers found in apartment complexes, but the lockers are publicly owned and accessible to any package carrier. In 2018, the Urban Mobility Lab in Seattle piloted the first publicly owned common carrier locker in the United States (Kim et al. 2018). They found the lockers reduced delivery times by 78 percent and eliminated failed deliveries. The pilot’s success prompted the creation of the first permanent common carrier locker in June 2021, as part of the city’s first “Neighborhood Delivery Hub” (Urban Freight Lab 2021). While lockers require people to travel to receive their packages, the security against package theft is compelling, with 67 percent of respondents surveyed in Seattle expressing an interest in using them. Planners should consider placing lockers near transit stations and pair them with flex zones. Planners should consider integrating lockers in concepts like Boston’s GoHubs! program (City of Boston 2020).
curbFlow is a curb management technology company that is developing a suite of services that can allow cities to manage PUDO activity and loading zones. They recently conducted a six-month pilot with the City of Columbus to test their LMZ platform in eight congested curb locations (City of Columbus 2020). Drivers download the curbFlow app and can check into an LMZ while picking up or dropping off goods and freight. Law enforcement can view the status of an LMZ in real time to ensure vehicles in the zone are checked in. The pilot was widely adopted with more than 100 commercial freight and on-demand delivery companies participating and more than 2,400 drivers registering. Merchants near LMZs experienced faster pick-ups and drop-offs and a decline in illegal parking. curbFlow is still in the process of developing their complete “Digital Loading Zone” platform, but the service appears promising. Cities could deploy curbFlow or a similar platform to address some of the greatest challenges facing curb management.
Curb management features enabled by LMZs include
Electric cargo bikes (or e-cargo bikes) are a promising new delivery option that may be suited for many of the Boston region’s dense urban neighborhoods. The bikes address curb congestion by moving the unloading process off the curb and onto sidewalks and alleyways. Their small size allows them to use bicycle infrastructure and navigate narrow city streets, and the bikes are fitted with an electric motor that reduces the difficulty of climbing hills. E-cargo bikes can save time by eliminating the need to cruise for parking and eliminate parking fines for delivery companies. Delivery vehicles often block curbside bicycle lanes, so e-cargo bikes may present a solution by allowing delivery vehicles to use bicycle lanes for travel without obstructing them while unloading. E-Cargo bikes are deployed in a few European cities but are still rare in the United States. The Urban Freight Lab in Seattle piloted a small e-cargo bike delivery program and Amazon is planning to deploy them in New York City (Urban Freight Lab 2020a; Young 2021). Research results on their speed compared to cargo vans is mixed. A study in London found them to be 60 percent faster, while the pilot in Seattle found them to be about 80 percent slower (Verlinghieri et al. 2021). More research is needed to evaluate the effectiveness of e-cargo bikes in US cities. However, even if they are slower compared to cargo vans, it might be a worthwhile trade-off to reduce curb congestion.
Since their sudden rise in the early 2010s, transportation network companies (TNCs), such as Uber and Lyft, have become increasingly popular and provide a vital role in our cities. TNCs gave an estimated 91.1 million rides in Massachusetts in 2019, representing a 40.6 percent increase compared to 2017 (Massachusetts 2020). While this trend was disrupted by COVID-19, the impact appears temporary. In 2020, Uber reported a 47 percent decline in bookings for rides; however, as vaccines became available and pandemic restrictions were lifted, rider demand quickly recovered by mid-2021 (Uber 2021; Krueger 2021). As demand for rides plummeted in 2020, demand for delivery services rose in tandem with Uber Eats and DoorDash reporting increases of 128 and 219 percent respectively (DoorDash 2021).
Recent research highlights the importance of mitigating TNC-induced congestion. In a survey of Boston area TNC riders, 59 percent chose ride-hailing service instead of public transit, citing that they considered ride-hailing faster. The survey also estimates that among the 944 riders surveyed, an additional 445 car trips were generated that would have otherwise been taken by public transit, walking, or bicycling (Gehrke, Felix, and Reardon 2019). Recent studies also show that TNC ridership substantially contributes to greater traffic congestion in major US cities (Diao, Kong, and Zhao 2021; Erhardt et al. 2019). These studies indicate a potentially troubling cycle in the Boston region; poor transit service encourages riders to use TNCs, which worsens congestion leading to worse bus transit service.
Ideally, planners could use data to locate where and when there is the greatest amount of TNC traffic in their cities to inform curb management efforts. Unfortunately, with few exceptions, planners do not have access to TNC data, and the exceptions are often paired with data-sharing restrictions (Vaccaro 2016). While far from ideal, Massachusetts planners do have access to municipal level TNC data through the Regulating Transportation Network Companies Act (2016). The act levies a $0.20 tax to every TNC ride in the state and compels TNCs to provide municipal level data that is published annually in the Massachusetts Rideshare Report (Massachusetts 2020). The usefulness of these data are limited, but planners in smaller municipalities can use it to observe overall TNC ridership trends in their municipality and prompt further investigation. For example, in the city of Marlborough between 2017 and 2019, the number of TNC rides increased by 119 percent from 84,123 to 184,387. A planner can use these data along with local knowledge and contacts to understand the who, where, and why behind this sudden increase and investigate if there are any areas that have experienced an increase in curb congestion. Additionally, half of the funds collected under the 2016 law are distributed to cities and towns based on their TNC ridership and can be used for Complete Streets and other programs that support alternative modes of transportation. This is a potential source of funds to implement curb management projects, such as PUDO zones, flex zones, bicycle lanes, bus lanes, and loading zones.
While the 2016 law provides some helpful data and funds, it is far from ideal. For example, in 2018, the city of Marlborough received only $13,226.30 from the 2016 law, severely limiting the city’s options for addressing its increase in TNC traffic (MAPC 2020). Fortunately, this may improve in the coming years with proposals in the State Legislature to increase TNC taxes and compel TNCs to provide more detailed data (Transportation Bond 2021). The Governor has expressed support for legislation to increase TNC taxes and require more data than in the past, so planners should watch the State Legislature for future developments (DeCosta-Klipa 2020).
While planners will have to wait for further legislation compelling TNCs to share more granular data, MPO staff learned in interviews with representatives from Uber and Lyft that they encourage contact from municipalities. While these companies cannot provide raw data, they can provide answers to specific questions and limited analysis. For example, a planner proposing a PUDO zone may ask Uber and Lyft where and when the demand is greatest for pick-ups and drop-offs in the area. Cities with PUDO zones can also contact Uber and Lyft to set up geofencing so drivers and passengers are directed to the proper PUDO areas. Uber encourages municipal officials and planners to submit questions via the Uber Mobility Solutions contact us form and select “Municipality support/Other,” or contact the Uber Operations Manager for Massachusetts (Varun Kaushalas of 2021). Lyft does not offer a form, but directs Massachusetts planners to contact the Regional Director (Ben Metcalf as of 2021) or the Market Operations Manager (Adam Boyajian as of 2021). Currently, food and goods delivery services do not offer contacts for municipal officials and planners.
Going forward, it will become increasingly impractical for busy planners to contact a dozen delivery companies whenever they set up a PUDO. A potential solution is to partner with a curb management company, such as curbFlow and Coord, to serve as an intermediary between TNCs and municipalities. Curb management research shows TNCs appear more willing to collaborate with municipalities through an intermediary rather than working with municipalities directly (Diehl, Ranjbari, and Goodchild 2021).
Given the impact of TNC ridership on congestion and its potential to generate additional vehicle traffic in the future, it is essential that planners attempt to understand the role of TNCs in their region and prioritize strategies to limit their impact.
Strategies for addressing TNCs include:
Municipalities that prioritize bicycle access in their communities can consider dedicating curb space for bicycle uses. Complete Streets guidelines include bicycle uses as part of designing the public right-of-way. Many Massachusetts streets and curb areas do not have dedicated spaces for people who ride bicycles. Because of this, public discussions about the idea of retrofitting a street that currently prioritizes motor vehicle traffic to add bicycle protections can be difficult. However, emphasizing access and safety are important aspects of the process. Data can also be helpful to show that streets function well with dedicated space for people who ride bicycles. Special consideration should be given to bicycle space maintenance and ensuring that snow and debris do not accumulate in bicycle lanes.
Bicycle protection can be implemented in various ways, offering different levels of protections. Bicycle protection can be provided with street paint by painting bicycle lanes next to the curb or next to curbside parking. These types of lanes are the least protective and appeal to the fewest numbers of riders. Bicycle lanes with physical separation from moving traffic like bollards, additional curbs, or painted buffer areas are safer and appeal to a larger population of riders. The optimal level of separation and width of bicycle lanes depend on the quantity and prevailing speed of traffic and the number of lanes. The Level of Traffic Stress (LTS) criteria is a useful framework for evaluating bicycle infrastructure by the level of stress riders experience (Mekuria, Furth, and Nixon 2012).
Communities that want to promote bicycling as a safe and popular transportation option should choose bicycle protections at stress levels 1 or 2, which appeal to the largest number of people who ride bicycles. The authors of the LTS criteria published a series of tables that specify the level of stress associated with various degrees of bicycling protection depending on traffic volume, speed, and the number of travel lanes (Furth 2017). These tables can assist planners in evaluating their bicycling networks and prioritizing improvements where high stress levels are depressing rider volume and putting riders at the greatest risk. Finally, MassDOT's Separated Bike Lane Planning & Design Guide is a comprehensive and excellent resource for municipalities seeking guidance for planning and designing bicycle priority infrastructure.
Bus priority within curb management dedicates curb space for buses through dedicated bus lanes, queue jumps, and bus stop curb extensions. Bus routes with high levels of delay or high levels of ridership are good candidates to consider for bus priority. Municipal planners should work with transit planners at their local transit authority to determine which routes would benefit from transit priority. Local transit authorities, such as the Massachusetts Bay Transportation Authority (MBTA), can provide data on bus delay and ridership, to determine which bus routes to prioritize for bus priority. Municipal planners can also collect their own data through surveys by asking passengers where and when routes experience the greatest delays.
Bus lanes reduce delay caused by other vehicles by giving buses their own dedicated lane in which to operate. Bus lanes are the most effective form of bus priority; however, they give all curb space to bus transit use. Empirical research shows that bus lanes have little to no positive impact on average travel speeds, but they significantly reduce variability resulting in more reliable travel times (González et al. 2019; Surprenant-Legault and El-Geneidy 2011). If implementing a bus lane will replace a mixed-travel lane, planners can compare peak period delay and passenger volume between bus and car travelers. Corridors that will benefit the most from bus lanes have high ridership and experience frequent and severe delays during peak periods. Along these corridors, the significant reduction to service variability outweighs the minor increase to travel times experienced by car travelers.
For areas where parking is displaced, peak-only bus lanes can be a helpful tool to gain the support of local businesses while improving reliability for bus travelers. Peak-only bus lanes give buses priority during peak periods when buses experience the greatest travel time variability. During non-peak periods buses can use general purpose travel lanes and on-street parking can return. Queue jumps are another targeted intervention that can decrease delay while preserving mix-travel lanes and parking. Queue jumps are dedicated spaces at intersections where buses can jump ahead of other traffic. When combined with transit signal priority technology, buses can receive a signal to pass through the intersection before other vehicles allowing them to bypass congested intersections. Bus lanes can also be combined with bicycle lanes; however, this option should be considered carefully along routes with high bicycling traffic due to the potential for bus/bicycle conflicts.
Along wide corridors with high bus ridership planners should consider center-running bus lanes. Center-running bus lanes do not occupy the curb space while providing more reliable service than curb-side lanes since they avoid conflicts with traffic and parked cars. Opening in October 2021, the Columbus Avenue Bus Lanes in Boston are the first center-running bus lanes in New England and demonstrate how premium BRT-like bus service can be successful in the region.
In late 2020, the City of Chelsea replaced parking along segments of Broadway with an all-day bus-only lane accompanied by curb extension at bus stops. In the interview with a planner from Chelsea, it was noted that the project has significantly reduced boarding, egress, and travel times along Broadway. Unexpectedly, the city has also observed a decline in double-parking along the corridor, which has improved travel time reliability for drivers as well.
PUDO zones are curbside parking spaces where vehicles can park for free for a maximum period of time, usually 15 minutes. While in recent years, PUDOs have primarily targeted ride-hailing services, PUDOs can also address the recent surge of food and package deliveries, customers picking up their own orders or running short errands.
A well-placed PUDO zone can:
The City of Boston recently conducted a pilot by designating four PUDO zones along Boylston Street in the Fenway neighborhood (Boston 2019). The City observed a 350 percent increase in vehicle turnover (number of vehicles per hour), a 38 percent decrease in double parking, and an eight percent decrease in parking citations. The success of the Fenway pilot prompted the City to continue experimenting with additional zones in the South Boston Seaport neighborhood in early 2020. In interviews, planners in Somerville and Arlington have also observed an increase in turnover from recently implemented PUDO zones.
When building a PUDO, planners should consider input from businesses and drivers for freight companies and TNCs. For busy corridors, PUDO zones should be located along immediately adjacent side streets. PUDO zones should be visible and accessible for passengers and people driving. Adjacent sidewalks should be clear of obstructions and street furniture, and the PUDO zone should be near curb ramps. PUDO zones should allow for 60 feet or three parking spaces for vehicles to enter and exit the zone. There should be signage and paint to mark the PUDO zone clearly and nonvisual wayfinding, such as textured surfaces. Finally, PUDO zones should be visible in TNC apps and other wayfinding apps, especially for PUDO zones on side streets.
Parklets, or “little parks” as their name implies, are small semi-permanent public spaces that occupy curb space or other underutilized residual spaces, such as parking lots, medians, and traffic triangles. Occasionally referred to as “streateries,” parklets are much more than simply a place to eat in the street. When located along the curbside, parklets effectively extend the sidewalk by placing a raised platform at the curb allowing more space for tables, chairs, benches, greenery, public art, or simply additional walking space. Within curb management, parklets typically fall under the “activation” category since they are a tool for enhancing the quality of pedestrian life on city streets.
The story of parklets in the United States begins in San Francisco with the first semi-permanent installation in 2009. Over the following years, the popularity of parklets spread to other US cities and by 2015, there were at least 40 installations throughout the country (Onorati 2015). In the Boston region, the first parklet was completed in 2013 along Massachusetts Avenue in Lexington (Ball 2013). Adoption of parklets in the Boston region was gradual. The City of Boston has funded one to two installations per year while allowing community partners to fund their own projects through the City’s formal parklets program (City of Boston 2018a, 2016). This trend of slow, steady growth suddenly accelerated in 2020 in response to the COVID-19 pandemic, and by mid-summer 2021, there were 351 active curbside outdoor dining permits in Boston alone (Buell 2021).
While the popularity of curbside dining is encouraging, future success is not guaranteed. Many of these pandemic-induced curbside dining installations were barebones installations composed of a few tables and chairs surrounded by jersey barriers. They often lacked elevated platforms and were not wheelchair accessible. This lack of quality is understandable considering their role as an emergency lifeline to businesses during the pandemic. While the necessity for outdoor dining will diminish as the threat of COVID-19 wanes, many business owners and their patrons are enthusiastic to see it continue (Hilliard 2021; Buell 2021). Going forward, cities have an opportunity to build on this momentum, but planners need to shift beyond an emergency “anything goes” approach to curbside dining and develop a long-term strategy.
An effective strategy to find potential parklet locations is to survey businesses and the community to generate a list of places for parklets. Residents and business owners already know where busy, safe, and pedestrian-friendly places are in the city.
If permitted under State law, municipalities should consider allowing businesses to offer table service to adjacent parklet visitors. Before the pandemic, if a business wanted a parklet, they would have to fund and maintain it but could not offer visitors table service. This limits the usefulness of parklets to only businesses that serve portable food or items for pick-up. Allowing businesses to offer table service increases the potential economic benefit of the parklet, which incentivizes them to fund and maintain them. It can also improve safety by providing the parklet with a steady stream of visitors. However, this can also decrease the “inviting” factor of a parklet. The sense of ownership that compels business owners to fund and maintain the parklet may lead to the exclusion of the public. Municipalities should be diligent in ensuring these parklets are clearly signed and communicate to businesses that parklets are open to the public.
The Lexington Center parklet on Massachusetts Avenue is the oldest parklet in the region and serves as an excellent example of a successful long-term installation. The parklet enhances the already vibrant Lexington Center and attracts visitors from nearby cafes, restaurants, and ice cream shops. It also attracts people who bicycle due to its proximity to the Minuteman Trail and accompanying bicycle racks.
The curb is an inherently contentious place in the city. Curb management is largely a zero-sum endeavor since changes require substituting one use for another. On the other hand, a decision of inaction favors the status quo and represents a choice that the alternatives are not worth the effort of disrupting that status quo. Residents often resist paying for parking that used to be free, businesses will usually resist proposals to charge their customers to park in front of their establishment, and drivers may resent losing a travel lane. The following recommendations are strategies that can help planners address these challenges.
Many curb management projects, such as curb extensions, bulb-outs, and bicycle lanes, have undeniable safety benefits. Even projects that do not have an obvious safety benefit can often improve safety. For example, bus lanes can reduce double parking that contributes to accidents. It is important to use data as much as possible to reinforce this point since some of these changes are naturally counterintuitive. For example, projects that narrow lanes also reduce speeds by making drivers feel less comfortable driving faster in restricted spaces. Drivers will connect this feeling of discomfort with the feeling that the road is less safe. This is especially relevant for recently completed projects, as drivers attempt to drive at speeds that used to feel comfortable but no longer are. If the planners obtained or collected safety data on the area before and after the project, planners could demonstrate the actual safety benefits of the completed project.
Emphasize how projects benefit the entire community and avoid using language that implies projects are for or against a specific population. For example, bicycle lanes should not be described as for “bicyclists” or for the “bicycling community.” This sort of language invokes tribal thinking that “we” are sacrificing something for “them,” and encourages an antagonistic response. Rather, planners should emphasize that building protected bicycle infrastructure saves lives, reduces traffic, and offers residents and visitors an additional option to safely access and enjoy the city.
Multiple planners in interviews noted the importance of conducting a parking study with any projects that impact parking. Planners should know the number of spaces in the area, how many will be removed or moved, the usage of those spaces, and alternative places to park if necessary. These data provide planners with the information needed to respond to residents and businesses who have concerns about where they or their customers will park.
It is important that residents and business owners first hear about projects from municipal officials instead of learning about them through a secondary source. This is especially true for projects that affect business owners. For example, for projects that will affect parking, it is vital that planners attempt to visit business owners or reach them in some other way to personally introduce the project. Planners should explain project benefits, the reasons behind it, and ask if the business owner has any concerns. Planners should then listen to concerns and answer questions. This process can be supported with surveys, direct mail, and emails, but planners should attempt to have personal conversations with as many business owners as possible. Business owners are busy people, and they will appreciate planners coming to them instead of asking them to take time to read and fill out an anonymous survey.
Many business owners will resist proposals to begin charging for parking or to increase prices near their establishment. When proposing these projects, planners should always emphasize how the project will benefit a business by encouraging more turnover. More turnover means more cars per hour, which translates to more customers per hour.
During the planning stage of curb projects, it is important to introduce the project to other municipal departments who also interact with the curb. This step has two primary purposes: first, this is a chance to familiarize them with the project to gain support, and second, any potential problems with the project can be identified and addressed before it is built.
Here are a few concerns that other departments may have with a curb project:
Consider experimenting with a quick-build approach for future curb projects. Quick builds are a strategy that allow planners to experiment with new ideas while collecting data and community feedback. These strategies are typically smaller scale, employ cheaper materials, and are intended to be shorter temporary installations from the outset (Mitman et al. 2018). Quick builds are best used as a proof-of-concept installation that demonstrates an alternative way to use and enjoy public spaces. These projects can range from temporary bus and bicycle lanes (using only cones and signs) to pedestrian plazas and parklets (using a few tables and bollards).
The COVID-19 pandemic demonstrated the potential of quick builds to suddenly transform spaces and attitudes at an unprecedented scale. The pandemic compelled cities across Massachusetts to rapidly construct hundreds of quick-build parklets that allowed the public to experience outdoor dining in new locations for the first time.
A specific example of a successful quick-build project during COVID-19 is the temporary closure of Park Terrace in Arlington Center to provide a pedestrian space with picnic tables. Park Terrace is a short alleyway located behind Massachusetts Avenue businesses, a high school, and a residential development. From interviews with Arlington planners, MPO staff learned that the Park Terrace quick build provided local planners a few unexpected, but valuable lessons:
The Tontine Crescent is an example of a successful quick-build project in Boston. In 2018, a section of curb space along Franklin Street in Downtown Crossing was transformed with some paint, furniture, planters, bollards, and barriers to create a pedestrian plaza and protected bicycle lane. The City of Boston conducted a survey and found that 77 percent of the respondents were satisfied with the installation and 82 percent wished for the City to upgrade it to a permanent plaza (City of Boston 2018b). These results show a previously unmet demand for additional pedestrian space in the area and following the positive feedback, the City announced plans to construct a permanent plaza at Tontine Crescent in 2021 (MilNeil 2021).
Pilot projects are small-scale, often temporary implementations of a project that planners can use to test how effective a project or street design might be (APM 2016). While pilots and quick builds have some things in common and are sometimes used interchangeably, there are some key differences. Pilots typically require more investment with the intent of becoming permanent following a post-hoc evaluation and community outreach effort.
The chief advantage of the pilot approach is that it accelerates construction by moving the public process to after the project is complete, allowing planners to collect feedback about the actual project instead of relying on possibilities and expectations. However, pilots risk unintended consequences (that a public process might identify) and potential bad publicity if the project is not a success.
Framing a curb design project as a pilot is often helpful if the type of project is new to the community and minimal comparisons exist within the area. Pilots also work well when a temporary installation of a project can be feasibly implemented. However, framing a project as a trial or a pilot can be counterproductive, especially if it lacks context or is not implementable with a temporary installation. If either of these conditions apply, there is still value in doing the work to push for an investment that is in line with policies and programs identified by the city, but with a different approach than a pilot.
The following are elements that contribute to a successful pilot:
Cambridge and Watertown installed bus lanes, bicycle lanes, transit signal priority, and queue jumps as a pilot project along segments of Mount Auburn Street. The project conducted a before-and-after satisfaction survey and travel time savings analysis. Respondents reported an increase of overall satisfaction with the corridor from 19 to 57 percent and bus riders reporting a seven to 10-minute time savings. More importantly, all modes reported more reliable commute times with less severe disruptions during rush hour. Planners in Cambridge noted the results of this study were crucial in messaging the project to stakeholders and the public.
Obtaining external funding for a curb project can be essential if projects are not funded by municipal budgets. When applying for grants, planners should estimate annual maintenance and other yearly costs to curb improvements, especially if a grant is only covering procurement and installation costs. For smaller municipalities with limited resources and staff, consider partnering with neighboring municipalities to submit joint grants.
The following is a list of available grants and funding opportunities:
Albouy, David, Gabriel Ehrlich, and Minchul Shin. 2018. “Metropolitan Land Values.” The Review of Economics and Statistics 100 (3): 454–66.
An Act Regulating Transportation Network Companies. 2016. Massachusetts General Laws. Vol. Chapter 159A½. https://malegislature.gov/Laws/SessionLaws/Acts/2016/Chapter187.
APM. 2016. “What Is the Difference between a Trial and a Pilot?” Association for Project Management. https://www.apm.org.uk/resources/find-a-resource/what-is-the-difference-between-a-trial-and-a-pilot/.
Balik, Justin, Richard Dimino, and Irene Figueroa Ortiz. 2016. “Future of Parking in Boston: Addressing the Need to Promote Economic Opportunity, Enhance Community Access, and Reduce Parking Demand.” A Better City. https://www.abettercity.org/docs-new/Future_of_Parking_in_Boston.pdf.
Ball, Patrick. 2013. “A Parklet Grows in Lexington.” Patch. June 26, 2013. https://patch.com/massachusetts/lexington/a-parklet-grows-in-lexington.
Boston. 2019. “PICK-UP/DROP-OFF PILOT - Initial Assessment & Early Findings.” City of Boston - Mayor Martin J. Walsh. https://www.boston.gov/sites/default/files/file/2019/12/PUDO%20report_v1206update.pdf.
Buell, Spencer. 2021. “Boston Gave Up Hundreds of Parking Spaces to Outdoor Seating. It Should Keep Going.” Boston Magazine. June 24, 2021. https://www.bostonmagazine.com/news/2021/06/24/parking-space-outdoor-restaurant-patios/.
CCD. 2019. “Rethinking the Curb Lane in Center City.” Center City District (CCD) & Central Philadelphia Development Corporation (CPDC). https://www.centercityphila.org/uploads/attachments/ck42yecia0ylc1oqdcwnmvjbk-curb-lane-report-2019.pdf.
City of Boston. 2013. “Boston Bike Network Plan.” City of Boston Department of Transportation . https://www.cityofboston.gov/images_documents/Boston%20Bike%20Network%20Plan%2C%20Fall%202013_FINAL_tcm3-40525.pdf.
———. 2016. “Boston Parklets Program.” City of Boston. https://www.boston.gov/transportation/boston-parklets-program.
———. 2018a. “Boston Tactical Public Realm Guidelines: Parklets.” City of Boston.
———. 2018b. “Tontine Crescent Tactical Plaza.” City of Boston. https://www.boston.gov/departments/transportation/tontine-crescent-tactical-plaza.
———. 2020. “GoHubs!” City of Boston. https://www.boston.gov/departments/transportation/gohubs.
City of Columbus. 2020. “CurbFlow Findings Report - Loading Management Zones.” City of Columbus. https://www.columbus.gov/publicservice/parking/curbFlow-Final-Report-June-2020/.
City of Norwalk. 2019. “Norwalk Tomorrow: Back-In Angled Parking Trend Comes To Norwalk.” City of Norwalk. https://tomorrow.norwalkct.org/news/back-angled-parking-trend-comes-norwalk/.
City of Seattle. 2020. “Seattle 2035: Comprehensive Plan.” City of Seattle. http://www.seattle.gov/Documents/Departments/OPCD/OngoingInitiatives/SeattlesComprehensivePlan/CouncilAdopted2020.pdf.
City of Somerville. 2012. “Bow Street/Union Square Angle-In Parking Pilot Shows Early Signs of Success.” City of Somerville. https://www.somervillema.gov/news/bow-streetunion-square-angle-parking-pilot-shows-early-signs-success.
Commonwealth of Massachusetts. 2016. “Revitalization of Communities (PARC) Act.” Chapter 40 § 22A. Massachusetts General Laws.
Coord. 2021. “Developers.” 2021. https://www.coord.com/developers.
DeCosta-Klipa, Nik. 2020. “Charlie Baker Is Proposing a Fivefold Increase in Uber and Lyft Fees.” Boston(Dot)Com. January 22, 2020. https://www.boston.com/news/local-news/2020/01/22/charlie-baker-uber-lyft-fee-proposal/.
Diao, Mi, Hui Kong, and Jinhua Zhao. 2021. “Impacts of Transportation Network Companies on Urban Mobility.” Nature Sustainability 4 (6): 494–500.
Diehl, Caleb, Andisheh Ranjbari, and Anne Goodchild. 2021. “Curbspace Management Challenges and Opportunities from Public and Private Sector Perspectives.” Transportation Research Record, July, 03611981211027156.
DoorDash. 2021. “DoorDash Q1 Earnings Investor Letter.” DoorDash. https://s22.q4cdn.com/280253921/files/doc_financials/2021/q1/Q1-2021-Shareholder-Letter_FINAL.pdf.
Duany, Andres, Jeff Speck, and Mike Lydon. 2009. The Smart Growth Manual. McGraw-Hill Education.
Dungca, Nicole. 2019. “The Tech Effect: The Get-It-Now Age of Uber and Amazon Has Delivered Something Unexpected to Boston’s Doorstep — New Traffic That Worsens Our Soul-Crushing Snarl.” The Boston Globe, November 2019. https://apps.bostonglobe.com/metro/investigations/spotlight/2019/11/21/seeing-red/convenience-culture-makes-traffic-worse/.
Erhardt, Gregory D., Sneha Roy, Drew Cooper, Bhargava Sana, Mei Chen, and Joe Castiglione. 2019. “Do Transportation Network Companies Decrease or Increase Congestion?” Science Advances 5 (5): eaau2670.
Eros, Emily. 2019. “Deep Dive: Methods and Considerations for Collecting Curb Regulation Data.” SharedStreets. September 3, 2019. https://medium.com/sharedstreets/collecting-curb-regulation-data-from-scratch-3f60a3ef383.
FHWA. 2020. “Urban Freight Case Studies - Los Angeles Tiger Teams Curbside Management Program.” United States Department of Transportation - Federal Highway Administration. https://ops.fhwa.dot.gov/publications/fhwahop10020/tigerteams.htm.
Furth, Peter G. 2017. “Level of Traffic Stress Criteria for Road Segments, Version 2.0.” Northeastern University. https://cpb-us-w2.wpmucdn.com/sites.northeastern.edu/dist/e/618/files/2014/05/LTS-Tables-v2-June-1.pdf.
Gehrke, Steven R., Alison Felix, and Timothy G. Reardon. 2019. “Substitution of Ride-Hailing Services for More Sustainable Travel Options in the Greater Boston Region.” Transportation Research Record 2673 (1): 438–46.
Girón-Valderrama, Gabriela del Carmen, José Luis Machado-León, and Anne Goodchild. 2019. “Commercial Vehicle Parking in Downtown Seattle: Insights on the Battle for the Curb.” Transportation Research Record 2673 (10): 770–80.
González, Felipe, Vicente Valdivieso, Louis De Grange, and Rodrigo Troncoso. 2019. “Impact of the Dedicated Infrastructure on Bus Service Quality: An Empirical Analysis.” Applied Economics 51 (55): 5961–71.
Hanlon, Pat. 2017. “Q&A on Warrant Article 26: Parking Benefits Districts.” Town of Arlington Town Meeting 5th Precinct. https://www.supportarlingtoncenter.org/uploads/8/3/4/2/83421350/qandaarticle26.pdf.
Henao, Alejandro, and Wesley E. Marshall. 2019. “The Impact of Ride-Hailing on Vehicle Miles Traveled.” Transportation 46 (6): 2173–94.
Hilliard, John. 2021. “In a Post-COVID World, There’s a Craving for Outdoor Dining to Stay on the Menu.” The Boston Globe, June 11, 2021. https://www.bostonglobe.com/2021/06/11/metro/post-covid-world-theres-craving-outdoor-dining-stay-menu/.
Keniston, Denise. 2020. “City Calls for More Police Enforcement for Illegal Parking on Beacon Street.” The Somerville Times, September 2020. https://www.thesomervilletimes.com/archives/102641.
Kim, Haena, Ed McCormack, Anne Goodchild, and Barbara Ivanov. 2018. “The Final 50 Feet Urban Goods Delivery System: Common Carrier Locker Pilot Test at the Seattle Municipal Tower.” Urban Freight Lab . https://depts.washington.edu/sctlctr/research/publications/final-50-feet-urban-goods-delivery-system-common-carrier-locker-pilot-test.
Krueger, Hanna. 2021. “Uber, Lyft Shortages Make Getting a Ride in Boston an ‘Extreme Sport.’” The Boston Globe, May 29, 2021. https://www.bostonglobe.com/2021/05/29/metro/uber-lyft-shortages-make-getting-ride-boston-an-extreme-sport/?p1=BGSearch_Overlay_Results.
Lehner, Stephan, and Stefanie Peer. 2019. “The Price Elasticity of Parking: A Meta-Analysis.” Transportation Research Part A: Policy and Practice 121 (March): 177–91.
MAPC. 2019. “Metro Boston Perfect Fit Parking Initiative: Phase II Report.” Metropolitan Area Planning Council (MAPC). https://perfectfitparking.mapc.org/assets/documents/Final%20Perfect%20Fit%20Report.pdf.
———. 2020. “TNC Funds Distributed to MAPC Cities & Towns.” Metropolitan Area Planning Council (MAPC). https://www.mapc.org/wp-content/uploads/2019/07/TNC-Funds-Chart-2019.pdf.
Massachusetts. 2020. “Rideshare in Massachusetts - 2019 Data Report.” Commonwealth of Massachusetts Department of Public Utilities (DPU). https://tnc.sites.digital.mass.gov/.
MBTA. 2021. “Bus Transit Priority - Dedicated Bus Lanes.” Massachusetts Bay Transportation Authority. 2021. https://www.mbta.com/projects/bus-transit-priority.
Mekuria, Maaza C., Peter G. Furth, and Hilary Nixon. 2012. “Low-Stress Bicycling and Network Connectivity.” Research report 11-19. Mineta Transportation Institute. https://transweb.sjsu.edu/sites/default/files/1005-low-stress-bicycling-network-connectivity.pdf.
MilNeil, Christian. 2021. “Downtown Boston’s Tontine Plaza to Be Made Permanent.” April 29, 2021. .https://mass.streetsblog.org/2021/04/29/downtown-bostons-tontine-plaza-to-be-made-permanent/.
Mitman, Meghan F., Steve Davis, Ingrid Ballús Armet, and Evan Knopf. 2018. “Curbside Management Practitioners Guide.” Institute of Transportation Engineers.
MOD. 2020. “Outdoor Dining/Seating: Accessibility Considerations Fact Sheet (Covid-19 Edition).” Massachusetts Office on Disability (MOD). https://www.mass.gov/doc/outdoor-diningseating-accessibility-considerations-fact-sheet-covid-19-edition/download.
Nelson\Nygaard. 2010. “City of Salem Comprehensive Parking Plan.” Nelson\Nygaard Consulting Associates. https://www.salem.com/sites/g/files/vyhlif3756/f/uploads/salem_final_exec_sum.pdf.
———. 2014. “District Department of Transportation Curbside Management Study.” Nelson\Nygaard Consulting Associates. https://wiki.ddot.dc.gov/download/attachments/94601888/District%20Department%20of%20Transportation%20Curbside%20Management%20Study.pdf?api=v2.
NYC. 2019. “Improving the Efficiency of Truck Deliveries in NYC.” City of New York. https://www1.nyc.gov/html/dot/downloads/pdf/truck-deliveries-ll189.pdf.
Oliveira, Rebeca. 2013. “Parklet to Cost up to $25K.” Mission Hill Gazette, June 14, 2013. https://missionhillgazette.com/2013/06/14/parklet-to-cost-up-to-25k/.
Onorati, Teresa. 2015. “Parklet Encyclopedia: A Guide to Parklets Around the World.”https://tonorati.files.wordpress.com/2015/04/parkletencyclopediafinal-compressed-2.pdf.
Roe, Matthew, and Craig Toocheck. 2017. “Curb Appeal: Curbside Management Strategies for Improving Transit Reliability.” 01653761. National Association of City Transportation Officials (NACTO). https://nacto.org/wp-content/uploads/2017/11/NACTO-Curb-Appeal-Curbside-Management.pdf.
SFMTA. 2020. “Curb Management Strategy.” San Francisco Municipal Transportation Agency (SFMTA). https://www.sfmta.com/sites/default/files/reports-and-documents/2020/02/curb_management_strategy_report.pdf.
Shoup, Donald. 1994. “Cashing in on Curb Parking.” ACCESS Magazine 1 (4): 20–26.
———. 2011. The High Cost of Free Parking: Updated Edition. Routledge.
———. 2018. Parking and the City. Routledge.
Speck, Jeff. 2012. Walkable City: How Downtown Can Save America One Step at a Time. Farrar, Straus and Giroux.
———. 2018. Walkable City Rules: 101 Steps to Making Better Places. Island Press, Washington, DC.
Surprenant-Legault, Julien, and Ahmed M. El-Geneidy. 2011. “Introduction of Reserved Bus Lane: Impact on Bus Running Time and On-Time Performance.” Transportation Research Record 2218 (1): 10–18.
Town of Arlington. n.d. “Parking Advisory Committee.” Town of Arlington. Accessed July 2021. https://www.arlingtonma.gov/town-governance/boards-and-committees/parking-advisory-committee.
Town of Brookline. 2014. “First Amendment to Payment In Lieu of Taxes (Pilot) and Development Agreement.” Town of Brookline. https://www.brooklinema.gov/DocumentCenter/View/6085/Amended-PILOT-and-Dev-Agrmnt?bidId=.
Town of Lexington. 2017. “Payment in Lieu of Parking (PILOP) Policy.” Town of Lexington Board of Selectmen. https://www.lexingtonma.gov/sites/g/files/vyhlif7101/f/uploads/final_signed_pilop_policy_17.02.13_1.pdf.
Transportation Bond. 2021. An Act Authorizing and Accelerating Transportation Investment. https://malegislature.gov/Bills/191/H5248.
Turner, Lane. 2019. “How Can Boston Get Trucks to Stop Blocking Traffic?” The Boston Globe, December 10, 2019. https://www.bostonglobe.com/2019/12/10/opinion/how-can-boston-get-trucks-stop-blocking-traffic/.
Uber. 2021. “Uber Announces Results for Fourth Quarter and Full Year 2020.” Uber Technologies, Inc. https://investor.uber.com/news-events/news/press-release-details/2021/Uber-Announces-Results-for-Fourth-Quarter-and-Full-Year-2020/default.aspx.
UCLA. 2012. “Reclaiming the Right of Way: A Toolkit for Creating and Implementing Parklets.” UCLA Complete Streets Initiative Luskin School of Public Affairs. https://nacto.org/docs/usdg/reclaiming_the_right_of_way_brozen.pdf.
UPS. 2018. “United Parcel Service 2017 Annual Report on Form 10-K.” United Parcel Service, Inc. https://investors.ups.com/sec-filings/annual-filings.
———. 2021. “United Parcel Service 2020 Annual Report on Form 10-K.” United Parcel Service, Inc. https://investors.ups.com/sec-filings/annual-filings.
Urban Freight Lab. 2020a. “Cargo E-Bike Delivery Pilot Test in Seattle.” Urban Freight Lab. http://depts.washington.edu/sctlctr/sites/default/files/research_pub_files/Cargo-E-Bike-Delivery-Report.pdf.
———. 2020b. “Method Overview and Step-by-Step Process to Conduct a Curb Occupancy Study.” Urban Freight Lab. https://depts.washington.edu/toolkit/sites/default/files/toolkit_resource_files/CurbOccupanyMethodOverview.pdf.
———. 2021. “Introducing the Seattle Neighborhood Delivery Hub.” Urban Freight Lab. https://www.seattleneighborhoodhub.com/.
US Census. 2021. “US Census Bureau News - Quarterly Retail E-Commerce Sales 2nd Quarter 2021.” United States Census Bureau. https://www.census.gov/retail/mrts/www/data/pdf/ec_current.pdf.
USPS. 2020. “A Decade of Facts & Figures.” United States Postal Service. https://facts.usps.com/table-facts/.
Vaccaro, Adam. 2016. “Highly Touted Boston-Uber Partnership Has Not Lived up to Hype so Far.” Boston(Dot)Com. June 16, 2016. https://www.boston.com/news/business/2016/06/16/bostons-uber-partnership-has-not-lived-up-to-promise/.
Verlinghieri, Ersilia, Irena Itova, Nicolas Collignon, and Rachel Aldred. 2021. “The Promise of Low-Carbon Freight: Benefits of Cargo Bikes in London.” Possible. https://static1.squarespace.com/static/5d30896202a18c0001b49180/t/61091edc3acfda2f4af7d97f/1627987694676/The+Promise+of+Low-Carbon+Freight.pdf.
Young, Liz. 2021. “Amazon Signs Deal for E-Bike Logistics Hub in Manhattan,” April 23, 2021. https://www.bizjournals.com/newyork/news/2021/04/23/amazon-signs-deal-for-delivery-station-manhattan.html.