Prepared by
The Central Transportation Planning Staff
to the Boston Region Metropolitan Planning Organization
The Boston Region Metropolitan Planning Organization is composed of the following:
Massachusetts Department of Transportation
Metropolitan Area Planning Council
Massachusetts Bay Transportation Authority
MBTA Advisory Board
Massachusetts Port Authority
Regional Transportation Advisory Council
City of Boston
City of Beverly
City of Everett
City of Framingham
City of Newton
City of Somerville
City of Woburn
Town of Arlington
Town of Bedford
Town of Braintree
Town of Lexington
Town of Medway
Town of Norwood
Federal Highway Administration (nonvoting)
Federal Transit Administration (nonvoting)
This document was funded in part through grants from the Federal Highway Administration and Federal Transit Administration of the US Department of Transportation. Its contents do not necessarily reflect the official views or policies of the US Department of Transportation.
Chapter 1 – Introduction and Process
Chapter 2 – Transportation Needs in the Boston Region
Chapter 3 – Funding the Transportation Network
Chapter 4 – The Recommended Plan
Chapter 5 – System Performance Report
Chapter 6 – Transportation Equity Performance Report
Chapter 7 – Air Quality Conformity Determination and Greenhouse Gas Analysis
Chapter 8 – Next Steps: Implementation of Destination 2040
Appendix A – Universe of Investment Programs and Projects
Appendix B – Destination 2040 Project Evaluation Methodology
Appendix D – Public Outreach for Destination 2040
The MPO complies with Title VI of the Civil Rights Act of 1964, the Americans with Disabilities Act (ADA) and other federal and state nondiscrimination statutes and regulations in all programs and activities. The MPO does not discriminate based on race, color, national origin (including limited English proficiency), religion, creed, gender, ancestry, ethnicity, disability, age, sex, sexual orientation, gender identity or expression, veteran’s status (including Vietnam-era veterans), or background. Any person who believes herself/himself or any specific class of persons to have been subjected to discrimination prohibited by Title VI, ADA, or another nondiscrimination statute or regulation may, herself/himself or via a representative, file a written complaint with the MPO. Complaints filed under federal law (based on race, color, national origin [including limited English proficiency], sex, age, or disability) must be filed no later than 180 calendar days after the date the person believes the discrimination occurred. Complaints filed under Massachusetts General Law (based on race, color, religious creed, national origin, sex, sexual orientation, disability, or ancestry) or Governor’s Executive Order 526, section 4 (based on race, color, age, gender, ethnicity, sexual orientation, gender identity or expression, religion, creed, ancestry, national origin, disability, veteran’s status [including Vietnam-era veterans], or background) must be filed no later than 300 calendar days after the date the person believes the discrimination occurred. A complaint form and additional information can be obtained by contacting the MPO (see below) or at www.bostonmpo.org.
The Massachusetts Bay Transportation Authority, Cape Ann Transportation Authority, and MetroWest Regional Transit Authority, which are Federal Transit Administration Section 5307(c) applicants, have consulted with the MPO and concur that the public involvement process adopted by the MPO for the development of the Transportation Improvement Program satisfies the public hearing requirements that pertain to the development of the Program of Projects for regular Section 5307, Urbanized Area Formula Program, grant applications, including the provision for public notice and the time established for public review and comment.
Boston Region MPO
Certification Activities Group, Central Transportation Planning Staff
10 Park Plaza, Suite 2150
Boston, MA 02116
857-702-3690 (voice), 617-570-9193 (TTY)
This document, Destination 2040, is the Boston Region Metropolitan Planning Organization’s (MPO) Long-Range Transportation Plan (LRTP) that will guide decisions about investments in the region’s transportation network to bring the system from its present state towards the MPO’s vision for the system’s future:
The Boston Region Metropolitan Planning Organization envisions a modern, well-maintained transportation system that supports a sustainable, healthy, livable, and economically vibrant region. To achieve this vision, the transportation system must be safe and resilient; incorporate emerging technologies; and provide equitable access, excellent mobility, and varied transportation options.
To help achieve the MPO’s vision, this LRTP identifies goals, evaluates needs, and sets priorities, which will be supported with federal funding that the MPO receives for planning and programming investments in capital projects. However, given the region’s aging transportation infrastructure and limited resources, the MPO continues to address the following challenge through this LRTP:
How can we maintain the transportation network to meet existing needs, adapt and modernize it for future demand, and simultaneously work within the reality of constrained fiscal resources?
The MPO recognizes the diverse transportation needs in the Boston region. Matters of system preservation and modernization, safety, capacity management and mobility, the environment, economic vitality, and environmental justice all must be addressed and balanced to reach the MPO’s goals. In response to this challenge, the Recommended Plan demonstrates the MPO’s method for providing adequate funding for major infrastructure projects and investment programs.
During the development of the previous LRTP, Charting Progress to 2040, the MPO reevaluated its past practices and set a new course by moving away from programming funding predominantly for expensive capital-expansion projects designed to ease traffic congestion and instead set aside more funding for small operations-and-management-type projects that support bicycle, pedestrian, and transit projects, along with major roadway improvements. Destination 2040 continues this practice and increases funding for operations-and-management programs.
The MPO developed Destination 2040 in compliance with the current federal highway legislation, Fixing America’s Surface Transportation (FAST) Act, which governs MPO activities. In addition, public participation provided ongoing critical input to the MPO’s decision-making process. Throughout development of this LRTP, the MPO engaged in extensive outreach with an eye toward making public participation convenient, inviting, and engaging for everyone. In particular, the MPO sought to break down barriers to participation for people who traditionally have been only minimally involved in the continuous, comprehensive, cooperative (3C) planning process, such as minority and low-income populations, people who are 75 years of age or older, people who are 17 years of age or younger, and those with limited English proficiency (also referred to as LEP) or disabilities. These outreach efforts were conducted through the MPO’s Public Participation Program, which has focused on expanding the use of electronic forms of communication and interactive engagement techniques.
Early in the process of developing Destination 2040, the region’s transportation needs were assessed to help the MPO board decide which projects to fund in the LRTP. The Needs Assessment associated with Destination 2040 includes information about how the region’s surface transportation system is used now; projections of how it may be used in the future; how it interacts with land use conditions and the environment; and how well it serves low-income, minority, and other historically underserved populations. The Needs Assessment also establishes the baseline for monitoring progress through the MPO’s performance-based planning process.
The Needs Assessment data are available on the MPO’s website to help inform the public and make the planning process more transparent. The Needs Assessment document, also found on the MPO’s website, summarizes these data and identifies the region’s most critical needs relative to each of the MPO’s goals. The Needs Assessment makes clear that the transportation system requires extensive maintenance and modernization, and that there is a need to address safety and mobility for all modes.
Using the Needs Assessment and input from the public, the MPO staff compiled a comprehensive Universe of Projects and Programs that could be funded to address the identified problems; the projects and programs selected for evaluation and inclusion in this LRTP were taken directly from this list.
The MPO considered the public input provided during the development of the Needs Assessment for Destination 2040 when revisiting its existing vision, goals, and objectives. Based on that input, the MPO revised its vision statement to include additional emphasis on the maintenance and resilience of the transportation system. The MPO and public continue to envision the future transportation system by focusing on goals associated with these topics:
Public input was also taken into account when the MPO revised several of the objectives for each goal area. In addition to strengthening objectives focused on maintenance and resiliency of the system, changes were also made to the transportation equity objectives. Other changes included alignment of the objectives with the roles and responsibilities of the MPO and the incorporation of new planning requirements.
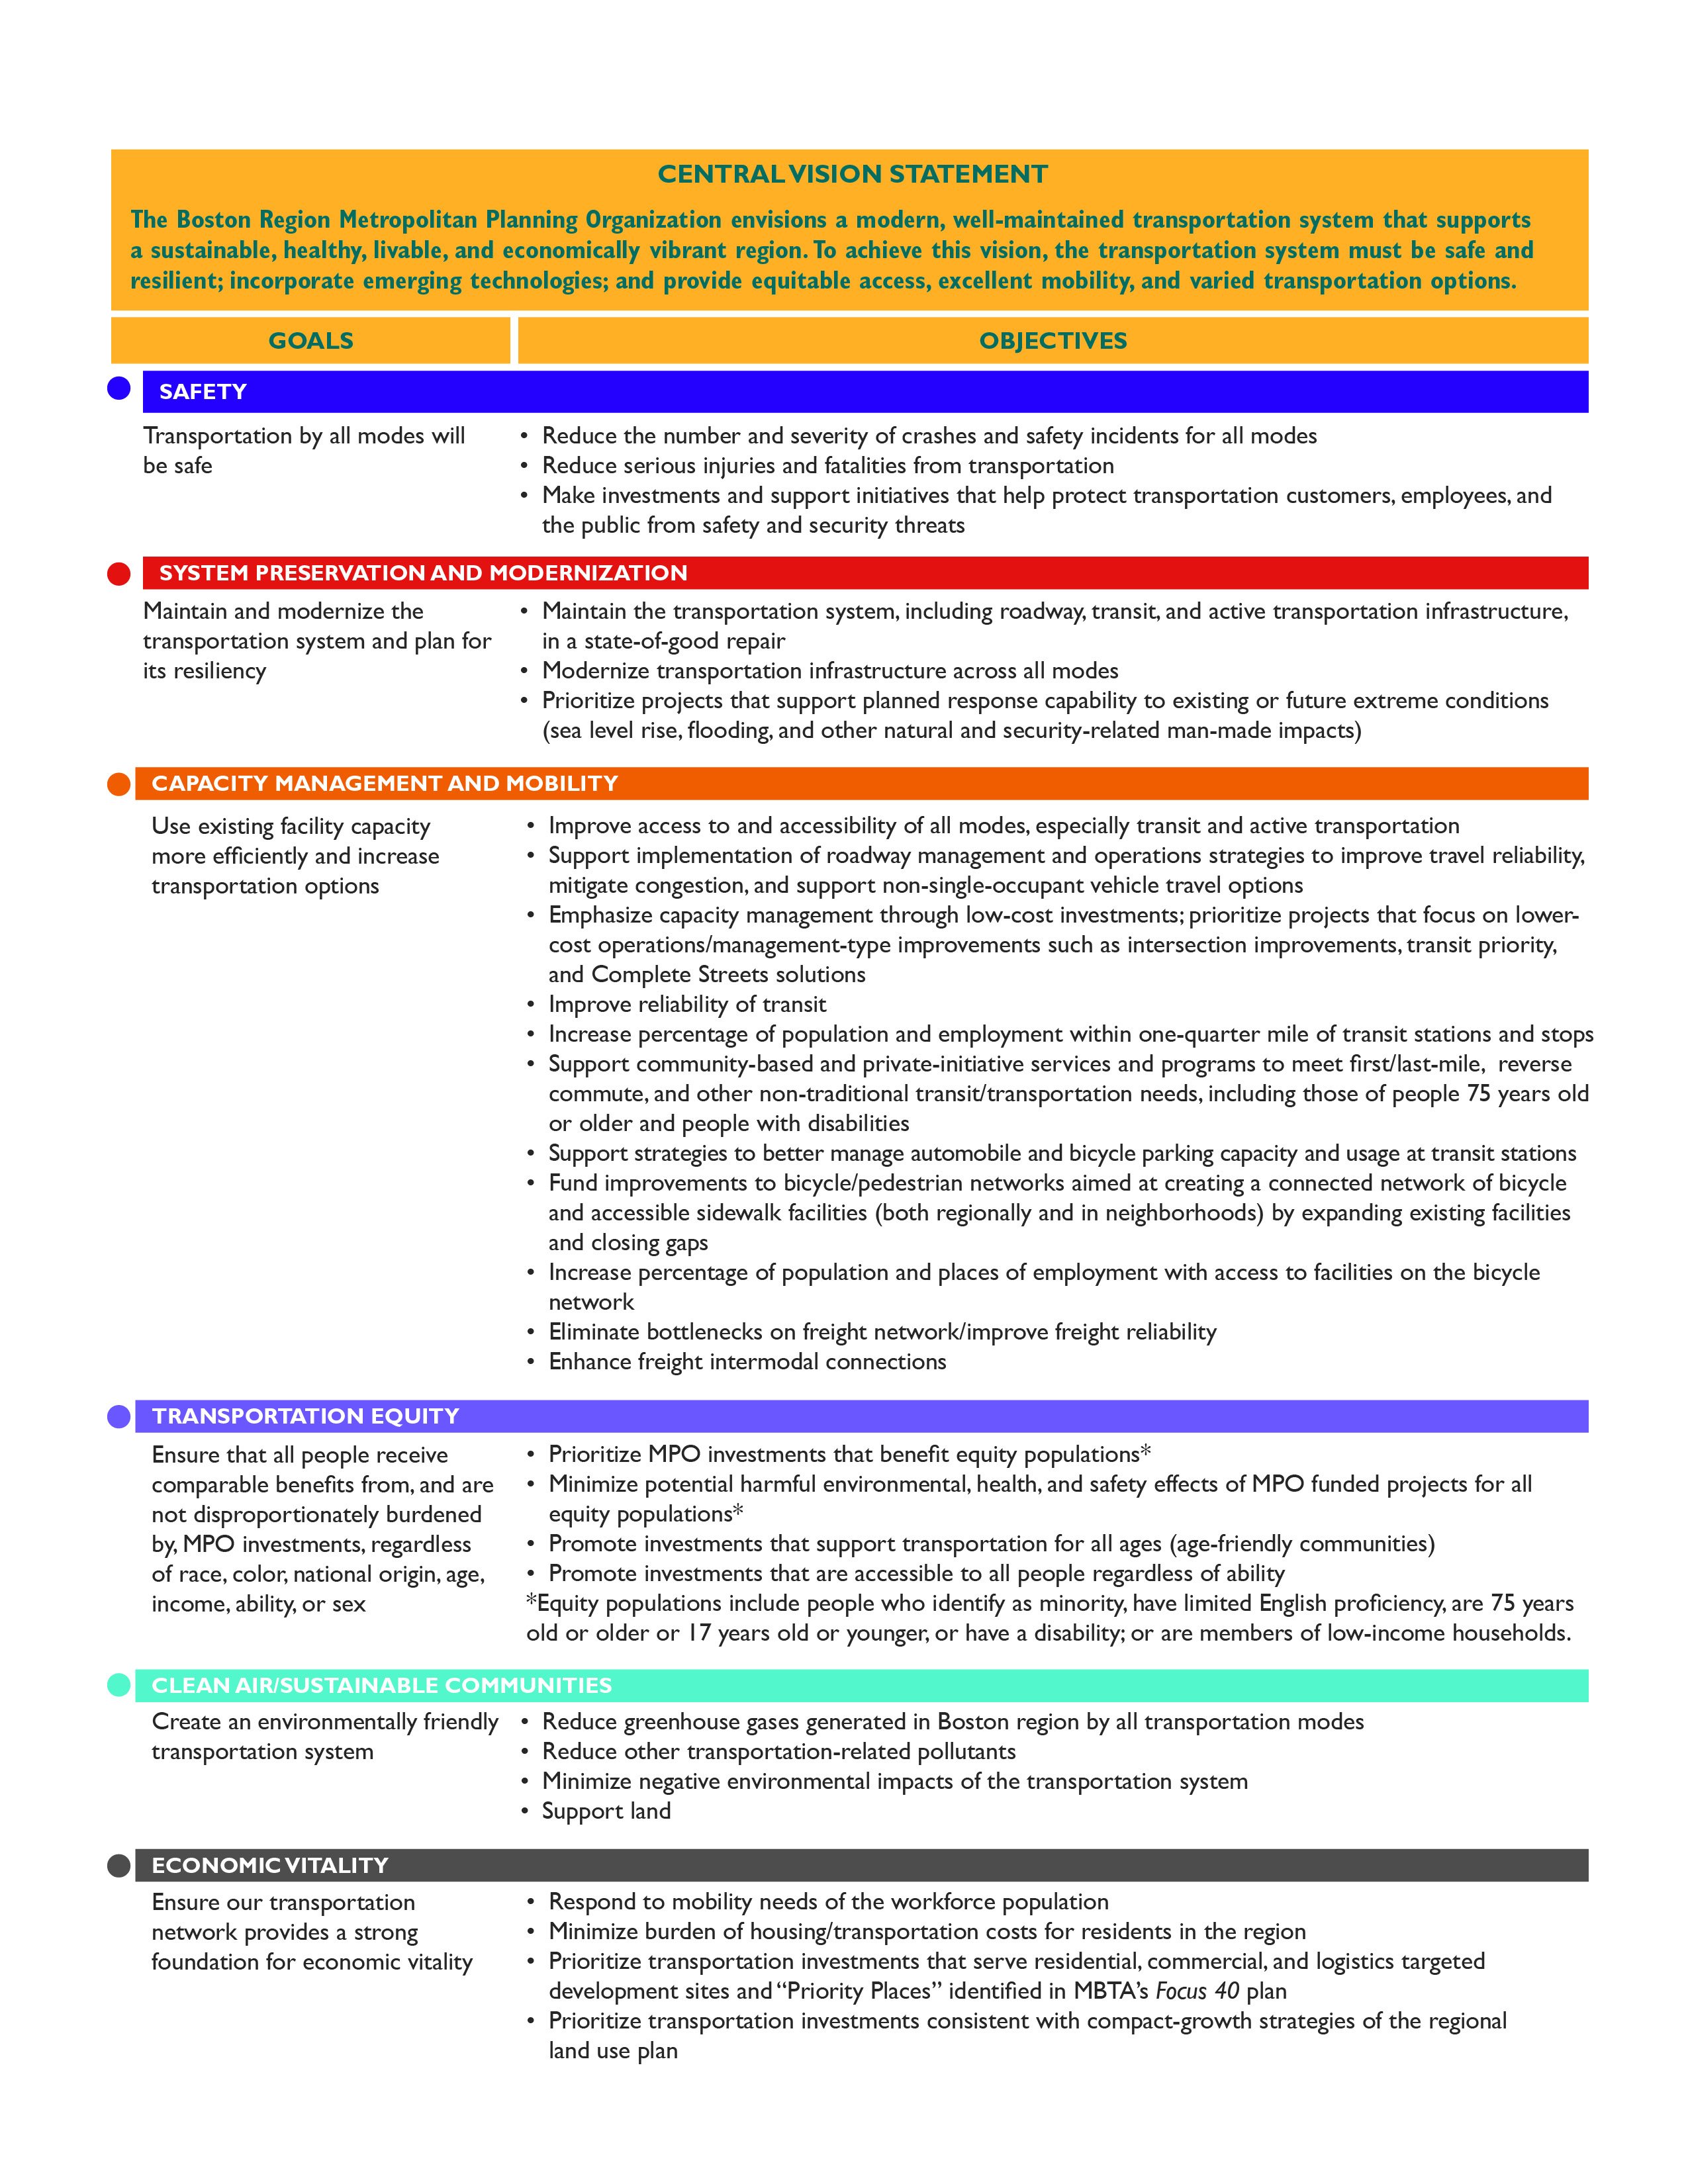
The goal areas were used by the MPO to categorize problems and their associated requirements for the transportation network in the Needs Assessment. This structure allowed the MPO to set goals that, if accomplished, would result in solutions for the identified problems and help the region achieve its vision. (See Figure ES-1.)
Figure ES-1
Destination 2040 Vision, Goals, and Objectives
Central Vision Statement
The Boston Region Metropolitan Planning Organization envisions a modern, well-maintained transportation system that supports a sustainable, healthy, livable, and economically vibrant region. To achieve this vision, the transportation system must be safe and resilient; incorporate emerging technologies; and provide equitable access, excellent mobility, and varied transportation options.
GOALS |
OBJECTIVES |
Safety |
|
Transportation by all modes will be safe |
• Reduce the number and severity of crashes and safety incidents for all modes |
System Preservation and Modernization |
|
Maintain and modernize the transportation system and plan for its resiliency |
• Maintain the transportation system, including roadway, transit, and active transportation infrastructure, in a state of good repair |
Capacity Management and Mobility |
|
Use existing facility capacity more efficiently and increase transportation options |
• Improve access to and accessibility of all modes, especially transit and active transportation • Support implementation of roadway management and operations strategies to improve travel reliability, mitigate congestion, and support non-single-occupant vehicle travel options • Emphasize capacity management through low-cost investments; prioritize projects that focus on lower-cost operations/management-type improvements such as intersection improvements, transit priority, and Complete Streets solutions • Improve reliability of transit • Increase percentage of population and employment within one-quarter mile of transit stations and stops
|
Transportation Equity |
|
Ensure that all people receive comparable benefits from, and are not disproportionately burdened by, MPO investments, regardless of race, color, national origin, age, income, ability, or sex |
• Prioritize MPO investments that benefit equity populations* |
Clean Air/Sustainable Communities |
|
Create an environmentally friendly transportation system |
• Reduce greenhouse gases generated in Boston region by all transportation modes |
Economic Vitality |
|
Ensure our transportation network provides a strong foundation for economic vitality |
• Respond to mobility needs of the workforce population
|
Source: Boston Region MPO.
Together, the vision, goals, and objectives lay the groundwork for the MPO’s performance-based planning practice, which in turn informs all of the work conducted by the MPO and includes evaluating and selecting projects and programs for the LRTP, selecting projects for the Transportation Improvement Program (TIP), and selecting planning studies for the Unified Planning Work Program.
During the 20 years of this plan, the Boston Region MPO has the discretion to program $2.9 billion in federal funds, which can be spent on highway transportation projects or flexed to transit projects. The federal agencies advised MassDOT and the MPO to assume that federal highway funding for MPOs would increase by 2.2 percent each year for federal fiscal years (FFYs) 2025 through 2040. For the same period, the MPO was told to assume that project costs would inflate by four percent each year. If these assumptions hold true, project costs will outpace available revenues resulting in diminished buying power in future years.
The financial plan for Destination 2040, which is discussed in Chapter 3, reflects the way in which the MPO plans to balance how it addresses the diverse identified needs while operating under the fiscal constraint of projected revenues. The financial plan includes estimated costs for the specific regionally significant transportation projects that the MPO will fund as well as defined amounts of money set aside throughout the life of the plan for programs that will fund smaller projects. Because these smaller projects are not regionally significant, they are not accounted for individually in the LRTP; rather they will be selected through the TIP programming process.
In addition to reporting on the MPO’s spending decisions, this financial plan provides information on the funds that the Commonwealth plans to spend on highway projects in the Boston region. It also describes expected resources available to the Massachusetts Bay Transportation Authority (MBTA), the Cape Ann Transportation Authority, and the MetroWest Regional Transit Authority to provide and improve transit service in the region.
Destination 2040 reaffirms the MPO’s policy of setting aside discretionary funding for a set of investment programs, continuing an operations-and-management approach to programming, and giving priority to low-cost, non-major infrastructure projects. The MPO agreed to continue funding the following existing investment programs, which are designed to prioritize the types of transportation projects that the MPO funds through its TIP
In addition, based on information from the Needs Assessment and public input, the MPO voted to
In addition to establishing this set of investment programs, the MPO also revised its funding goals for each of the investment programs as follows:
Major infrastructure projects that are funded by the MPO and included in Destination 2040 are shown in Table ES-1.
Table ES-1
Major Infrastructure Projects Funded by the Boston Region MPO in the Recommended Plan
Project Name |
Current Cost |
Time Band(s) Programmed |
Reconstruction of Rutherford Avenue, from City Square to Sullivan Square (Boston) |
$152,000,000 |
FFY 2020–29 |
Roadway, ceiling, and wall reconstruction, new jet fans, and other control systems in Sumner Tunnel (Boston) |
$126,544,931 |
FFY 2020–24 |
Intersection improvements at Route 126 and Route 135/MBTA and CSX Railroad (Framingham) |
$115,000,000 |
FFY 2030–40 |
Route 4/225 (Bedford Street) and Hartwell Avenue (Lexington) |
$30,557,000 |
FFY 2030–34 |
Western Avenue (Lynn) |
$36,205,000 |
FFY 2025–29 |
Bridge replacement, Route 27 (North Main Street) over Route 9 (Worcester Street) and interchange improvements (Natick) |
$25,900,000 |
FFY 2025–29 |
McGrath Boulevard (Somerville) |
$66,170,710 |
FFY 2025–34 |
Reconstruction of Route 1A (Main Street) (Walpole) |
$19,906,000 |
FFY 2020–24 |
Bridge replacement, New Boston Street over the MBTA (Woburn) |
$15,482,000 |
FFY 2020–24 |
FFY = Federal Fiscal Year. MBTA = Massachusetts Bay Transportation Authority. MPO = Metropolitan Planning Organization.
Source: Boston Region MPO.
In Destination 2040, for the transit network, the MPO has allocated all of the MBTA’s future transit capital funding to system infrastructure maintenance, accessibility improvements, and system enhancements. Destination 2040 also demonstrates the MPO’s commitment to projects in the State Implementation Plan by programming and funding them.
Table ES-2 presents a list of the amount of funding dedicated to programs in Destination 2040.
Table ES-2
Funding Dedicated to MPO Investment Programs in Destination 2040
Program |
Dedicated Funding |
MPO Discretionary Capital Program: Major Infrastructure Projects |
$594,099,800 |
MPO Discretionary Capital Program: Highway Funds Flexed to Transit |
$49,131,200 |
MPO Discretionary Capital Program: Complete Streets Program |
$1,296,464,600 |
MPO Discretionary Capital Program: Intersection Improvement Program |
$367,057,800 |
MPO Discretionary Capital Program: Bicycle/Pedestrian Program |
$139,360,300 |
MPO Discretionary Capital Program: Community Connections Program |
$55,413,900 |
MPO Discretionary Capital Program: Transit Modernization Program |
$118,534,700 |
MPO Discretionary Capital Program: Unassigned Funds |
$283,798,100 |
Total MPO Funding |
$2,903,860,400 |
MPO = Metropolitan Planning Organization.
Source: Boston Region MPO.
During the life of Destination 2040, the Boston Region MPO will continue its transition to a performance-based approach to making investments in the region’s transportation system. The MPO’s performance-based planning and programming (PBPP) practice is focused on ensuring that transportation investment decisions are oriented toward meeting established goals. PBPP activities generally fall into three phases:
The MPO’s PBPP process includes activities that respond to federal PBPP requirements. States, public transportation agencies, and MPOs must set targets for, monitor, and report on performance in a number of defined performance areas with the goal of improving performance in these areas through transportation investments. Table ES-3 lists these performance areas.
Table ES-3
Federal Performance Areas and Performance Measure Topics
Performance Area |
Performance Measure Topics |
Transit Safety |
Fatalities Injuries Safety events System reliability |
Transit Infrastructure Condition |
Vehicle condition Facility condition Infrastructure (fixed-guideway) condition |
Roadway Safety |
Fatalities, including for nonmotorized users Serious injuries, including for nonmotorized users Fatality rates Serious injury rates |
NHS Infrastructure Condition |
NHS bridge condition NHS pavement condition |
NHS System Performance |
Travel time reliability (all vehicles) on the NHS Truck travel time reliability on the NHS |
CMAQ–Traffic Congestion |
Peak hour excessive delay on NHS roadways Share of non-SOV travel |
CMAQ–Emissions Reduction |
Emissions reductions from projects funded through the CMAQ Program in designated air quality improvement areas |
CMAQ = Congestion Mitigation and Air Quality. MPO = Metropolitan Planning Organization. NHS = National Highway System. Non-SOV = non-single occupancy vehicle.
Sources: Boston Region MPO, Federal Highway Administration, and Federal Transit Administration.
To meet federal requirements, the MPO’s LRTP must
Chapter 5 of Destination 2040 lists federally required performance measures and targets and describes the state of the Boston region’s transportation system with respect to these measures. Additional information about the state of the system is available in the Needs Assessment.
The LRTP also outlines an investment framework, based on the MPO’s goals and objectives, and the projects and programs that are designed to improve transportation performance in these and other areas. Chapter 5 outlines how Destination 2040’s regionally significant projects and investment programs may improve performance in federal performance areas. These long-term investment strategies will inform the short-term capital investment decisions the MPO makes each year in the TIP. Finally, Chapter 5 explains how the MPO will report on performance and expand its PBPP practice in the future.
As a recipient of federal funding from the Federal Transit Administration and the Federal Highway Administration, the MPO must comply with federal Title VI, environmental justice (EJ), and other nondiscrimination requirements promulgated by these agencies. Chapter 6, the Transportation Equity Performance Report, documents the MPO’s compliance with Title VI and EJ analytical requirements as they pertain to the LRTP. The chapter includes a map of the projects in the Recommended Plan overlaid on areas with high shares of minority and/or low-income populations and a disparate impact and disproportionate burden (DI/DB) analysis that determined whether minority and low-income populations may be disproportionately affected by the projects in the Recommended Plan that can be modeled, in the aggregate, in the MPO’s regional travel demand model.ES-1
The DI/DB analyses, which are designed to meet both Title VI disparate impact and EJ analytical requirements, identified potential future disparate impacts that may result from the modeled projects and affect minority populations, as well as potential future disproportionate burdens that may affect low-income populations.ES-2 Adverse effects may be either a delay or denial of benefits or an imposition of burdens. For this LRTP, MPO staff used the regional travel demand model to assess ten metrics for potential future disparate impacts and disproportionate burdens in both sets of analyses:
Two scenarios were tested in the travel demand model to identify the projected impacts, as measured by these metrics, of the proposed transportation network on minority, low-income, nonminority, and non-low-income populations. In one scenario, the transportation network as envisioned for the year 2040 included the modeled projects (a build scenario) and another 2040 scenario did not include them (a no-build scenario). The changes between the build and no-build scenarios for the minority and low-income populations were compared to the changes between the nonminority and non-low-income populations, respectively.
Finally, MPO staff applied the MPO’s draft DI/DB Policy to determine whether this comparison revealed any disparate impact for the minority population or disproportionate burden for the low-income population. The DI/DB Policy, in effect for the first time during the development of Destination 2040, states how the MPO identifies and addresses potential future disparate impacts and disproportionate burdens that may result from the modeled projects in the Recommended Plan. In FFY 2018, MPO staff began the first of a two-phase effort to develop a DI/DB policy for the modeled projects; the second phase will begin in FFY 2020 and the draft policy will be revised to reflect this work. The current draft DI/DB Policy states that there would be a potential future disparate impact or disproportionate burden if the minority or low-income populations would likely be more adversely affected than the nonminority or non-low-income populations, respectively, assuming the finding is not skewed by a forecasting error for the metric.
The DI/DB analyses showed that no disparate impacts and disproportionate burdens would likely result from either the MPO-funded regional projects or the MassDOT and MPO-funded regionally significant projects.
The MPO staff completed two types of air quality analyses for Destination 2040. The first is the air quality conformity determination for projects in the LRTP, as required by federal and state regulations, which specifically addresses ozone and carbon monoxide (CO). The requirement to perform a conformity determination ensures that federal approval and funding are awarded to transportation activities that are consistent with air quality goals. The air quality conformity analysis demonstrates that the Destination 2040 LRTP meets the Clean Air Act and Transportation Conformity Rule requirements for the 1997 ozone National Ambient Air Quality Standard (NAAQS) and the CO NAAQS, and that the LRTP has been prepared following all guidelines and requirements of these rules during this period. The analysis also shows that the implementation of the Boston Region MPO’s LRTP is consistent with the air quality goals of the Massachusetts State Implementation Plan and in conformity with that plan.
The second air quality analysis estimated greenhouse gas (GHG) emissions for projects in the LRTP and TIP as mandated by state legislation. The legislation requires reductions in GHG emissions of 25 percent below 1990 levels by 2020, and 80 percent below 1990 levels by 2050. To do so, state policies require the transportation sector to promote healthy transportation modes and support smart growth development.
The Massachusetts Department of Transportation (MassDOT) provided the MPO with statewide estimates of carbon dioxide (CO2) emissions (the most prominent GHG) derived from the statewide travel demand model. These estimates were based on the collective list of recommended projects in all Massachusetts LRTPs and supplemented by “off-model” calculations of CO2 emissions reductions for smaller projects supplied by the MPOs. Collectively all the projects programmed in the MPOs’ LRTPs in the 2020 Action scenario (a build scenario) provide a statewide reduction of CO2 compared to the 2020 baseline case (a no-build scenario). The 2040 Action scenario also estimates a statewide reduction of CO2 emissions compared to the 2040 baseline case.
These results demonstrate that the transportation sector is expected to make positive progress toward meeting the GHG emissions reduction targets and complying with the requirements of the Global Warming Solutions Act. MassDOT and the MPOs will continue to advocate for steps needed to accomplish the Commonwealth’s long-term goals for GHG reductions.
Destination 2040 continues the MPO’s practice of funding operations-and-management-type projects that support bicycle, pedestrian, and transit projects, along with major roadway improvements. The MPO expects that continuing along this course will help to achieve its transportation vision for the future, improve the quality of life for Boston region residents, and enhance the environment in the whole region.
With the adoption of Charting Progress to 2040, the Boston Region Metropolitan Planning Organization’s (MPO) previous Long-Range Transportation Plan (LRTP), the MPO began charting a new course. Residents, municipalities, public agencies, and organizations from around the region helped the MPO decide how to invest its resources to improve transportation in the region. The result was an LRTP that represented a turning point in the philosophy and practice of the MPO. More explicitly than it had done in past, the MPO prioritized investments in smaller operations and management (O&M) projects that support transit, pedestrian, and bicycle modes, moving away from larger roadway projects. This new course meant that more than half of the projects programmed by the MPO, since Charting Progress to 2040 was adopted in 2015,were these types of O&M projects.
This new LRTP, Destination 2040, continues and strengthens this course. The LRTP represents the continued interest by the people in the region to develop a multimodal transportation system that serves all people in the region. While any forecast into the future is uncertain, the transportation system that Destination 2040 envisions is one that can address burgeoning transportation needs today, and that can adapt to those in the future. The vision of Destination 2040 is as follows:
The Boston Region Metropolitan Planning Organization envisions a modern, well-maintained transportation system that supports a sustainable, healthy, livable, and economically vibrant region. To achieve this vision, the transportation system must be safe and resilient; incorporate emerging technologies; and provide equitable access, excellent mobility, and varied transportation options.
In order to create a plan designed to implement this vision, the LRTP defines goals and objectives that guide the planning process and establishes performance measures to evaluate progress. It also outlines the transportation needs and challenges the region faces over the next 20 years. Finally, it identifies strategies to address those needs, using financial resources available to the Boston Region MPO.
Destination 2040 is a product of the Boston Region MPO, which is the designated MPO for the Boston metropolitan area. Each metropolitan area in the United States with a population of 50,000 people or more is required by federal legislation to establish an MPO. MPOs are responsible for providing a forum for a regional transportation planning decision-making process. The MPO body decides how to spend federal transportation funds for capital projects and planning studies for the area. The process is guided by a broad coalition of people including elected officials, municipal planners and engineers, transportation advocates, and interested residents.
The LRTP is one of the MPO’s required planning documents. It is meant to plan for the long-range future (at least 20 years) of the region. Every four years, the MPO identifies the system’s strengths and weaknesses; forecasts changes in population, employment, and land use; and creates a plan to address existing and future mobility needs. The resulting LRTP allocates funding for major projects in the Boston region and guides the MPO’s funding of capital investment programs and studies.
The federal government regulates the funding, planning, and operation of the surface transportation system through the federal transportation program, which was enacted into law through Titles 23 and 49 of the United States Code. Section 134 of Title 23 of the Federal Aid Highway Act and Section 5303 of the Federal Transit Act, as amended, require that urbanized areas conduct a transportation planning process, resulting in plans and programs consistent with the objectives of the metropolitan area, in order to be eligible for federal funds.
The most recent reauthorization of the surface transportation law is the Fixing America’s Surface Transportation (FAST) Act. The FAST Act sets policies related to metropolitan transportation planning. The law requires all MPOs to carry out a continuing, comprehensive, and cooperative (3C) transportation planning process.
The Boston Region MPO is responsible for carrying out the 3C planning process in the Boston region and has established the following objectives for the process:
More information about the federal, state, and regional guidance governing the transportation planning process and the regulatory framework in which the MPO operates can be found in Appendix A of the LRTP Needs Assessment document.
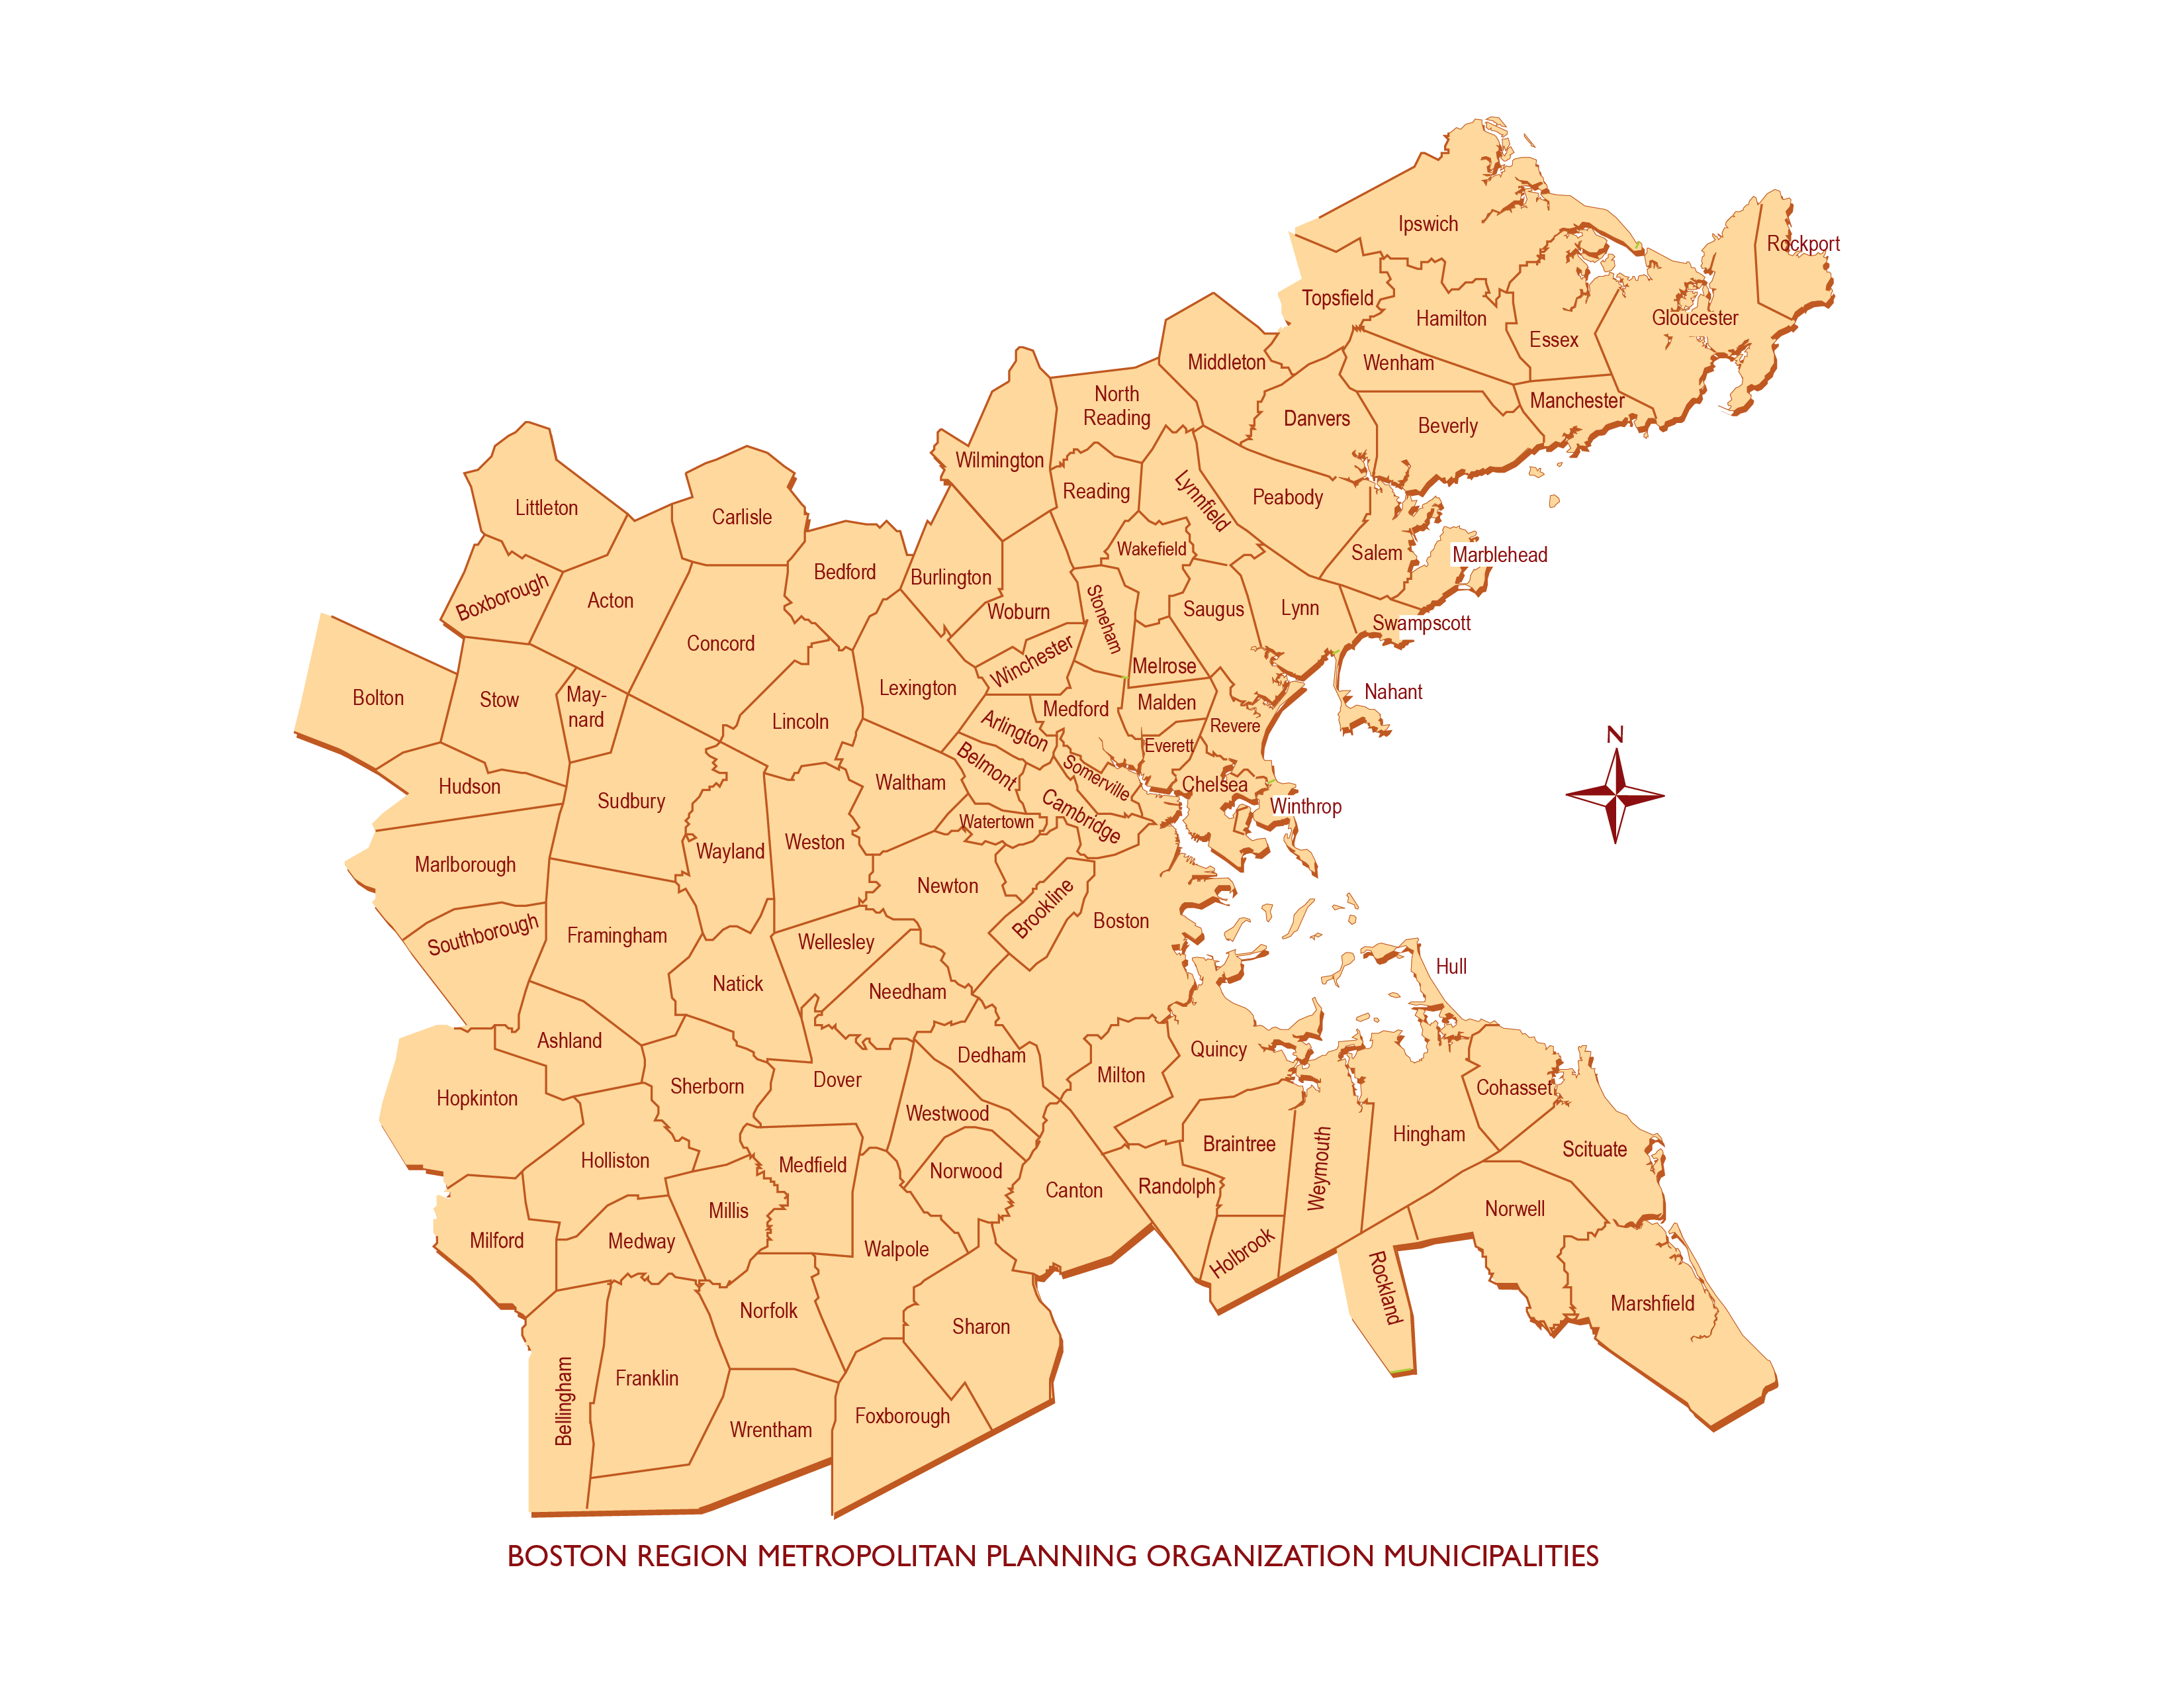
The MPO’s planning area covers 97 municipalities from Boston north to Ipswich, south to Marshfield, and west to Interstate 495. Figure 1-1 shows the map of the Boston Region MPO’s member municipalities.
Figure 1-1
Boston Region Metropolitan Planning Organization Municipalities
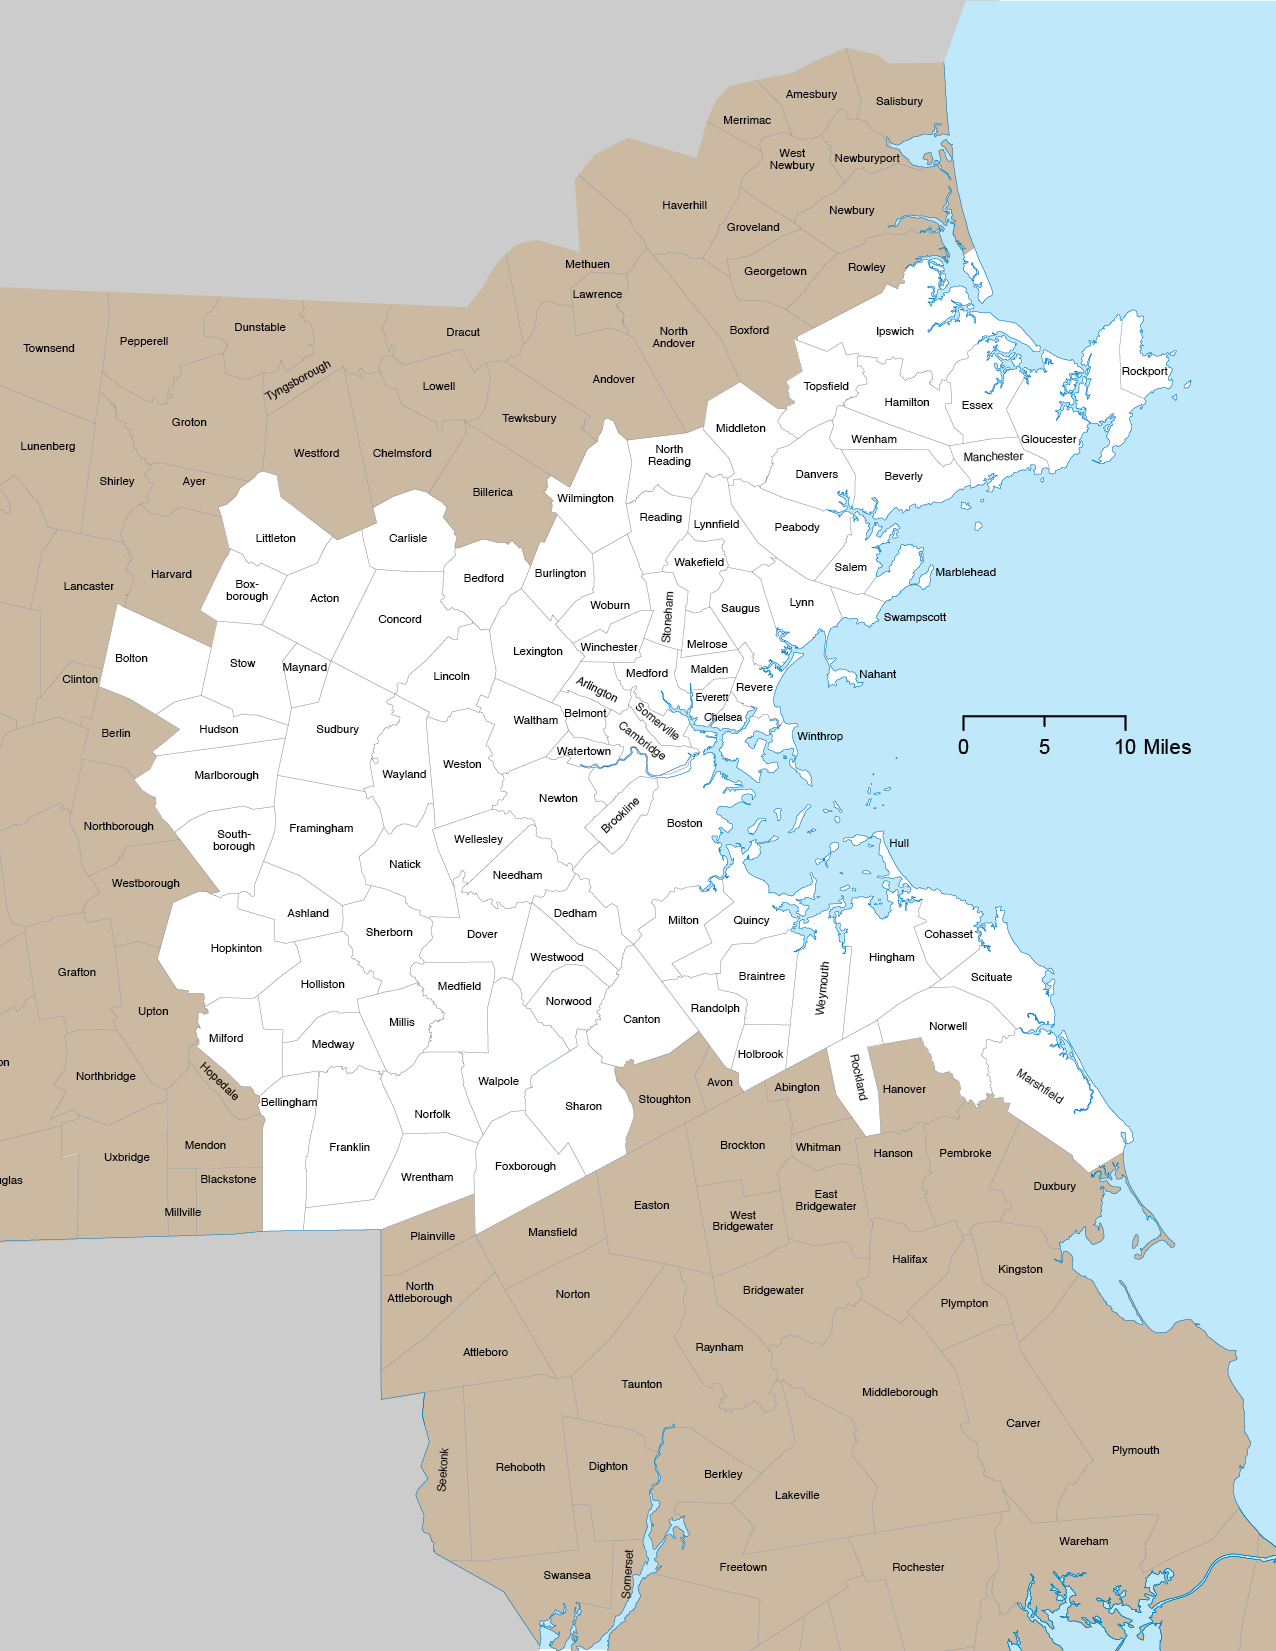
Source: Boston Region MPO.
The MPO’s board comprises of 22 voting members. Several state agencies, regional organizations, and the City of Boston are permanent voting members, while 12 municipalities are elected as voting members for three-year terms. Eight municipal members represent each of the eight subregions of the Boston region, and there are four at-large municipal seats. The Federal Highway Administration (FHWA) and Federal Transit Administration (FTA) participate on the MPO board as advisory (nonvoting) members. Figure 1-2 shows MPO membership and the organization of the Central Transportation Planning Staff (CTPS), which serves as staff to the MPO.
Figure 1-2
Boston Region Metropolitan Planning Organization Member Structure
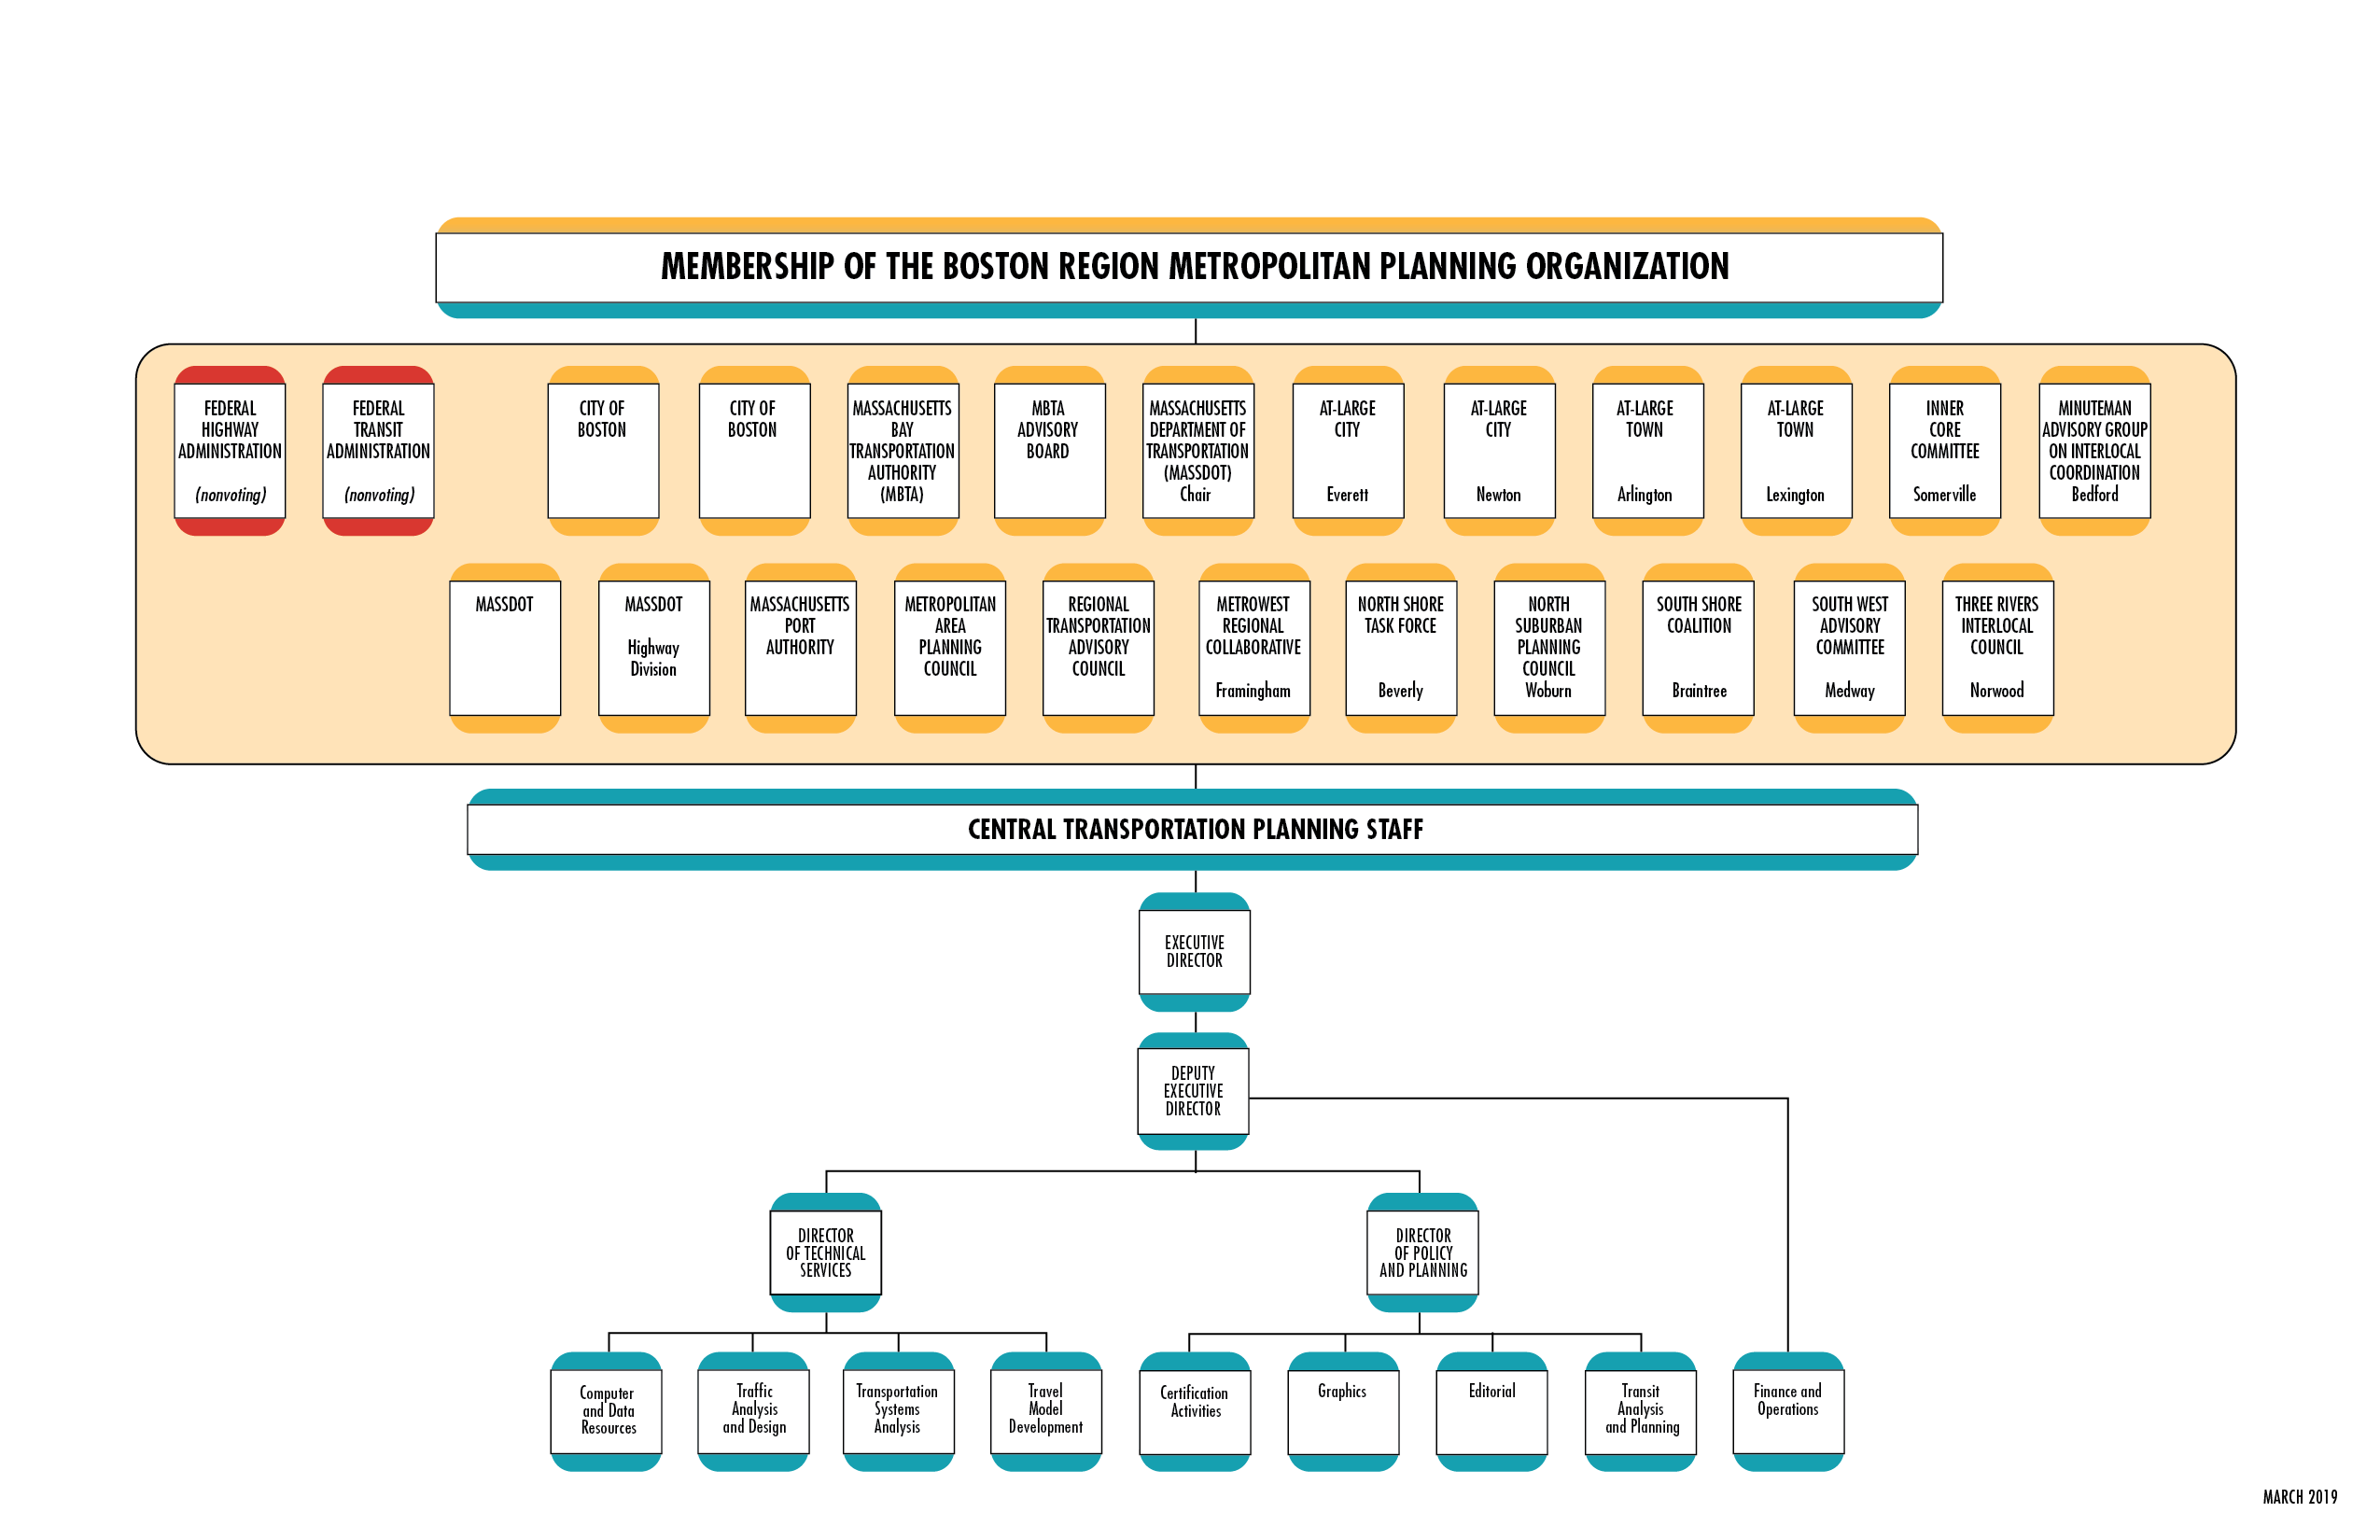
Source: Boston Region MPO.
As part of the 3C process, the Boston Region MPO regularly produces several planning and programming documents that describe MPO priorities and investments. These are collectively referred to as certification documents and are required for the MPO’s process to be certified as meeting federal requirements and, subsequently, to receive federal transportation funds. The three documents that comprise the certification documents are the LRTP, the Transportation Improvement Program (TIP), and the Unified Planning Work Program (UPWP). In addition to producing these documents, the MPO must also establish and conduct an inclusive public participation process; comply with all federal Title VI, environmental justice, and nondiscrimination requirements; and maintain transportation models and data resources to support air quality conformity determination and long- and short-range planning work and initiatives.
The following is a summary of each of the certification documents.
Several agencies are involved in planning and programming highway and public transit projects in the Boston region. The MPO regularly coordinates with these agencies, including MassDOT, the MBTA, and the region’s regional transit authorities (RTAs). Coordination ensures that agencies’ strategic visions complementary and comprehensively cover the various transportation needs in the region. In particular, MassDOT’s Capital Investment Plan (CIP), which includes MBTA capital projects as well as RTA investments, prioritizes funding according to MassDOT’s strategic goals. In addition, MBTA’s long-term investment plan, Focus40, describes the long-term vision and goals of the MBTA, guiding it toward a transportation system that is reliable, robust, and resilient. Destination 2040 represents the MPO’s continued collaboration with these agencies, as well as the region’s municipalities, other transit providers, and other stakeholders, to further a shared vision of a sustainable, equitable, accessible, and economically vibrant region.
This section describes how the MPO created and will implement Destination 2040. It discusses how the MPO identified transportation needs in the region through public outreach and data analysis; revisited and revised its investment programs and program sizes; established the financial resources available for funding projects and programs; selected projects for programming; developed the recommended plan; analyzed potential air quality and transportation equity impacts; collected public comments; and explained how the LRTP will monitor and implement the plan.
The process for developing Destination 2040 began with the development of the Needs Assessment. The Needs Assessment process consisted of two core components—conducting public outreach to gather input on transportation needs from people across the region, and analyzing data on transportation services and infrastructure to identify existing gaps and opportunities for improvement. In addition, MPO staff reviewed existing transportation plans and policies developed by municipalities and other transportation agencies to get a better understanding of their transportation needs. As new data became available, MPO staff updated relevant analyses as needed. The results of the Needs Assessment were used to revise the LRTP’s vision, goals, and objectives, select projects and programs to address the transportation needs in the region, and to develop future study ideas as part of the UPWP.
For the public outreach component of the Needs Assessment, conducted from fall of 2017 to summer of 2018, the MPO received more than 2,000 comments and ideas about transportation needs and opportunities for improving the transportation system. These comments were gathered through various formats, summarized below:
To identify transportation needs in the future, it is necessary to project the land use patterns, growth in employment and population, and trends in travel patterns to determine how they affect demand on the region’s transportation system. MAPC, the region’s land use planning agency, was responsible for preparing detailed population, employment, and household projections to the year 2040 to support the LRTP. MassDOT helped lead this process by creating a projections committee with members from each of the state’s MPOs, MAPC, CTPS, and other relevant government agencies. This committee oversaw the development of regional population, labor force, household, and employment projections for each MPO in the state. MAPC and the University of Massachusetts Donahue Institute were contracted as technical leads for the production of these projections.
Overall, the land use scenario created for the LRTP, Destination 2040, involves key assumptions about the future and reflects large-scale, long-term land use trends in the region due to an aging population, a restructured economy, and the investment in development projects already planned. Detailed information on this process can be found in Chapter 2 of the Needs Assessment document.
In the fall of 2018 and the winter of 2019, using the Needs Assessment results, the MPO revisited its vision statement and supporting goals and objectives to ensure that they fully addressed the region’s transportation needs. The vision statement and supporting goals and objectives were found to reflect the overarching needs identified in the Needs Assessment and from public input. The goals largely remained the same as in Charting Progress to 2040, while several of the objectives have been revised to better reflect the results of the Needs Assessment, to better align the objectives with the roles and responsibilities of the MPO, and to incorporate new planning requirements. MPO staff also received input from the public on the draft revisions to the vision, goals, and objectives in winter 2019 through an online survey.
In addition to addressing the identified needs, the MPO’s goals and objectives relate to the 10 federal planning factors that are included in the FAST Act. More information on the relationship between the MPO’s goals and objectives and the federal planning factors can be found in Appendix A of the Needs Assessment document. The MPO’s revised vision, goals, and objectives are shown in Figure 1-3.
Figure 1-3
Destination 2040 Vision, Goals, and Objectives
Source: Boston Region MPO.
Together, the vision, goals, and objectives, lay the groundwork for the MPO’s performance-based planning practices, which in turn informs all of the work conducted by the MPO, including evaluating and selecting projects for the LRTP and TIP and selecting studies for the UPWP.
The finance plan is an important part of the LRTP, which is required to be a financially constrained document—meaning that the Boston Region MPO has the finances to cover the projects and programs recommended in the plan. The financial assumptions for this LRTP include an increase in federal highway funding for the MPO compared to the previous LRTP. Charting Progress to 2040, (the MPOs 2015 LRTP), allowed for an increase in revenue of one-and-a-half percent per year. For this LRTP, the MPO assumed an increase in federal highway dollars of two-and-two-tenths percent per year, based on guidance from MassDOT, which was developed in consultation with federal agencies. Therefore, the MPO has additional resources for commitments to projects included in Destination 2040. Project cost increases, due to the application of an inflationary factor (four percent per year), also affect funding in the later time bands of the LRTP. Transit finances vary by funding source. Chapter 3 provides detailed information about finances for Destination 2040.
To initiate the project selection process, MPO staff identified possible projects and programs for funding and assembled them into the Universe of Projects and Programs. The full Universe of Projects and Programs is included in Appendix A. All active and conceptual highway and transit projects that are eligible for inclusion in the LRTP were included in the Universe of Projects. This includes all projects that cost more than $20 million and/or would add capacity to the transportation network. Specifically, the Universe of Projects includes projects that
The Universe of Programs list consists of those investment programs that were considered for inclusion in the LRTP. Investment programs include projects that do not have to be listed in the plan because they cost less than $20 million and do not add capacity to the system. These programs include those in Charting Progress to 2040 as well as proposed new and revised programs that emerged from the results of the Needs Assessment.
The MPO also received public input through a survey about its recommended priority projects and programs in the Universe of Projects and Programs lists. Based on public input and discussions with the MPO board, this LRTP includes the following investment programs:
These programs are designed to prioritize the types of transportation projects that the MPO funds through the TIP. Any project under consideration must fit into one of the programs. In this LRTP, the MPO kept the five investment programs in Charting Progress to 2040, and added one program, Transit Modernization. The Complete Streets Program was expanded to include dedicated bus lanes and climate resiliency improvements, while the Community Connections Program was expanded to include investments that connect elderly adults to transportation.
In the spring of 2019, the MPO set aside a specific amount of funding for each investment program based on the investment program decisions. The funding amounts generally correspond to the levels that the programs have been funded in the past five TIPs. Notably, the amount set aside for the Complete Streets Program was not only expanded (because the MPO is funding more of these types of projects), it was increased by an additional two percent to accommodate dedicated bus lane projects. The estimate for dedicated bus lanes was based on funding several of the highest priority bus corridors identified in a previous MPO study and cost estimates provided by the MBTA. The MPO then allocated funding for the six programs across the LRTP’s four bands (FFYs 2020–24, 2025–29, 2030–34, and 2035–40). Based on this allocation, the MPO distributed the following funding amounts to these investment programs:
Major Infrastructure (projects that add capacity to the transportation network): as much as30 percent
Complete Streets: 45 percent
Intersection Improvements: 13 percent
Bicycle Network and Pedestrian Connections: 5 percent
Community Connections: 2 percent
Transit Modernization: 5 percent
The MPO applied its goals and objectives as criteria in a qualitative evaluation of the major infrastructure and capacity-adding highway projects in the Universe of Projects. Only those projects that had been sufficiently well-defined to allow for analysis were evaluated. The assessment of how well projects would address the MPO’s goals and objectives helped the MPO identify priority projects for the Major Infrastructure Program. Appendix B provides detailed information on project evaluations and documentation of the evaluation process.
In the winter of 2019, MPO staff reached out to municipalities and MassDOT highway districts to gather information about the readiness of highway projects in the Universe of Projects list and the action being taken to advance the projects. Using this information, along with the project evaluations, MPO staff developed several possible funding alternatives that reflected the investment program funding goals. These alternatives include the following:
The MPO board reviewed and discussed the alternatives in May 2019 and voted to adopt Alternative 4 as its preferred alternative for the Destination 2040 LRTP. This will allow funding for projects that may emerge in the future and funding for projects whose costs may increase after proceeding to final design. More detail on the project selection process is included in Chapter 4.
Once the projects were selected, MPO staff conducted two analyses to assess how the projects may affect minority and low-income populations in the outer year of the LRTP (2040). These analyses include identifying potential future disparate impacts and disproportionate burdens (DI/DB) that may result from the program of projects, and mapping the program of projects overlaid on areas with high shares of minority and/or low-income populations.1-2 These analyses are required by the Title VI and environmental justice guidance promulgated by the FTA and/or the FHWA. The results of the analysis and the methodology can be found in Chapter 6. The draft DI/DB Policy used to complete the DI/DB analysis can be found in Appendix C.
Additional analyses were also conducted to assess the air quality and greenhouse gas impacts of the projects selected for the LRTP. The first analysis ensures that the LRTP is consistent with the Commonwealth’s plans for attaining and maintaining air quality standards. The second analysis reports the results of the carbon dioxide emissions associated with the projects and programs being included in the LRTP, as required by the Massachusetts Global Warming Solutions Act. The results of the analysis and the methodology can be found in Chapter 7.
The public was consulted throughout the entire development of the LRTP. The Needs Assessment, the revised vision, goals, and objectives, the investment programs, and the recommended plan reflect public input during each stage of LRTP development. The LRTP’s public comment period in July and August 2019 provides the public a final opportunity to review and comment on the recommended plan and the entire LRTP development process before Destination 2040 is finalized. To facilitate this, MPO staff visited several transportation events in the region to encourage public comment. The public was notified of the availability of the draft LRTP on the MPO’s website, sent out via email, posted on Twitter, and posted on the MPO's blog. More details on the public input process can be found in Appendix D.
In recent years, the MPO has been incorporating performance-based planning and programming (PBPP) practices into its LRTP development and other processes. These practices are designed to help direct MPO funds towards achieving specific outcomes for the transportation system. The MPO’s goals and investment programs are key components of its PBPP framework. In FFY 2018, the MPO began to set targets for specific performance measures. Over time, the MPO will closely link its performance targets, investment decisions, and monitoring and evaluation activities. More details on the PBPP process can be found in Chapter 5.
As the guiding document for the MPO’s investment priorities, each LRTP is subsequently implemented through the TIP and the UPWP. Specifically, the needs identified in the Needs Assessment and the goals and objectives established in the LRTP are used to guide the programming of studies and projects in each year’s TIP and UPWP. The transportation needs identified in the Needs Assessment often serve as the catalyst for developing studies programmed in the UPWP. Additionally, the projects programmed in the investment programsare defined each year in the TIP. The objectives described in the LRTP will also be used to develop new evaluation criteria for TIP projects starting with the FFY 2021–25 TIP. More details on the process of implementing the LRTP can be found in Chapter 8.
The remaining chapters of Destination 2040 are organized as follows:
Chapter 2—Transportation Needs in the Region: Includes a summary of the regional transportation needs identified in the Needs Assessment
Chapter 3—Funding the Transportation Network: Describes the transportation funding to be spent in the MPO region over the life of the LRTP; explains LRTP fiscal constraint requirements; and identifies the amount of transportation funding over which the MPO has decision-making power
Chapter 4—The Recommended Plan: Describes the projects and programs in the LRTP and the process for their selection
Chapter 5—System Performance Report: Discusses federal requirements for performance measurement, the MPO’s development and implementation of a PBPP process, the MPO's performance targets, and the region’s current performance with respect to federally required performance measures
Chapter 6—Transportation Equity Performance Report: Includes a description of the MPO’s approach to identifying transportation equity populations and their role in Title VI analysis, and presents the Title VI and environmental justice analyses required for the LRTP
Chapter 7—Air Quality Conformity Determination and Greenhouse Gas Analysis: Includes the air quality conformity determination showing that the LRTP is consistent with the Commonwealth’s plans for attaining and maintaining air quality standards; and reports on the carbon dioxide emission reductions from projects and programs in the LRTP in accordance with the Massachusetts Global Warming Solutions Act
Chapter 8—Next Steps: Implementation of Destination 2040: Describes the activities the MPO will undertake to implement the LRTP, including through its TIP and UPWP
Appendices: Provide more detail on specific components of the LRTP development process, and includes:
A critical early step in developing the Long-Range Transportation Plan (LRTP) was to gather, organize, and analyze available sources of data about the regional transportation system and its present and future needs. This process resulted in the Needs Assessment, which consists of two main parts:
Boston Region Metropolitan Planning Organization (MPO) staff used the Needs Assessment application to analyze various components of the transportation system and their capacity, condition, and current and projected use.
The Needs Assessment analysis guided the MPO when deciding how to address the region’s transportation needs through this LRTP, and it also will guide future decision making about projects to fund in the MPO’s Transportation Improvement Program (TIP) and studies to conduct through the Unified Planning Work Program (UPWP). The Needs Assessment also includes baseline information for the MPO’s performance-based planning and programming (PBPP) process, which tracks progress over time to determine whether planned changes to the transportation system are helping to achieve the MPO’s goals and objectives.
This chapter presents a summary of the region’s needs (described in full in the associated Needs Assessment document). Both the Needs Assessment document and the interactive Needs Assessment application may be accessed through the MPO’s website at https://www.bostonmpo.org/maploc/www/apps/lrtpNeedsAssessmentApp/index.html.
Information in this chapter and the online Needs Assessment document is organized according to the goals outlined in this LRTP, which the MPO staff used to evaluate projects and programs considered for programming in this LRTP. The goals are focused on the following topics:
The online Needs Assessment document includes the following chapters, which contain details about the needs, as well as the conditions that create the needs.
The Needs Assessment incorporates information from previous and ongoing transportation planning work, including the Charting Progress 2040 LRTP (the MPO’s previous LRTP updated in 2016), PBPP work being conducted by the MPO, the MPO’s Congestion Management Process, transportation equity and public outreach, MPO studies, the Massachusetts Bay Transportation Authority’s (MBTA) Focus40 plan, and relevant studies conducted by other transportation agencies.
Travel demand modeling is a key part of the LRTP and Needs Assessment analyses. The Destination 2040 LRTP uses a base year of 2016 and a future year of 2040 to model the transportation network and socioeconomic trends. Inputs into the travel demand model included existing and projected socioeconomic information (population, housing, and employment data) and the existing and proposed transportation network. These existing and projected data were important factors in determining regional transportation needs.
For each of the MPO’s six goal areas, the sections below provide the issue statement, the summary of needs, and the recommendations to address those needs for the next 20 years. A description of the types of recommendations presented in the tables includes the following:
Detailed information may be found in Chapters 4 through 9 of the full Needs Assessment report, which includes the following:
People who travel by car, truck, bus, rail, bicycle, or on foot in the Boston region seek to travel safely, but often these modes compete for space and priority on the roadways. While roadway crashes overall have declined over time, recent increases in bicycle and pedestrian crashes and in serious injuries to pedestrians attest to the challenge of ensuring safety for all modes. Changes to travel patterns, caused in part by increased use of transportation network company (TNC) services (for example, Uber and Lyft) and deliveries from online retail businesses, add to the many factors that affect safety on the region’s transportation system. Meanwhile, advancements in connected and autonomous vehicle (CAV) technology have the potential to generate safety benefits, but this technology may also change travel patterns and influence traveler behavior in ways that introduce new concerns.
Reducing the number of transportation-related crashes, safety incidents, injuries, and fatalities as well as related property damage, pain, and suffering, is the Boston Region MPO’s highest priority. This focus is in line with federal and Commonwealth of Massachusetts goals and Vision Zero policies that are being implemented by municipalities in the region. (More information is available in Chapter 5–System Performance Report.) Potential projects that improve transportation safety in the region will need to account for all modes and employ a variety of strategies. Effective solutions will also require collaboration between the MPO, the Massachusetts Department of Transportation (MassDOT), other Commonwealth executive agencies, the region’s transit providers, municipalities, and other stakeholders.
Over the last several decades, the MPO has built a practice of analyzing roadway crash trends and crash locations. The MPO helps address key safety issues by recommending roadway design solutions for specific locations; creating tools and guidance to help municipalities address local safety issues; and investing in capital projects through the LRTP and TIP to improve safety.
Going forward, the MPO must continue to enhance practices of analyzing data, collecting public feedback, and applying staff expertise to recommend safety solutions. The MPO must also continue to apply and improve LRTP and TIP evaluation and development processes that help identify and support projects likely to have safety benefits. The MPO should also continue to monitor the potential impacts that CAV technology will have on roadway user behavior and safety.
There are also areas where the MPO can expand activities to address transportation safety. The MPO will need to consider transit safety issues, data requirements, and needs when coordinating with the region’s transit providers to set targets for federally required transit safety performance measures. (More information is available in Chapter 5–System Performance Report.) The MPO should analyze transit safety trends on an ongoing basis, consider the potential safety benefits of projects for the MBTA, Cape Ann Transportation Authority (CATA), MetroWest Regional Transit Authority (MWRTA), and MassDOT that are programmed in the TIP, and explore opportunities to support transit agencies’ safety initiatives and investments. The MPO should also continue to collaborate with safety practitioners, transportation agency representatives, municipalities, and others to identify both infrastructure and non-infrastructure approaches (such as education and awareness campaigns) to reduce fatalities, injuries, incidents, and other safety outcomes across all transportation modes and systems.
Table 2-1 summarizes key findings about safety needs that MPO staff identified through data analysis and public input. It also includes staff recommendations for addressing each need.
Table 2-1
Safety Needs in the Boston Region Identified through Data Analysis and Public Outreach and Recommendations to Address Needs
| Emphasis Area |
Issue |
Needs |
Recommendations to Address Needs |
|---|---|---|---|
Fatalities and serious injuries from roadway crashes |
Average number of fatalities and serious injuries from roadway crashes have declined over the past five years. However, a multi-strategy approach will be needed to eliminate roadway crash fatalities and injuries in the Boston region. |
Identify crash factors and countermeasures. Consider capital investment, education, enforcement, and other approaches to improve roadway safety. |
Existing Initiatives Coordinate with partner agencies to collect data that supports safety research and analysis Participate in road safety audits for roadway improvement projects Continue to collect and analyze safety data and monitor performance measures Existing Study Conduct TIP before-after studies to evaluate safety impacts of funded projects Proposed Study Study factors that may contribute to fatal and serious injury crashes on the region’s roadways Proposed Initiatives Publicize transportation safety-oriented education and awareness material through the MPO’s communication and public involvement channels Coordinate with other agencies and stakeholders on their approaches for addressing education, enforcement, and other factors that influence safety |
High crash locations |
The number of all crashes should be reduced. Crash cluster locations with high EPDO values indicate locations with high crash frequencies and/or where crashes are severe. |
Address the region’s top-ranking crash cluster locations. Address MassDOT-identified Top 200 high crash intersections in the Boston region (66 total), such as those on Route 9 in Framingham, Route 107 in Lynn and Salem, and Route 16 in Chelsea, Everett, and Medford. |
Existing Programs Intersection Improvements Complete Streets Major Infrastructure investment program Existing Studies Recommend solutions for specific locations through the Community Transportation Technical Assistance, Addressing LRTP Priority Corridors, Addressing Subregional Priority Roadways, and Low-Cost Solutions for Express Highway Bottlenecks studies Recommend solutions for specific locations through Safety and Operations at Selected Intersections studies New Initiative Publicize transportation safety-oriented education and awareness material through the MPO’s communication and public involvement channels |
Pedestrians |
In the Boston region, the number of pedestrian-involved crashes is increasing. Pedestrians were involved in a disproportionate share of roadway crashes resulting in fatalities (29 percent) and serious injuries (13 percent), based on 2012–16 rolling annual averages. Pedestrian safety was a top concern mentioned during the MPO’s outreach events. |
Address top-ranking pedestrian crash cluster locations, including those in downtown areas in Chelsea, Lynn, Quincy, Boston, and Framingham. Provide well-maintained, connected sidewalk networks. Improve pedestrian connections at intersections. Develop separated shared-use paths. |
Existing Program Intersection Improvements Complete Streets Bicycle and Pedestrian programs Existing Studies Recommend solutions for specific locations through Community Transportation Technical Assistance, Addressing LRTP Priority Corridors, Addressing Subregional Priority Roadways studies Use the MPO’s Pedestrian Report Card Assessment tool to analyze pedestrian safety and walkability Recommend solutions for locations with high pedestrian crash rates or pedestrian fatalities or injuries Proposed Study Recommend safety solutions for people traveling to transit stops or stations |
Bicyclists |
In the Boston region, bicyclists account for a disproportionate share of roadway crash fatalities (four percent) and serious injuries (five percent) based on a 2012–16 rolling annual average. Bicycle safety was a top concern mentioned during the MPO’s public outreach events. |
Address top-ranking bicycle crash cluster locations, including those in Boston, Cambridge, and Somerville. Develop separated shared-use paths and protected bike lanes. Develop a connected bicycle network. |
Existing Programs Intersection Improvements Complete Streets Bicycle and Pedestrian program Existing Studies Recommend solutions for specific locations through Community Transportation Technical Assistance, Addressing LRTP Priority Corridors, Addressing Subregional Priority Roadways studies Use the MPO’s Bicycle Report Card Assessment tool to analyze bicycle safety Recommend solutions for locations with high bicycle crash rates or bicycle fatalities or injuries |
Trucks |
Truck-involved crashes account for approximately six percent of total motor vehicle crashes in the Boston region; however truck and large vehicle crashes account for 12 percent of roadway fatalities according to a 2011–15 rolling annual average. |
Address top truck crash cluster locations. Modernize obsolete interchanges, such as the I-90 and I-95 interchange in Weston and the I-95 and Middlesex Turnpike interchange in Burlington. |
Existing Program Intersection Improvements Complete Streets Major Infrastructure investment program Proposed Program Fund projects to improve truck safety through an MPO Interchange Modernization investment programs Existing Study Recommend solutions for specific locations through Low-Cost Solutions for Express Highway Bottleneck studies |
Multimodal roadway usage |
Cars, trucks, buses, bicyclists, pedestrians, and others compete for space and travel priority in constrained roadway environments. Delivery vehicles transporting online purchases and TNC vehicles picking up or dropping off passengers also compete for curb space and create conflicts. Both of these factors can create unsafe conditions for travelers. |
Incorporate Complete Streets design and traffic calming principles in roadway projects. Identify strategies to manage roadway user priority, parking, and curb space. |
Proposed Initiative Consider curbside land use and demand and suggest management and improvement strategies when conducting MPO traffic engineering and freight studies |
Transit safety |
The MBTA reported recent increases in fatalities on its system, particularly on the commuter rail. The MBTA and the RTAs in the Boston region must continue to monitor and reduce bus collisions, derailments, and other accidents that may contribute to negative safety outcomes. |
Collect and analyze safety data, establish transit safety performance measures, set targets, and monitor the measures. Identify and invest in priority state-of-good-repair and modernization projects (e.g. positive train control and rapid transit vehicle upgrades). Coordinate with transit providers and partner agencies on safety education and awareness initiatives. |
Proposed Program Transit Modernization investment program
|
Connected and Autonomous Vehicles |
CAV technology is advancing. While CAV applications may reduce instances of human driver error, limiting factors such as inclement weather and device inoperability, may reduce their safety effectiveness. Riskier driver, pedestrian, and other roadway user behavior may offset safety benefits. |
Monitor advancements in CAV technology. Monitor and analyze safety impacts of CAV deployments, particularly in the Boston region. |
Proposed Study Research safety outcomes of autonomous vehicle testing in Boston or other metropolitan areas |
CAV = Connected and Autonomous Vehicles. EPDO = Equivalent Property Damage Only. FFY = federal fiscal year. LRTP = Long-Range Transportation Plan. MassDOT = Massachusetts Department of Transportation. MBTA = Massachusetts Bay Transportation Authority. MPO = Metropolitan Planning Organization. RTA = regional transit authority. TNC = transportation network company.
Source: Boston Region MPO.
The Boston region’s transportation infrastructure is aging and the demands on roadway and transit facilities have stressed the infrastructure to the point that routine maintenance is insufficient to keep up with necessary repairs. As a result, there is a significant backlog of projects required to maintain the transportation system and assets in a state of good repair, including projects that address bridges, roadway pavement, transit rolling stock and infrastructure, and traffic and transit control equipment. In addition, parts of the transportation system may be compromised if climate change trends continue as projected.
The transportation system must be brought into a state of good repair, maintained at that level, and enhanced to ensure mobility, efficient movement of goods, and protection from potential sea level rise and storm-induced flooding. Financial constraints require the Boston Region MPO, MassDOT, and the region’s transit agencies to set priorities, considering the most crucial maintenance needs and the most effective ways to program their funding. At the same time, infrastructure that could be affected by climate change must be made more resilient.
The MPO’s understanding of system preservation and modernization needs are informed by various planning processes conducted by transportation agencies in the region. MassDOT has developed a Transportation Asset Management Plan (TAMP), a risk-based asset management plan for bridge and pavement assets on the National Highway System (NHS) in Massachusetts, which will help MassDOT plan to improve NHS asset condition and performance. Similarly, the transit agencies in the Boston region—the MBTA, MWRTA, and CATA—have produced Transit Asset Management (TAM) plans, which will help them prioritize investments to maintain state of good repair in transit vehicles, facilities, and other infrastructure. These agencies, along with the MPO, monitor changes in asset condition over time using federal established performance measures for NHS bridges, pavement, and transit assets.
The MBTA’s Strategic Plan and 25-year investment plan,Focus40, complement the asset management plans by specifying state of good repair and modernization programs and projects, both for individual MBTA services and the system as a whole. Likewise, MassDOT’s annual Capital Investment Plan development process places top priority on investments that support transportation state of good repair and reliability. In addition, the report recently released by the Commission on the Future of Transportation in the Commonwealth,Choices for Stewardship: Recommendations to Meet the Transportation Future, includes recommendations to modernize existing state and municipal transit and transportation assets to more effectively and sustainably move more people throughout the Commonwealth and make transportation infrastructure resilient to a changing climate. MassDOT and the MBTA track performance over time both through annual reporting conducted by the Commonwealth’s Performance and Asset Management Advisory Council and through MassDOT’s Tracker.
To address identified needs, the MPO can invest its Regional Target dollars to and coordinate with its partners to support transportation infrastructure preservation and modernization. The MPO can use information from the aforementioned planning processes to consider and provide feedback on projects and programs that agencies bring forward for inclusion in the LRTP and TIP. The MPO may also choose to support some of these or other system preservation investments directly with its Regional Target funds. When spending its Regional Target funds, the MPO uses current system preservation-related TIP evaluation criteria to determine whether a project improves substandard pavement, bridges, sidewalks, signals or transit assets, or otherwise improves emergency response or the transportation system’s ability to respond to extreme conditions. The MPO may be able to use information from MassDOT and transit agency planning processes to supplement its existing project evaluation process.
Table 2-2 summarizes key findings regarding system preservation and modernization needs that MPO staff identified through data analysis and public input. It also includes staff recommendations for addressing each need.
Table 2-2
System Preservation and Modernization Needs in the Boston Region Identified through Data Analysis and Public Outreach and Recommendations to Address Needs
| Emphasis Area |
Issue |
Needs |
Recommendations to Address Needs |
|---|---|---|---|
Bridges |
Bridge condition: Currently, of the 2,811 bridges in the region 151 (five percent) are structurally deficient. Approximately 12 percent of the National Highway System (NHS) bridges in the Boston region are considered to be in poor condition. |
Meet MassDOT’s performance measure to prevent the number of structurally deficient bridges from exceeding 300 statewide.
Maximize the number of bridges in the region considered to be in good condition, and minimize the number of bridges considered to be on poor condition. |
Existing Programs Complete Streets Program Major Infrastructure Program Proposed Program Interchange Modernization Program
|
Bridges |
Bridge Health Index scores: Currently, as measured on this index, 33 percent of bridges in the region are in good condition, 35 percent are in poor condition, and 32 percent have not been rated because of missing data. |
Meet MassDOT’s performance measure to maintain a systemwide Bridge Health Index score of 92 (measured on a scale of zero to 100) in calendar year 2020 and a score of 95 in the long term. |
Existing Programs Complete Streets Program Major Infrastructure Program Proposed Program Interchange Modernization Program
|
Pavement Management |
Condition of MassDOT-maintained roadways: Of the roadways in the region maintained by MassDOT, 69 percent are in good condition, 25 percent are in fair condition, and six percent are in poor condition. This accounts for interstates and mix of NHS and non-NHS roadways. |
Monitor the MassDOT Pavement Management program (interstates and mix of NHS and non-NHS roadways). MassDOT-maintained arterial roadways make up 55 percent of monitored roadways, however 86 percent of the arterial roadways are in poor condition; lengthy arterials in poor condition are located in Arlington, Boston, Brookline, Cambridge, Chelsea, Lynn, Malden, Medford, Newton, and Salem. |
Existing Programs Intersection Improvement Program Complete Streets Program Major Infrastructure Program Proposed Program Interchange Modernization Program
|
Pedestrian Facilities |
Sidewalk location and condition: Of the sidewalks in the state, 81 percent are municipally owned. Neither the MPO nor MassDOT maintain pedestrian facility data. Knowing where sidewalks are located or absent, and their condition, is a key element in planning. |
Identify the location of sidewalks and their condition; identify those around transit stations. |
Existing Programs Bicycle Network and Pedestrian Connections Program Study issues through the Bicycle and Pedestrian Support Activities program (UPWP) Existing Studies Addressing Priority Corridors from the LRTP Needs Assessment (FFY 2019 UPWP) Addressing Safety, Mobility, and Access on Subregional Priority Roadways (FFY 2019 UPWP) Proposed Study Regionwide Sidewalk Inventory |
Transit Asset State of Good Repair |
State of good repair for the transit system: The region’s transit systems include vehicles, facilities, and fixed guideway that do not meet state of good repair thresholds defined by the federal government. Other transit assets, such as track signals and power systems, need maintenance and upgrades to support safe, reliable service. |
Identify and invest in priority transit state of good repair projects, as identified in Focus 40, TAM plans, and other prioritization processes. |
Proposed Program Transit Modernization Program
|
Transit Asset Modernization |
Obsolete infrastructure: Even if in a state of good repair, obsolete infrastructure inhibits transit systems’ abilities to adapt to change and serve customers. Examples of necessary upgrades include increasing the resiliency of transit system power supplies, incorporating modern doors and platforms into subway services, and making transit stations—such as Oak Grove Station and Natick Center Commuter Rail Station—fully accessible to people with disabilities. |
Support investments that improve the accessibility of transit stations, bus stops, and paratransit services, such as those identified through the MBTA’s Plan for Accessible Transit Infrastructure process. Support investments that upgrade transit fleets, facilities, and systems to provide more efficient, reliable, and sustainable service. Support climate vulnerability assessments and invest in projects and programs resulting from these processes. |
Existing Programs Bicycle Network and Pedestrian Connections Program Study issues through the Bicycle and Pedestrian Support Activities program (UPWP) Support MassDOT’s Climate Adaption Vulnerability Assessment and invest in recommended projects Proposed Program Transit Modernization Program Existing Study Research climate change resiliency options for transportation infrastructure |
Freight Network |
Many express highways are built to outdated design standards for trucks. Roads connecting to major freight facilities and routes need to support trucks as well as other types of vehicles. |
Maintain and modernize the roadway network. Improve connections between intermodal facilities and the regional road network. Maintain truck access on roadways designed to Complete Streets standards. |
Existing Programs Intersection Improvement Program Complete Streets Program Major Infrastructure Program Research strategies to improve bottleneck locations through the Bottleneck Program Proposed Program Interchange Modernization Program |
Climate Change Adaptation |
Some transportation facilities and infrastructure, including tunnels, are located in places vulnerable to flooding and other hazards. |
Retrofit or adapt infrastructure, including the Central Artery, to protect it from the impacts of hazards and climate change. |
Existing Programs Intersection Improvement Program Complete Streets Program Major Infrastructure Program Support to MassDOT’s Climate Adaption Vulnerability Assessment Proposed Program Interchange Modernization Program
Proposed Study Research climate change resiliency options for transportation infrastructure
Other Actions Coordinate with municipalities and state and regional agencies on ways that the MPO can support resiliency planning Emphasize TIP resiliency and adaptation criteria |
LRTP= Long-Range Transportation Plan. MassDOT= Massachusetts Department of Transportation. MBTA= Massachusetts Bay Transportation Authority. TAM = Transit Asset Management. UPWP = Unified Planning Work Program.
Source: Boston Region MPO.
The transportation system in the Boston region is, to a certain extent, increasingly stressed by the overall growth and success of the region’s economy. Congestion on the region’s roadways is reducing vehicular speeds, while the transit system is strained by high ridership and an aging infrastructure. Usage of the transportation network, both the roadway and transit systems, is projected to continue to increase more during the time period covered by the MPO’s LRTP, Destination 2040. In pursuit of the MPO’s core goals, the MPO and other stakeholders must find a way to manage the network’s capacity with limited capital funding to maximize mobility for all residents and users of the transportation network, including bicyclists and pedestrians.
One of the major challenges facing the MPO and other policymaking stakeholders and agencies is the preservation and enhancement of mobility options when economic growth and trip-making are concentrated in a limited geographic area. Economic growth in the Boston region outpaces that in the rest of the state, and growth in the Inner Core subregion is projected to continue at a faster rate than in the rest of the Boston region. The increase in the number of trips made in the Boston region is increasing congestion on a network that is either at capacity or nearing it. In an area where adding roadway capacity for vehicles is challenging, the MPO and other policymaking entities have the opportunity to work with municipalities to reallocate road space to accommodate all modes of travel. This finding has also been identified in the recently released MassDOT report, Congestion in the Commonwealth, Report to the Governor, 2019.
The regional transit system has also been stressed over the past several years, and continues to struggle by some measures. The MBTA has plans and capital projects underway to modernize and increase capacity on much of the rapid transit system. The MBTA recently conducted the Better Bus Project, which proposed changes to bus service based on research and partnerships with municipalities. This project and potential MPO and municipal projects and programs provide an opportunity to improve the reliability, capacity, and quality of the bus network with a relatively low capital expenditure. The MBTA has also launched the Rail Vision study to examine the future of the commuter rail network, a topic which MPO staff heard discussed many times during public outreach events.
Table 2-3 summarizes key findings regarding capacity management and mobility needs that MPO staff identified through data analysis and public input. It also includes staff recommendations for addressing each need.
Table 2-3
Capacity Management and Mobility Needs in the Boston Region Identified through Data Analysis and Public Outreach and Recommendations to Address Needs
| Emphasis Area |
Issue |
Needs |
Recommendations to Address Needs |
|---|---|---|---|
Roadway |
Congestion and slower speeds |
Address congestion on expressways, interchanges, and arterials. |
Existing Programs Major Infrastructure Program Bottleneck Program Freight Program Existing Studies Addressing Priority Corridors from the LRTP Needs Assessment Addressing Safety, Mobility, and Access on Subregional Priority Roadways Low-Cost Improvements to Express Highway Bottlenecks Safety and Operations at Selected Intersections Proposed Study Congestion Pricing Research |
Roadway |
Bottlenecks |
Reduce congestion at bottleneck locations on the regional roadway network. |
Existing Programs Major Infrastructure Program Bottleneck Program Existing Study Low-Cost Improvements to Express Highway Bottlenecks Proposed Study Congestion Pricing Research |
Roadway |
Connected and autonomous vehicles |
Continue to monitor this technology because the schedule for its adoption and implementation, and its implications remain highly uncertain. |
Existing Study Tracking of Emerging Connected and Autonomous Vehicle Technologies |
Roadway |
Ride-hailing and TNCs |
Continue to monitor growth in TNC usage to determine if TNCs are diverting ridership and funds away from public transit, and contributing to congestion. The future of this mode is uncertain. |
Existing Program Community Connections Program Proposed Program Connect Elderly Adults with Transportation Options Existing Studies Transportation Access Studies of Commercial Business Districts New and Emerging Metrics for Roadway Usage The Future of the Curb Proposed Studies Congestion Pricing Research Transit Revenue Analyses Research on TNCs Monitor TNC Adoption |
Roadway |
Car sharing |
Continue to monitor car sharing; it is poorly integrated with other modes and not accessible in all areas. The future of this mode is uncertain. |
Existing Program Community Connections Program Proposed Program Coordinating Car Sharing and Transit |
Roadway |
Transportation demand management (TDM) |
Continue to monitor TDM services. There is no region-wide strategy for TDM and relatively few municipalities in the Boston region have TDM ordinances. |
Existing Program Community Connections Program Proposed Study Congestion Pricing Research |
Freight |
Congestion |
Reduce congestion on regional roadways to facilitate the movement of freight. |
Existing Programs Freight Program Major Infrastructure Program Bottleneck Program Proposed Program Freight Database Existing Studies Addressing Priority Corridors from the LRTP Needs Assessment Addressing Safety, Mobility, and Access on Subregional Priority Roadways Low-Cost Improvements to Express Highway Bottlenecks New and Emerging Metrics for Roadway Usage Updates to Express Highway Volumes Charts Proposed Study Congestion Pricing Research |
Freight |
Contested curb and arterial road usage |
Reduce conflicts between automobiles and delivery trucks that are competing for curb space. |
Existing Studies Transportation Access Studies of Commercial Business Districts The Future of the Curb |
Freight |
Lack of data |
Develop reliable data sets on various freight topics. |
Existing Program Freight Program Proposed Program Freight Database |
Transit |
Access to transit |
Improve access to transit service that runs frequently, and increase capacity at park-and-ride lots that are at or approaching capacity. |
Existing Programs Park-and-Ride and Bicycle Parking Programs Regional Transit Service Planning Technical Assistance Community Connections Program Proposed Programs Dedicated Bus Lane Program Enhanced Park-and-Ride Program Infrastructure Bank or Demonstration Materials Library Coordinating Car Sharing and Transit Existing Studies Transportation Access Studies of Commercial Business Districts Reverse Commute Areas Analysis The Future of the Curb Proposed Study The role of dispatching and supervision in bus reliability and its application in the MBTA network |
Transit |
Bus speed and reliability |
Improve the reliability of bus service. Bus speeds are projected to decline even further due to increasing congestion; the introduction of more dedicated bus lanes could be a potential solution. |
Existing Program Regional Transit Service Planning Technical Assistance Proposed Program Dedicated Bus Lane Program Existing Study The Future of the Curb Proposed Studies The role of dispatching and supervision in bus reliability and its application in the MBTA network Assist the MBTA in locating new or improved bus garage locations Congestion Pricing Research |
Transit |
Rapid transit reliability |
Address increased delays resulting from the system’s aging rapid transit infrastructure. |
Proposed Studies Analyze peak capacity of the MBTA rapid transit system State and MPO Performance-based Planning Program |
Transit |
Crowding |
Address crowding on rapid transit lines and bus routes. According to a 2040 no-build scenario, crowding is projected to increase to unacceptable levels (as defined in the MBTA's Service Delivery Policy) in some locations. |
Proposed Programs Dedicated Bus Lane Program Existing Study The Future of the Curb Proposed Studies The role of dispatching and supervision in bus reliability and its application in the MBTA network Analyze peak capacity of the MBTA rapid transit system |
Transit |
Bus maintenance facilities |
Address the need for sufficient MBTA garage space to fully modernize and/or expand the fleet. |
Proposed Study Assist the MBTA in locating new or improved bus garage locations |
Transit |
Commuter rail schedules |
Examine off-peak and reverse commute options. The commuter rail mostly serves commuter travel during the peak periods between the suburbs and the Boston Central Business District. |
Existing Study Reverse Commute Areas Analysis |
Transit |
Commuter rail reliability |
Address aging equipment and infrastructure challenges facing the commuter rail fleet. The reliability of the commuter rail system is not as good as it could be. |
Existing Programs/Initiatives Explore opportunities to address commuter rail vehicle needs through the MPO’s Transit Modernization program
|
Transit |
First-mile and last-mile connections |
Identify challenges to making first-mile and last-mile connections, which are major barriers to transit usage. |
Existing Programs Park-and-Ride and Bicycle Parking Programs Regional Transit Service Planning Technical Assistance Community Connections Program Proposed Programs Enhanced Park-and-Ride Program Coordinating Car Sharing and Transit Existing Study Reverse Commute Areas Analysis |
Bicycle and Pedestrian |
Access to infrastructure |
Expand pedestrian and bicycle infrastructure so that residential areas and employment locations are close to good quality facilities conducive to regular usage. |
Existing Programs Bicycle and Pedestrian Program Bicycle and Pedestrian Support Activities Community Connections Program Existing Studies Pedestrian Report Card Assessment Dashboard The Future of the Curb Locations with High Bicycle and Pedestrian Crash Rates Proposed Study Region-wide Sidewalk Inventory |
Bicycle and Pedestrian |
Network construction |
Connect the disjointed elements of the bicycle network to create a cohesive network. |
Existing Programs Bicycle and Pedestrian Program Bicycle and Pedestrian Support Activities Community Connections Program Existing Study Pedestrian Report Card Assessment Dashboard |
Bicycle and Pedestrian |
Bike sharing |
Ensure that docked bike-share facilities are provided in all neighborhoods in the Inner Core, including low-income and minority areas. Monitor the future of dockless bike-share systems. |
Existing Programs Bicycle and Pedestrian Program Bicycle and Pedestrian Support Activities Community Connections Program |
Bicycle and Pedestrian |
Lack of sidewalk data |
Create a comprehensive inventory of existing sidewalk data, including sidewalk coverage and condition. |
Proposed Study Region-Wide Sidewalk Inventory |
FFY = federal fiscal year. LRTP = Long-Range Transportation Plan. MBTA = Massachusetts Bay Transportation Authority. MPO = Metropolitan Planning Organization. TDM = transportation demand management. TNC = transportation network company.
Source: Boston Region MPO.
The MPO acknowledges that greenhouse gas emissions (GHGs) contribute to climate change. If climate trends continue as projected, the conditions in the Boston region will include a rise in sea level coupled with storm-induced flooding and warmer temperatures that would affect the region’s infrastructure, economy, human health, and natural resources.
The Commonwealth has made significant progress toward improving air quality in the region. The Boston Region MPO is meeting the national ambient air quality standards (NAAQS) for ozone, particulate matter (PM), and carbon monoxide (CO). However, the MPO is required to continue monitoring its transportation activities to ensure that the region is continuing to meet the NAAQS, in particular, for ozone in the MPO area and CO for the City of Waltham. Continued vigilance is needed to keep emissions of these pollutants at acceptable levels. In addition, transportation infrastructure can negatively affect land use patterns and environmental resources. The MPO must continue to consult with the appropriate environmental agencies and neighboring planning partners as part of recently adopted congestion and air quality agreements (Boston UZA agreement and the Air Quality Memorandum of Understanding) regarding transportation initiatives.
Clean Air and Sustainable Communities’ needs fall into three categories: reducing greenhouse gas and other transportation related emissions; minimizing the negative environmental impacts of the transportation system; and supporting land use policies consistent with smart, healthy, and resilient growth.
The reduction of GHG emissions is a priority for the MPO, not only to help implement the Commonwealth’s Global Warming Solutions Act, but to help alleviate impacts from climate change including flooding, sea-level rise, and warmer temperatures. The MPO should continue to evaluate and monitor carbon dioxide (CO2) emissions from projects and programs funded through the LRTP and TIP. The MPO monitors CO2 because it is the most significant GHG in the atmosphere. The MPO uses information from the Massachusetts Department of Energy Resources’ Green Communities program to evaluate projects and programs for the LRTP and TIP, and MAPC works with municipalities on their Local Energy Action, Net Zero Communities 101, Energy-Use Baselines, and GHG Inventories programs. Continued updates of the MPO’s Vehicle-Miles Traveled (VMT) and Emission Browser and All-Hazards Planning Application can provide additional information to municipalities that are creating GHG baseline information and GHG inventories.
Although the Boston region is meeting the air quality standards for most air pollutants, it is important to ensure that transportation projects funded by the MPO continue to help to reduce VMT, which in turn will continue to reduce air pollution in the region. The MPO should continue to evaluate and monitor volatile organic compounds and nitrous oxides, which are precursors to ozone, PM, and CO emissions, from projects and programs funded through the LRTP and TIP. Updates to the MPO’s VMT and Emission Browser will allow municipalities to monitor their transportation-related emissions of these pollutants as well.
The MPO does not engage in environmental design, rather it relies on information from MassDOT, the MBTA, and other planning agencies when evaluating projects and programs to be funded in the LRTP and TIP. MassDOT and the MBTA take the lead on environmental reviews during project design, and MAPC provides comments on environmental documents for regionally significant projects. Other sources of information used by the MPO include Massachusetts Geographic Information System mapping, Massachusetts Department of Energy Resources’ Green Communities program, and MAPC’s stormwater management and hazard mitigation plans. The MPO should continue to coordinate with these agencies during its transportation planning activities.
Table 2-4 summarizes MPO staff-identified key findings about clean air and sustainable communities’ needs through data analysis and public input. It also includes staff recommendations for addressing each need.
Table 2-4
Clean Air and Sustainable Communities Needs in the Boston Region Identified through Data Analysis and Public Outreach and Recommendations to Address Needs
| Emphasis Area |
Issue |
Needs |
Recommendations to |
|---|---|---|---|
Greenhouse Gas |
Reduce CO2 emissions |
Reduce CO2 emissions from MPO-funded transportation projects and programs to help meet the requirements of the GWSA, particularly projects that help to reduce VMT. |
Existing Programs Intersection Improvement Program Complete Streets Program Bicycle and Pedestrian Program Major Infrastructure Program Bottleneck Program Community Connections Program Proposed Programs Enhanced Park-and-Ride Program Dedicated Bus Lane Program Interchange Modernization Program Coordinating Car Sharing and Transit Existing Studies Addressing Safety, Mobility, and Access on Subregional Priority Roadways (FFY 2019 UPWP) Low-Cost Improvements to Express Highway Bottlenecks (FFY 2019 UPWP) Reverse-Commute Areas Analyses (FFY 2019 UPWP) Pedestrian Report Card Assessment Dashboard (FFY 2019 UPWP) Safety and Operations at Selected Intersections Proposed Study Congestion Pricing Research |
Greenhouse Gas |
Reduce CO2 emissions |
Prioritize transportation projects and programs to assist municipalities in meeting or maintaining their Green Communities certification. |
Existing MPO Initiative Continue to use the MPO’s evaluation criteria to assess projects seeking funding from the MPO
|
Greenhouse Gas |
Reduce CO2 emissions |
Provide data and assistance to municipalities in developing their GHG inventories and energy reduction plans. |
Existing MPO Initiative Continue to provide CO2 emissions data as part of the MPO’s Vehicle-Miles Traveled and Emissions Data Browser
|
Air Pollution |
Reduce VOC, NOx, CO, and PM emissions |
Reduce VOC, NOx, CO, and PM emissions from MPO-funded transportation projects and programs, particularly those that help to reduce VMT, to help maintain the air quality standards in the region. |
Existing Programs Intersection Improvement Program Complete Streets Program Bicycle and Pedestrian Program Major Infrastructure Program Bottleneck Program Community Connections Program Proposed Programs Enhanced Park-and-Ride Program Dedicated Bus Lane Program Interchange Modernization Program Coordinating Car Sharing and Transit Existing Studies Addressing Safety, Mobility, and Access on Subregional Priority Roadways (FFY 2019 UPWP) Low-Cost Improvements to Express Highway Bottlenecks (FFY 2019 UPWP) Reverse-Commute Areas Analyses (FFY 2019 UPWP) Pedestrian Report Card Assessment Dashboard (FFY 2019 UPWP) Safety and Operations at Selected Intersections Proposed Study Congestion Pricing Research |
Environment |
Protect the environment—wetlands, cultural resources, open space, and wildlife |
Identify projects and programs that can meet criteria established to protect wetlands, cultural resources, open space, and wildlife. |
Existing MPO Initiative Continue to use the MPO’s evaluation criteria to assess projects seeking funding in the MPO’s LRTP and TIP
|
Environment |
Protect the environment—water quality |
Ensure that infrastructure to reduce storm water pollution is incorporated in project design. |
Existing MPO Initiative Continue to use the MPO’s evaluation criteria to assess projects seeking funding in the MPO’s LRTP and TIP |
Environment |
Protect the environment—hazard mitigation |
Ensure that infrastructure to reduce impacts from natural hazard events (flooding, winter storms, etc.) is incorporated in project design. |
Existing MPO Initiative Continue to use the MPO’s evaluation criteria to assess projects seeking funding in the MPO’s LRTP and TIP
|
CO = carbon monoxide. CO2 = carbon dioxide. GHG = greenhouse gas emission. GWSA = Global Warming Solutions Act. FFY = federal fiscal year. MPO = Metropolitan Planning Organization. NOx = nitrogen oxides. PM = particulate matter. UPWP = Unified Planning Work Program. VMT = vehicle-miles traveled. VOC = volatile organic compound.
Source: Boston Region MPO.
More than three million people live in the Boston region, representing a broad range of ages, abilities, incomes, races, ethnicities, and nationalities. Not all residents benefit equally from transportation investments, and some have been traditionally underserved by transportation and underrepresented in the planning process. The Boston Region MPO considered the transportation needs of these underserved populations, referred to as transportation equity (TE) populations, in the development of this Needs Assessment.
Given the Boston region’s demographics and the changing nature of travel patterns (induced, in part, by emerging new technologies and increasing interest in transit and nonmotorized transportation options), sustaining a transportation network that serves all residents continues to present challenges. As a regional transportation planning agency, the MPO has an important role to play in addressing these challenges. This summary identifies the current transportation needs facing TE populations and will help the MPO better allocate limited resources to address the most significant needs.
Input from public outreach and results from data analyses show that TE needs coincide with needs identified in all of the MPO’s other goal areas. These needs include access to frequent, reliable public transit; more transit service to healthcare facilities; additional first- and last-mile connections to and from rail stations; more complete bicycle and pedestrian networks; safe bicycle and pedestrian transportation routes away from congested roadways in communities with high shares of TE populations; transit service during off-peak hours and for reverse commutes; transit service between suburbs, especially to and from job centers; bicycle routes to and from employment centers; bicycle facilities, sidewalks, and street crossings that are safe for children and elderly adults; and more sidewalks that are in compliance with the Americans with Disabilities Act. Outside of the existing goal areas, there is also a need to improve coordination across agency and political boundaries as many commenters said that poorly coordinated schedules and services can lead to long trips.
Table 2-5 provides more detail about the needs of TE populations, which were identified through public outreach and data analysis. It also includes staff recommendations for addressing each need.
Table 2-5
Transportation Equity Needs in the Boston Region Identified through Data Analysis and Public Outreach and Recommendations to Address Needs
| Emphasis Area |
Issue |
Needs |
Recommendations to |
|---|---|---|---|
Capacity Management and Mobility |
Serving non-traditional commutes |
There is a lack of public transit service for reverse commutes and off-peak commutes. |
Existing Programs Community Connections Program Regional Transit Service Planning Technical Assistance Existing Studies Reverse-Commute Areas Analysis Operating a Successful Shuttle Program |
Capacity Management and Mobility |
Gaps in transit service |
Some TE populations lack transit service comparable to service available to non-TE populations. |
Existing Programs Community Connections Program Regional Transit Service Planning and Technical Assistance Proposed Programs Bus Mobility Connect Elderly Adults with Transportation Existing Study Operating a Successful Shuttle Program |
Capacity Management and Mobility |
Transit reliability |
Rapid transit and bus service is unreliable for populations whose only option is transit. |
Existing Programs Major Infrastructure Regional Transit Service Planning Technical Assistance Proposed Programs Bus Mobility Connect Elderly Adults with Transportation Transit Modernization Existing Studies Transportation Access Studies of Commercial Business Districts The Future of the Curb |
Capacity Management and Mobility |
First-mile and last-mile connections |
First-mile and last-mile connections to transit (including pedestrian, bicycle, and transit routes) are lacking, causing barriers to transit usage. |
Existing Programs Bicycle Network and Pedestrian Connections Community Connections Program Regional Transit Service Planning Technical Assistance Proposed Programs Bus Mobility Connect Elderly Adults with Transportation Existing Studies Pedestrian Report Card Assessment Dashboard The Future of the Curb Transportation Access Studies of Commercial Business Districts Proposed Studies Operating a Successful Shuttle Program Transportation Equity Areas Bicycle and Pedestrian Analysis |
Capacity Management and Mobility |
Active transportation options |
Elderly and youth populations have inadequate access to safe bicycle facilities. |
Existing Programs Bicycle and Pedestrian Connections Complete Streets Existing Studies The Future of the Curb Locations with High Bicycle and Pedestrian Crash Rates in the Boston Region MPO Area Proposed Study Transportation Equity Areas Bicycle and Pedestrian Analysis |
Capacity Management and Mobility |
Active transportation options |
Docked bike-share facilities in the Inner Core are not available to some communities with high shares of low-income or minority populations; the future of dockless bike-share systems is uncertain. |
Existing Program Community Connections Program Existing Study The Future of the Curb
|
Clean Air and Clean Communities |
Auto emissions |
More off-road active transportation routes are needed in communities with high shares of TE populations that live near congested roadways. |
Existing Program Bicycle and Pedestrian Connections Proposed Study Transportation Equity Areas Bicycle and Pedestrian Analysis |
Coordination between municipalities and regionsa |
Coordination of services between towns and transportation agencies |
Better coordination of schedules, routes, and services is needed between towns and between the MBTA and other regional transit authorities. |
Existing Program Regional Transit Service Planning Technical Assistance Existing Study Operating a Successful Shuttle Program |
Economic Vitality |
Transit service during non-peak commuting times to job-rich centers |
More transit service (late night, early morning, and reverse commute) is needed between job-rich centers—such as Longwood Medical Area, the Seaport, and suburban job centers—and underserved neighborhoods. |
Existing Programs Community Connections Program Major Infrastructure Proposed Program Bus Mobility Existing Studies Reverse-Commute Areas Analysis Transportation Access Studies of Commercial Business Districts Operating a Successful Shuttle Program |
Economic Vitality |
Lack of transit routes between suburbs |
New transit service is needed between low-income suburban residential communities and suburban job centers. |
Existing Programs Community Connections Program Major Infrastructure Regional Transit Service Planning Technical Assistance Proposed Program Bus Mobility Existing Studies Transportation Access Studies of Commercial Business Districts Operating a Successful Shuttle Program |
Economic Vitality |
Affordable housing |
Transportation needs of TE populations could be met by building transit-oriented developments that provide affordable housing near transit hubs and employment centers, particularly in the inner core and suburbs. |
Existing Program Transportation Equity Program—this can be coordinated with MAPC’s work on land use issues, including housing and transportation Existing Study Transportation Access Studies of Commercial Business Districts |
Economic Vitality |
Lack of safe bicycle routes to key destinations |
The region needs good-quality bicycle infrastructure that connects homes and final destinations, such as jobs and other amenity-rich locations, especially in and between communities with high shares of low-income or transit-dependent households. |
Existing Programs Bicycle Network and Pedestrian Connections Community Transportation Technical Assistance Complete Streets Existing Studies The Future of the Curb Transportation Access Studies of Commercial Business Districts Proposed Studies Transportation Equity Areas Bicycle and Pedestrian Analysis Locations with High Bicycle and Pedestrian Crash Rates in the Boston Region MPO Area |
Safety |
Lack of safe bicycle routes within neighborhoods |
Improve access to safe bicycle facilities within communities with high shares of TE populations. |
Existing Programs Bicycle Network and Pedestrian Connections Complete Streets Existing Studies The Future of the Curb Locations with High Bicycle and Pedestrian Crash Rates in the Boston Region MPO Area Proposed Study Transportation Equity Areas Bicycle and Pedestrian Analysis |
Safety |
Unsafe sidewalks and street crossings, and incomplete pedestrian networks |
Improve sidewalks and street crossings, especially around schools, so that they are safe for children and elderly adults. |
Existing Programs Community Transportation Technical Assistance Complete Streets Intersection Improvements Existing Studies Pedestrian Report Card Assessment Dashboard Safety and Operations at Selected Intersections |
System Preservation |
Non-ADA compliant sidewalks |
Upgrade sidewalks to be compliant with the ADA. |
Existing Programs Community Transportation Technical Assistance Program Complete Streets Intersection Improvements Proposed Program Connect Elderly Adults with Transportation Existing Study Pedestrian Report Card Assessment Dashboard |
System Preservation |
Climate change |
Document potential exposure of TE populations to climate change impacts and determine how their ability to access transportation may be affected. |
Existing Program Transportation Equity Program Proposed Program Climate Resiliency Existing Study Exploring Resilience in MPO-funded Corridor and Intersection studies |
a Although this issue does not directly relate to the MPO’s goal areas, this topic was voiced during public outreach.
ADA = Americans with Disabilities Act. MAPC = Metropolitan Area Planning Council. MBTA = MBTA = Massachusetts Bay Transportation Authority. MPO = Metropolitan Planning Organization. TE = transportation equity. UPWP = Unified Planning Work Program.
Source: Boston Region MPO.
Transportation is a key factor in the region’s economic vitality. The transportation system makes economic activity possible by enabling the transport of goods and the delivery of services. The transportation sector also serves as a major economic engine itself—households, businesses, and government agencies directly consume transportation goods (for example, vehicles and motor fuel) and services (for example, public transit) to meet their travel needs.
Economic vitality issues related to the MPO’s long-range transportation planning include land use and freight travel. Land use planning (including development of residential, commercial, and industrial areas) needs to be coordinated with investments in transportation improvements and expansion of transportation options. The locations of different land uses, as well as patterns of regional development, impact housing costs, mobility, and commute times. The region’s economic health and growth potential is also influenced by freight movement in terms of goods and services reaching businesses and consumers. Overlaying these core issues are factors of congestion, both on roadways and transit, as well as access to housing, jobs, and transportation options.
Economic vitality needs addressed in the LRTP fall into two main categories, land use and freight movement. These categories influence and are influenced by interrelated transportation issues in the Boston region including housing costs, roadway and transit congestion, and access to housing, commercial, business, and transportation/mobility options.
The ultimate goal of regional planning is to coordinate investments in housing and employment centers with investments in transportation infrastructure. This approach of linking land use and transportation can have the dual effect of guiding growth towards identified priority development areas and away from high quality natural preservation areas. In addition, making coordinated investments in affordable housing and transit infrastructure is key to responding to the needs of the workforce population. Traffic congestion, including time-consuming commutes and longer truck freight travel times, can contribute to slowing economic growth and a less competitive regional economy.
As indicated by data analysis and public outreach conducted during the development of the Needs Assessment for the LRTP, Destination 2040, new infrastructure and upgrades to traffic and transit operations are needed to improve access to jobs and services. These include additional park-and-ride spaces, reverse-commute and off-peak services, and coordination among Regional Transit Authorities. Regarding freight transport, there must be convenient access to the regional express highway system from warehouses and distribution centers. In addition, conflicts between automobiles (including Transportation Network Companies drop-offs and pick-ups), bicycles, and delivery trucks competing for curb space in urban areas need to be addressed. Economic growth in the Boston region outpaces that in the rest of the state, and growth in the Inner Core subregion is projected to continue at a faster rate than in the rest of the Boston region. This growth is adding to an increase in the number of trips made in the region and increasing congestion on a network that is either at capacity or nearing it. Congestion reduction on expressways, interchanges, and arterials is needed to facilitate the movement of people and freight to ensure that the transportation network continues to provide a strong foundation for the economy.
Table 2-6 summarizes key findings about economic vitality needs that MPO staff identified through data analysis and public input. It also includes staff recommendations for addressing each need.
Table 2-6
Economic Vitality Needs in the Boston Region Identified through Data Analysis and Public Outreach and Recommendations to Address Needs
| Emphasis Area |
Issue |
Needs |
Recommendations to Address Needs |
|---|---|---|---|
Land Use |
Affordable housing |
Address the transportation needs of low-income populations via dense, affordable housing near transit hubs and employment, particularly in the Inner Core and suburbs. |
Existing Program Regional equity program, this can be coordinated with MAPC’s work on land use issues including housing and transportation |
Land Use |
Access to a high-performing, multimodal transportation system |
Infrastructure improvements are needed to support growth in the priority development areas, including improved equitable access to employment and housing via public transit, walking, and biking options. |
Existing Programs Intersection Improvement Complete Streets Bicycle and Pedestrian Major Infrastructure Freight Program Proposed Programs Bus Mobility Program Enhanced Park-and-Ride program Interchange Modernization State Freight and Rail projects |
Land Use |
Access to jobs through reverse-commute and off-peak service |
There is a need for better commuter rail scheduling, more frequent service, and off-peak service to allow for commuters to access jobs outside of the Inner Core. Also, more frequent, reliable off-peak, late-night, and weekend service to support reverse commuting and service workers on all modes throughout the region is needed. |
Existing Study Reverse-Commute Areas Analysis |
Access |
RTA coordination |
RTAs should coordinate service to address the needs of customers who travel between different RTA service areas; however, there are no funding sources to connect RTA services. |
Existing Program Regional Transit Service Planning and Technical Assistance |
Access |
Park-and-ride |
Additional parking is needed at park-and-ride lots that are at or approaching capacity. |
Existing Program Community Connections Program Proposed Program Enhanced Park-and-Ride program |
Freight Movement |
Congestion |
Reduce congestion on regional roadways to facilitate the movement of freight. (Increases in the costs of products and services can result from congestion due to increased payroll and vehicle costs of truck operations.) |
Existing Programs Major Infrastructure Bottleneck Program Proposed Program Freight Database Existing Studies Addressing Safety, Mobility, and Access on Subregional Priority Roadways Various location-specific studies and technical analysis projects implemented through the existing Freight Program Proposed Study Congestion Pricing Research |
Freight Movement |
Contested curb and arterial road usage |
Reduce conflicts between automobiles and delivery trucks that are competing for curb space. |
Existing Studies The Future of the Curb Transportation Access Studies of Commercial Business Districts Various location-specific studies through Freight program |
Freight Movement |
Appropriate freight access to retail and industrial sites |
Modern logistic operations, such as warehouses, distribution centers, and motor pools, require economies of scale and convenient access to the regional express highways system. |
Existing Studies Transportation Access Studies of Commercial Business Districts Various location-specific studies through Freight program |
MAPC = Metropolitan Area Planning Council. RTA = regional transit authority. UPWP = Unified Planning Work Program.
Source: Boston Region MPO.
The Boston region has extensive transportation maintenance and modernization needs, and transportation planners must continue to address safety and mobility for all modes and all people. Each of the MPO’s goal areas and the corresponding performance of the transportation system are defined by deficits that the MPO will need to confront in its multimodal approach to meeting the region’s needs through 2040. MPO staff estimate that addressing these needs will likely exceed anticipated financial resources between now and 2040. Therefore, the MPO will face difficult decisions as it prioritizes how to allocate resources and guide transportation investment decisions throughout this LRTP’s timeframe.
The identification of transportation needs and the recommendations to address those needs guided the MPO board members in their selection of projects and programs. More information on the projects and programs selected for Destination 2040 can be found in Chapter 4 of this document. More detailed information on the recommendations can be found in Chapter 10 of the Needs Assessment document.
To address the needs of the Boston region’s transportation system, the Boston Region Metropolitan Planning Organization (MPO) and its partner transportation agencies anticipate the resources that will be available for transportation capital investment, maintenance, and operations. In addition, these agencies seem to understand expected project costs and how they may change over time, including through inflation. This chapter describes funding sources that will support the portions of the Boston region transportation system over which the MPO has some programming jurisdiction: the roadway and transit networks. It also discusses projected capital, operations, and maintenance revenues and spending for these.
The Boston Region MPO estimates future revenues and costs for its investments because it is required by the Federal Highway Administration (FHWA) and Federal Transit Administration (FTA) to develop long-range transportation plans (LRTPs) that are fiscally constrained. This practice is intended to ensure that long-range plans are based on a “reasonable expectation of sufficient revenues to support the costs of maintaining the existing metropolitan area transportation system and any planned expansion of that transportation system over at least a 20-year time frame.”3-1
The Boston Region MPO has discretion to program approximately $2.9 billion between federal fiscal years (FFY) 2020 and 2040, and the dollars that it allocates to Major Infrastructure projects and other investment programs must remain within that limit.3-2 Destination 2040 and its short-term implementation plan, the MPO’s Transportation Improvement Program (TIP), must include sufficient information to demonstrate that prjects selected by the MPO can be implemented “using committed, available, or reasonably available Federal, State, local and private revenues, with the assurance that the federally supported transportation system is being adequately operated and maintained.”3-3 The details of the Boston Region MPO’s recommended projects and investment programs for Destination 2040 are included in Chapter 4; however, this chapter describes how these projects and programs fit within the MPO’s available discretionary funding.
The MPO’s discretionary, or Regional Target, dollars are also only a portion of (1) the dollars available to support the region’s transportation system, and (2) the dollars needed to meet anticipated transportation needs. By describing the projected revenues for the Massachusetts Department of Transportation (MassDOT), the Massachusetts Bay Transportation Authority (MBTA), the Cape Ann Transportation Authority (CATA), and the MetroWest Regional Transit Authority (MWRTA), and how those agencies plan to spend them, the MPO aims to provide a more comprehensive financial outlook for the region.
Investments in the region’s highway system are funded with dollars approved by Congress and distributed through federal-aid highway programs; state funds approved by the Massachusetts Legislature; and local and other sources. This section provides information on funding sources for the region’s highway system, including amounts of funds that the MPO expects to be available over Destination 2040’s 20-year planning horizon. It also describes planned MassDOT and MPO programming to improve the highway system and MassDOT resources to maintain it.
Federal funds support construction and rehabilitation of highways and bridges on federal-aid eligible routes (as determined by the roadway’s functional classification). They also support projects and programs that address particular focus areas, such as improving safety or air quality, building bicycle and pedestrian networks, or maintaining the Interstate Highway System. Congress has established various funding programs for appropriating federal funds to these key focus areas, which are discussed later in this chapter.
Federal highway funds for states are typically authorized by Congress through a multiyear act. The Fixing America’s Surface Transportation (FAST) Act is the active legislation that supports funding for transportation infrastructure. It authorized $226.3 billion in budget authority for federal-aid highway programs over a five-year period, beginning in FFY 2016 and ending in FFY 2020.3-4 The FAST Act authorizes a single amount for each year for all federal highway funding programs combined. The US Department of Transportation (USDOT) then apportions that amount to the states based on formulas specified in federal law.3-5 Each year, a state may use its apportionment only up to a ceiling referred to as the obligation authority, a limit set by Congress to control federal expenditures. The obligation authority represents the federal government’s commitment to reimburse the state for eligible expenditures on approved projects.
A state must obligate its apportionment of funds, up to its obligation authority limit, to specific transportation projects and programs before the close of the federal fiscal year, September 30. In August, FHWA follows a process established by Congress to redistribute obligation limitations to states that can obligate more than their initial share by the year-end deadline.3-6 In recent years, this process, which is referred to as August redistribution, has granted the Commonwealth the ability to obligate more funds than its initial limit when other states were not anticipated to reach their obligation limits. However, the Commonwealth, like other states, also has been subject to rescissions, when the federal government rescinded the unused balances of previously authorized funds.
FHWA will reimburse states for costs associated with federal-aid eligible projects out of the Highway Trust Fund (HTF). The primary source of revenue for the HTF is the federal tax on motor fuels (approximately 85 to 90 percent of all revenue); additional revenue comes from other transportation related fees and interest on trust fund reserves.3-7
In recent years, the HTF has been at risk of insolvency, in part because its revenues are heavily dependent on fuel taxes. As vehicles have become more fuel efficient and growth in vehicle-miles traveled has slowed, this revenue source has become less robust.3-8 Beginning in 2008, Congress passed laws that have transferred funds from other federal sources into the HTF, and 2018 Congressional Budget Office estimates indicate that the HTF may again be insufficient relative to spending following the expiration of the FAST Act.3-9 Several HTF-related legal authorities are set to expire in 2022 and 2023, and will need to be revisited; these authorities impose the taxes and fees that support the HTF, make it possible to place those revenues into the HTF, and allow the expenditure of HTF revenues on federal aid highway projects.3-10 During the life of Destination 2040, a key challenge will be to ensure a stable source of federal funding for surface transportation.
Revenues for the region’s highway system are also generated at the state level. The Massachusetts Legislature authorizes the issuance of bonds for transportation expenditures through passage of transportation bond bills. This allows the Commonwealth to provide matching funds to federal-aid projects, to pay for fully state-funded (nonfederal aid) projects, and to offer support to municipalities through local-aid programs such as Chapter 90 (discussed later under Local Priorities).
The two main types of bonds the Commonwealth issues are (1) General Obligation bonds, which are backed by the full taxing authority of the Commonwealth, and (2) Special Obligation Bonds, which are backed primarily by gas taxes and fees from the Registry of Motor Vehicles. The funds generated by taxes and fees are deposited in the Commonwealth Transportation fund and are used to pay debt service on the bonds and to fund MassDOT, the MBTA, and other regional transit authorities (RTAs) in the Commonwealth.
The Commonwealth supports other infrastructure improvements in the region using revenue collected from three tolled facilities: the Western Turnpike, the Metropolitan Highway System (MHS), and the Tobin Bridge. The projected annual net revenues on each of the toll facilities (after operating expenses and debt service payments [MHS only]) are available for capital projects as pay-go capital funds. The term pay-go is short for Pay As You Go, which refers to the practice of financing projects with funds that are currently available, rather than borrowed.
In past federal transportation funding acts, Congressional earmarks in federal transportation bills often provide full funding for specific projects. This practice ended in Congress prior to the FAST Act; however, some earmarks are still available for certain designated investments. In addition, with federal approval, MassDOT can access funding from the Central Artery Project Repair and Maintenance Trust Fund to address eligible MHS projects. Funding for transportation projects, including matching funds, may also be provided by municipalities or private institutions. For example, MassDOT is exploring the use of public-private partnerships as a financing mechanism for transportation.
While the previous section outlined the sources of funding for transportation projects, this section describes how the Commonwealth and regional and local governments plan to spend these funds, along with more detailed estimates of available funding.
MassDOT is the recipient of federal highway aid to the Commonwealth. Between FFYs 2020 and 2040, MassDOT and the Boston Region MPO estimate that Massachusetts will receive approximately $17.7 billion from the federal government to invest in the state’s highway system. This total reflects annual estimates that account for both anticipated Massachusetts apportionments and additional obligation ability that MassDOT expects the federal government will redistribute from other states to the Commonwealth through the August redistribution process.
These projections assume that Congress will enact a future transportation authorization act that will provide similar funding to the FAST Act (after the Act expires on September 30, 2020), and that the Highway Trust Fund will be sufficient to provide reimbursements for state transportation spending. To create this $17.7 billion dollar estimate, MassDOT developed near-term funding estimates for the first five-year period in the LRTP, FFYs 2020 to 2024. Between FFYs 2020 and 2024, the annual percentage change in the Massachusetts apportionment ranges from approximately 1.9 percent to 2.7 percent. Federal agencies advised MassDOT and the MPO to assume that federal apportionments to Massachusetts will increase by 2.2 percent each year starting in FFY 2025 and extending through FFY 2040. This growth factor is based on an analysis of actual federal funding allocations to the Commonwealth in recent years. They also assume that Massachusetts will receive a consistent level of redistributed obligation limitation from FHWA, which is estimated at $50 million per year, over the life of the LRTP.
When MassDOT allocates its apportionment of federal dollars for the highway system, it first deducts the Commonwealth’s debt service payments owed to the federal government. It then allocates the remaining federal funds, which are matched with state funds, to statewide road and bridge programs for projects prioritized by MassDOT, and to the MPOs in the Commonwealth for projects prioritized by these regional bodies. The sections that follow provide additional detail about each stage of this funding distribution process.
In recent years, the Commonwealth has used a highway project financing mechanism known as grant anticipation notes (GANs) to pay for major highway projects. GANs are bonds issued by the state that are secured by anticipated, future federal highway funds. In the late 1990s, the Commonwealth issued $1.5 billion in GANs to finance construction of a portion of the Central Artery/Ted Williams Tunnel Project. The majority of the project was completed in 2006. The Commonwealth made its final payment on this debt in 2014.
While the Central Artery/Tunnel repayments were winding down, the Commonwealth issued GANs again in 2010 for the Accelerated Bridge Program. This followed the passage in 2008 of the Accelerated Bridge Program Act, which authorized issuance of as much as $1.108 billion in GANs and $1.876 billion in Commonwealth special obligation bonds. As of September 2018, the Accelerated Bridge Program advertised 200 construction contracts with a combined budget of $2.43 billion. Of the 200 bridge projects included in the program, 191 are complete, and seven projects are still under construction.3-11 Over the course of the program, more than 270 bridges will be rehabilitated or replaced, with many more improved for safety and preserved in ways that will extend their lifecycles.
The debt that the Commonwealth has incurred for the accelerated bridge program will continue into the period covered by Destination 2040. The GANs for the Accelerated Bridge Program began to mature in state fiscal year (SFY) 2015 and are anticipated to continue to mature until SFY 2028. The total repayment amounts over the life of Destination 2040 are $834.1 million. These debt payments are estimated to consume approximately $81.6 million (12.1 percent of available federal funding) in FFY 2020 and peak at $108.8 million (14.1 percent of available federal funding) in FFY 2026. Debt payments will be $86.3 million per year in FFY 2027 and 2028.
After MassDOT has allocated funding to GANs repayments, it designates the remainder for spending on state and regional (MPO) priorities. These remaining federal dollars, which come through several FHWA funding programs established in the FAST Act, must be matched in some portion by state or local dollars, as dictated by the funding split formula of each particular program. Federal funds usually cover 80 percent of a project’s cost, and the state or local government covers 20 percent. Some federal programs offer a 90 percent federal share or full funding. MassDOT customarily provides the local match (which can also be provided by other entities).
States and MPOs must consider the eligibility requirements of federal-aid highway programs when spending money on projects and programs. Table 3-1 lists FHWA programs that generally supply funding to MassDOT and the Commonwealth’s MPOs.
Table 3-1
Federal Highway Administration Programs Applicable to MassDOT and
Massachusetts MPOs
FAST Act Program |
Eligible Uses |
Congestion Mitigation and Air Quality Improvement (CMAQ) |
A wide range of projects to reduce congestion and improve air quality in nonattainment and maintenance areas for ozone, carbon monoxide, and particulate matter |
Highway Safety Improvement Program (HSIP) |
Implementation of infrastructure-related highway safety improvements |
National Highway Performance Program (NHPP) |
Improvements to interstate routes, major urban and rural arterials, connectors to major intermodal facilities, and the national defense network; replacement or rehabilitation of any public bridge; and resurfacing, restoring, and rehabilitating routes on the Interstate Highway System |
Surface Transportation Block Grant (STBG) Program (formerly the Surface Transportation Program [STP]) |
A broad range of surface transportation capital needs, including roads; transit, sea, and airport access; and vanpool, bicycle, and pedestrian facilities |
Transportation Alternatives Program (TAP) |
A set-aside from the STBG program that funds the construction of infrastructure-related projects (for example, sidewalk, crossing, and on-road bicycle facility improvements) |
Metropolitan Planning |
Facilities that contribute to an intermodal transportation system, including intercity bus, pedestrian, and bicycle facilities |
National Highway Freight Program (NHFP) |
Projects that improve the efficient movement of freight on the National Highway Freight Network |
FHWA = Federal Highway Administration. MassDOT = Massachusetts Department of Transportation. MPO = Metropolitan Planning Organization.
Source: Federal Highway Administration.
In regions with metropolitan areas that have populations greater than 50,000, transportation projects or programs to receive federal aid must be programmed through the MPO certification process. MassDOT takes approximately one-third of its remaining federal- and state-matched funding and allocates it to the Commonwealth’s MPOs. The distribution of this MPO funding, which is also referred to as Regional Target funds, is determined by a formula established by the Massachusetts Association of Regional Planning Agencies (MARPA), which factors in each region’s share of the state population. This formula was last updated in 1991. Of the 10 MPOs and three transportation planning organizations in the Commonwealth, the Boston Region MPO receives the largest portion (approximately 43 percent) of funding through this formula-based distribution because of its large population. Again, these funds must be programmed in the TIP and State Transportation Improvement Program (STIP) before construction can be authorized using federal-aid funds. The STIP describes the federal-aid funded projects to be implemented statewide over a five-year period.
Figure 3-1 displays the distribution of federal funds that Massachusetts expects to receive between FFY 2020 and FFY 2040 across four categories: GANs payments, Boston Region MPO Regional Target funding, other Massachusetts MPO Regional Target funding, and funding for MassDOT’s statewide programs.
Figure 3-1
Federal Highway Funding for Massachusetts, FFYs 2020–40
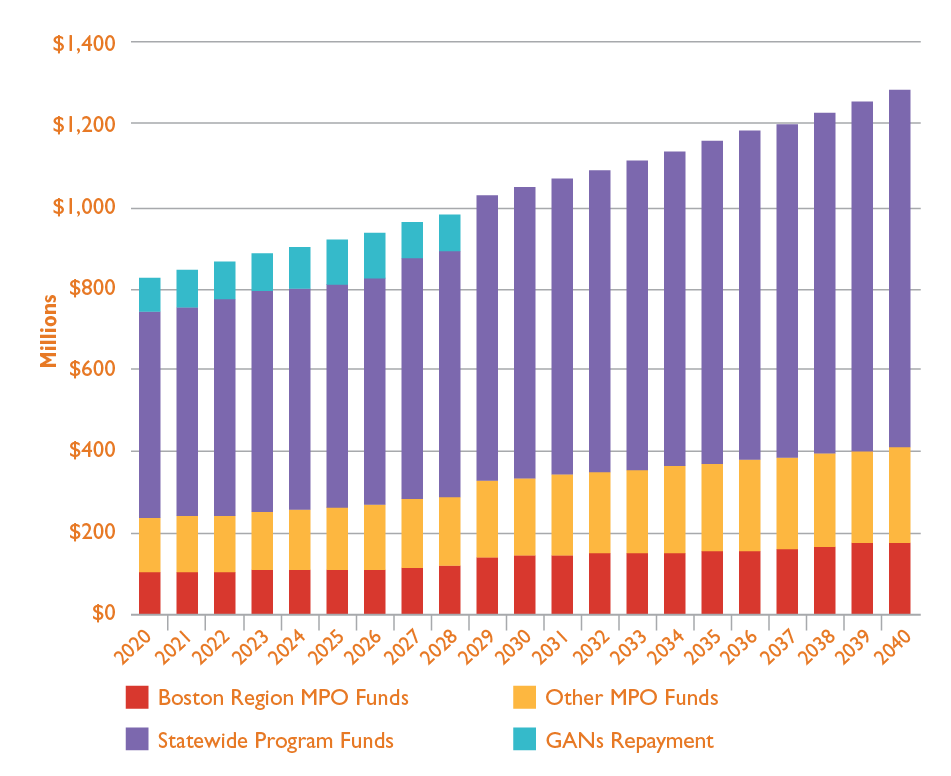
Note: The GANs Repayment dollar values include federal funds only. All other categories include state matching funds.
GANs = grant anticipation notes. MPO = Metropolitan Planning Organization.
Sources: Massachusetts Department of Transportation and the Boston Region MPO.
Table 3-2 and Figure 3-2 summarize the funding in each category by Destination 2040 time band.
Table 3-2
Federal Highway Funding for Massachusetts by Destination 2040 Time Band
Time Band |
Years |
Boston Region MPO Funds |
Other |
Statewide Program Funds |
GANs Repaymenta |
Total |
1 |
FFYs 2020–24 |
$533.17 |
$707.70 |
$2,627.10 |
$449.05 |
$4,317.00 |
2 |
FFYs 2025–29 |
$611.28 |
$811.39 |
$3,011.97 |
$385.09 |
$4,819.73 |
3 |
FFYs 2030–34 |
$750.57 |
$996.28 |
$3,698.31 |
$0 |
$5,445.17 |
4 |
FFYs 2035–40 |
$1,008.84 |
$1,339.10 |
$4,970.88 |
$0 |
$7,318.82 |
Total |
n/a |
$2,903.86 |
$3,854.47 |
$14,308.25 |
$834.14 |
$21,900.72 |
Note: Dollar values are shown in millions. Totals may not match the sums of values due to rounding.
a The GANs Repayment dollar values include federal funds only. All other categories include state matching funds.
FFYs = federal fiscal years. GANs = grant anticipation notes. MPO = Metropolitan Planning Organization.
Sources: Massachusetts Department of Transportation and the Boston Region MPO.
Figure 3-2
Federal Highway Funding for Massachusetts by Destination 2040 Time Band
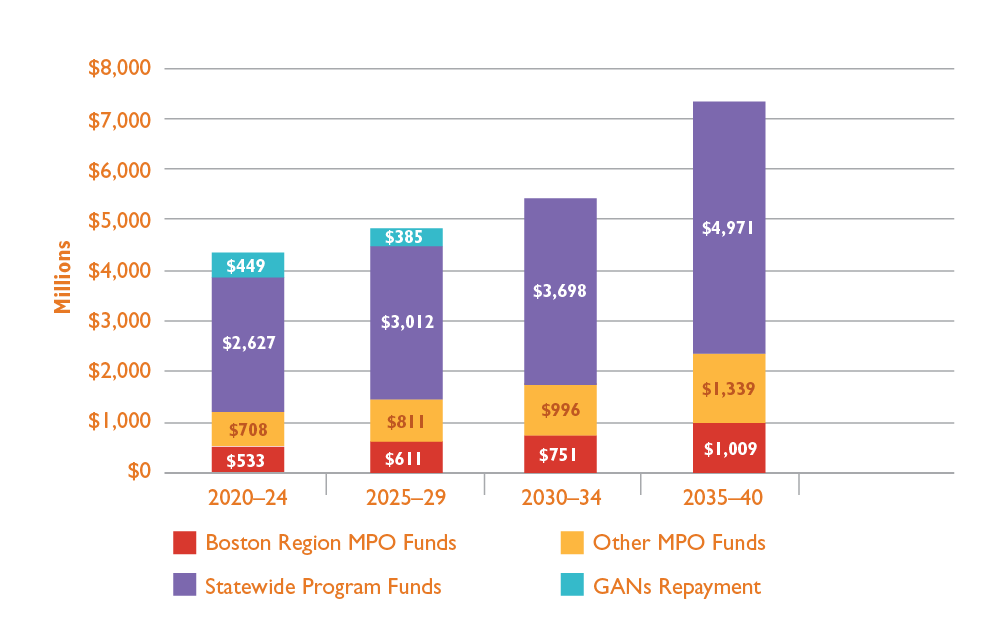
Note: The GANs Repayment dollar values include federal funds only. All other categories include state matching funds.
GANs = grant anticipation notes. MPO = Metropolitan Planning Organization.
Sources: Massachusetts Department of Transportation and the Boston Region MPO.
Each MPO in the state can decide how to prioritize its Regional Target funding, and the MPO engages its 97 cities and towns in this decision making when developing its LRTP every four years, and when developing its TIP each year. Given that the Regional Target funding originates from the Federal-Aid Highway Program, the Boston Region MPO board typically programs the majority of its Regional Target funding on roadway projects; however, the MPO board has flexed portions of its Regional Target funding to transit projects, such as when the MPO board gave its support to the Green Line Extension transit expansion project.
As mentioned previously, the MPO expects to receive approximately $2.9 billion in Regional Target funds (federal dollars plus a state match) to spend on transportation projects in the region between FFYs 2020 and 2040. This estimate is based in part on MassDOT’s and the MPO’s assumption that federal appropriations to Massachusetts will increase by 2.2 percent per year starting in FFY 2025. This annual revenue increase is greater than the 1.5 percent annual increase that the MPO anticipated for the outer years of its previous LRTP, Charting Progress to 2040.
MPOs must document selected projects and programs in ways that comply with federal requirements before construction can be authorized with federal aid funds. When the Boston Region MPO develops its LRTP, which has a horizon of 20 years or longer, it must list, describe, and provide cost estimates for projects that are regionally significant. The MPO defines regionally significant projects, which it also refers to as major infrastructure projects, as those that would add capacity to the transportation system or that cost more than $20 million, regardless of whether they are funded with federal-aid funding or nonfederal-aid sources.
A challenge for both MPOs and MassDOT when selecting projects and programs to fund is that project costs are expected to inflate by 4 percent per year over the life of Destination 2040, while federal revenues are only expected to increase by 2.2 percent per year. If these projections hold true, the MPO expects project cost growth will outpace funding growth, which will result in diminished buying power in future years. For example, a project costing $10 million if constructed in FFY 2025 would cost increasingly more if programmed in the outer years of the LRTP. To deliver the same project in FFY 2040, the cost would be $18 million, while the available revenues for that project would have increased by only $4.1 million, as shown in Figure 3-3.
Figure 3-3
Anticipated Project Cost Growth versus Funding Growth, FFYs 2025-40
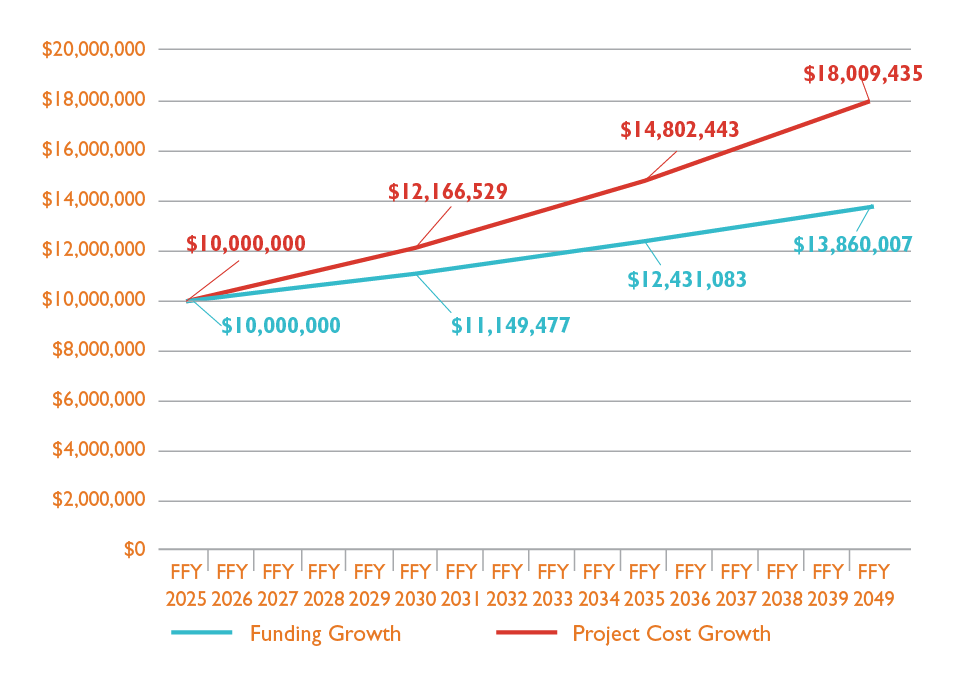
FFY = Federal Fiscal Year. MPO = Metropolitan Planning Organization.
Source: Boston Region MPO.
The MPO considers these anticipated project cost growth rates as well as projected revenues when it selects transportation projects for its LRTP; this helps the MPO ensure that it meets the fiscal constraint requirements mentioned at the beginning of this chapter. Table 3-3 lists the regionally significant projects and investment program allocations that the MPO has included in Destination 2040. More information about these projects and programs—as well as projects being funded with non-Regional Target sources—is included in Chapter 4.
Table 3-3
Costs and Funding for MPO-Programmed Projects and Programs in the Recommended Destination 2040 LRTP
| Investment |
Type |
Destination 2040 Time Frame |
Estimated Cost in Programmed Year(s)a |
FFYs 2020–40 MPO Funds |
FFYs 2020–40 Non-MPO Funds |
Total Funds |
|---|---|---|---|---|---|---|
Green Line Extension to College Avenue with Union Square Spur (Cambridge, Somerville, and Medford)b |
Transit Project (Capacity Addition) |
FFYs 2020–24 |
$49,131,200b |
$49,131,200 |
n/a |
$49,131,200 |
Roadway, Ceiling, and Wall Reconstruction, New Jet Fans, and other Control Systems in Sumner Tunnel (Boston) |
Highway Project |
FFYs 2020–24 |
$126,544,931 |
$22,115,687 |
$104,429,244 |
$126,544,931 |
Reconstruction of Rutherford Avenue, from City Square to Sullivan Square (Boston) |
Highway Project (Capacity Addition) |
FFYs 2020–29 |
$152,000,000 |
$143,421,070 |
$8,578,930 |
$152,000,000 |
Reconstruction of Highland Avenue, Needham Street, and Charles River Bridge, from Webster Street to Route 9 (Needham and Newton) b |
Highway Project (Capacity Addition) |
FFYs 2020–24 |
$29,601,436b |
$17,405,937 |
n/a |
$17,405,937 |
Reconstruction on Route 1A (Main Street) (Walpole) |
Highway Project |
FFYs 2020–24 |
$19,906,002 |
$19,906,002 |
n/a |
$19,906,002 |
Bridge Replacement, New Boston Street over MBTA (Woburn) |
Highway Project (Capacity Addition) |
FFYs 2020–24 |
$15,482,660 |
$15,482,660 |
n/a |
$15,482,660 |
Bridge Replacement, Route 27 (North Main Street) over Route 9 (Worcester Street) and Interchange Improvements (Natick) |
Highway Project |
FFYs 2025–29 |
$31,508,110 |
$31,508,110 |
n/a |
$31,508,110 |
Route 4/225 (Bedford Street) and Hartwell Avenue (Lexington) |
Highway Project (Capacity Addition) |
FFYs 2030–34 |
$48,922,700 |
$48,922,700 |
n/a |
$48,922,700 |
Intersection Improvements at Route 126 and Route 135/MBTA and CSX Railroad (Framingham) |
Highway Project (Capacity Addition) |
FFYs 2030–40 |
$184,118,700 |
$184,118,700 |
n/a |
$184,118,700 |
McGrath Boulevard (Somerville) |
Highway Project (Capacity Addition) |
FFYs 2025–34 |
$87,076,050 |
$87,076,050 |
n/a |
$87,076,050 |
Reconstruction of Western Avenue (Route 107) (Lynn) |
Highway Project |
FFYs 2025–29 |
$44,048,918 |
$44,048,918 |
n/a |
$44,048,918 |
Complete Streets Program |
Investment Program |
n/a |
n/a |
$1,296,464,607 |
n/a |
$1,296,464,607 |
Bicycle/Pedestrian Program |
Investment Program |
n/a |
n/a |
$139,360,284 |
n/a |
$139,360,284 |
Intersection Improvement Program |
Investment Program |
n/a |
n/a |
$367,057,778 |
n/a |
$367,057,778 |
Community Connections Program |
Investment Program |
n/a |
n/a |
$55,413,892 |
n/a |
$55,413,892 |
Transit Modernization Program |
Investment Program |
n/a |
n/a |
$118,534,729 |
n/a |
$118,534,729 |
Total Available to Boston Region MPO |
n/a |
n/a |
n/a |
$2,903,860,422 |
n/a |
n/a |
Total Programmed |
n/a |
n/a |
n/a |
$2,639,968,324 |
$113,008,174 |
$2,752,976,498 |
Unallocated Balance |
n/a |
n/a |
n/a |
$263,892,098 |
n/a |
n/a |
a Current cost estimates have been inflated to reflect their programmed years. More information is available in Chapter 4.
b A portion of the total funding for these projects was provided prior to FFY 2020. In FFY 2019, the MPO allocated funding to the Highland Avenue/Needham Street Project in Needham and Newton. Between FFYs 2016 and 2019, the MPO allocated funding to the Green Line Extension project.
FFY = Federal Fiscal Year. LRTP = Long-Range Transportation Plan. n/a = not applicable. MBTA = Massachusetts Bay Transportation Authority. MPO = Metropolitan Planning Organization.
Source: Boston Region MPO.
The projects and programs outlined in Table 3-3 set the long-term framework for the short-term funding decisions that the MPO makes annually when developing its rolling five-year TIP. Projects that are scheduled to be implemented in that five-year period, regardless of cost or regional impact, must be documented in the TIP. When making decisions about the TIP each year, the MPO accounts for the timing of regionally significant projects and considers how other candidate projects may fit into its investment programs. Each year, the TIPs from all the MPOs in a state are combined to form the STIP.
In addition to documenting federally funded projects for which the state has obligation authority, the TIP and STIP also document projects that would be funded using the Advance Construction financing method. In these cases, a state may receive approval from FHWA to begin a project before the state has received the necessary obligation authority. This pre-qualification allows a project to move forward initially with state funding, and to request federal reimbursements later.
The Boston Region MPO’s investments in the transit system are complemented by the Commonwealth’s roadway investment priorities, as programmed by MassDOT. This section describes state priorities, which play a primary role in addressing the operations and infrastructure maintenance needs of the highway system in the Boston Region.
MassDOT’s rolling five-year Capital Investment Plan (CIP) directs how MassDOT’s component divisions, such as its Highway Division, its Transit Division, and the MBTA, prioritize capital improvements for Massachusetts’ transportation system. The CIP process uses a framework that prioritizes funding according to MassDOT’s strategic goals (listed in descending order of priority):
MassDOT creates investment programs for the CIP that relate to these strategic goals, and it allocates funding to these goals and programs in ways that emphasize their priority. MassDOT’s operations and maintenance investments are funded through these programs, which are referenced in the sections that follow. MassDOT’s decision making about how to manage its assets via these programs is shaped by an array of asset management tools and systems. One important tool in this set is MassDOT’s Transportation Asset Management Plan for National Highway System (NHS) assets in Massachusetts. This plan provides an inventory and assessment of bridge and pavement assets, identifies performance gaps, discusses the results of life cycle cost and risk management analyses, and describes investment strategies and a financial plan MassDOT will follow to improve the system.
MassDOT is responsible for prioritizing bridge projects statewide. In addition to the Accelerated Bridge Program, bridge preservation and maintenance projects are funded through the Statewide Bridge Program, one of MassDOT’s reliability-oriented capital programs. Funding for this program comes from two of the federal-aid highway programs mentioned in Table 3-1: the National Highway Performance Program (NHPP) and the Surface Transportation Block Grant (STBG) Program. The NHPP funds bridges that are on the federal-aid system, while the STBG Program funds bridges on public roads that are not on the federal-aid system. Projects funded through the statewide bridge program typically receive 80 percent federal funding with a 20 percent nonfederal match. When programming funding toward bridge improvements, MassDOT programs federally required minimum amounts of NHPP funds to address NHS bridge performance needs.
The portion of total statewide federal dollars (including match funding) dedicated to the statewide bridge program each year ranges between 35 and 39 percent between FFY 2020 and FFY 2024. From FFY 2025 through 2040, it comprises approximately 37 percent of statewide federal dollars and match funding each year. Between FFY 2020 and 2040, MassDOT expects to dedicate $5.33 billion to the statewide bridge program. MassDOT’s federal-aid bridge project programming decisions are based on data from asset management systems and condition-based criteria; they are not shaped by region-level allocations. As a result, federal bridge funding projections specific to the Boston region between FFYs 2020 and 2040 are not included in this chapter.
MassDOT also estimates that the Commonwealth will make an additional $2.18 billion in nonfederal aid available for NHS bridge maintenance and improvement and NHS roadway preservation between FFYs 2020 and 2040. MassDOT used the MARPA formula to estimate the portion of funds that will be spent in each regional planning area in Massachusetts, however, the actual expenditure of funds in each region will be informed by MassDOT's asset management systems. The Boston Region MPO expects that MassDOT will allocate approximately 43 percent of the funding to the region in accordance with that formula, which amounts to $935 million for the life of the LRTP, and a portion of those funds will be spent to improve bridges.
MassDOT’s Interstate and non-Interstate (MassDOT-owned) pavement programs also support its Reliability strategic goal area. The federal funding source for these programs is the NHPP.
Between FFYs 2020 and 2040, MassDOT expects to make $933 million in federal dollars (including local match funds) available for interstate pavement maintenance throughout Massachusetts. The portion of total statewide federal dollars (including match funding) dedicated to statewide interstate maintenance each year ranges between 5 and 8 percent between FFY 2020 and FFY 2024. From FFY 2025 through 2040, it comprises approximately 7 percent of statewide federal dollars and match funding each year.
Approximately 38 percent of the interstate lane miles in the Commonwealth are in the Boston MPO region, thus the MPO expects to receive that proportion of statewide interstate maintenance funds for the life of the LRTP, amounting to $352 million.
Meanwhile, MassDOT expects to make approximately $2.02 billion in federal dollars (including local match funds) available for interstate pavement maintenance throughout the state between FFYs 2020 and 2040. The portion of total statewide federal dollars (including match funding) dedicated to the non-interstate MassDOT-owned roadway network each year ranges between 12 and 16 percent between FFY 2020 and FFY 2024. From FFY 2025 through 2040, it comprises approximately 14 percent of statewide federal dollars and match funding each year.
In addition to its Interstate lane mileage, the Boston Region MPO contains nearly 34 percent of the lane miles of non-interstate highways that are eligible to receive funding through the non-interstate DOT pavement program. As a result, the MPO expects to receive 34 percent of this statewide funding for other highway preservation projects, which will amount to $698 million during the life of the LRTP.
In addition, as mentioned above, MassDOT also estimates that the Commonwealth will make an additional $2.18 billion in nonfederal aid available for NHS bridge maintenance and improvement and NHS roadway preservation between FFYs 2020 and 2040. The MPO expects that MassDOT will spend $935 million (43 percent) in the region during that timeframe, and that a portion of that funding will be spent to address pavement preservation needs.
MassDOT’s CIP framework includes additional programs that meet statewide transportation needs, including other aspects of maintaining and operating the roadway network.
Regionally significant projects funded by the Commonwealth may be partially or wholly paid for via these programs.
These statewide programs are supported by a range of funding sources discussed in Table 3-1, including, but not limited to, the federal Congestion Mitigation and Air Quality Improvement Program (CMAQ), the Highway Safety Improvement Program (HSIP), and Transportation Alternatives Program (TAP). CMAQ supports transportation projects that reduce traffic congestion and thereby improve air quality. HSIP funding is used to reduce the number and severity of crashes at locations identified as particularly hazardous based on crash reports on file at the Registry of Motor Vehicles. In addition, TAP funding supports projects such as transportation enhancement, multiuse trails, and projects that create safe routes for children to access schools.
MassDOT expects to spend approximately $6 billion in federal and statewide match funding on these other statewide programs between FFY 2020 to 2040.
The portion of total statewide federal dollars (including match funding) dedicated to the non-interstate DOT each year ranges between 36 and 47 percent between FFY 2020 and FFY 2024. From FFY 2025 through 2040, it comprises approximately 42 percent of statewide federal dollars and match funding each year. MassDOT projected each region’s share of this funding using the MARPA formula. As the most populous region of the Commonwealth, the Boston Region is expected to receive the largest share of funding for other statewide programs: approximately 43 percent, which equals $2.58 billion.
Table 3-4 summarizes the funding MassDOT expects to have available in each of its statewide priority areas: Interstate maintenance, non-Interstate MassDOT-owned pavement management, statewide bridges, and nonfederal-aid NHS bridge and pavement preservation, and through other statewide transportation programs. This information is organized by Destination 2040 time band.
Table 3-4
Projected Funding for Statewide Priority Areas
Time Band |
Years |
Statewide Bridge |
Interstate Maintenance |
Non-Interstate DOT Pavement |
Nonfederal-Aid NHS Bridge and Pavement Preservation |
Other Statewide Programs |
Total |
1 |
FFYs 2020–24 |
$985.24 |
$158.28 |
$361.15 |
$500.00 |
$1,122.42 |
$3,127.08 |
2 |
FFYs 2025–29 |
$1,120.78 |
$199.86 |
$429.90 |
$511.00 |
$1,261.43 |
$3,522.97 |
3 |
FFYs 2030–34 |
$1,376.17 |
$245.40 |
$527.86 |
$522.24 |
$1,548.87 |
$4,220.55 |
4 |
FFYs 2035–40 |
$1,849.71 |
$329.85 |
$709.50 |
$642.83 |
$2,081.83 |
$5,613.71 |
Total |
n/a |
$5,331.90 |
$933.39 |
$2,028.41 |
$2,176.07 |
$6,014.55 |
$16,484.32 |
Note: Dollar values are shown in millions. Totals may not match the sums of values due to rounding.
DOT = Department of Transportation. FFYs = federal fiscal years. MPO = Metropolitan Planning Organization NHS = National Highway System.
Sources: Massachusetts Department of Transportation and the Boston Region MPO.
Table 3-5 summarizes the funding the Boston Region expects to receive for interstate maintenance, non-Interstate DOT pavement management, and nonfederal-aid bridge preservation and through other statewide transportation programs by Destination 2040
time band.
Table 3-5
Estimates of Projected Funding for Statewide Roadway Investments in the Boston Region MPO Area
Time Band |
Years |
Interstate Maintenance |
Non-Interstate DOT Pavement |
Nonfederal-Aid NHS Bridge and Pavement Preservation |
Other Statewide Programs |
Total |
1 |
FFYs 2020–24 |
$59.70 |
$124.27 |
$214.84 |
$482.27 |
$881.08 |
2 |
FFYs 2025–29 |
$75.38 |
$147.93 |
$219.56 |
$542.00 |
$984.87 |
3 |
FFYs 2030–34 |
$92.56 |
$181.64 |
$224.39 |
$665.51 |
$1,164.10 |
4 |
FFYs 2035–40 |
$124.40 |
$244.13 |
$276.20 |
$894.50 |
$1,539.23 |
Total |
n/a |
$352.04 |
$697.97 |
$934.99 |
$2,584.28 |
$4,569.28 |
Note: Dollar values are shown in millions. Totals may not match the sums of values due to rounding.
This table excludes funding through the statewide federal-aid bridge program, as specific projections are not available for the Boston region.
DOT = Department of Transportation. FFYs = federal fiscal years. MPO = Metropolitan Planning Organization.
Sources: Massachusetts Department of Transportation and the Boston Region MPO.
The Commonwealth will also support maintenance and operations needs on the region’s transportation system using revenue collected from its tolled facilities, including the Western Turnpike, MHS, and the Tobin Bridge. In its SFY 2020–24 CIP, MassDOT notes that over the next five years, it expects to spend $423.4 million on the MHS, $558.6 million on the Western Turnpike, and $103 million on the Tobin Bridge. As mentioned in the Highway System Funding Sources section above, these would be pay-go funds. In addition, according to the SFYs 2020–24 CIP, MassDOT expects to spend $223.4 million in funds from the Central Artery Project Repair and Maintenance Trust Fund.
Several Commonwealth programs are geared towards providing funding to address municipal-level transportation priorities. The largest of these is the Chapter 90 program, which reimburses municipalities for spending on local roadway and bridge projects. The Massachusetts Legislature establishes Chapter 90 funding on an annual basis; according to the SFYs 2020–24 CIP, MassDOT estimates that the Commonwealth will spend approximately $200 million in Chapter 90 funds statewide each year during that five-year period. Funding is allocated to municipalities based on a legislatively established formula. Municipalities have the discretion to select their projects, which may include maintenance of municipal roadways, sidewalk improvements, right-of-way acquisition, landscaping, drainage improvements, street lighting, and upgrades to traffic control devices. The Commonwealth’s SFY 2020 apportionment of Chapter 90 funds to Boston Region municipalities is $79.6 million.
Other programs that support local priorities include the Commonwealth’s Complete Streets program, which is distinct from the MPO’s Complete Streets Investment program. This Commonwealth program, which was referenced in the State Priorities section, provides funding and technical assistance to communities that “demonstrate a commitment to providing safe and accessible options for all modes of travel.”3-12 As noted in its SFY 2020–24 CIP, MassDOT expects to spend $40.5 million through this program over the five-year period. In addition, the Commonwealth’s Municipal Small Bridge program assists municipalities by providing repair or replacement funding for town-owned bridges that are shorter than 20 feet long and are therefore not eligible for federal bridge funding. MassDOT’s SFY 2020–24 CIP assumes that it will spend $56.2 million through this program over the next five years.
Additional funding for transportation may be available to municipalities from sources beyond MassDOT. For example, according to the Commonwealth’s statute, the Transportation Network Company (TNC) Division of the Department of Public Utilities must collect a $0.20 per-ride assessment on all TNC rides originating in the Commonwealth. In 2017, half of the total $12.8 million assessment was distributed to MassDevelopment, the Commonwealth’s economic development and finance agency, and to the Commonwealth’s Transportation fund. The other half was distributed to Massachusetts cities and towns based on the number of TNC rides that originated in each municipality. In 2017, the 97 municipalities in the Boston region received $5.9 million from this assessment, which was allocated to projects such as roadway and sidewalk improvements and shuttle services. In addition, the MassWorks Infrastructure Program, which is administered by the Commonwealth’s Executive Office of Housing and Economic Development, provides capital funds to municipalities and other eligible public entities for infrastructure projects that support and accelerate housing production, spur private development, and create jobs throughout Massachusetts. In 2018, seven Boston Region municipalities—Ashland, Boston, Bolton, Gloucester, Hudson, Sharon, and Weymouth—received MassWorks funding for projects with transportation components.
Transit systems require funding for capital improvements, to operate service, and to conduct maintenance to provide safe aqnd reliable transit service. This section of Destination 2040 reports on funding for the three transit providers that receive federal funds in the Boston region on an ongoing basis: the MBTA, CATA, and MWRTA. These three agencies report their federally funded investments in the Boston Region MPO’s LRTP and TIP. This section also provides information on MassDOT-managed statewide-grant funding (partially funded with federal dollars) that a variety of transit providers in the region can access to improve their systems. Finally, this section provides information on funding resources and expected costs associated with operating and maintaining the MBTA’s, CATA’s, and MWRTA’s transit systems
.
Congress has authorized federal aid for transit programs through the FAST Act until September 30, 2020. Approximately 80 percent of federal funding for public transportation in the United States comes from the Mass Transit Account of the HTF (described in the Highway System Funding Sources section of this chapter), while the remainder comes from the general fund of the US Treasury.3-13 Like federal funding for highways, federal funding for transit is dependent on (1) Congress passing another transportation authorization act once the FAST Act expires, and (2) the availability of resources from the HTF. In addition, as with federal highway funding, federal transit dollars are subject to obligation authority limits.
FTA provides funding for transit through both formula-based programs and non-formula grants. Formula-based aid is allocated to urbanized areas (UZAs), which are areas defined by the US Census that have populations of 50,000 or more. MassDOT receives federal aid for the Boston UZA and allocates it to transit agencies within the UZA based on a negotiated split agreement. Transit agencies can also access federal funds by applying to FTA non-formula, or discretionary grant, programs. Transit agencies may also be eligible to apply to discretionary grant programs administered by the Federal Railroad Administration (FRA) and USDOT; examples of these programs include the Better Utilizing Investments to Leverage Development, also known as BUILD, and the Infrastructure for Rebuilding America, also known as INFRA, programs. Federal funds provided to transit agencies must be matched by funds from state, local, or other sources; these match requirements vary by program.
Table 3-6 describes FTA and FRA programs that have provided funds to the Boston region’s transit systems in recent years.
Table 3-6
Federal Transit Administration and Federal Railroad Administration Programs Applicable to Transit Providers in the Boston Region
FAST Act Program |
Federal Agencies |
Program Type |
Eligible Uses |
Section 5307: Urbanized Area Formula Grants |
FTA |
Formula |
Transit capital and operating assistance in urbanized areas |
Section 5337: State of Good Repair Program |
FTA |
Formula |
Maintenance, rehabilitation, and replacement of transit assets to maintain a state of good repair |
Section 5339: Bus and Bus Facilities |
FTA |
Includes formula and discretionary grant components |
Capital projects to replace, rehabilitate, and purchase buses and related equipment, to construct bus-related facilities, and to purchase or lease low- or no-emission buses |
Section 5310: Enhanced Mobility of Seniors and Individuals with Disabilities |
FTA |
Formula |
Capital expenses that support transportation to meet the special needs of older adults and persons with disabilities |
Section 5309: Capital Investment Grants |
FTA |
Discretionary grant |
Grants for new and expanded rail, bus rapid transit, and ferry systems that reflect local priorities to improve transportation options in key corridors |
Positive Train Control Grant Program |
FTA, FRA |
Discretionary grant |
Installation of positive train control systems on commuter rail systemsa |
a Positive train control systems are advanced systems designed to stop a train automatically before certain accidents occur.
FRA = Federal Railroad Administration. FTA = Federal Transit Administration. MPO = Metropolitan Planning Organization.
Source: FTA, FRA, and the Boston Region MPO.
The MBTA receives formula funding from the Urbanized Area Formula Grants program (Section 5307), the State of Good Repair program (Section 5337), and the Bus and Bus Facilities program (Section 5339) as described in Table 3-7. The MBTA, which has the largest transit service and asset portfolio of the transit agencies in the Boston region, is the recipient of the preponderance of federal transit funds that come to the region via these programs.
As with the federal sources of highway funding, MassDOT developed estimates of FTA formula funds expected to be available for transit agencies throughout the Commonwealth. To produce these estimates through FFY 2040, MassDOT assumed an inflation level for each program based on FAST Act funding levels. These inflation rates vary by program and range between 1.7 and 3.8 percent per year. The MBTA typically provides a 20 percent match to these FTA formula funds.
Table 3-7 shows the amounts of Section 5307, Section 5337, and Section 5339 federal formula funds that the MBTA is expected to receive between FFY 2020 and FFY 2040, grouped by Destination 2040 time band. This table also shows a projected amount of MBTA match funding, based on an 80 percent federal share/20 percent local share of funding through these programs. More information about the sources of MBTA match funding is available in the State Aid and Other Funding Sources sections that follow.
Table 3-7
Federal Formula Funds for the MBTA, by Program and Destination 2040 Time Band
Federal Program |
FFYs 2020–24 |
FFYs 2025–29 |
FFYs 2030–34 |
FFYs 2035–40 |
All Years |
Section 5307: Urbanized Area Formula Grants |
$779.26 |
$863.75 |
$957.39 |
$1,286.85 |
$3,887.26 |
Section 5337: State of Good Repair Grants |
$872.32 |
$949.96 |
$1,034.52 |
$1,363.68 |
$4,220.48 |
Section 5339: Bus and Bus Facilities |
$38.04 |
$45.91 |
$55.40 |
$81.80 |
$221.16 |
MBTA Match for All Formula Programs |
$422.41 |
$464.91 |
$511.83 |
$683.08 |
$2,082.22 |
Total |
$2,112.03 |
$2,324.53 |
$2,559.14 |
$3,415.42 |
$10,411.12 |
Note: Dollars are shown in millions. Totals may not sum due to rounding. FTA Section 5307 funds are expected to increase by 2.08 percent per year, Section 5337 funds are expected to increase by 1.72 percent per year, and Section 5339 funds are expected to increase by 3.83 percent per year.
FTA = Federal Transit Administration. MassDOT = Massachusetts Department of Transportation. MBTA = Massachusetts Bay Transportation Authority. MPO = Metropolitan Planning Organization.
Sources: MassDOT, the MBTA, and the Boston Region MPO.
In addition to these federal formula funds, the MBTA is also expected to receive FTA discretionary grant program funding during the life of Destination 2040. These discretionary grants are focused on specific projects or initiatives. FTA’s Capital Investment Grants program (Section 5309) will provide a total of $966.12 million in federal funds to support the construction of the Green Line Extension in Cambridge, Somerville, and Medford, as stipulated in FTA’s Full Funding Grant Agreement (FFGA) with MassDOT and the MBTA. The total cost of the project is approximately $2.29 billion, with the remaining construction costs covered by federal CMAQ dollars contributed by the Boston Region MPO ($157.08 million); Commonwealth funds, including match funds ($1.06 billion); and contributions from the Cities of Cambridge ($25 million) and Somerville ($50 million).
FTA, the Commonwealth, the Boston Region MPO, and these municipalities began funding the Green Line Extension project prior to FFY 2020, the first year of Destination 2040. Between FFYs 2020 and 2040, the MBTA expects that it will spend approximately $1.44 billion on the project, which will be supported by FTA Section 5309 funds and FHWA CMAQ funding contributed by the MPO, along with Commonwealth, local, and other contributions.
FTA and the FRA have also awarded the MBTA funds to assist with the deployment of Positive Train Control systems. These systems are designed to stop a train automatically before certain accidents occur. Between FFYs 2020 and 2024, FTA and FRA will provide $37.92 million in federal funds, including approximately $2.56 million in formula funds, for which the MBTA will provide an estimated $9.48 million match. During the Destination 2040 timeframe, upon completion of the Positive Train Control Program, the MBTA will have the opportunity to draw down loans from the USDOT, which are secured through the Railroad Rehabilitation and Infrastructure Financing and the Transportation Infrastructure Finance and Innovation Act programs.
Finally, the MBTA also expects to receive $6.9 million in federal funds from the Department of Homeland Security and Federal Emergency Management Agency Transit Security Grant Program, in the first time band of Destination 2040.
CATA receives a portion of the Urbanized Area Formula Grants program (Section 5307) funds that come to the Boston UZA. MassDOT used the same approaches and inflation rate that it used to estimate Section 5307 funds for the MBTA to develop estimates for CATA between FFY 2020 and FFY 2040. These projections are shown in Table 3-8.
Table 3-8
Federal Funds for CATA, by Destination 2040 Time Band
Federal Program |
FFYs 2020–24 |
FFYs 2025–29 |
FFYs 2030–34 |
FFYs 2035–40 |
All Years |
Section 5307: Urbanized Area Formula Grants |
$2.96 |
$3.28 |
$3.63 |
$4.11 |
$13.98 |
Note: Funding amounts are shown in millions. FTA Section 5307 funds are expected to increase by 2.08 percent per year. Matching funds are not shown in this table.
CATA = Cape Ann Transportation Authority. FFY = Federal Fiscal Year. MassDOT = Massachusetts Department of Transportation. MPO = Metropolitan Planning Organization.
Sources: MassDOT and the Boston Region MPO.
CATA can spend these Urbanized Area Formula funds on capital projects, and is eligible to spend up to 75 percent of its annual Urbanized Area Formula funding allocation on operating costs or use the funds for capital projects per FTA. CATA typically spends a portion of this funding on preventative maintenance for its vehicles each year; this is an operating expense that FTA has deemed eligible as a capital project that can be funded 80 percent with federal dollars.3-14 It allocates the rest to capital investments.
Both CATA and MWRTA typically receive capital dollars from the Commonwealth’s RTA Capital Assistance (RTA CAP) fund. MassDOT works with RTAs to provide matching funds for individual capital projects that are approved for inclusion in the MassDOT CIP, with the match amount based on the amount of federal funds that RTAs pledge toward each project. FTA formula funds typically require a 20 percent local match, which MassDOT typically fulfills, although in some cases MassDOT may provide a larger share.
Like CATA, MWRTA receives Urbanized Area Formula Grants program (Section 5307) funds to support its capital infrastructure. Table 3-9 shows the amount of these funds expected to be available to MWRTA during the life of Destination 2040, based on MassDOT projections.
Table 3-9
Federal Funds for MWRTA, by Destination 2040 Time Band
Federal Program |
FFYs 2020–24 |
FFYs 2025–29 |
FFYs 2030–34 |
FFYs 2035–40 |
All Years |
Section 5307: Urbanized Area Formula Grants |
$12.55 |
$13.91 |
$15.42 |
$17.45 |
$59.34 |
Note: Funding amounts are shown in millions. FTA Section 5307 funds are expected to increase by 2.08 percent per year. Matching funds are not shown in this table.
FFY = Federal Fiscal Year. MassDOT = Massachusetts Department of Transportation. MPO = Metropolitan Planning Organization. MWRTA = MetroWest Regional Transit Authority.
Sources: MassDOT and the Boston Region MPO.
MWRTA is also similar to CATA in that it is eligible to spend up to 75 percent of its allocation on operating costs, per FTA. MWRTA typically spends a significant share of its Urbanized Area Formula funds on operating expenses each year, particularly to support its ADA paratransit service. MWRTA allocates its remaining Section 5307 funding to capital projects after operating needs are met. As discussed in the Federal Funding for CATA section, the Commonwealth matches federal funding for MassDOT/CIP-approved RTA capital projects on an individual project basis; typically, MassDOT's match share is 20 percent, although this share can vary from project to project.
MassDOT oversees the distribution of other federal funding for transit in the Boston region. Each year, MassDOT’s Rail and Transit Division administers the competitive Community Transit Grant Program, which awards funding to help meet the transportation and mobility needs of seniors and people with disabilities. This program is supported by both the federal Enhanced Mobility of Seniors and Individuals with Disabilities program (Section 5310; see Table 3-6 for details), and Mobility Assistance Program (MAP) funds from the Commonwealth. Awards from this program fund mobility management initiatives, operational costs, and capital equipment, such as vehicles. A Community Transit Grant Program committee advises MassDOT staff by reviewing and scoring applications for Section 5310 and MAP funding through this program. Once awards are made, MassDOT submits a Section 5310 funding application to FTA.
While MassDOT distributes federal Section 5310 funding through a competitive grant process, a designated portion of this funding must be allocated within the Boston UZA, as Section 5310 is a formula-based program. Table 3-10 shows the expected amount of Section 5310 dollars that are expected to be available in the Boston UZA, based on MassDOT projections.
Table 3-10
Federal Section 5310 Funds for the Boston Urbanized Area,
by Destination 2040 Time Band
Federal Program |
FFYs 2020–24 |
FFYs 2025–29 |
FFYs 2030–34 |
FFYs 2035–40 |
All Years |
Section 5310: Enhanced Mobility of Seniors and Individuals with Disabilities |
$19.15 |
$21.24 |
$23.55 |
$31.67 |
$95.61 |
Note: Funding amounts are shown in millions. FTA Section 5310 funds are expected to increase by approximately 2.1 percent per year.
FFY = Federal Fiscal Year. FTA = Federal Transit Administration. MassDOT = Massachusetts Department of Transportation. MPO = Metropolitan Planning Organization.
Sources: MassDOT and the Boston Region MPO.
MWRTA and CATA are eligible to receive funds through the Community Transit Grant Program. For example, in SFY 2019, MWRTA was awarded capital funding to purchase 24 replacement vehicles ($1.82 million in federal and matching funds) and to address information technology infrastructure and dispatching software needs ($100,000). In that same year, MWRTA also received operations-related funding to support its travel-training program ($100,000). Meanwhile, in SFY 2018, CATA received $204,200 in capital funding (including federal and matching funds) for replacement vehicles. Other types of entities that may receive these funds include municipal governments or private, nonprofit transportation providers in the Boston UZA. Funds awarded through the Community Transit Grant Program may be matched by local sources, depending on their use.
MassDOT also launched the competitive Workforce Transportation Options Grant Program in 2019. This grant program, which is administered by the MassDOT Rail and Transit Division, used federal CMAQ dollars to leverage private and other non-state funds to improve options for workforce transportation. MassDOT expects that approximately $1.975 million will be spent through this program each year, with $9.9 million identified for SFYs 2020–24 in MassDOT’s CIP. Boston region transit providers, including transportation management associations, may be able to access this funding.
The Commonwealth supplements federal dollars for transit capital spending with state revenues, including bond funds. As mentioned in the Highway System Funding Sources section, the Commonwealth issues general obligation bonds and special obligation bonds. MassDOT’s CIP notes that in the near term (SFYs 2020–24):
As mentioned above, Commonwealth bond funds are also used to provide RTA CAP funding to RTAs such as MWRTA and CATA. These funds provide the match funding for federal dollars or help RTAs to make additional capital investments. As previously mentioned, RTAs coordinate with the MassDOT Rail and Transit Division to identify funding for individual projects that are approved for inclusion in the CIP. According to MassDOT’s SFY 2020–24 CIP, MWRTA is expected to receive $1,333,165 in RTA CAP funds to support its capital investments during this timeframe, while CATA is expected to receive $811,250 in RTA CAP funds to support its capital investments.
Finally, as previously mentioned in the Federal Aid section, MassDOT’s MAP provides funding that helps to support the Community Transit Grant Program. The MassDOT CIP notes that the MAP is expected to make approximately $50 million available statewide between SFYs 2020–24.
The MBTA has several other funding sources that supplement Commonwealth and federal dollars for transit capital improvement projects. MBTA revenue bonds, including sustainability bonds, help provide matches for federal dollars and otherwise support MBTA capital projects. The MBTA’s ability to issue these bonds is contingent on the ability of its operating budget to support increased debt service, and market variables will have an impact on the costs of new debt and the bond proceeds available to support the capital program from future debt issuance. According to the MassDOT SFYs 2020–24 CIP, the MBTA expects that nearly $1.02 billion from revenue bonds will be available to support MBTA capital investments during this period.
Other funding sources for MBTA capital projects include the following sources:
MWRTA and CATA projects may also be supported by local funds. In some cases, revenues from tolls—referred to as toll credits—can also be used to match federal funds.
The funding sources described in the Transit Capital Funding Sources section help to support the capital investments that the MBTA, MWRTA, and CATA will make between FFYs 2020 and 2040. As with highway investments, transit capital investments can be organized according to the strategic goals in the MassDOT CIP: reliability, modernization, and expansion. These transit agencies’ priorities are also shaped by their respective transit asset management (TAM) plans, which include transit asset inventory and condition assessments and strategies to bring vehicles, facilities, and other infrastructure into a state of good repair. This section explains the MBTA, MWRTA, and CATA’s approaches to spending federal funds to meet their systems’ state of good repair, modernization, and other needs.
As of May 2019, the MBTA has made substantial progress on a capital investment assessment process, which built off of the transit asset inventory and condition assessment data collection and analysis it conducted to meet FTA TAM Rule requirements. One of the findings of this assessment process is that the MBTA’s capital needs as of this date amount to approximately $10.1 billion.3-15 This point-in-time estimate reflects the amount that the MBTA would need to spend if it chose to replace fully all assets currently in need of replacement (as of its October 2018 report to the National Transit Database) with modernized assets (for example, to address ADA or fire code compliance). Figure 3-4 shows how this $10.1 billion asset replacement and modernization need is spread across asset categories.
Figure 3-4
MBTA Capital Need Estimates by Category
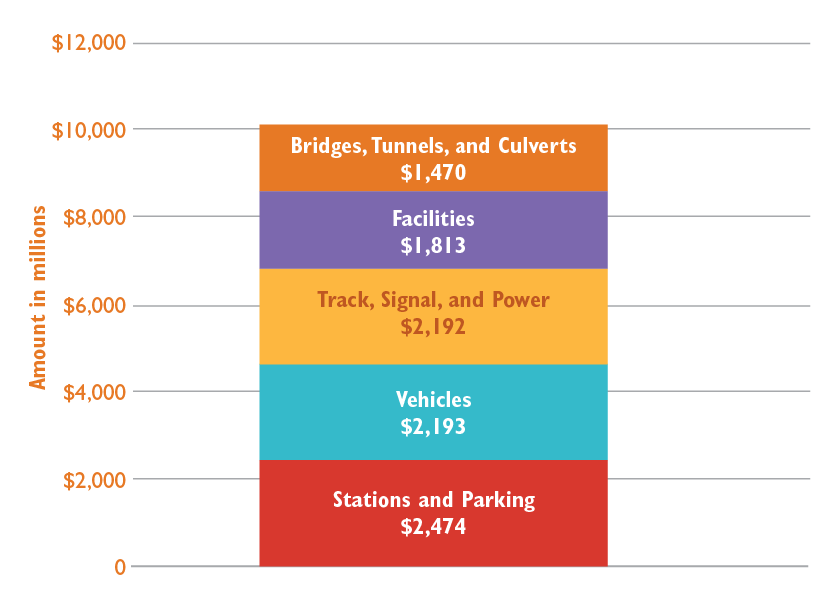
Note: This point-in-time estimate reflects the replacement costs for MBTA assets that are in need of replacement as of the MBTA’s October 2018 reporting to the National Transit Database. This estimate is a dynamic value that will change over time. Estimates for several categories include placeholders and will be updated as additional data is collected and analyzed.
MBTA = Massachusetts Bay Transportation Authority.
Source: MBTA, “Capital Needs Assessment: Presentation to the Fiscal Management and Control Board.” May 13, 2019. pg 13.
The MBTA notes that since SFY 2016, it has invested more than $3 billion in its capital program, including over $2.5 billion specifically in reliability and modernization needs.3-16 The projects it has invested in since this date have addressed needs across various vehicle types—including buses, commuter rail locomotives and coaches, and paratransit vehicles—as well as station, parking, track, signal, bridge, power, and winter resiliency equipment needs. The effects of other investments, such as in Red Line and Orange Line vehicles and improvements at Wollaston, Braintree, and Quincy Adams stations, are not reflected in this current estimate but are expected to appear in future asset condition assessments. Overall, the MBTA estimates that had it not made such significant capital investments in recent years, the agency’s capital need would be greater.
This analysis will support the MBTA’s Long-Term Capital Plan, which will address capital needs related to asset condition and modernization, system transformation, safety improvements, capacity enhancements, and expansion projects. The MBTA has developed a re-baselined spending plan to address its current estimated $10.1 billion in asset condition and modernization needs by 2032, which falls within the horizon of Destination 2040.3-17 The MBTA’s next steps to support long-term capital planning in this area will be to (1) complete its capital needs assessment; (2) execute its current Capital Investment Plan, which will help reduce asset replacement needs by putting new assets into service; and (3) develop a 15-year capital program to invest approximately $20 billion in non-expansion priorities.3-18
The funding sources outlined in this chapter will support the MBTA in addressing these asset replacement and modernization needs. Table 3-7 in the Transit Capital Funding Sources section shows that the MBTA is projected to receive a combined $8.3 billion in federal dollars from the Urbanized Area Formula Grants program (Section 5307), State of Good Repair Program funds (Section 5337), and Bus and Bus Facilities funds (Section 5339) between FFYs 2020 and 2040. These funds are expected to be matched by a projected $2.08 billion in MBTA funds. Additional funding sources, including those described in the State Aid and Other Funding Sources section, will support MBTA capital investment.
In the SFYs 2020–24 CIP, the MBTA has established specific programs in each of MassDOT’s strategic goal areas. The programs in the reliability and modernization areas most directly address asset condition and modernization needs, although expansion projects will also affect the overall extent and condition of the system. Table 3-11 lists these programs.
Table 3-11
MBTA-Related CIP Programs by MassDOT Strategic Goal Area
| Strategic Goal Area |
Related Capital Investment Programs |
|---|---|
Reliability |
Bridges and Tunnels Facilities Revenue Vehicles Stations Systems Upgrades Track, Signals, and Power |
Modernization |
Accessibility Commuter Rail Safety and Resiliency Customer Experience and Technology Green Line Transformation Process Improvements and Innovation Red Line and Orange Line Improvements Risk Management and Mitigation |
Expansion |
Expansion Project Development Green Line Extension (GLX) Non-GLX Expansion Projectsa South Coast Rail |
a Non-GLX Expansion projects include future expansion projects for the transit and commuter rail system.
CIP = Capital Investment Plan. MassDOT = Massachusetts Department of Transportation. MBTA = Massachusetts Bay Transit Authority. SFY = State Fiscal Year
Source: SFYs 2020–24 MassDOT Capital Investment Plan.
More details about these MBTA programs and planned investments are discussed in Chapter 4, the System Preservation Chapter of the Destination 2040 Needs Assessment, the SFY 2020–24 MassDOT CIP, and/or the MBTA’s 2018 TAM Plan.
MassDOT’s SFYs 2020–24 CIP also includes programs in its reliability and modernization goal areas that are specific to RTAs. Table 3-12 lists these programs.
Table 3-12
RTA-Related CIP Programs by MassDOT Strategic Goal Area
Strategic Goal Area |
Related Capital Investment Programs |
Reliability |
RTA Facility and Vehicle Maintenance RTA Vehicle Replacement |
Modernization |
RTA Facility and System Modernization RTA Replacement Facilities |
CIP = Capital Investment Plan. MassDOT = Massachusetts Department of Transportation. RTA = Regional Transit Authority. SFY = State Fiscal Year
Source: SFYs 2020–24 MassDOT Capital Investment Plan.
The CIP reflects upcoming capital expenditures by MWRTA and CATA, which are informed by their TAM Plans. CATA’s upcoming capital expenses include replacement vehicle purchases, shelter replacements, improvements to the parking lot at the agency’s Pond Road facility in Gloucester, and purchases of other shop equipment and software. Ongoing capital funding will be needed to support vehicle replacement and facility improvements. Table 3-8 shows that CATA can expect to receive $13.98 million in federal Urbanized Area Formula funds to support its capital investments, which would be matched by RTA CAP and/or local funds on a project-by-project basis. These funds may be supplemented by capital awards from MassDOT’s Community Transit Grant Program, which are made on an annual basis. CATA uses a large share of its Urbanized Area Formula funds for preventative maintenance for its vehicles. CATA staff notes that in recent years, RTA CAP support from MassDOT has made it possible for the agency to catch up on vehicle replacements.
MWRTA’s upcoming capital expenses include continued investment in vehicles, with a goal of replacing one-fifth of its fleet per year, per its 2018 TAM plan.3-19 MWRTA will also invest in bus support equipment and IT infrastructure, and it will maintain and make improvements at both its Blandin Avenue facility in Framingham and at the operations center at the Framingham Commuter Rail Station, which it manages and maintains under contract with the MBTA.
Table 3-9 shows that MWRTA can expect to receive $59.34 million in federal Urbanized Area Formula (Section 5307) funds over the life of Destination 2040. MWRTA typically spends a significant share of these Urbanized Area Formula funds on operating costs each year, as discussed in the Federal Funding for MWRTA section above and in the Transit Operations and Maintenance Financing section later in this chapter. It allocates remaining Urbanized Area Formula funds to capital projects after operating needs are met. MWRTA staff also notes that it seeks additional capital funding to help support MWRTA’s current level of service (provided six days per week); it also seeks to increase frequency and add evening and Sunday service.
Transit agencies in the Boston region must not only invest in the capital assets of their transit systems, but also operate and maintain them on an ongoing basis. This section describes the types of revenues and costs associated with MBTA, CATA, and MWRTA operations and maintenance. This section also provides projections of costs and revenues related to operations and maintenance between now and 2040.
In 2000, the Massachusetts Legislature updated the MBTA’s enabling legislation. This update, commonly referred to as Forward Funding, established the current financing structure of the MBTA. It provided 20 percent of the state sales tax as a dedicated revenue stream for the MBTA and expanded the service area to 175 municipalities for collecting local annual assessments. Revenues from these sources are used primarily to fund operations and maintenance costs for the MBTA, but also are used to secure revenue bonds that the MBTA uses to match federal funds for capital projects. Collectively, sources of MBTA operating funds include the following:
MBTA operating expenses typically include wages, benefits, payroll taxes, materials, supplies, and purchased transportation services. The MBTA is also responsible for debt service payments. MBTA bonds were previously backed by the Commonwealth prior to enactment of the Forward Funding legislation. Upon the effective date of the Forward Funding legislation in 2000, however, contract payments from the state ceased, and all outstanding debt became the MBTA’s responsibility. Overall, the MBTA’s operations and maintenance costs include borrowing and operational costs associated with executing the MBTA’s capital plan.
Since Charting Progress to 2040, the MPO’s 2015 LRTP, the MBTA has made substantial progress in its efforts to reduce the forecasted operating deficit through partnerships, renegotiated and restructured contracts, and restructured and refinanced debt service, as well as by controlling other operating expenses through updated business practices and increased revenues. Table 3-13 shows preliminary projections of available revenue and expenses for the MBTA’s operations and maintenance activities during the Destination 2040 planning period. These estimates reflect baseline service as accounted for in the MBTA’s SFY 2020 budget. These baseline estimates reflect year-over-year inflationary increases for each category of spending on wages, materials, and services and contracts, and they reflect legislatively-approved increases in revenues. The MBTA is actively evaluating the life-cycle costs associated with maintaining a state of good repair and the revenue impacts of major capital investments.
Table 3-13
Projected MBTA Operations and Maintenance Revenues and Expenses
Category |
SFYs 2020–24 |
SFYs 2025–29 |
SFYs 2030–34 |
SFYs 2035–40 |
Operations and Maintenance Revenues |
Null |
Null |
Null |
Null |
Fare Revenue |
$2,914.04 |
$3,272.21 |
$3,700.18 |
$4,166.94 |
Non-Fare Revenue |
$549.43 |
$606.89 |
$685.28 |
$798.25 |
Sales Tax and Local Assessments |
$5,276.45 |
$5,931.93 |
$6,697.62 |
$7,571.06 |
Total Revenues |
$8,739.92 |
$9,811.03 |
$11,083.03 |
$12,536.25 |
Operations and Maintenance Costs |
Null |
Null |
Null |
Null |
Wages, Materials, and Services and Contracts |
$6,912.28 |
$7,732.76 |
$8,807.12 |
$10,090.41 |
Debt Service |
$1,997.20 |
$2,124.03 |
$2,221.38 |
$2,346.99 |
Total Costs |
$8,909.48 |
$9,856.79 |
$11,028.49 |
$12,437.40 |
Difference Between Revenues and Costs |
$-169.56 |
$-45.76 |
$54.54 |
$98.85 |
Additional State Assistance |
$508.00 |
$508.00 |
$508.00 |
$508.00 |
Balance (to MBTA Capital Maintenance Fund Lock Box)a |
$338.44 |
$462.24 |
$562.54 |
$606.85 |
Note: Funding amounts are shown in millions. Totals may not sum due to rounding. These estimates reflect baseline service as accounted for in the MBTA’s SFY 2020 budget. The MBTA is actively evaluating the life-cycle costs associated with maintaining a state of good repair and the revenue impacts of major capital investments.
a Additional State Assistance that is not used to address operating deficits is directed to the MBTA Capital Maintenance Fund Lock Box. The Lock Box, established in 2016, is funded mostly from savings in the operating budget. Money from this fund is available immediately to fund projects not included in the five-year Capital Investment Plan. Selected projects are meant to be near-term and have a direct customer benefit.
MBTA = Massachusetts Bay Transportation Authority. SFY = State Fiscal Year.
Source: MBTA.
The operation and maintenance needs of the MWRTA and CATA are funded through a variety of sources, including
Both RTAs’ operating expenses include administrative staff expenses (salaries, benefits, payroll taxes), vehicle-related expenses, building- and parking-facility related expenses, office and business expenses (such professional services and advertising). MWRTA staff notes that it is able to reduce its energy expenses significantly through the use of its solar photovoltaic canopy. RTA operations and maintenance costs also include purchased transportation; these costs include the operating expenses of the private companies that, under contractual arrangements, operate the RTA’s services, and management fees. The RTAs are required by law to contract out the operation of their transit service to a private company. These operating arrangements are expected to continue in the future.
To produce estimates of CATA’s operating and maintenance costs over the life of Destination 2040, MPO staff obtained a SFY 2020 budget from CATA and projected operations revenues and costs using a 2.08 percent inflation factor to correspond to the expected growth in FTA Urbanized Area Formula funds. Table 3-14 shows projected estimates of CATA’s operations and maintenance revenues and costs over the approximate life of Destination 2040. These expected dollar amounts, particularly in the revenue categories, will be adjusted on an annual basis and may differ compared to the numbers presented in the table. As shown in the table, revenues are expected to cover costs. However, CATA currently provides limited service throughout the service area, with its most frequent bus service provided hourly. Future service improvements, such as more frequent service and service offered later in the day, will require additional support.
Table 3-14
Projected CATA Operations and Maintenance Revenues and Costs by
Destination 2040 Five-Year Time Band
Category |
SFYs 2020–24 |
SFYs 2025–29 |
SFYs 2030–34 |
SFYs 2035–40 |
Operations and Maintenance Revenues |
Null |
Null |
Null |
Null |
FTA Fundsa |
$1.80 |
$2.00 |
$2.22 |
$2.98 |
State Contract Assistance |
$7.45 |
$8.26 |
$9.16 |
$12.31 |
Local Assessments |
$3.08 |
$3.42 |
$3.79 |
$5.10 |
Farebox Revenues |
$0.99 |
$1.10 |
$1.22 |
$1.64 |
Other Revenues |
$2.56 |
$2.84 |
$3.14 |
$4.22 |
Total Revenues |
$15.89 |
$17.61 |
$19.52 |
$26.23 |
Operations and Maintenance Costs |
Null |
Null |
Null |
Null |
Operations and Maintenance Costs |
$15.64 |
$17.34 |
$19.22 |
$25.83 |
Debt Service |
$0.24 |
$0.27 |
$0.30 |
$0.40 |
Total Costs |
$15.89 |
$17.61 |
$19.52 |
$26.23 |
Difference Between Revenues and Costs |
$0.00 |
$0.00 |
$0.00 |
$0.00 |
Note: Funding amounts are shown in millions. Totals may not sum due to rounding. Revenues and costs are expected to increase by 2.08 percent per year.
a This category reflects FTA Urbanized Area Formula (Section 5307) funds. CATA spends these dollars on preventative maintenance, a capital expense, but reflects them as part of their annual operations and maintenance budget.
CATA = Cape Ann Transportation Authority. FTA = Federal Transit Administration. MPO = Metropolitan Planning Organization. SFY = State Fiscal Year.
Sources: CATA and the Boston Region MPO.
Table 3-15 shows projected estimates of MWRTA’s operations and maintenance revenues and costs over the approximate life of Destination 2040, following the same approach used to project CATA’s operations and maintenance revenues and costs. As with the CATA information presented in Table 3-14, dollar amounts, particularly in the revenue categories, will be adjusted on an annual basis, and may differ compared to the numbers presented in the table. As shown below, MWRTA’s revenues are expected to cover costs. It should be noted, however, that the MWRTA provides limited service six days per week. Future service improvements, including evening and Sunday service, will require additional support.
Table 3-15
Projected MWRTA Operations and Maintenance Revenues and Costs by
Destination 2040 Five-Year Time Band
Category |
SFYs 2020–24 |
SFYs 2025–29 |
SFYs 2030–34 |
SFYs 2035–40 |
Operations and Maintenance Revenues |
Null |
Null |
Null |
Null |
FTA Fundsa |
$11.27 |
$12.49 |
$13.84 |
$18.61 |
State Contract Assistance |
$18.09 |
$20.05 |
$22.22 |
$29.87 |
Local Assessments |
$21.79 |
$24.15 |
$26.77 |
$35.98 |
Farebox Revenues |
$3.23 |
$3.58 |
$3.97 |
$5.34 |
Other Revenues |
$4.50 |
$4.99 |
$5.53 |
$7.43 |
Total Revenues |
$58.88 |
$65.26 |
$72.34 |
$97.23 |
Operations and Maintenance Costs |
Null |
Null |
Null |
Null |
Operations and Maintenance Costs |
$57.69 |
$63.94 |
$70.87 |
$95.26 |
Debt Service |
$1.19 |
$1.32 |
$1.46 |
$1.97 |
Total Costs |
$58.88 |
$65.26 |
$72.34 |
$97.23 |
Difference Between Revenues and Costs |
$0.00 |
$0.00 |
$0.00 |
$0.00 |
Note: Funding amounts are shown in millions. Totals may not sum due to rounding.
a This category reflects FTA Urbanized Area Formula (Section 5307) funds. MWRTA spends these dollars on operating costs, particularly for its ADA paratransit service.
ADA = Americans with Disabilities Act. FTA = Federal Transit Administration. MPO = Metropolitan Planning Organization. MWRTA = MetroWest Regional Transit Authority. SFY = State Fiscal Year.
Sources: MWRTA and the Boston Region MPO.
The Boston region’s transportation system is supported by a variety of federal, state, and local funding sources, and a range of agencies, including the MPO, MassDOT, and the region’s public transportation agencies, are responsible for spending them to meet the region’s transportation needs. This chapter provides context about the amount and types of funding resources that are available and how these agencies plan to use them, particularly the Boston Region MPO, which has $2.9 billion in discretionary funding to spend between FFY 2020 and FFY 2040. Chapter 4, The Recommended Plan, provides more detail on the specific projects and programs that the Boston Region MPO and other agencies recommend for investment.
A major component in the development of the Long-Range Transportation Plan (LRTP) is the Recommended Plan. The Recommended Plan cites the regionally significant projects and investment programs that have been selected for funding for the life of the LRTP. This chapter describes the transportation infrastructure that the Boston Region Metropolitan Planning Organization (MPO) expects to fund during the next 20 years. It particularly focuses on those projects and programs that will be funded with MPO discretionary funds, also called Regional Target funds. The chapter begins with an overview of key elements that form the backdrop for these decisions and explains the project and program selection process. It then describes the projects and programs that comprise the Recommended Plan. Finally, this chapter describes the results of the travel demand model and offers an interpretation of the Recommended Plan’s projects and programs.
The ultimate purpose of transportation is to serve human activity; therefore, the MPO challenge for this LRTP continues to be
How can we maintain the transportation network to meet existing needs and adapt and modernize it for future demand within the reality of constrained fiscal resources?
The MPO recognizes the diversity of transportation needs throughout the Boston region. Matters of system preservation and modernization, safety, capacity management and mobility, the environment, economic vitality, and environmental justice all need to be addressed to balance diverse needs and reach the MPO’s goals. The Recommended Plan demonstrates the MPO’s method for reaching this balance to provide adequate funding for major infrastructure projects and investment programs. The definition of a major infrastructure project in the Boston region is one that costs more than $20 million and/or adds capacity to the existing system through the addition of a travel lane, construction of an interchange, the extension of a commuter rail or rapid transit line, or the procurement of additional (not replacement) public transportation vehicles. Other investment programs allow for smaller-scale projects that would be funded through the Transportation Improvement Program (TIP). This Recommended Plan is the MPO’s response to the challenge above, including the issue of diversity.
The Recommended Plan addresses the following problems:
Chapter 1, Introduction and Process, explains the process for developing Destination 2040, and provides an overview of the steps required and information used when selecting the recommended projects and programs included in this LRTP. The steps for developing the LRTP are summarized below along with the chapters that provide additional details on each step:
As described in Chapter 1, the MPO reaffirmed the policy established in Charting Progress to 2040 of setting aside a portion of its discretionary funding toward a set of investment programs. Specifically to continue an operations and management (O&M) approach to programming—giving priority to low-cost, non-major infrastructure projects. The MPO agreed to continue funding the following existing investment programs, which are designed to prioritize the types of transportation projects that the MPO funds through the TIP:
In addition, based on information from the Needs Assessment and public input, the MPO voted to expand the Complete Streets Program to accommodate funding for dedicated bus lanes and associated infrastructure and climate resiliency improvements while the Community Connections Program was expanded to include investments that connect elderly adults to transportation. The MPO also established a new investment program—the Transit Modernization Program.
The MPO reviewed its Charting Progress to 2040 assumptions on investment program sizes. It reviewed the funding levels of the programs funded over the last five TIPs and used input from the Destination 2040 NeedsAssessment to make the following changes:
The inclusion of these investment programs in the Recommended Plan continues to give municipalities the confidence to design projects knowing that there would be funding in the later years of the LRTP. Detailed information on each program is found under the Recommended List of Projects and Programs section of this chapter. The Universe of Programs list is included in Appendix A.
Once the MPO established its investment programs and sizes, the next step was to identify the region’s top-priority highway and transit projects as candidates for funding. As described in Chapter 1, MPO staff developed a Universe of Projects list identifying the major infrastructure projects (projects that cost more than $20 million and/or add capacity to the transportation network) that were active Massachusetts Department of Transportation (MassDOT) projects, conceptual projects identified in the Needs Assessment, and transit projects that were identified in the Massachusetts Bay Transportation Authority’s (MBTA) long-range plan,Focus40as projects to advance over the next 20 years and “Big Idea” projects to be considered in the future. The Universe of Projects list is included in Appendix A.
Staff then evaluated the highway projects in the Universe of Projects list that had been sufficiently well defined to allow for analysis. The MPO’s goals and objectives were used to evaluate the projects. More information on the project evaluation process is included in Appendix B. The MPO also discussed the possibility of flexing discretionary highway funding to transit projects, and this was considered when discussing alternatives for programming in Destination 2040.
With this information, MPO staff developed several possible funding alternatives that fit within the fiscal constraints of the LRTP and reflected the investment program funding goals.
The MPO reviewed and discussed the alternatives in May 2019 and voted to adopt Alternative 4 for the Recommended Plan for the Destination 2040 LRTP. This alternative leaves the majority of funding unallocated in the last time band (FFY 2035–40) for projects that may emerge in the future. It also gives the MPO the option of flexing highway funding to transit projects that may be a priority to the MPO once ongoing transit studies and design of transit projects identified in Focus40 are completed.
This LRTP includes funding to meet transportation needs in the region and address the issues discussed in the Background section above, including maintenance and expansion of the transportation system. Funding for much of the roadway maintenance in the Boston Region MPO area is provided through statewide resurfacing, maintenance, and infrastructure programs. Maintenance of the bridges is provided through the statewide bridge program and the Accelerated Bridge Program.
In the Boston region, the highway network’s major infrastructure and capacity expansion projects, and other maintenance and rehabilitation projects not included in the statewide programs, are funded through the Boston Region MPO’s share of the discretionary capital program or Regional Target funds. The selection of projects and programs using these funds was described in the Project Selection section above. A list of the major infrastructure projects is shown in Table 4-1. Descriptions of each project and the investment programs described in the major infrastructure project descriptions in the next section.
Table 4-1
Major Infrastructure Projects Funded by the MPO in the Recommended Plan
Project Name |
Current Cost |
Reconstruction of Rutherford Avenue, from City Square to Sullivan Square (Boston) |
$152,000,000 |
Roadway, ceiling and wall reconstruction, new jet fans, and other control systems in Sumner Tunnel (Boston) |
$126,544,931 |
Intersection improvements at Route 126 and Route 135/MBTA and CSX Railroad (Framingham) |
$115,000,000 |
Route 4/225 (Bedford Street) and Hartwell Avenue (Lexington) |
$30,557,000 |
Western Avenue (Lynn) |
$36,205,000 |
Bridge replacement, Route 27 (North Main Street) over Route 9 (Worcester Street) and interchange improvements (Natick) |
$25,900,000 |
McGrath Boulevard (Somerville) |
$66,170,710 |
Reconstruction of Route 1A (Main Street) (Walpole) |
$19,906,000 |
Bridge replacement , New Boston Street over the MBTA (Woburn) |
$15,482,000 |
MBTA = Massachusetts Bay Transportation Authority. MPO = Metropolitan Planning Organization.
Source: Boston Region MPO.
In Destination 2040, for the transit network, the MPO has allocated all of the MBTA’s future transit capital funding to system infrastructure maintenance, accessibility improvements, and system enhancements. It also demonstrates the MPO’s commitment to State Implementation Plan projects by programming and funding them.
In addition, to the major infrastructure projects funded with MPO Regional Target funds, this LRTP lists major infrastructure projects that are located in the Boston Region MPO but funded by the Commonwealth. These include the following projects:
Information about these projects is also included in the next section.
The following major infrastructure and expansion projects that are currently under construction are funded in this LRTP:
After accounting for the costs of these ongoing projects, the remaining funds are available for major infrastructure and capacity expansion or set aside for low-cost, non-capacity-adding projects that advance the MPO’s visions and policies. Table 4-1 lists the projects funded under the major infrastructure program and their current costs. Figure 4-1 shows the locations of these projects and whether they are MPO-funded, Commonwealth-funded, or projects under construction. As shown in Table 4-1, the Recommended Plan allocates the majority of highway funding for highway projects. However, it also provides for flexing $49.1 million in highway funding to the Green Line transit project.
FIGURE 4-1
Major Infrastructure Projects in the Recommended Plan
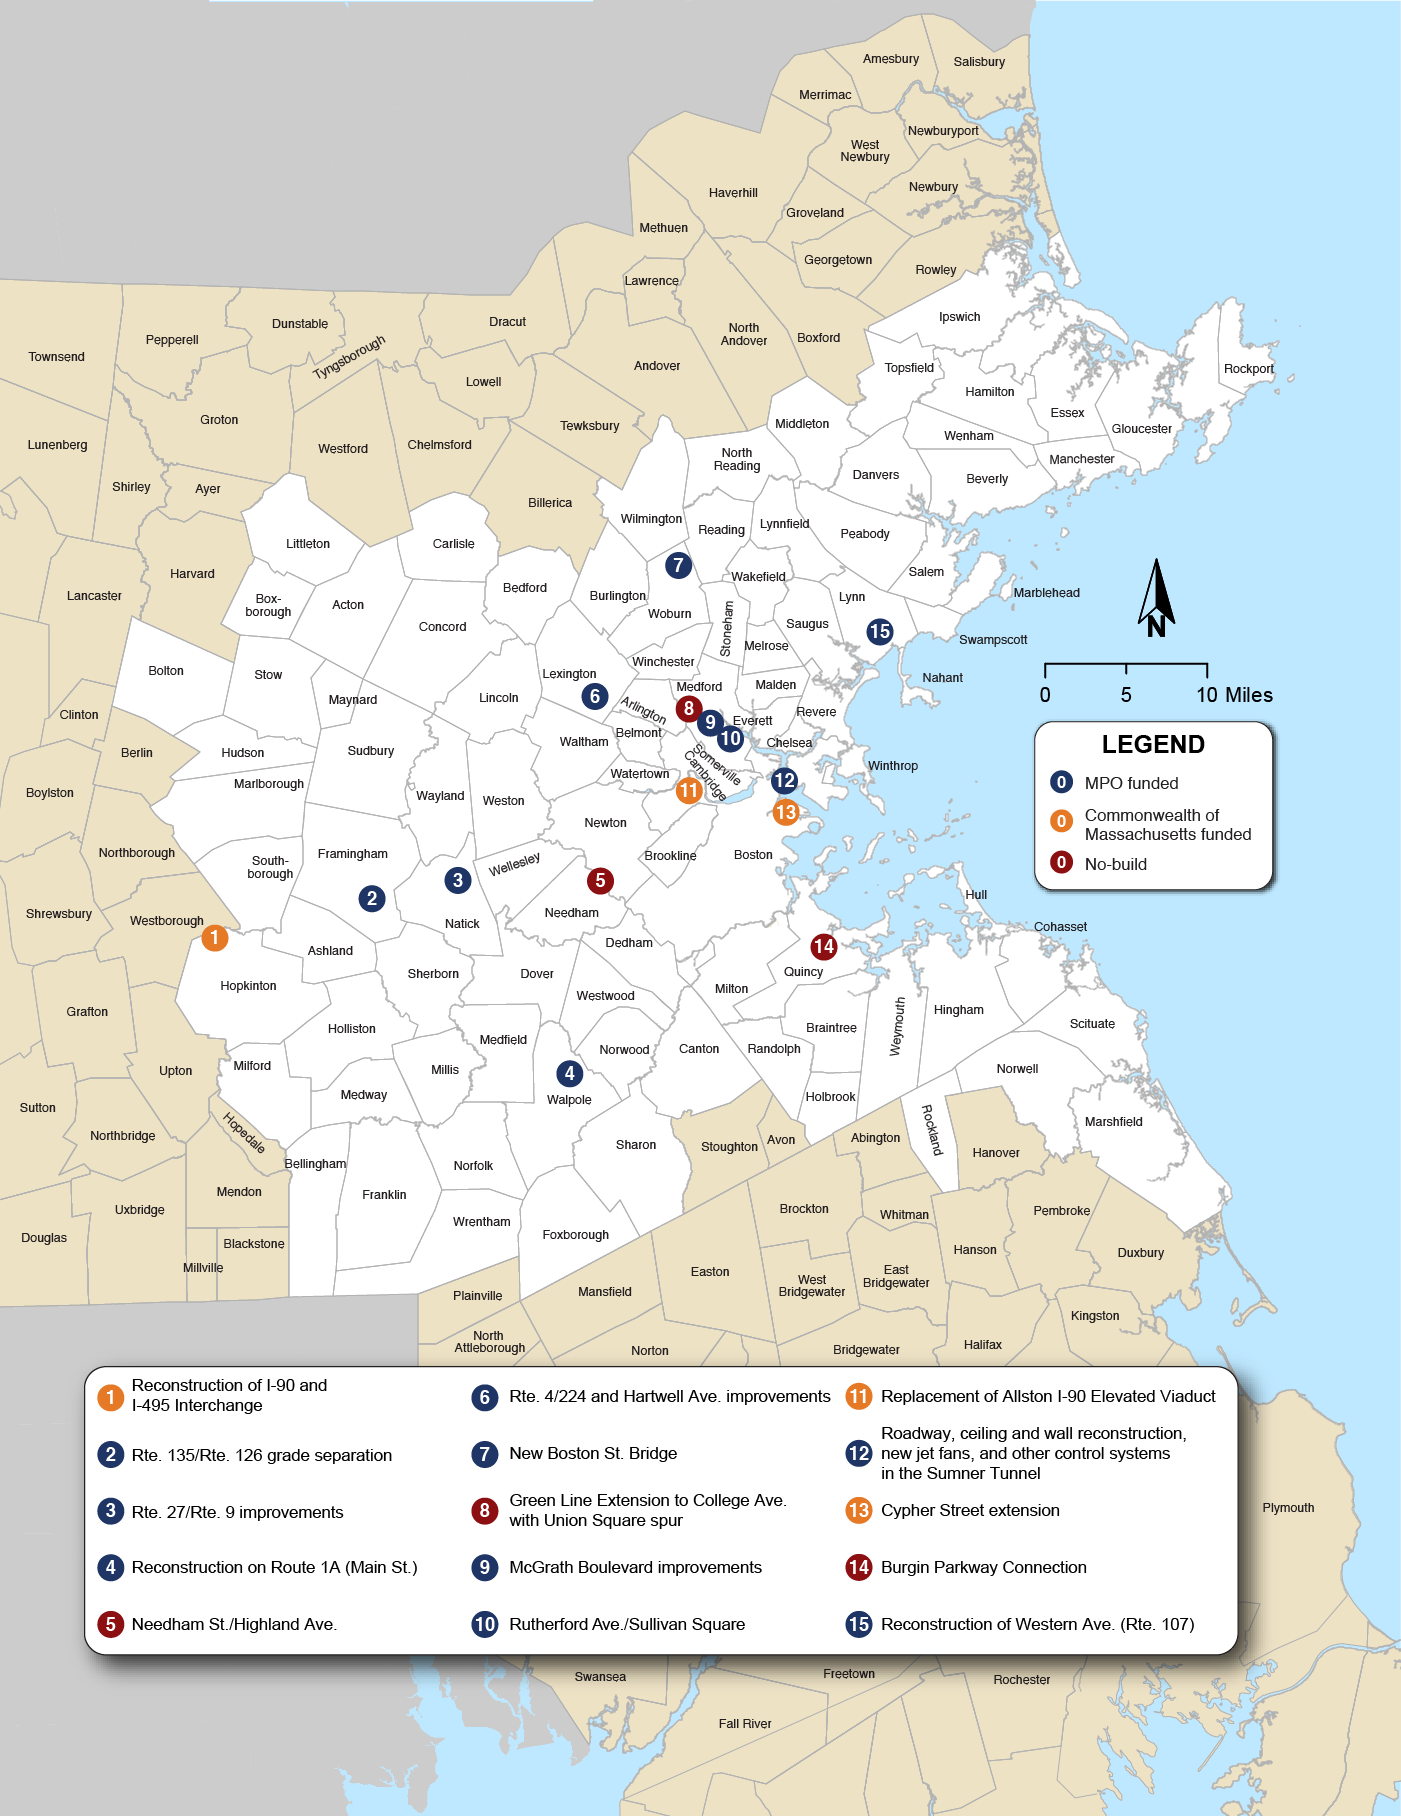
Source: Boston Region MPO.
All public transportation funds are used for improvements to the regional public transportation system. Based on this distinction, the major highway expansion and highway funds flexed to transit projects total approximately $643 million, representing 22 percent of the MPO’s discretionary funds. The MPO also included funding for approximately $1.8 billion (62 percent) in roadway modernization projects and programs, $118 million (4 percent) for transit modernization, and $55 million (2 percent) for a Community Connections program. Table 4-2 shows the total amount of funding dedicated to major infrastructure projects and O&M programs in this LRTP. In the last time band of the LRTP, $284 million (10 percent) is unallocated.
Table 4-2
Funding Dedicated to Investment Programs in the Recommended Plan
Program |
Dedicated Funding |
MPO Discretionary Capital Program: Major Infrastructure Projects |
$594,099,800 |
MPO Discretionary Capital Program: Highway Funds Flexed to Transit |
$49,131,200 |
MPO Discretionary Capital Program: Complete Streets Program |
$1,296,464,600 |
MPO Discretionary Capital Program: Intersection Improvement Program |
$367,057,800 |
MPO Discretionary Capital Program: Bicycle/Pedestrian Program |
$139,360,300 |
MPO Discretionary Capital Program: Community Connections Program |
$55,413,900 |
MPO Discretionary Capital Program: Transit Modernization |
$118,534,700 |
MPO Discretionary Capital Program: Unassigned Funds |
$283,798,100 |
Total Highway Funding |
$2,903,860,400 |
MPO = Metropolitan Planning Organization.
Source: Boston Region MPO.
Table 4-3 lists the highway projects funded under the Major Infrastructure Program and other investment programs established for O&M projects, their costs, and the period in which they are projected to be programmed. The list also includes the no-build projects (projects that are advertised, under construction, or in the first year of the current TIP) and projects funded by the Commonwealth. It includes the Green Line Extension to College Avenue with a spur to Union Square transit project, which is using highway funds flexed to transit.
Pursuant to federal guidance on allowing for inflation, costs associated with each highway project are based on the current estimated cost plus four percent per year through the year of construction. (Figure 4-1 shows the location of each project.) The next section of this chapter first provides a detailed description, current cost, and map for each major infrastructure highway project in the Recommended Plan; it also provides a detailed description of the other investment programs.
TABLE 4-3
Major Infrastructure Projects Programmed with Highway Funding in the Recommended Plan with Costs
| Project Name |
Current Cost |
Investment Category |
FFY |
FFY 2025–29 |
FFY |
FFY |
MPO |
Other Funding (Non-MPO Funds) |
|---|---|---|---|---|---|---|---|---|
Reconstruction of Highland Avenue, Needham Street, and Charles River Bridge, from Webster Street to Route 9 (Newton and Needham) |
$29,601,436 |
MI |
$17,405,937 |
|
|
|
$17,405,937 |
|
New connection from Burgin Parkway over the MBTA (Quincy) |
$9,156,500 |
MI |
|
|
|
|
|
$9,156,500 |
Green Line Extension to College Avenue with Union Square Spur (Somerville and Medford) |
$49,131,200 |
MI |
$49,131,200 |
|
|
|
$49,131,200 |
|
Cypher Street Extension (Boston) |
$9,323,250 |
MI |
$9,323,250 |
|
|
|
|
$9,323,250 |
Reconstruction of Rutherford Avenue, from City Square to Sullivan Square (Boston) |
$152,000,000 |
MI |
$111,685,278 |
$31,735,792 |
|
|
$143,421,070 |
$8,578,930 |
Roadway, Ceiling, and Wall Reconstruction, New Jet Fans, and other Control Systems in Sumner Tunnel (Boston) |
$126,544,931 |
MI |
$22,115,687 |
|
|
|
$22,115,687 |
$104,429,244 |
Allston Multimodal Project (Boston) |
$1,200,000,000 |
MI |
|
|
$1,200,000,000 |
|
|
$1,200,000,000 |
Reconstruction of Interstate 495 and Interstate 90 Interchange (Hopkinton and Westborough) |
$321,000,000 |
MI |
$321,000,000 |
|
|
|
|
$321,000,000 |
Intersection Improvements at Route 126 and Route 135/MBTA and CSX Railroad (Framingham) |
$115,000,000 |
MI |
|
|
$165,264,400 |
$18,854,300 |
$184,118,700 |
|
Route 4/225 (Bedford Street) and Hartwell Avenue (Lexington) |
$30,557,000 |
MI |
|
|
$48,922,700 |
|
$48,922,700 |
|
Reconstruction of Western Avenue (Route 107) (Lynn) |
$36,205,000 |
MI/CS |
|
$44,048,918 |
|
|
$44,048,918 |
|
Bridge Replacement, Route 27 (North Main Street) over Route 9 (Worcester Street), and Interchange Improvements (Natick) |
$25,897,370 |
MI |
|
$31,508,110 |
|
|
$31,508,110 |
|
McGrath Boulevard (Somerville) |
$66,170,710 |
MI |
|
$76,091,250 |
$10,984,800 |
|
$87,076,050 |
|
Reconstruction on Route 1A (Main Street) (Walpole) |
$19,906,002 |
CS |
$19,906,002 |
|
|
|
$19,906,002 |
|
Bridge Replacement, New Boston Street over MBTA (Woburn) |
$15,482,660 |
MI |
$15,482,660 |
|
|
|
$15,482,660 |
|
Complete Streets Program |
|
CS |
$229,652,050 |
$275,076,124 |
$337,757,852 |
$453,978,581 |
$1,296,464,607 |
|
Bicycle and Pedestrian Program |
|
B/P |
$20,825,555 |
$30,564,014 |
$37,528,650 |
$50,442,065 |
$139,360,284 |
|
Intersection Improvement Program |
|
INT |
$58,867,483 |
$79,466,436 |
$97,574,491 |
$131,149,368 |
$367,057,778 |
|
Community Connections |
|
CC |
$8,000,000 |
$12,225,606 |
$15,011,460 |
$20,176,826 |
$55,413,892 |
|
Transit Modernization Program |
|
TM |
|
$30,564,014 |
$37,528,650 |
$50,442,065 |
$118,534,729 |
|
Total Available Regional Highway Target Funds |
|
|
$533,165,850 |
$611,280,276 |
$750,573,005 |
$1,008,841,291 |
$2,903,860,422 |
$1,652,487,924 |
Total Programmed Regional Highway Target Funds |
|
|
$533,165,850 |
$611,280,264 |
$750,573,003 |
$725,043,205 |
$2,620,062,322 |
|
Regional Highway Target Funds Available |
|
|
$0 |
$12 |
$2 |
$283,798,086 |
$283,798,100 |
|
Percentage of Allocated Funding |
|
|
100% |
100% |
100% |
72% |
90% |
|
Major Infrastructure |
|
|
$215,820,762 |
$183,384,070 |
$225,171,900 |
$18,854,300 |
$643,231,032 |
|
Complete Streets |
|
|
$229,652,050 |
$275,076,124 |
$337,757,852 |
$453,978,581 |
$1,296,464,607 |
|
Bicycle and Pedestrian |
|
|
$20,825,555 |
$30,564,014 |
$37,528,650 |
$50,442,065 |
$139,360,284 |
|
Intersection Improvement Program |
|
|
$58,867,483 |
$79,466,436 |
$97,574,491 |
$131,149,368 |
$367,057,778 |
|
Community Connections |
|
|
$8,000,000 |
$12,225,606 |
$15,011,460 |
$20,176,826 |
$55,413,892 |
|
Transit Modernization |
|
|
$0 |
$30,564,014 |
$37,528,650 |
$50,442,065 |
$118,534,729 |
|
Unallocated Funds |
|
|
$0 |
$12 |
$2 |
$283,798,086 |
$283,798,100 |
|
Total |
|
|
$533,165,850 |
$611,280,276 |
$750,573,005 |
$1,008,841,291 |
$2,903,860,422 |
|
Major Infrastructure |
|
|
40% |
30% |
30% |
2% |
22% |
|
Complete Streets |
|
|
43% |
45% |
45% |
45% |
45% |
|
Bicycle and Pedestrian |
|
|
4% |
5% |
5% |
5% |
5% |
|
Intersection Improvement Program |
|
|
11% |
13% |
13% |
13% |
13% |
|
Community Connections |
|
|
2% |
2% |
2% |
2% |
2% |
|
Transit Modernization |
|
|
0% |
5% |
5% |
5% |
4% |
|
Unallocated Funds |
|
|
0% |
0% |
0% |
28% |
10% |
|
Total |
|
|
100% |
100% |
100% |
100% |
100% |
|
B/P = Bicycle and Pedestrian Program. CC = Community Connections Program. CS = Complete Streets Program. FFY = Federal Fiscal Year. INT = Intersection Improvement Program. MBTA = Massachusetts Bay Transportation Authority. MI = Major Infrastructure Program. MPO = Metropolitan Planning Organization. TM = Transit Modernization Program.
Source: Boston Region MPO.
The Rutherford Avenue project seeks to transform the corridor’s highway-like design into a multimodal urban boulevard. The Rutherford Avenue corridor in the Charlestown neighborhood of Boston extends about 1.5 miles from the North Washington Street Bridge to the Sullivan Square MBTA Orange Line station and then to the Alford Street Bridge at the Mystic River. The existing corridor consists of eight to 10 lanes of median-divided highway that facilitate high-speed automobile travel. Although this roadway layout served high volumes of traffic during construction of the Central Artery/Tunnel project, it now acts as a barrier to the neighborhood. The existing roadway creates significant challenges and safety issues for pedestrians and bicyclists seeking to reach various destinations, including Bunker Hill Community College, Paul Revere Park, the Hood Business Park and Schrafft’s Center employment areas, and MBTA rapid transit stations.
The proposed roadway design includes mobility improvements for all modes through widened sidewalks, a multi-use path system with a 3.5-acre linear buffer park, separated bicycle lanes, and exclusive bus lanes to improve bus operations. The exclusive bus lanes are planned at City Square and at the Sullivan Square Station. The project provides improvements around Sullivan Square by reconfiguring the roadways into an urban grid system of streets to regularize traffic movements. The urban grid will maintain the underpasses at Sullivan Square and Austin Street to reduce vehicle conflicts and allow more signal time to be reallocated to pedestrian crossings. The proposed cross section includes an eight- to 16-foot-wide landscaped median and reduced roadway with three lanes southbound and two lanes northbound, with turn lanes at intersections. This project will include adaptive traffic signals with transit priority to help manage traffic congestion and protect Main Street from cut-through traffic.
The designation of exclusive bus lanes at Sullivan Square Station also will improve operations for the 12 MBTA bus routes serving the station that provide almost 900 bus trips and serve 15,000 Orange Line passengers each day. The safety and convenience of street crossings for pedestrians accessing MBTA services will be improved. The exclusive bus lanes at City Square will help facilitate buses from Route 1 to the North Washington Street Bridge and link to bus lanes across the Bridge to Haymarket.
By transforming the highway-like roadway into a multimodal urban boulevard, the project will improve pedestrian and bicycle safety, and access to the Community College and Sullivan Square MBTA stations on the Orange Line. The livability elements consist of adding sidewalks, creating a 20- to 40-foot linear park with a 12- to 14-foot wide bicycle path and 10-foot wide pedestrian path, installing eight new traffic signals with crosswalks, planting numerous trees and landscape elements, and a six-foot separated bike lane in the southbound direction. The existing eight-foot wide pedestrian bridge crossing over Rutherford Avenue at the Community College will be replaced with a wider, American with Disabilities Act (ADA)-compliant bridge that can also accommodate bicycles.
A road safety audit will be completed for the corridor.
Nine lane-miles of substandard pavement will be replaced and three substandard bridges eliminated as part of this project.
This project will create public and open space.
This project is not in an environmental justice area, but it is within one-half mile of an environmental justice area in the neighboring city of Somerville.
The plans for reconfiguring the Sullivan Square roadway network also provide an opportunity to create land parcels for transit-oriented-development that will be well suited and well located for commercial and residential redevelopment by the private sector. Many of the parcels in the Sullivan Square area are publicly owned, by either the MBTA or the City of Boston, which creates the potential for public-private partnerships.
Figure 4-2
Rutherford Avenue/Sullivan Square Project Area
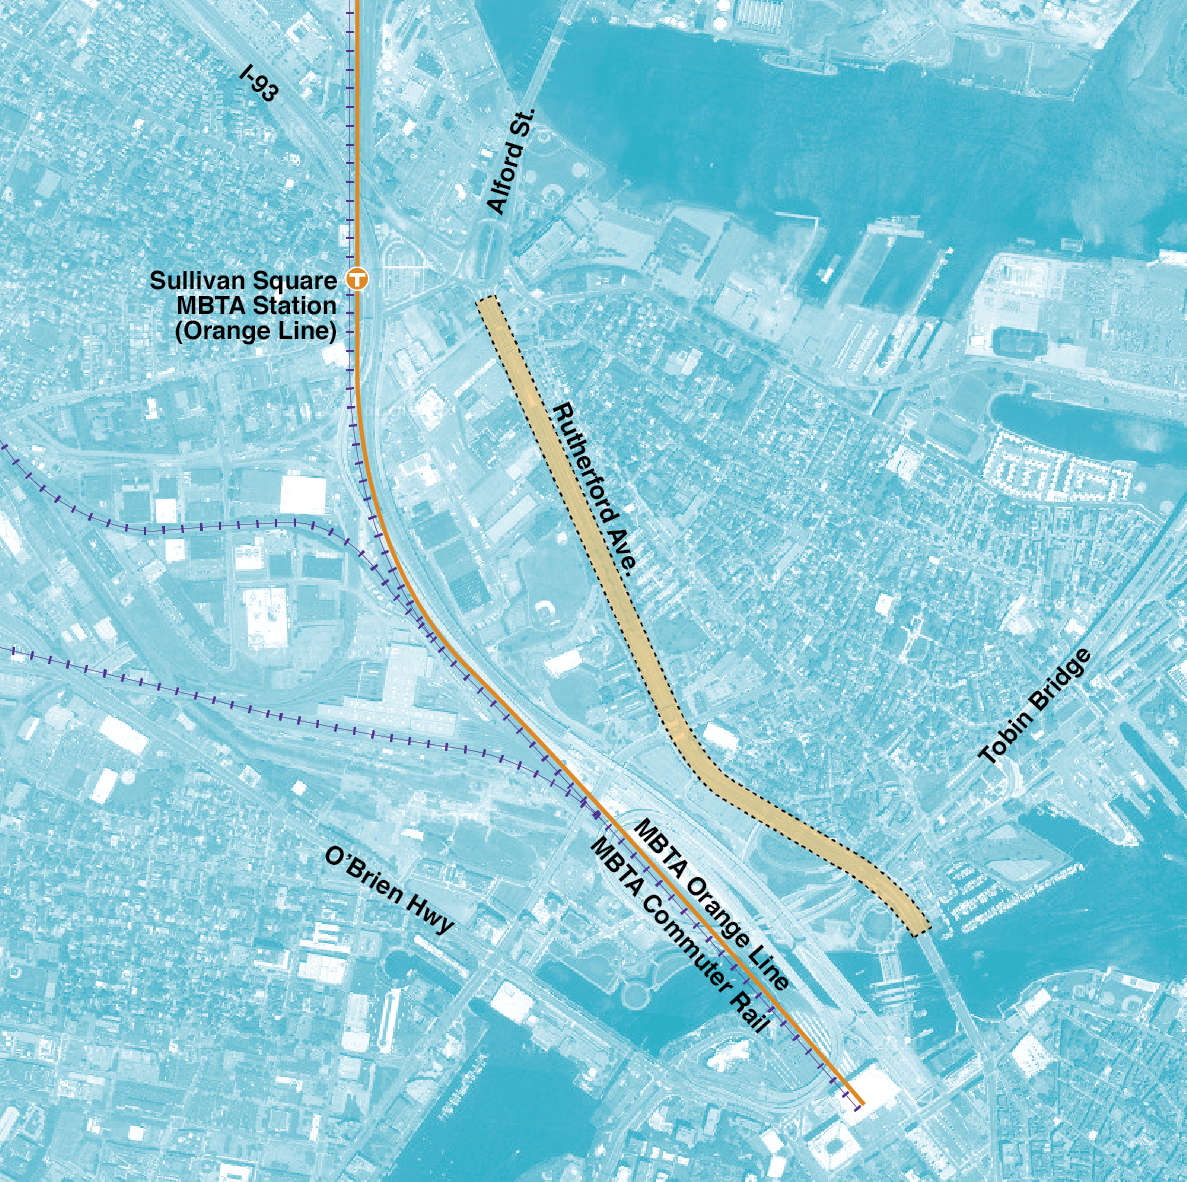
Source: Boston Region MPO.
This project will repair the existing deterioration in the Sumner Tunnel by reconstructing the roadway pavement, replacing existing jet fans with modern enhancements, and repairing cracking and corrosion on the tunnel’s walls and ceiling. The total cost of this project is $126,544,900 with $22,115,700 of the Boston Region MPO Regional Target funding allocated to the project. The remainder of the project will be funded with statewide funds.
This is a major civil engineering structure that needs to be substantially rebuilt on a 50-year cycle.
Completion of this project may facilitate development near the tunnel portals.
Figure 4-3
Roadway, Ceiling and Wall Reconstruction, New Jet Fans, and Other Control Systems in Sumner Tunnel Project Area
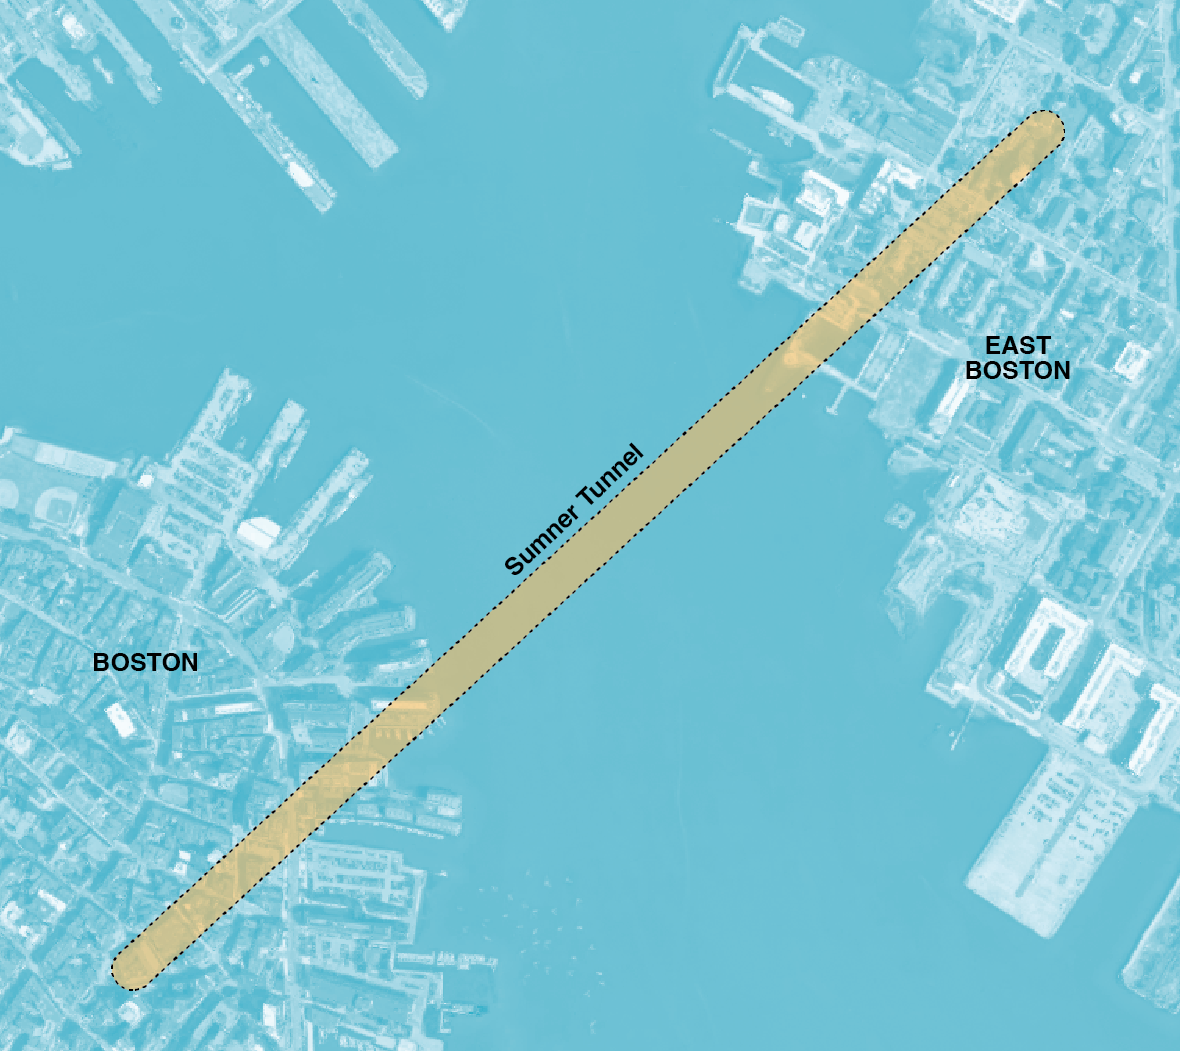
Source: Boston Region MPO.
This project would provide a grade-separated crossing at the intersection of Route 135 and Route 126. Route 135 would be depressed under Route 126 with Route 126 approximately maintaining its existing alignment. The depressed section of Route 135 would extend from approximately 500 feet to the west and east of Route 126. Route 126 would continue to cross the Worcester commuter rail line at grade, but traffic on both Routes 135 and 126 would be significantly less affected by rail operations with this grade separation.
This project will allow traffic on Route 135 to bypass the intersection with Route 126. According to MassDOT 2018 traffic volume data, average daily traffic at this location is 40,800 vehicles on Route 126 and 24,000 vehicles on Route 135. The Route 126/Route 135 intersection functions at level of service (LOS) F in the AM and PM peak periods.
The Framingham commuter rail station is located near the project site, and key Metrowest bus Routes 2, 3, and 7 now terminate at the station. Pedestrian and bicycle access to the station via Route 126 from the south will be improved since most of Route 135 traffic would now be below grade.
This project area includes one of the top-200 Massachusetts crash locations, a situation that has existed for a number of years. Over the 2014–16 period there were 93 crashes, 22 of which involved bodily injury.
This project will rebuild one-half mile of roadway.
Pedestrian and bicycle accommodations will be provided.
This project is entirely within an environmental justice area.
This project is entirely within an MPO-designated priority development area as well as the core of the city’s Central Business District, which was recently rezoned to encourage mixed-use, transit-oriented development. The City of Framingham’s central business district, which according to the Executive Office of Environmental Affairs and the Metropolitan Area Planning Council’s build-out analysis is subject to absolute development constraints, is a designated redevelopment district. According to the Route 126 Corridor Study, the construction of this project would help facilitate redevelopment by making the downtown area more attractive and providing redevelopment sites through the partial taking of business sites as necessary for the roadway work. As currently envisioned, the project includes many streetscape amenities to improve pedestrian and other non-vehicular access. The project also eliminates a significant congestion point in downtown Framingham.
Figure 4-4
Route 126/Route 135 Grade Separation Project Area
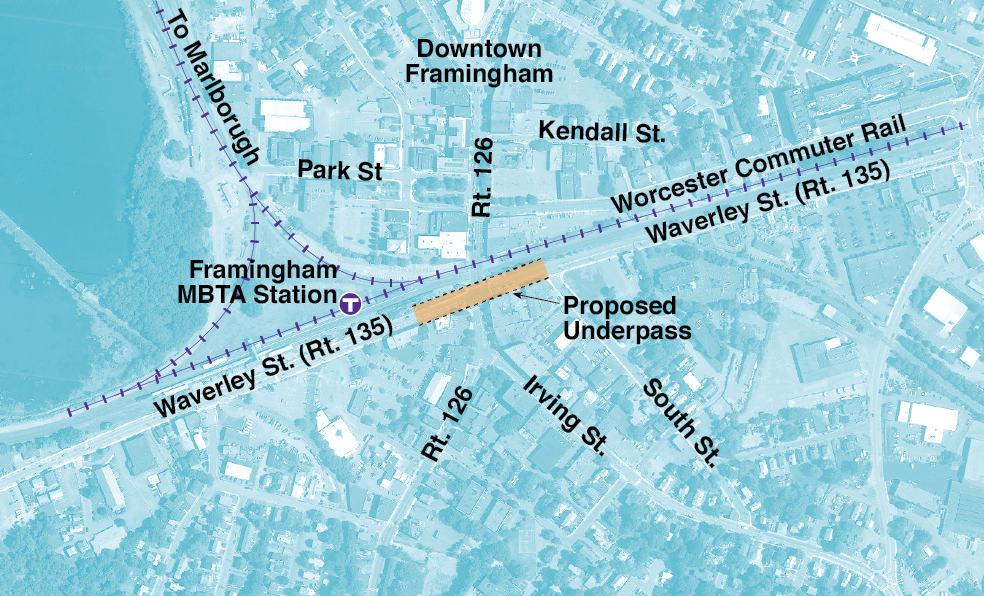
Source: Boston Region MPO.
This project will widen portions of Routes 4/225 (Bedford Street) and Hartwell Avenue to facilitate traffic flow, including pedestrian and transit, between I-95/Route 128 and employment centers along Hartwell Avenue and at Hanscom Field and the Town of Bedford. New bicycle and pedestrian facilities will be constructed as part of this project.
Additional lanes will be added and will facilitate traffic flow in the project area.
The MBTA and a local transportation management association operate several bus routes in this corridor. Improvements that improve traffic flow will also improve bus operations.
New bicycle and pedestrian facilities will be constructed as part of this project. Pedestrian improvements will enhance rider access to transit.
There are four Highway Safety Improvement Program (HSIP) clusters in the project area.
Eight lane-miles of substandard pavement will be replaced as part of this project.
New bicycle and pedestrian facilities will provide important extensions to the trunk of the Minuteman Commuter Bikeway. Multimodal improvements will also enhance access to transit.
This project is not within an environmental justice area.
The Town is considering zoning in the project area that will continue to improve the area’s economic vitality.
Figure 4-5
Routes 4/225 (Bedford Street) and Hartwell Avenue Project Area
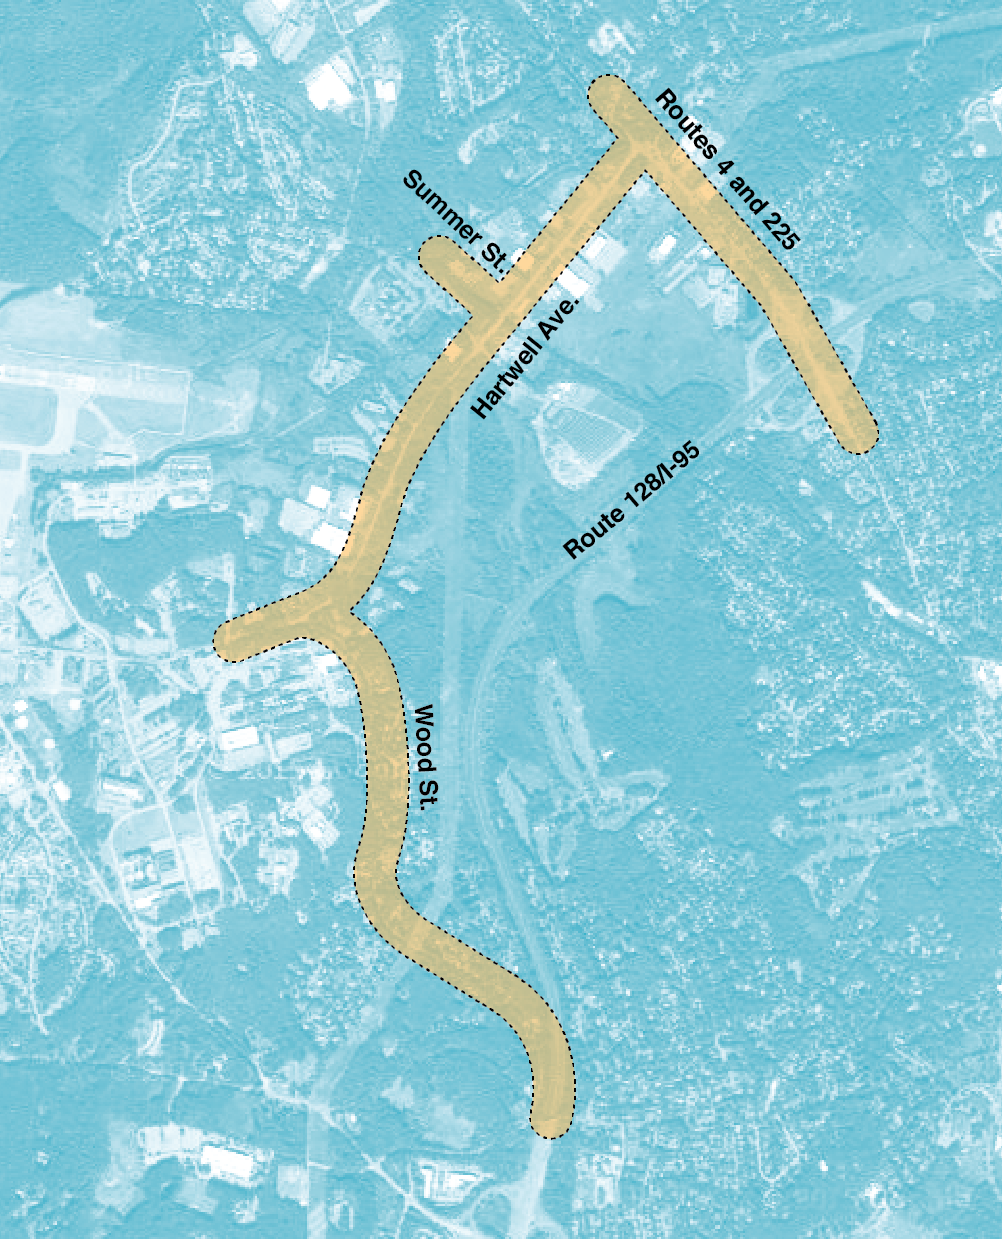
Source: Boston Region MPO.
This project will reconstruct 1.9 miles of Western Avenue (Route 107) in Lynn between Centre Street and Eastern Avenue. Work will include roadway pavement reconstruction, drainage improvements, improved design for traffic operations and safety, new signs and pavement markings, and bicycle and ADA-compliant pedestrian improvements.
Proposed improvements to intersection design and signal timing will improve the LOS to acceptable levels throughout the corridor during AM and PM peak periods. In addition, roadway operational improvements are anticipated to improve safety.
MBTA bus routes 424, 434, and 450 serve this section of Western Avenue. The City will be evaluating transit signal priority and bus rapid transit during the design phase and improving bus stop locations throughout the corridor.
Bicycle facilities will be incorporated within the project, including separated facilities where feasible.
Over the 2014–16 period, the project area experienced 760 crashes, 195 of which involved bodily injury. In addition, roadway operational improvements are anticipated to improve safety.
The roadway will be completely reconstructed.
The addition of bicycle facilities and pedestrian improvements will provide transportation options that could shift travelers away from the single-occupant vehicle.
The project area meets equity criteria for minority, low English proficiency, and disabled populations, and low-income and zero-vehicle households. Project-area residents will benefit primarily from intersection safety improvements and new, corridor-length bicycle lanes.
Western Avenue conveys both transit and vehicular population to and from residences, local businesses, offices, restaurants, and grocery stores along the corridor, as well as providing regional roadway and transit connectivity between Salem and Peabody to the north and Boston to the south. Improving safety, efficiency, and aesthetics along the corridor for all users will further the City of Lynn’s goals to promote investment and quality development along Western Avenue and throughout the City. Western Avenue will provide regional access via Route 107 to the One Lynn District, a MassDevelopment Transformative Development Initiative district in the City’s downtown offering arts-based residential, retail, and diverse restaurant development in proximity to the Central Square MBTA commuter rail station.
Figure 4-6
Reconstruction of Western Avenue (Route 107) Project Area
Source: Boston Region MPO.
The project involves modifying the existing three quadrant cloverleaf interchange to provide a partial cloverleaf ramping system with auxiliary lanes on Route 9. The project includes replacing the substandard bridge, approach work, and drainage improvements and adding bike lanes and sidewalks where the infrastructure does not exist.
The interchange experiences peak-period queuing, resulting in traffic backups onto Route 9. The proposed simplified ramp system and the addition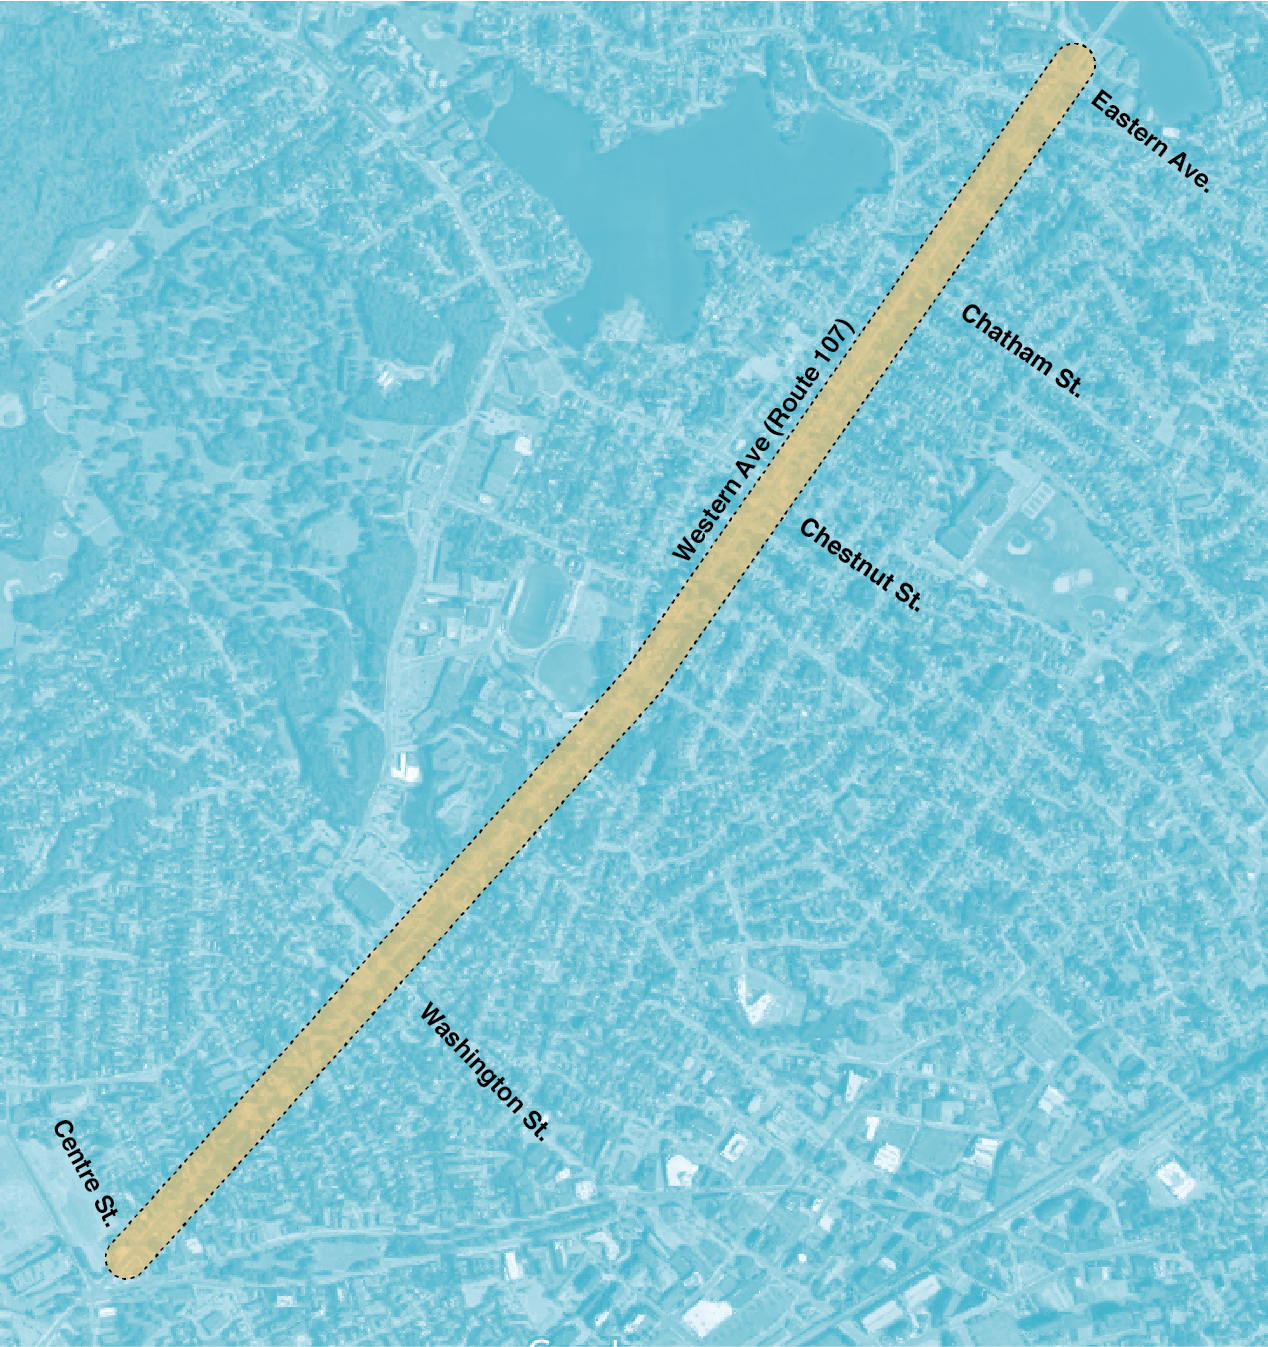 of auxiliary lanes on Route 9 will improve traffic flow through the interchange system.
There are currently no compliant sidewalks or bike lanes on the bridge. Only one side of the bridge has sidewalks, which are in poor condition. This project will also provide a pedestrian and bicycle link between the neighborhoods north of Route 9 with Natick Center and the Cochituate Rail Trail.
Roadway geometry and sight distances do not meet modern safety standards. The interchange currently does not accommodate pedestrian and bicycle travel. Over the 2014–16 period there were 362 crashes, 37 of which involved bodily injury.
The bridge was built in 1931 and, because of advanced deterioration, is now on a MassDOT accelerated inspection program.
Route 9 experiences localized flooding under this bridge during storms. The capacity of the drainage system will be expanded as part of this project. The sidewalk system will be reconstructed to modern standards, including improved access to MetroWest bus stops.
The project area meets equity criteria for elderly population. Project area residents will benefit primarily from the reconstructed sidewalk system.
The reconstructed interchange will improve truck movements through this area. The project environs has a number of truck dependent commercial activities.
Figure 4-7
Bridge Replacement, Route 27 (North Main Street) over Route 9 (Worcester Street) and Interchange Improvements Project Area
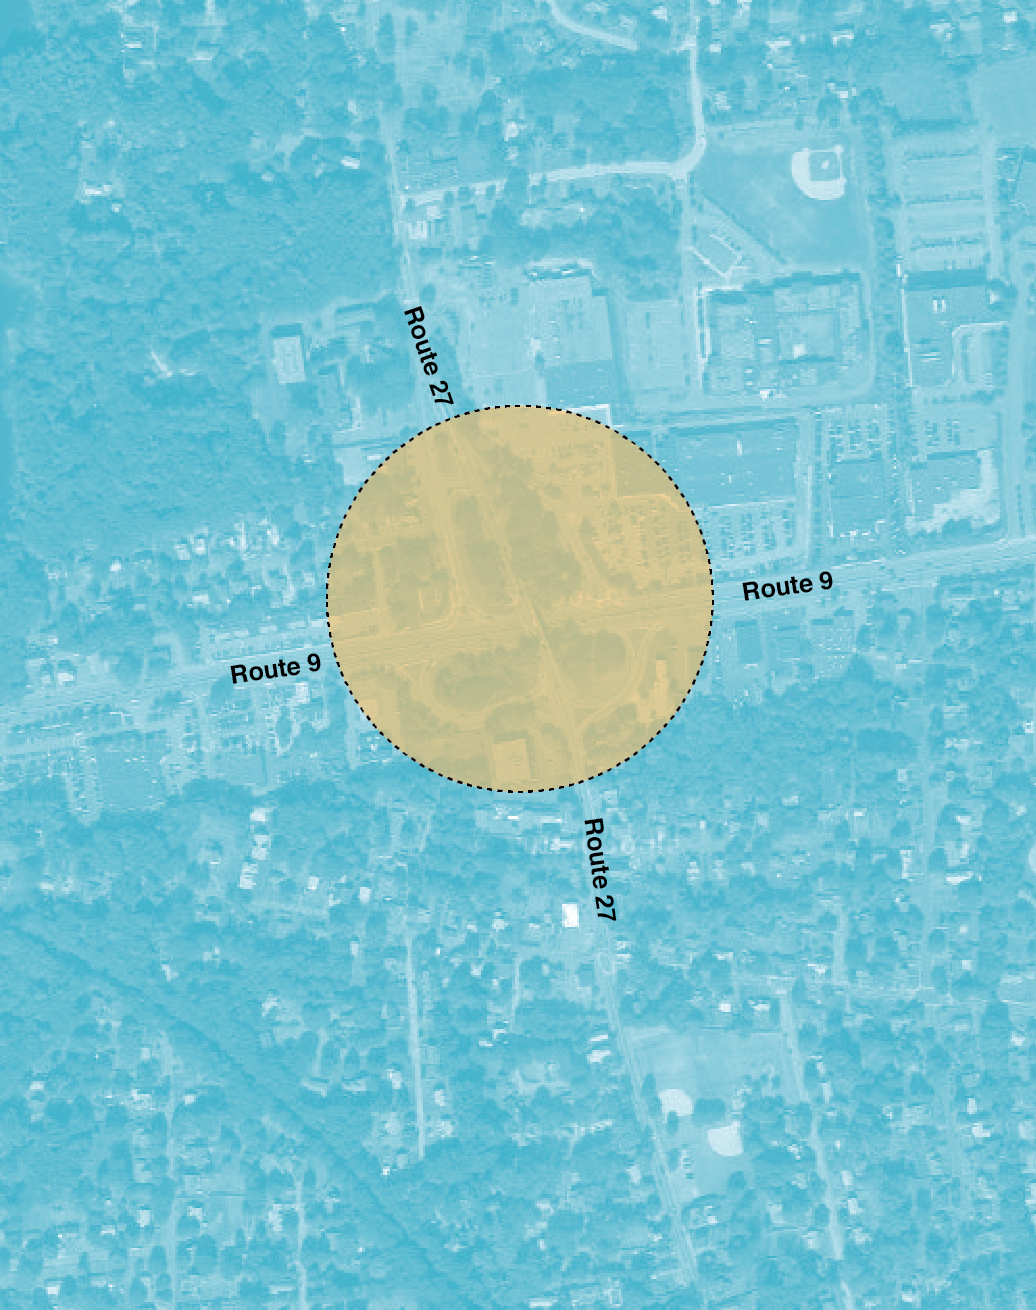
Source: Boston Region MPO.
The proposed improvements will remove the existing McCarthy Viaduct and replace it with an at-grade urban boulevard, approximately 0.7 miles long, from the Gilman Street Bridge in the north to Squires Bridge in the south. The project will provide pedestrian and bicycle accommodation along the length of the reconstructed corridor, and opportunities for dedicated bus lanes/queue jump facilities are being considered. The project will result in more conventional intersection configurations at Washington Street and Somerville Avenue, which are currently under or next to the viaduct. Removing the viaduct will physically reconnect the neighborhoods of Somerville with more direct vehicle, pedestrian, bicycle, and transit networks.
The proposed McGrath Boulevard will create conventional intersections that provide clear direction and safer operation for all modes of transportation along the corridor.
MBTA Routes 80 and 88 provide bus service in this corridor with connections to the MBTA Green Line at Lechmere Station, and will have direct access to the Green Line Extension in the future, connecting the corridor to Boston, Cambridge, and Medford. Removing the viaduct will provide additional connectivity for existing bus routes along and across the proposed McGrath Boulevard.
New sidewalks and bicycle facilities will be provided for the length of the proposed McGrath Boulevard and will connect with the extended Community Path, creating access to a more regional bicycle transportation network. The proposed facilities will provide direct intermodal connections to existing bus routes and the new Green Line Station.
There is one HSIP crash cluster in the project area, as well as a bicycle and pedestrian crash cluster.
Three lane-miles of substandard pavement, 1.5 miles of substandard sidewalk, and a substandard bridge will be improved as part of this project. Eliminating the McCarthy viaduct also will serve to reduce long-term maintenance costs.
The project area meets equity criteria for minority, limited English proficiency, and disability populations, and low-income and zero-vehicle households. Most of the safety, transit, and bicycle/pedestrian mobility benefits will be realized by project area residents.
The project provides access to the Inner Belt/Brickbottom, Union Square, and Boynton Yards Priority Development Areas in Somerville, which are designated for high-intensity, equitable, transit-oriented, mixed-use commercial and residential development. Redeveloping these three areas in Somerville should add 3,000 new housing units (at least 600 of which are permanently affordable to low- and moderate-income households) and an additional 6.5 million square feet of commercial development.
Figure 4-8
McGrath Boulevard Project Area
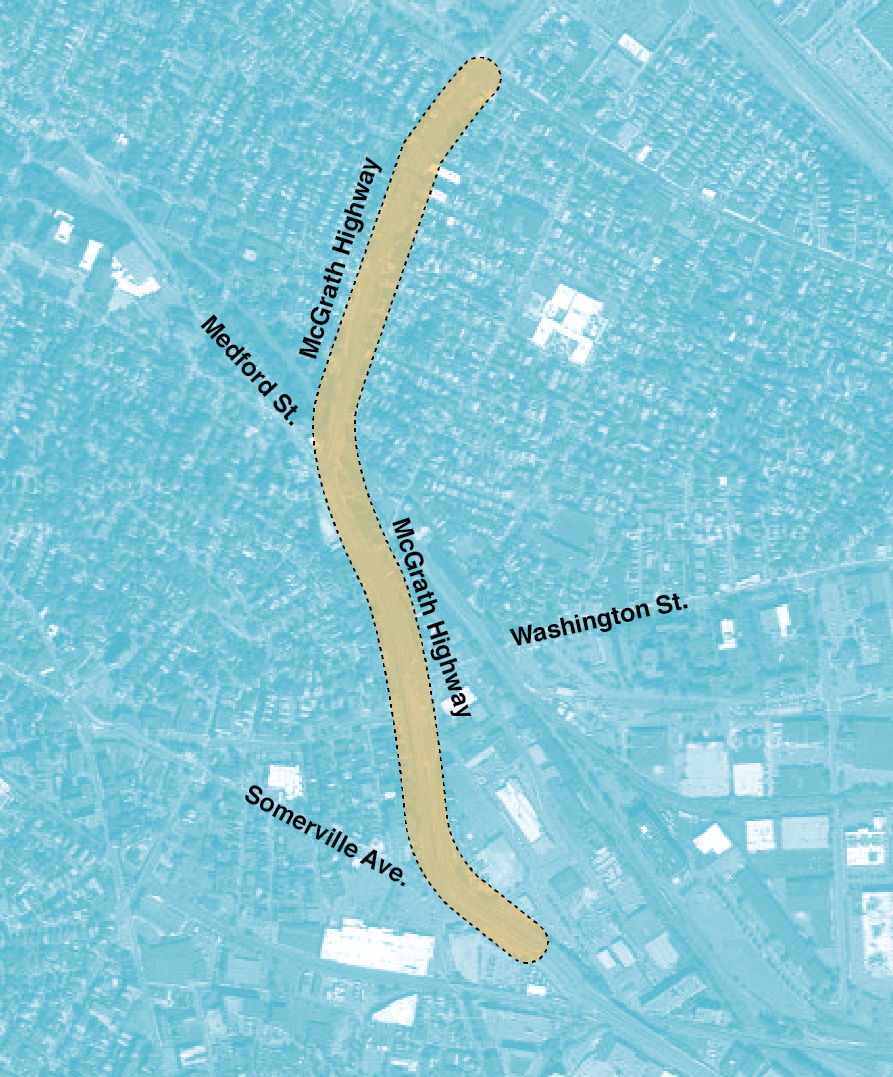
Source: Boston Region MPO.
The purpose of this project is to improve safety and overall traffic operation conditions along Route 1A just north of Route 27 to the Norwood town line (approximately 2.14 miles). Route 1A will have a uniform roadway width allowing room for bicycle travel. There will be new sidewalks along both sides of the road except for the segment between Bullard/Willet Street intersection and the Norwood town line.
This project also includes intersection improvements. Signal timing and phasing will be coordinated to provide the optimal traffic operation through the Route 1A corridor. An emergency pre-emption system and a pushbutton actuated pedestrian phase will also be included as a part of the proposed signal system. Pedestrian crosswalks will be provided at the intersections. The intersections with Route 1A include the following:
This project includes intersection improvements. Signal timing and phasing will be coordinated to provide the optimal traffic operation through the Route 1A corridor.
New sidewalks will be constructed along both sides of the road through a portion of the project area. An emergency pre-emption system and a pushbutton actuated pedestrian phase will also be included as a part of the proposed signal system. Pedestrian crosswalks will be provided at the intersections.
The project area has two HSIP high-crash locations. Sidewalks in the project area are either substandard or do not exist.
Pavement is in poor condition and pavement markings are almost nonexistent.
Adding or rebuilding sidewalks will expand the use of walking in the corridor. There is an overall air quality benefit from the proposed improvements.
This project is not within an environmental justice area.
About one-third of the corridor frontage is commercial. Missing sidewalks and the lack of defined curb cuts creates problems related to both safety and commercial access.
Figure 4-9
Route 1A Reconstruction Project Area
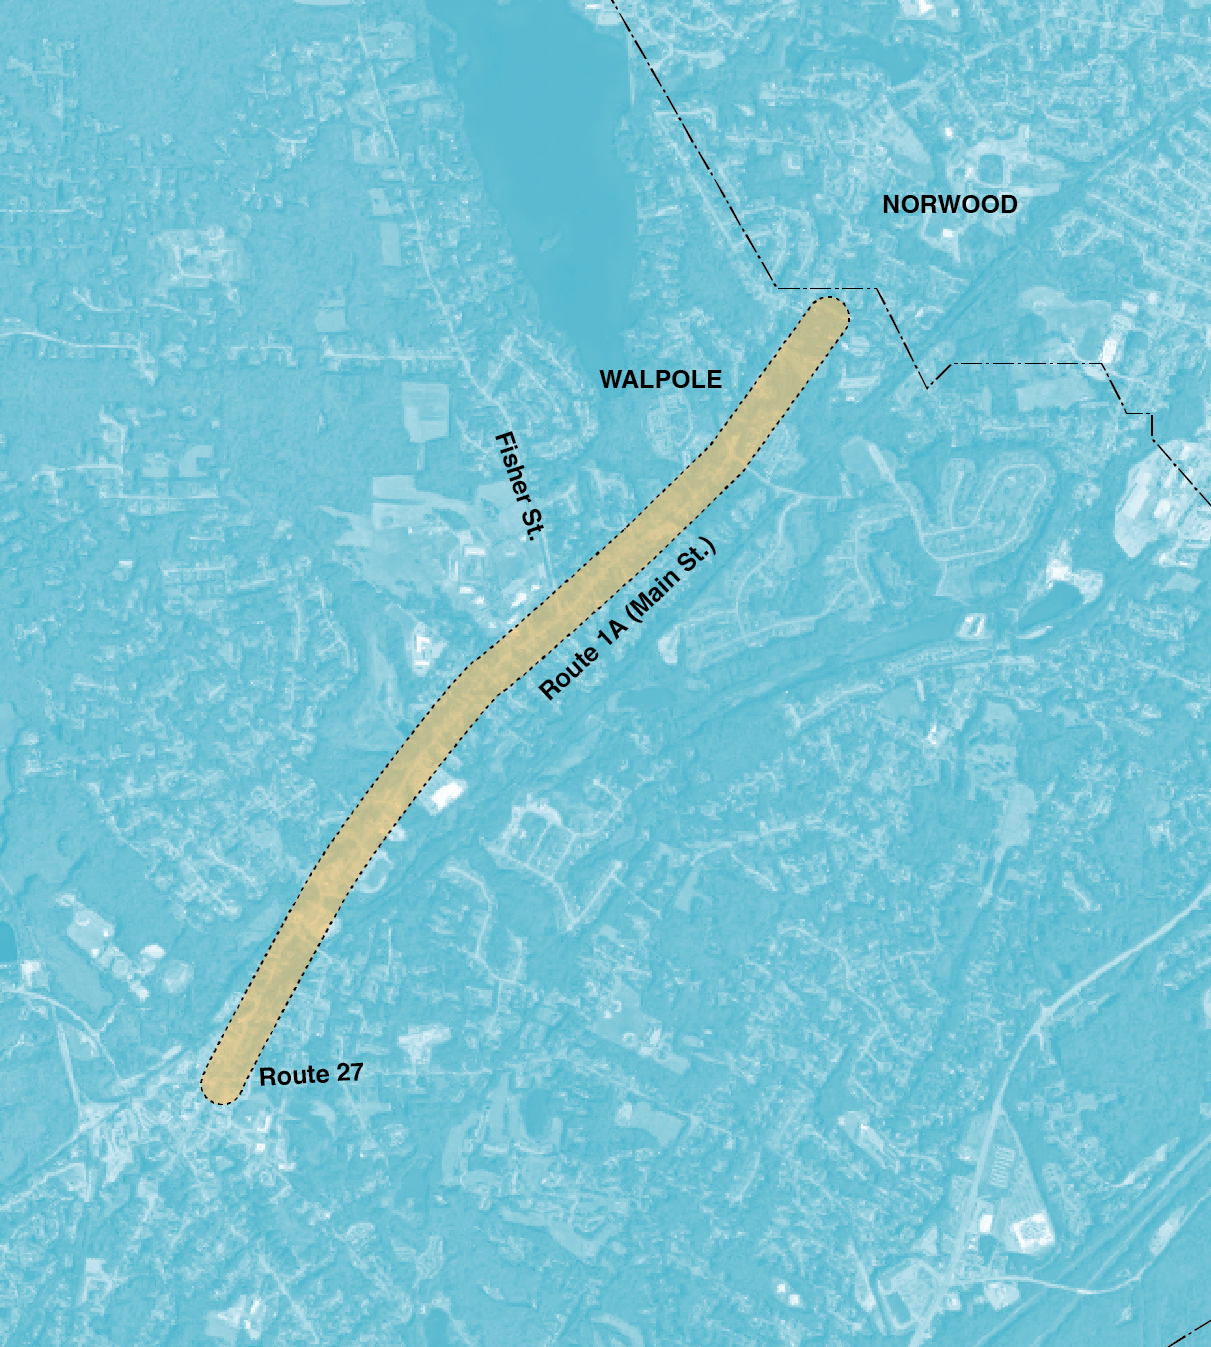
Source: Boston Region MPO.
A bridge on New Boston Street at the northern end of Woburn Industrial Park will be constructed. New Boston Street then will cross the MBTA’s Lowell Line and connect with Woburn Street in Wilmington. This connection existed until approximately 30 years ago when the bridge was destroyed by fire and not reconstructed. Also included in this project is the reconstruction of approximately 1,850 feet of New Boston Street.
No traffic studies have been performed to date; however, reopening this bridge would provide a second means of access to the growing Industri-Plex area for residents of Wilmington and communities to the north, as well as for emergency vehicles from the North Woburn fire station.
The Anderson Regional Transportation Center (RTC) is located just south of the proposed New Boston Street Bridge. The new bridge would provide an additional automobile access point for park-and-ride and transit services offered at the RTC.
Nonmotorized modes will be major beneficiaries of this project. The new network link will eliminate the need to use circuitous alternate routes for many local and regional trips.
There is no recent crash history at the project location. Safety benefits may be realized at other locations that will have less traffic.
An existing stretch of New Boston Street will be rebuilt as part of this project.
This project is not within an environmental justice area.
This project is entirely within an MPO-designated priority development area. The majority of the land in the New Boston Street area in Woburn is zoned for industrial use; existing development in the area is primarily commercial/industrial. With the opening of the Anderson RTC and I-93 Interchange 37C serving the Industri-Plex developments, the City of Woburn anticipates more office and retail development in the project area over the next few years. Just north of the proposed project in Wilmington, the land is zoned industrial and includes Southeast Wilmington Industrial Park. Further north on Woburn Street in Wilmington, the land is zoned residential up to Route 129.
Figure 4-10
Bridge Replacement, New Boston Street over MBTA Project Area
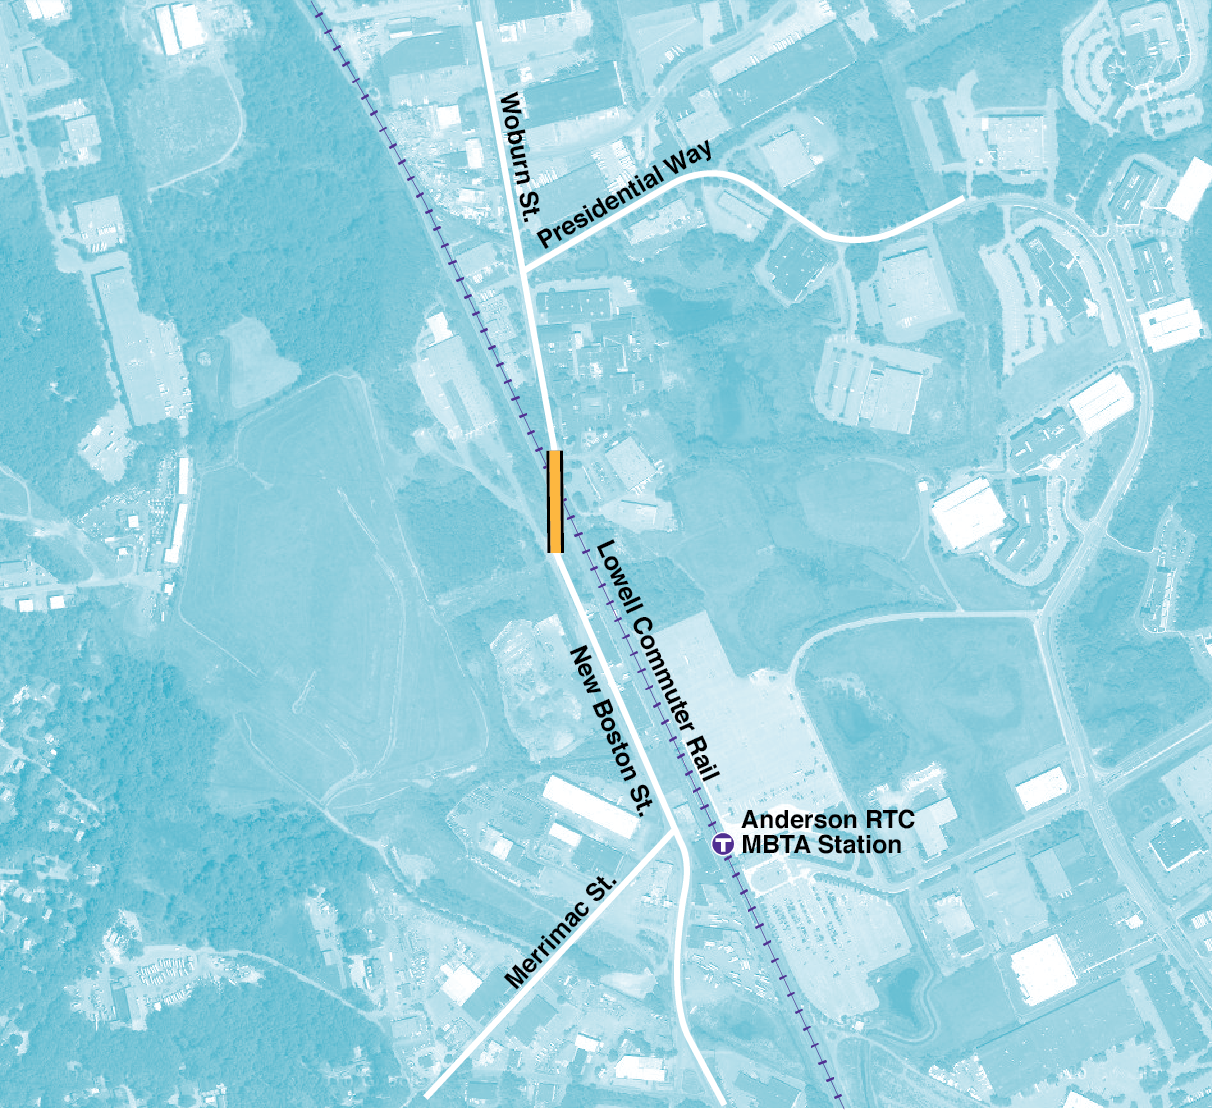
Source: Boston Region MPO.
This project includes the reconstruction of Cypher Street from A Street to D Street and the construction of a new Cypher extension from D Street to E Street. The project also includes the reconstruction of E Street from Cypher Street to Fargo Street to Summer Street. Cypher Street and E Street will be built to standards appropriate for use as a designated truck route. The work includes new sidewalks and pavement, traffic signal systems, and separated bike lanes. The intersection of Cypher Street and South Boston Bypass Road will be designed to accommodate bicyclists and pedestrians.
Peak-period congestion is a problem at intersections throughout the South Boston Waterfront. Currently, most truck trips need to pass through congested intersections. The proposed corridor serves the industrial areas most directly and will remove substantial numbers of trucks from congested intersections. This corridor will be open to light vehicles, though use of the Bypass Road may be restricted.
New bicycle lanes and sidewalks will be constructed along Cypher Street and the intersection of Cypher Street and South Boston Bypass Road will be designed to accommodate bicyclists and pedestrians.
The South Boston Waterfront is experiencing strong growth in diverse commercial and residential activities. Truck-dependent freight activities still operate successfully in parts of the port area, and some of these industries are experiencing expansion. This route will connect trucks with the Southeast Expressway on a safe path most removed from the growing commercial and residential areas.
Cypher Street and E Street are local streets, but they will be rebuilt to standards appropriate for heavy trucking.
This project is not within an environmental justice area.
The South Boston Bypass Road/Cypher Street/E Street/Summer Street corridor has been designated by the MPO as a Critical Urban Freight Corridor and has been incorporated into the National Highway Freight Network.
Figure 4-11
Cypher Street Extension Project Area
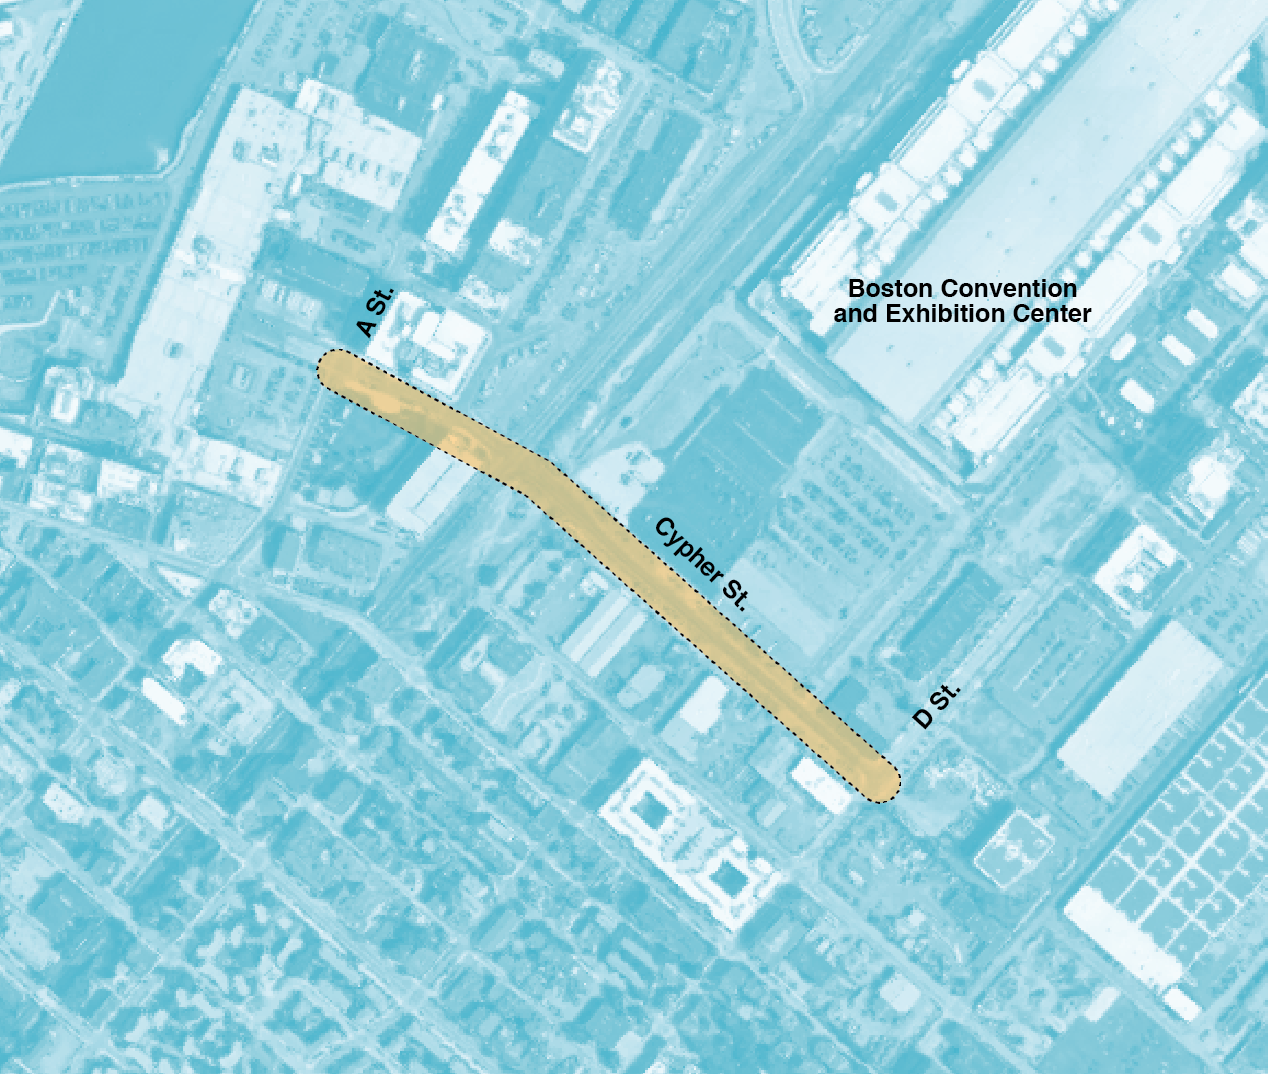
Source: Boston Region MPO.
The Allston Multimodal Project is the result of the need to replace the structurally deficient, functionally obsolete Allston Viaduct and the opportunity to reduce dramatically the footprint of the existing Allston Interchange toll plaza made possible by the implementation (through a separate project) of All Electronic Tolling (AET). The southern limit of the project includes the CSX Beacon Park Rail Yard, just north of the Boston University Athletic Center. The northern limit of the work is near the I-90 Allston interchange ramps.
The project will improve multimodal connectivity in the neighborhood and preserve and enhance regional mobility. Among other items, the program will include bicycle and pedestrian improvements to Cambridge Street and connections to the Charles River; a replaced viaduct to carry traffic safely and efficiently to and from Boston; the realignment of I-90; the construction of a new MBTA commuter rail station; and a restored layover yard for commuter rail trains. Funding sources for this project will be a combination of toll revenue, general obligation bonds, state obligation bonds, and federal funds. Public-private partnership opportunities and other contributions will also be explored.
The elevated viaduct carries I-90 through the Allston/Brighton area with Cambridge Street and Soldiers Field Road to the north and Brighton Avenue to the south. This section of I-90 has an average daily traffic volume of approximately 144,000 vehicles. The viaduct is the primary east-west route between Western Massachusetts, Worcester, and Boston, and experiences extensive vacation traffic during the weekends in the summer and winter. Average daily traffic volumes on I-90 west of the Allston Interchange are 142,000 vehicles and east of the Allston interchange are 147,000 vehicles. Average daily traffic volumes on Cambridge Street are 38,000 vehicles, 66,000 vehicles on Soldiers Field Road, and 66,000 vehicles on the Allston Interchange Ramps.
The project creates an opportunity to improve livability and connectivity for residents of the Allston neighborhood while preserving and enhancing regional mobility through improvements to I-90 and its abutting interchange and the creation of a new stop on the Worcester/Framingham Commuter Line to be known as West Station. This project will improve traffic flow through the project area and will include Complete Streets improvements to Cambridge Street.
The project will include significant transit enhancements including West Station and a commuter rail layover, which will provide access and operational improvements to the commuter rail. It will also be an intermodal focal point for local bus service.
The project will provide enhanced bicycle and pedestrian connectivity among the different parts of Allston around the project area and the Charles River.
This section of I-90 does not meet modern design standards. It lacks breakdown lanes, an intrinsically unsafe condition. Over the 2014–16 period there were 326 crashes in the project area, 43 of which involved bodily injury. The project will straighten the I-90 mainline to take full advantage of the safety enhancements made possible through the AET project. The replaced I-90 Allston Viaduct will also ensure that this section of a critical regional highway can continue to carry traffic safely and efficiently to and from Boston.
The I-90 Allston viaduct is nearing the end of its useful lifespan and must be replaced to prevent the bridge from becoming structurally deficient. The replacement of the bridge provides an opportunity to reconfigure the Allston Interchange, which dates to the 1965 extension of the Massachusetts Turnpike to downtown Boston. This project is in alignment with MassDOT’s plan for AET, which will operate at highway speeds.
Current plans include bicycle and pedestrian accommodations to be constructed where practicable on the arterial roadways throughout the project area. It will connect roadways between Cambridge Street and I-90 and be built, to the fullest extent practical and safe, using Complete Streets principles to signal clearly to motorists leaving the highway that they are entering a community.
This project is not within an environmental justice area.
The planned reconstructed roadways and bicycle and pedestrian systems are integral to transforming this area from an extensive center of freight rail and regional highway infrastructure to an academic and research community with updated and streamlined transportation infrastructure.
Figure 4-12
Allston Multimodal Project Area
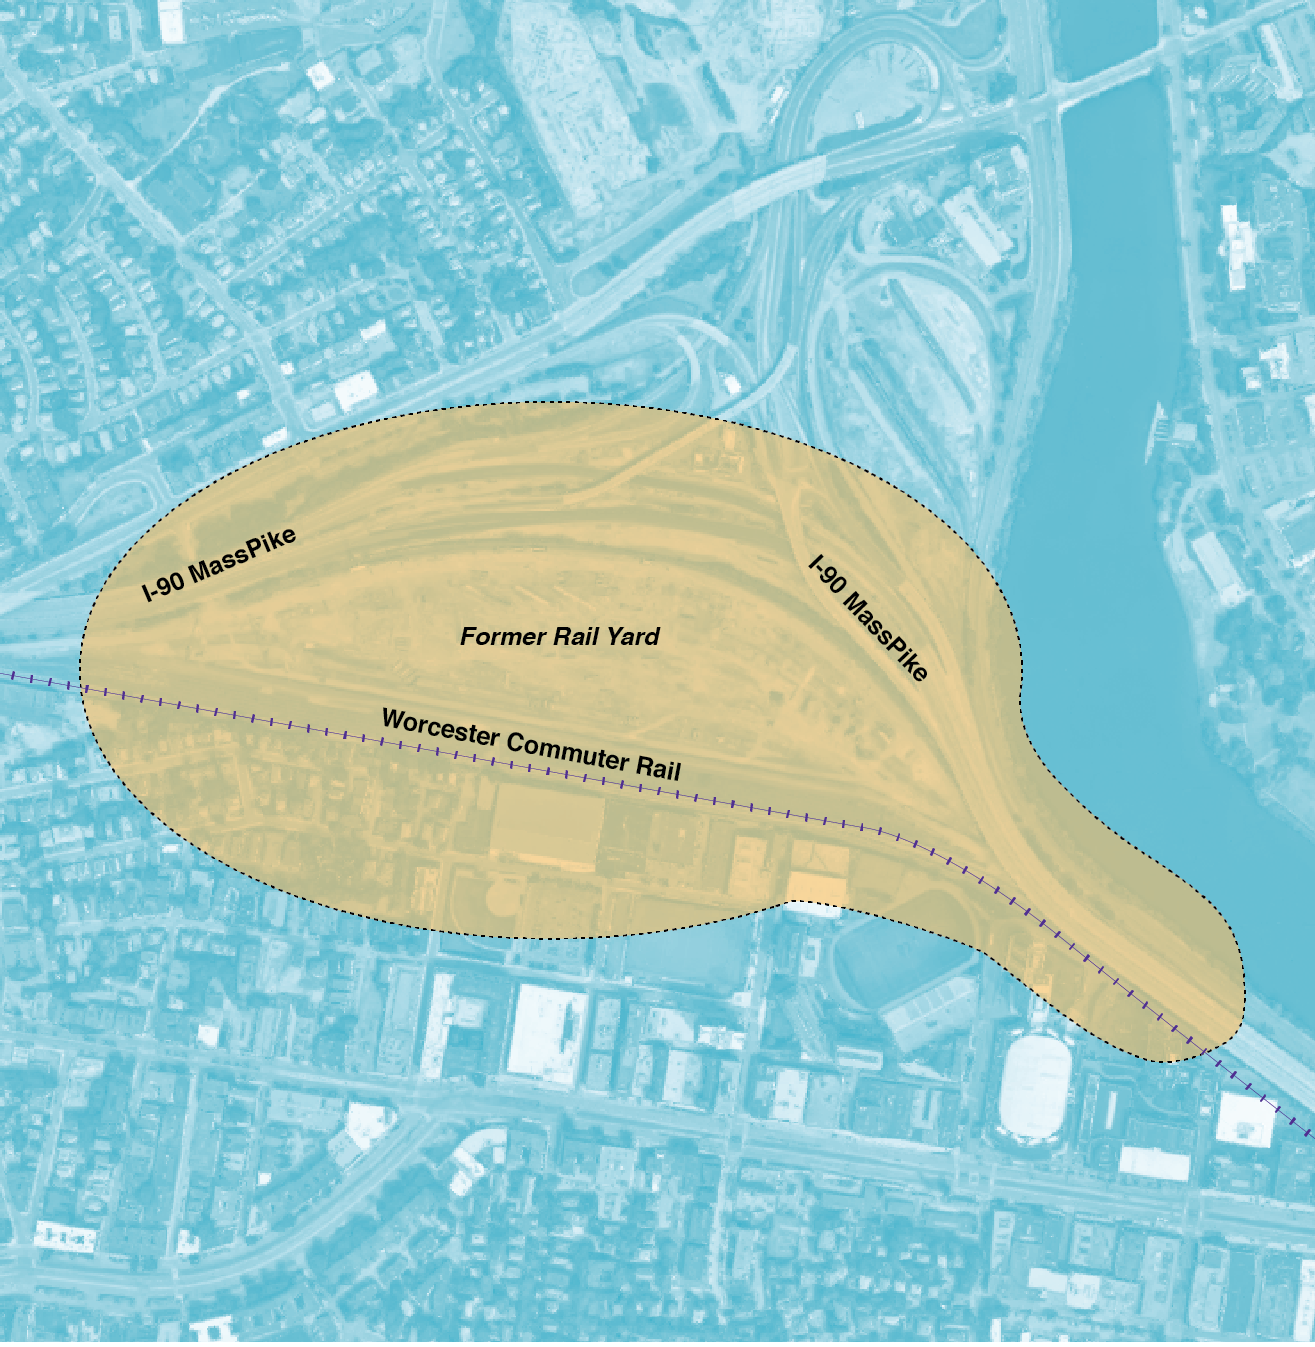
Source: Boston Region MPO.
The purpose of the I-495/I-90 Interchange Improvements project is to improve safety and operational efficiency at the system interchange of these two nationally and regionally significant interstate highways. This project will increase safety for all movements within the project area and address chronically deficient traffic conditions for the movement of people and goods. In addition, this project will support planned growth in the region and accommodate future traffic demand at acceptable LOSand travel time through the interchange. The I-495/I-90 Interchange Improvements project is currently in the design and environmental review phases.
On an average day, about 75,000 vehicles use the I-90/I-495 interchange. In the immediate area, I-90 carries approximately 100,000 vehicles and I-495 carries approximately 110,000 daily. Historically, congestion at this interchange has been associated with the toll plazas. The implementation of the AET System and the removal of the toll plazas did not eliminate the congestion and safety issues at this interchange. Several of the ramps currently operate at LOS “D” or worse, and will be improved significantly with the proposed changes. This is a limited-access interchange, so pedestrian and bicycle use are prohibited.
This location has been identified in the MassDOT Highway Safety Improvement Program (HSIP) as a hazardous road location and includes a crash cluster that ranks within the top five percent of crashes in the Boston region. Sharp curves on both ramps have led to numerous accidents, including rollovers of large trucks. The project will also eliminate conflicts as a result of weaving movements.
The current interchange geometry is substandard, and the geometric modifications will be a substantial improvement. In addition, there will be improvements to the existing bridges, including bridge deck replacement, rehabilitation, and bridge replacement, as well as significant reconstruction.
This project is not within an environmental justice area.
Nearly half of the trucks entering eastern Massachusetts use this interchange. A goal of this project is to make improvements to this interchange that will substantially benefit the distribution of goods and services throughout the state. In turn, this will help facilitate both regional commerce and anticipated local growth. In addition, the region surrounding the interchange is identified as a Priority Development Area.
Figure 4-13
Reconstruction of Interstate 90 and Interstate 495 Interchange Project Area
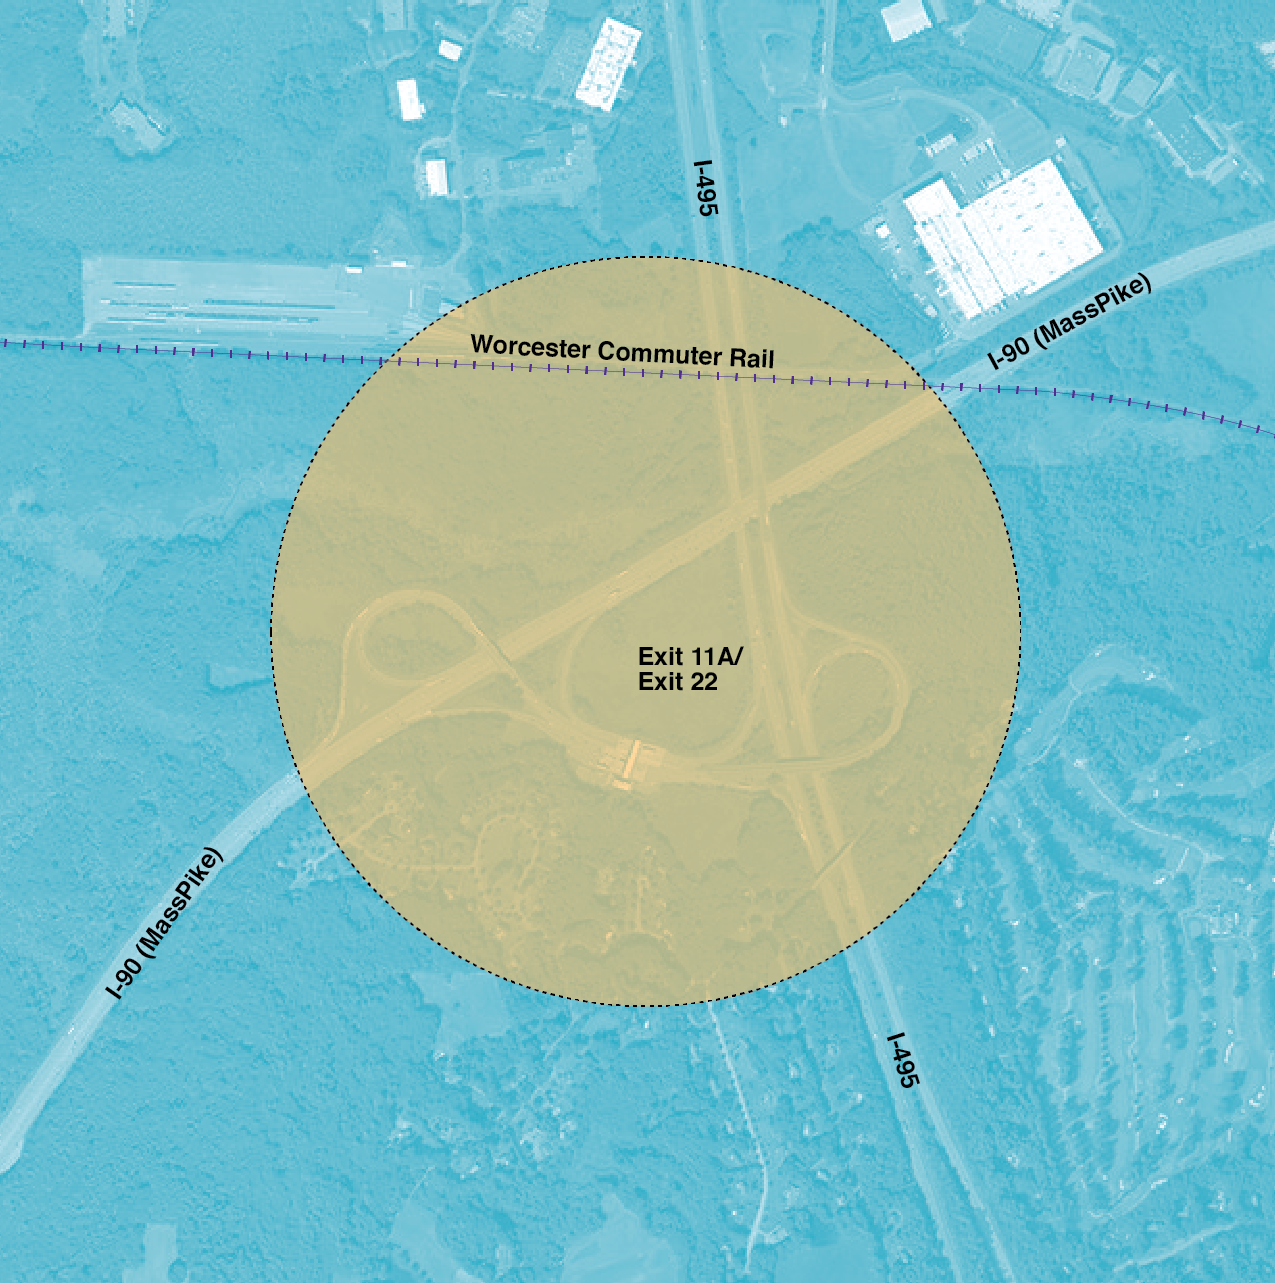
Source: Boston Region MPO.
A study for I-495/Route 9 Interchange improvements to identify traffic congestion and safety issues surrounding the I-495, I-90, and Route 9 interchanges because of employment and population growth in surrounding communities was completed in 2011. The study identified a number of issues associated with
A broad range of alternatives was developed to improve safety, reduce congestion, provide alternatives to travel by single-occupancy vehicle, and support future commercial and industrial growth in the area. It was determined that no single alternative alone addressed all of the study area issues; rather, a multimodal solution, consisting of highway, transit, pedestrian and bicycle improvement strategies, was recommended.
The alternative funded by the Central Massachusetts MPO (CMMPO) for the I-495/Route 9 Interchange improvement project includes bridge reconstruction and the installation of braided ramps. The project is programmed in the FFY 2025–29 time band of CMMPO LRTP.
Figure 4-14
Interstate 495 and Route 9 Project Area
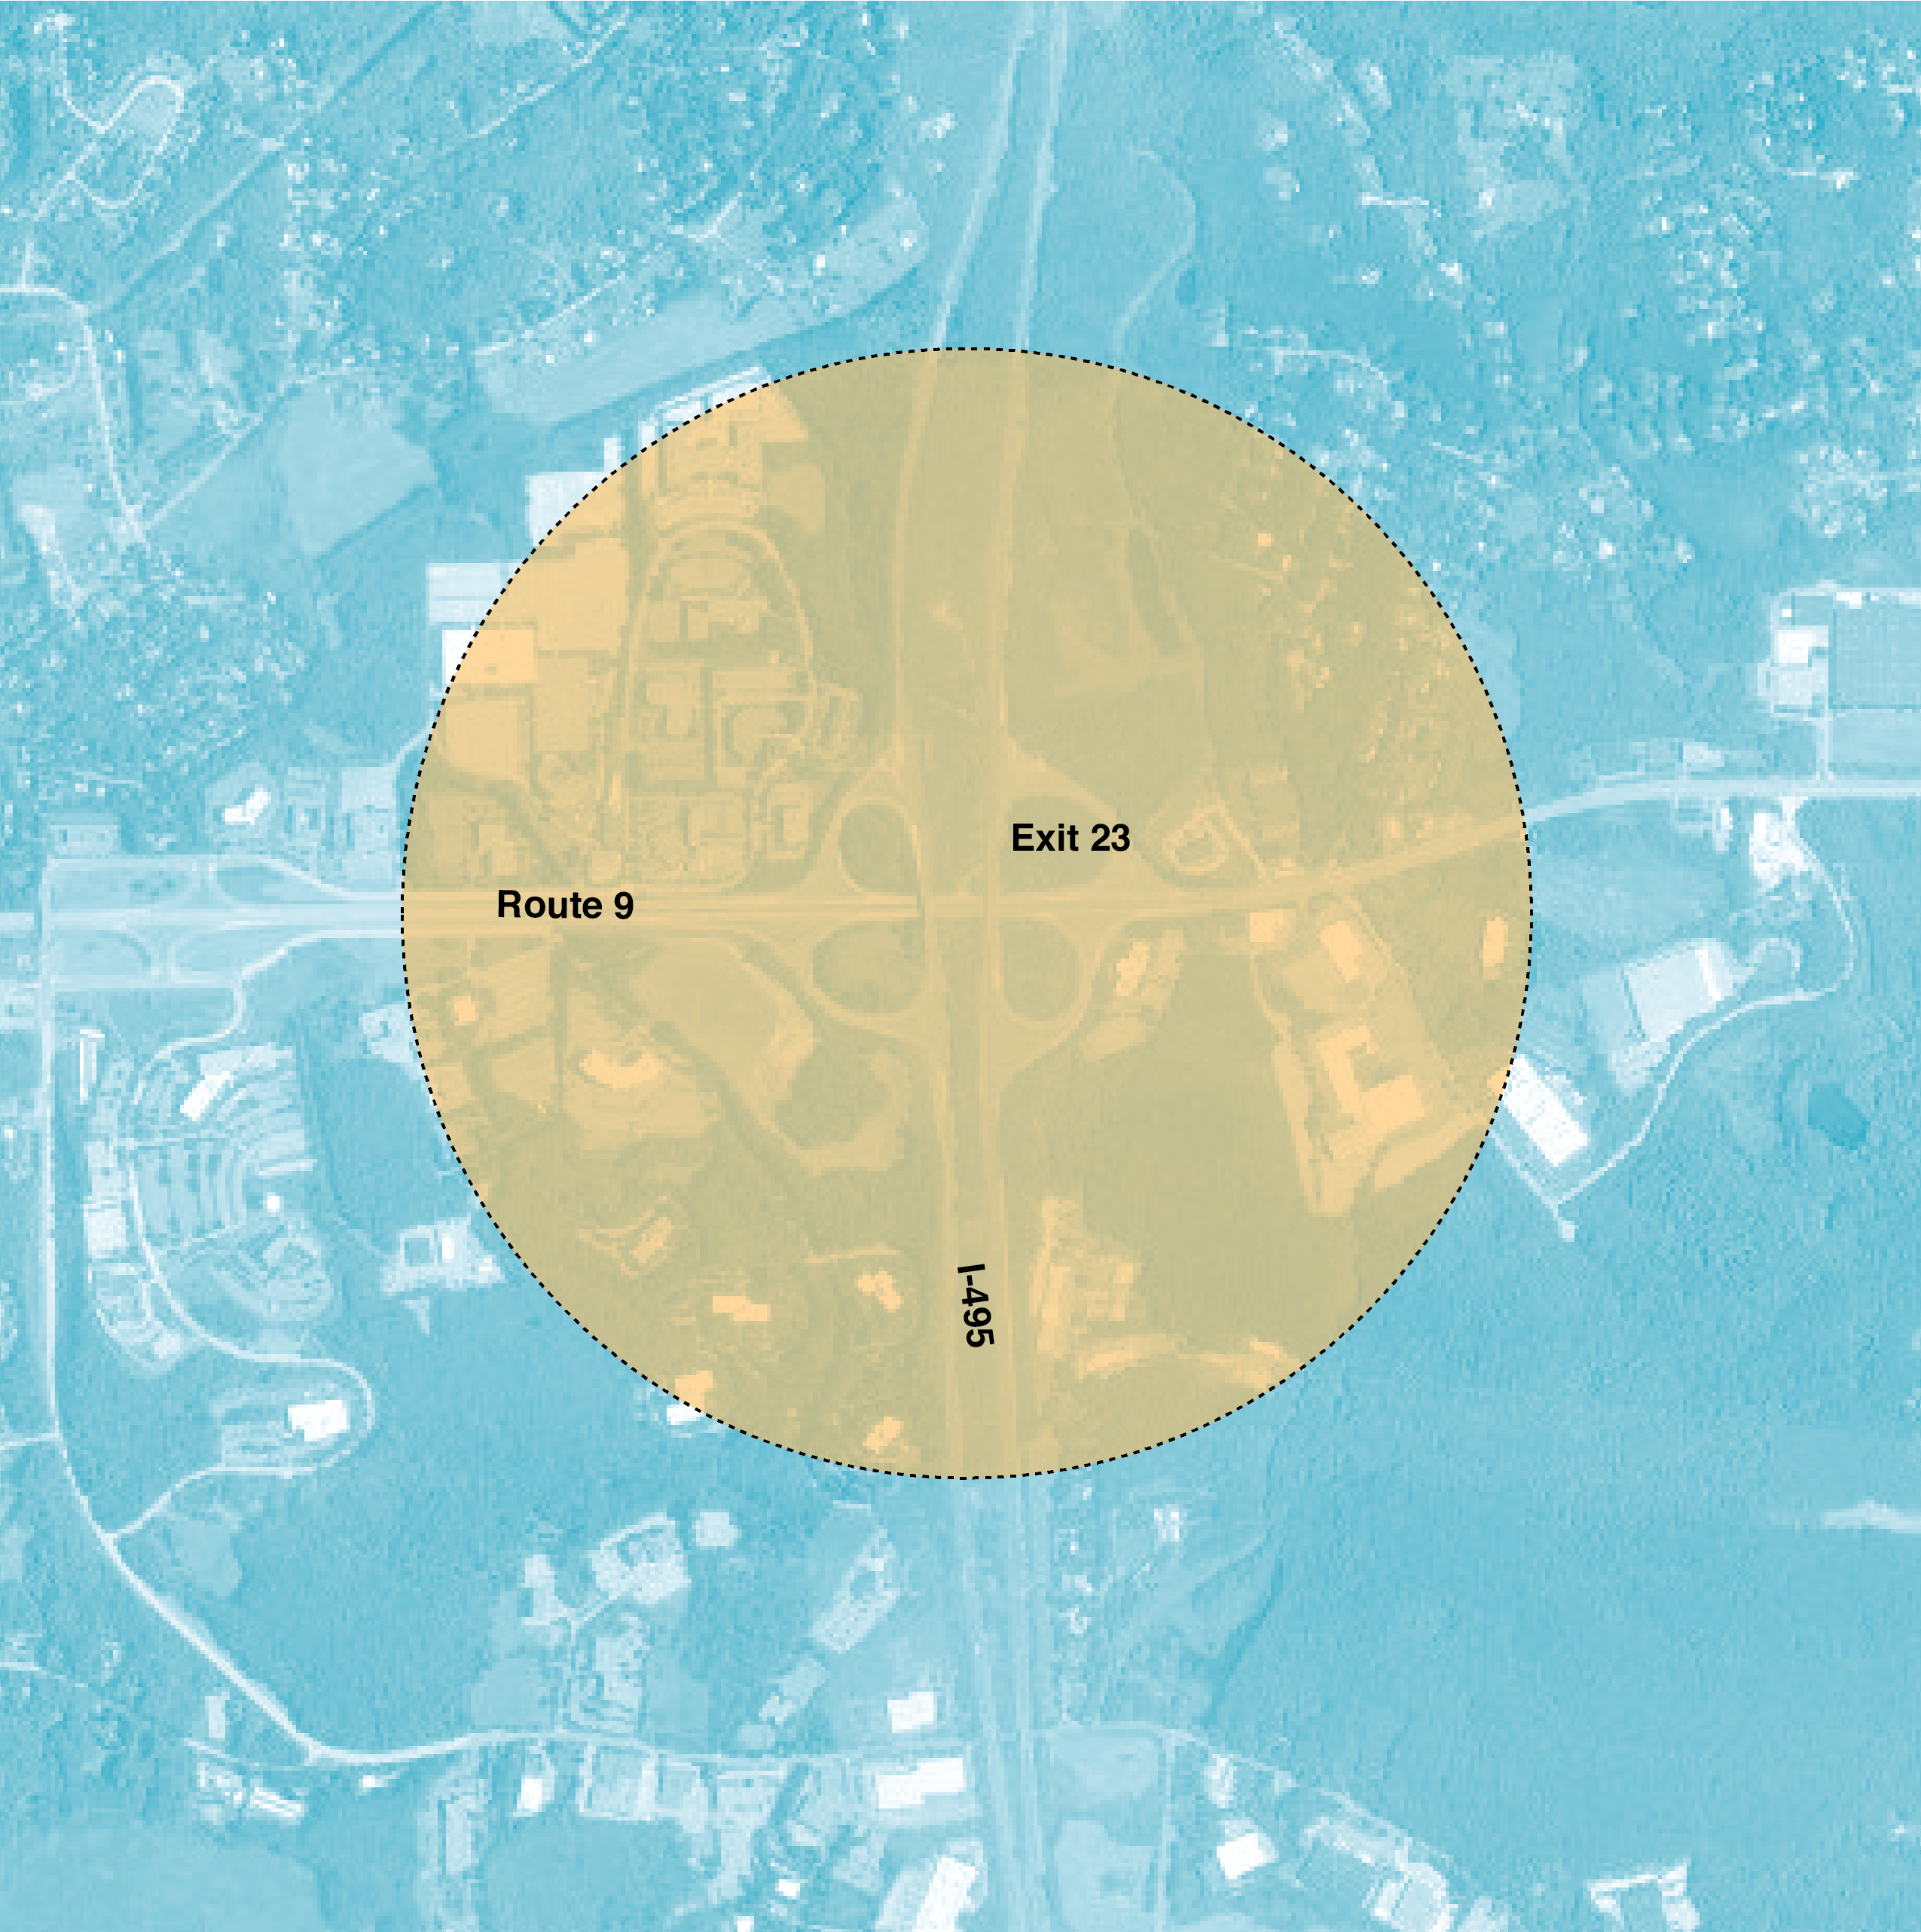
Source: Boston Region MPO.
The Commonwealth is committed to moving forward with the South Coast Rail project to serve the existing and future demand for public transportation between Fall River and New Bedford and Boston, enhance regional mobility, and support smart growth planning and development strategies in southeastern Massachusetts.
The project takes a phased approach to delivering service while proceeding with the design and permitting of the Stoughton Electric Full Build alternative. Phasing will shorten the time by at least 10 years to implement service; minimize wetlands impact; and reduce the overall project costs by starting construction sooner. Phase 1 is projected to result in approximately 1,600 new daily inbound boardings at new stations along the route.
The MBTA’s 2020–24 Capital Investment Program (CIP) includes full funding for Phase 1 construction and service via the Middleborough route. A finance plan for Phase 1 of the program has been developed in concert with the Commonwealth’s Executive Office of Administration and Finance.
The South Coast Rail will be built in phases. Phase 1 will accomplish the following:
At the same time, MassDOT will proceed with designing, permitting, and funding the Stoughton Straight Electric Alternative (Full Build Project), which was already reviewed under the Massachusetts Environmental Policy Act. The Full Build Project will travel on the Stoughton Main Line and Northeast Corridor (north of Canton Junction). The Southeastern Massachusetts MPO has programmed this project in the FFYs 2020–25 time band of its LRTP using Commonwealth funds.
Figure 4-15
South Coast Rail Project Area
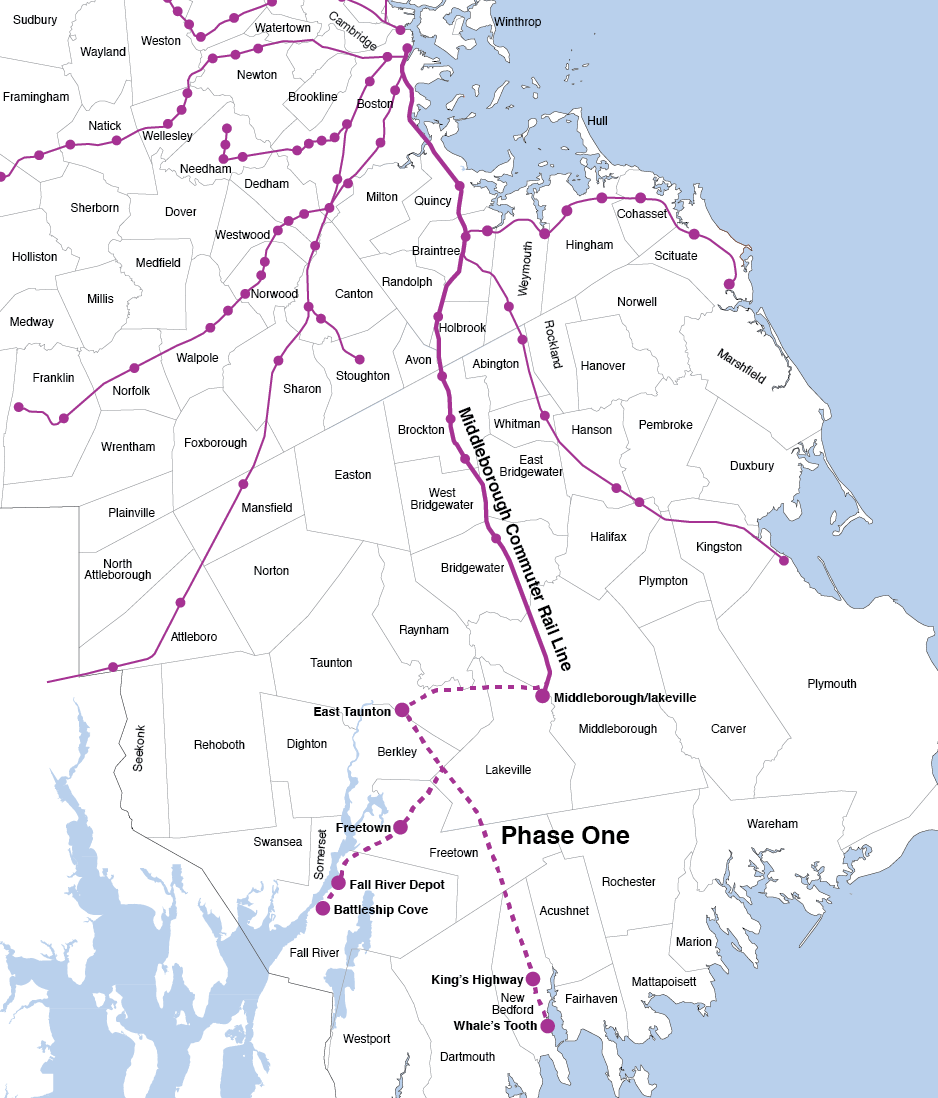
Source: Boston Region MPO.
In addition to the major infrastructure investment program discussed in the previous section, the MPO programmed five other types of investment programs in the recommended LRTP:
Projects included as part of these programs can be programmed in the TIP directly without first being listed in the LRTP because they do not add capacity to the transportation network. They would need to be listed in the LRTP only if they cost more than $20 million.
The first three programs include types of projects that are regularly programmed in the TIP. The fourth program, previously known as Community Transportation/Parking/Clean Air and Mobility, was created as part of the Charting Progress to 2040 LRTP. A study to establish the implementation of this program was conducted as part of the MPO’s 2018 Unified Planning Work Program and funding was included in the TIP beginning in FFY 2021. A new program, Transit Modernization, was included based on recommendations from the Needs Assessment and public input.
These programs are discussed below, along with how they will address the MPO’s goals and objectives.
This program will fund intersection projects that modernize existing signals or add signals to improve safety and mobility. Improvements also could consist of the addition of turning lanes, shortened crossing distances for pedestrians, and striping and lighting for bicyclists. Improvements to sidewalks and curb cuts also will enhance accessibility for pedestrians. Updated signal operations will reduce delay and improve bus transit reliability.
The following are examples of intersection projects that are programmed in the MPO’s FFYs
2020–24 TIP:
An average cost of $2.8 million per intersection project was determined based on similar projects that the MPO has funded in the past and those that are awaiting potential funding in future TIPs.
Intersection projects can reduce congestion, which would improve mobility and reduce emissions. Improvements can include bicycle and pedestrian elements to improve mobility for bicyclists, and mobility and accessibility for pedestrians.
Intersection projects can improve safety at high-crash locations for motorists, trucks, pedestrian, and bicyclists. Improvements can consist of upgraded geometry, shortened crossing distances, and enhanced signage and lighting.
Intersection projects can improve pavement condition and modernize signal equipment.
Intersection projects can reduce emissions because of enhanced operations for all vehicles, and through mode shift, accompanied by improvements in transit reliability and bicycle and pedestrian infrastructure.
Improvements to intersections can enhance transit services and provide better and more bicycle and pedestrian connections.
Intersection projects can reduce congestion by improving signal timings, which will improve mobility and access to centers of economic activity. Improvements can include pedestrian and bicycle elements that will improve mobility for bicyclists, and mobility and accessibility for pedestrians in centers of economic activity.
The Complete Streets Program modernizes roadways to improve safety and mobility for all users. Improvements can consist of continuous sidewalks and bicycle lanes, cycle tracks, and other bicycle facilities, as well as updated signals at intersections along a corridor. Improvements could also address other roadway infrastructure in the corridor, such as bridges, drainage, pavement, and roadway geometry. They will reduce delay and improve bus transit reliability. Expanded transportation options and better access to transit will improve mobility for all and encourage mode shift.
Examples of Complete Streets projects that are programmed in the MPO’s FFYs 2020–24 TIP include the following:
In addition to the improvements described above, the MPO set aside additional funding in this program for dedicated bus lane projects along with associated improvements.
The following are examples of bus lane projects that were piloted in 2018–19:
An average cost of $8 million per mile of Complete Streets improvements was established based on similar projects that the MPO has funded in the past and projects awaiting potential funding in future TIPs.
To estimate costs of funding for dedicated bus lanes and associated improvements, the MBTA provided MPO staff with the estimated cost per mile for a dedicated bus lane in one direction; the costs would be doubled for projects that install bus lanes in both directions. The total estimated construction cost per mile for one side of roadway is $510,700.
Complete Streets projects can increase transportation options by adding new sidewalks, bus lanes, and bicycle facilities. They also can improve mobility for transit services.
Complete Streets projects can modernize the roadway network to provide safe conditions for all modes of travel along the corridor. Improvements could consist of lane reconfiguration, traffic signal and access improvements for motorists, new sidewalks, curb ramps, improved roadway crossings for pedestrians, and continuous bicycle facilities to reduce conflicts between bicyclists and motor vehicles.
Complete Streets projects can address pavement condition, upgrade sidewalk and bicycle accommodations, and improve bridges and culverts (including adaptations to transportation infrastructure that is vulnerable to climate change and other hazards).
Complete Streets projects with bicycle, pedestrian, and transit infrastructure improvements can help to reduce vehicle miles of travel (VMT) through improved operations and mode shift.
Complete Streets projects in environmental justice areas can provide better access to transit, generally improved operations, and improved pedestrian and bicycle infrastructure.
Complete Streets projects can increase transportation options and access to places of employment and centers of economic activity by improving traffic operations and transit and adding sidewalks and bicycle facilities.
This program will expand bicycle and pedestrian networks to improve safe access to transit, school, employment centers, and shopping destinations. Bicycle and pedestrian connection projects could include constructing new, off-road bicycle or multi-use paths, improving bicycle and pedestrian crossings, or building new sidewalks. Improvements can also consist of traffic calming, sidewalk network expansion, and upgrades similar to those in a Complete Streets Program, or enhanced signage and lighting.
An example of a bicycle project that is funded through this program in the MPO’s FFYs 2020–24 TIP is the Independence Greenway Extension in Peabody.
Project costs for sample bicycle and pedestrian projects were examined using evaluated TIP projects, the MPO’s Bicycle Network Evaluation, and bicycle travel information from the 2011 Massachusetts Household Survey to develop an average cost of $3 million per mile.
Projects in the Bicycle Network and Pedestrian Connection Program can increase transportation options, provide access to transit or other activity centers, and support first-mile/last-mile connections.
Projects in this program can create a safe pedestrian and bicycle corridor that connects activity centers while avoiding high-crash locations on the roadway system. They can include safety improvements to facilitate pedestrian access to transit or other activity centers.
Bicycle and pedestrian infrastructure improvements can help to reduce VMT through mode shift.
Projects in environmental justice areas in this program can provide better access to transit and improved pedestrian and bicycle infrastructure.
Bicycle and pedestrian projects can increase transportation options and access to places of employment and centers of economic activity by adding new sidewalks and bicycle facilities and improving operations.
This program includes a combination of the following types of projects:
Projects in this program can increase transit ridership by expanding automobile and bicycle parking at commuter rail and rapid transit stations. The program will also provide funding for starting new, locally developed transit services and supporting first-mile/last-mile connections. It will also provide mobility options for elderly adults.
Bicycle and pedestrian infrastructure improvements, locally developed transit services, and first-mile/last-mile connections can help to reduce VMT and reduce emissions through mode shift.
The program can provide funding for starting new, locally developed transit services that include transit vehicles and coordination of service to transportation equity populations in suburban areas.
The program can provide funding for starting new, locally developed transit services and support first-mile/last-mile connections to places of employment and areas of economic activity.
This investment program would flex MPO discretionary funding to transit maintenance and modernization projects identified through coordination with the MassDOT, MBTA, MetroWest Regional Transit Authority, and the Cape Ann Transportation Authority. It could also include climate resiliency projects to improve transit infrastructure. Increasing investments in transit modernization and maintenance projects would allow the MPO to use its discretionary funding to augment planned transit improvements throughout the region and help the MPO reach its goals established in the LRTP.
The following are examples of projects that could be funded through this investment program:
Parking improvements at stations would support first-mile/last-mile access to transit. Eligible projects could include upgrades at existing parking facilities or new or expanded parking facilities to improve access to MBTA stations.
Station modernization improvements would support this goal by funding system upgrades, customer amenities, or capacity enhancements at existing rapid transit and commuter rail stations. Fleet modernization projects could include planned replacements of regional transit authority (RTA) buses and MBTA bus and Silver Line fleets with a mix of hybrid and battery electric vehicles, replacement of single-level commuter rail coaches with higher capacity bi-level coaches, and various other upgrades and overhauls to improve service reliability.
Infrastructure state of good repair projects could include investments to upgrade track, signals, and power systems to improve service reliability and enhance climate resiliency. Bus maintenance facilities upgrades could include projects that upgrade and replace bus maintenance facilities to improve state of good repair, support additional capacity, and accommodate the future fleets.
Fleet modernization projects could support this goal by funding planned replacements of RTA buses and MBTA bus and Silver Line fleets with a mix of hybrid and battery electric vehicles, replacement of single-level commuter rail coaches with higher capacity bi-level coaches, and various other upgrades and overhauls to improve emissions.
Accessibility improvements could include construction or replacement of redundant elevators at MBTA rapid transit or commuter rail stations, installing high-level platforms at presently inaccessible stations, or removing other barriers to accessibility at stations and MBTA and RTA bus stops. Station modernization improvements could include system upgrades, customer amenities, or capacity enhancements at existing rapid transit and commuter rail stations, improving mobility to transportation equity populations.
The CIP is a guide to the MBTA’s planned capital spending in future fiscal years (FYs). The document describes the MBTA’s infrastructure and the capital needs for maintaining the system, outlines ongoing and programmed capital projects, and details planned projects to expand the transportation network.
The MBTA recently released its five-year CIP for FYs 2020–24. Projects in the CIP are selected through a prioritization process that strives to balance capital needs across the entire range of MBTA transit services. Given the MBTA’s vast array of infrastructure and the need for prudent expansion, the number of capital needs identified each year usually exceeds the MBTA’s capacity to provide capital funds. Therefore, the MBTA engages in an annual prioritization and selection process to select the needs with the highest priority for funding and inclusion in the CIP.
The three priorities for CIP investment, in order of importance are reliability, modernization, and expansion. The reliability program maintains and improves the overall condition and reliability of the transportation system and includes the following tasks and projects:
The modernization program makes the transportation system safer and more accessible and accommodates growth. The following tasks and projects are included as part of the modernization program:
The expansion program includes diverse transportation options for communities throughout the Commonwealth.
To measure the need for capital expenditures devoted to maintaining and replacing existing infrastructure for the transit system, the MBTA employs an asset management program to help guide its capital decisions. The existing asset management program helps the MBTA monitor system conditions and prioritize investments based on, among other factors, condition, usage, asset criticality, and maintenance and life-cycle cost impacts. Over time, MassDOT plans to increase both the rigor and the transparency of all of its asset management systems so that state of good repair programs and other projects can be prioritized more easily and compared with one another.
Below is a description of the programs funded by the MBTA to maintain the transit system.
The revenue vehicle fleet is one of the most visible components of the MBTA's service network. These are the trains, buses, and other vehicles that passengers board every day (that is, all vehicles that carry passengers in revenue service). Scheduled major overhauls, maintenance, and planned retirements allow the fleet to reach its useful life and prevent the unwarranted consumption of resources to maintain its reliability. This program rehabilitates and replaces the MBTA revenue fleet, including commuter rail, heavy rail, light rail, bus, and ferry units.
In the FYs 2020–24 CIP, the MBTA allocated 32 percent of its transit reliability investment capital funds to the revenue vehicles program, the largest share of any program area. The MBTA will employ its asset management program to help guide its capital decisions for this program in the future. However, it is expected that funding for this program will continue to require a large share of the capital resources in the future.
This program rehabilitates, replaces, and upgrades track, signal, and power assets across the commuter rail and transit system.
Tracks: Several types of track can be found throughout the MBTA system, depending on the service; for example, commuter rail or rapid transit. The right-of-way for heavy rail rapid transit track often includes an electrified third rail through which subway cars receive the traction power needed for movement.
Signals: The primary responsibility of the MBTA signal system is to control trains for efficient spacing and run times, making it an integral part of the transit system. The signal system’s goal is to maintain train separation while attempting to minimize headways and run times.
Power: While power for the MBTA’s network is supplied by an outside utility, the MBTA transforms and distributes electricity over its own system to power the entire network of subway, trackless trolley, and light rail lines. The capital equipment in this power program is essential to operations. It supplies electricity to subway trains and trolleys for the traction power needed for movement; to the signal systems for the power needed to control the trains; and to the stations to operate their lights, elevators, escalators, and other equipment. The MBTA’s power program, arguably one of the least visible elements to passengers, is one of the most complex, important, far-reaching, and expensive systems for the MBTA to maintain.
In the FYs 2020–24 CIP, the MBTA allocated 23 percent of its transit reliability investment capital funds to the track, signal, and power program. This program is crucial for supporting the safe and efficient operations of trains system wide. Funding will always be allocated for this program; however, based on allocations in past CIPs, the funding will vary depending on the needs identified by the asset management program.
MBTA’s bridges require continued maintenance and rehabilitation. This program repairs, reconstructs, and replaces MBTA commuter rail and transit bridges and tunnels system wide. The MBTA bridge inspection program is tailored to ensure that bridge repairs are prioritized and that all bridges receive adequate attention.
In the FYs 2020–24 CIP, the MBTA allocated 16 percent of its transit reliability investment capital funds to the bridge and tunnel program. The MBTA prioritizes its bridges through its bridge inspection program. Funding will always be allocated for this program; however, based on allocations in past CIPs, the funding will vary depending on the needs identified by the asset management program.
MBTA stations are one of the most visible components of the transit system; they provide access to rapid transit, light rail, commuter rail, and Silver Line services in the MBTA transit system. Many of the bus stops also have bus shelters of various kinds. This program rehabilitates and upgrades MBTA stations (for example, commuter rail, commuter boat, subway, and bus stations), including accessibility upgrades and the system wide replacement of escalators and elevators.
In the FYs 2020–24 CIP, the MBTA allocated 11 percent of its transit reliability investment capital funds to the stations program. The MBTA will employ its asset management program to help guide its capital decisions for this program in the future. Funding will always be allocated for this program; however, based on allocations in past CIPs, the funding will vary depending on the needs identified by the asset management program.
This program rehabilitates and upgrades maintenance and administrative facilities that support transit operations.
In the FYs 2020–24 CIP, the MBTA allocated 11 percent of its transit reliability investment capital funds to the facilities program. The MBTA will employ its asset management program to help guide its capital decisions for this program in the future. Funding will always be allocated for this program; however, based on allocations in past CIPs, the funding will vary depending on the needs identified by the asset management program.
This program upgrades multiple MBTA systems including communications, security, computer technology, fare collection, asset management, and environmental remediation systems. It also rehabilitates nonrevenue vehicles and equipment.
In the FYs 2020–24 CIP, the MBTA allocated seven percent of its transit reliability investment capital funds to the system upgrades program. The MBTA will employ its asset management program to help guide its capital decisions for this program in the future. Funding will always be allocated for this program; however, based on allocations in past CIPs, the funding will vary depending on the needs identified by the asset management program.
In Destination 2040, the Boston Region MPO provides a 20-year vision of the Boston region’s transportation needs. Land-use patterns, growth in employment and population, and trends in travel patterns affect demands on the region’s transportation system. To estimate future demands on the system for this LRTP, the MPO used a statewide travel demand forecast model. The model is a planning tool used to evaluate the effects of transportation alternatives given varying assumptions about population, employment, land use, and traveler behavior. The model is used to assess potential transportation projects in terms of air quality benefits, travel-time savings, and congestion reduction.
For Destination 2040, Central Transportation Planning Staff (CTPS) used the 2018 version of the statewide model. This version simulates a base year of 2016 and forecasts traffic volumes to 2040. The salient features of the recently updated statewide model are as follows:
As discussed earlier in this section, the Boston Region MPO uses a robust quantitative travel model framework that employs a traditional four-step planning process: trip generation, trip distribution, mode choice, and trip assignment. This travel demand model set simulates existing travel conditions and forecasts future-year travel on Massachusetts transit and highway systems. For a more accurate picture of travel demands in the Boston region, all communities within the state of Massachusetts are represented in the modeled area (the area from which people commute).
The model represents all MBTA rail and bus lines, private express-bus carriers, commuter boat services, limited-access highways and principal arterials, and many minor arterials and local roadways. The region is subdivided into 5,739 TAZs. The model set is made up of several models, each of which represents a step in the travel decision-making process (the four-step process). The model set simulates transportation supply characteristics and transportation demand for travel from every TAZ to every other TAZ.
This simulation is the result of several inputs (different categories of data). Two broad sets of these inputs are land use patterns, to identify amount and types of trips produced and how they are distributed (trip generation and trip distribution), and a transportation network with associated trip-making behavioral parameters, to allocate each trip onto different travel modes and onto a system of transportation network links (mode choice and trip assignments).
The Metropolitan Area Planning Council (MAPC) is responsible for developing the land use inputs for the travel demand model. With guidance from an advisory panel (local jurisdiction staff, academic experts, and state agencies), MAPC and the MPO, as a joint effort, implemented an iterative land use-transportation model to quantify land use patterns, by answering the following set of questions:
The land use in the model is consistent with state control totals (established by MassDOT’s Office of Transportation Planning) for the horizon year of 2040. The University of Massachusetts Donahue Institute, under contract for MassDOT, completed these land use projections in December of 2018.
The process for developing 2040 land use forecasts in the context of travel demand analyses involves two basic factors or agents of growth: households and employment.
Household and employment control totals were developed for the region and individual municipalities. The process used current and historic growth trends from a number of databases at the federal (Census Bureau, Bureau of Labor Statistics), state (Massachusetts Department of Public Health), and local level (MAPC Development Database, local jurisdiction parcel database). Finally, an iterative land use transportation model was used to allocate these household/employment projections onto each TAZ. In this modeling framework, projected households and employers (agents) compete to locate in a landscape of various land use supplies, determined by economic factors (bid-rents) and zonal attraction characteristics (land-rent affordability, transportation connectivity).
For each TAZ, this process generated number of households, household characteristics, employment and other related activities, automobile ownership, and other variables that produce travel demand on transportation systems (see below for more details). More information on land use in the Boston Region MPO is included in Chapter 2 of the Destination 2040Needs Assessment.
This data set was derived from various resources such as the Massachusetts Roadway Inventory File and the MBTA routes and schedules (see the Description of the MPO Model Set section for more details).
The model is used to answer the following questions:
All these data sets are updated on a regular basis to ensure reliability of forecasts.
The travel model analysis for the LRTP consisted of several steps. First, MPO staff tested an existing conditions network with existing land use patterns, to simulate recent 2016 travel conditions. This constituted the model’s Base Year. Projects included for analysis in the Base Year model were deemed significant, as defined by the federal government, because of being statewide in nature, adding capacity, and having air quality impacts for the state as measured by the model. Existing land use information was derived from comprehensive land development and demographic databases maintained by MAPC, the MPO and other Massachusetts MPOs.
Next, staff incorporated a 2040 No-Build alternative into in the model. Staff structured this 2040 No-Build alternative around the 2016 Base Year and projects constructed between 2016 and 2018, in addition to those that are currently under construction and those programmed in the first year of theFFYs 2019–23 TIP.
The 2016 Base Year and 2040 No-Build scenarios provided a baseline against which the predicted effects of potential investments in the transportation system were measured.
Finally, staff developed an alternative set of projects called the 2040 Build Scenario through an investment scenario process discussed earlier inthis chapter. Staff analyzed this set of projects with the same 2040 No-Build land use assumptions in the travel demand model set. The following significant travel statistics were reported and compared from all of these conditions:
Selected travel-modeling results for the 2016 Base Year, 2040 No-Build, and 2040 Build scenarios are shown in Table 4-4.
Table 4-4 |
|||||
Measure |
2016 Base |
2040 No-Build |
2040 Build |
Percent Change from 2016 to 2040 No-Build |
Percent Change from 2040 No-Build to 2040 Build |
Socioeconomic Variables (BRMPO) |
|
|
|
|
|
Population |
3,245,900 |
3,705,500 |
3,705,500 |
14% |
0% |
Households |
1,312,000 |
1,582,600 |
1,582,600 |
21% |
0% |
Household Size |
2.5 |
2.2 |
2.2 |
-12% |
0% |
Total Employment |
1,923,600 |
2,084,700 |
2,084,700 |
8% |
0% |
Basic |
365,400 |
344,600 |
344,600 |
-6% |
0% |
Retail |
308,700 |
297,600 |
297,600 |
-4% |
0% |
Service |
1,249,500 |
1,442,500 |
1,442,500 |
15% |
0% |
Households with Vehicles (BRMPO) |
|
|
|
|
|
0 Vehicles |
15% |
15% |
15% |
0% |
0% |
1 Vehicles |
38% |
40% |
40% |
2% |
0% |
2 Vehicles |
32% |
33% |
33% |
1% |
0% |
3+ Vehicles |
16% |
12% |
12% |
-4% |
0% |
Trip Activity |
|
|
|
|
|
Total Person Trips within BRMPO |
13,983,500 |
15,936,400 |
15,936,400 |
14% |
0% |
Auto person trips |
11,096,700 |
12,482,700 |
12,451,000 |
12% |
0% |
Transit person trips |
1,044,500 |
1,208,200 |
1,260,600 |
16% |
4% |
Nonmotorized trips |
1,842,300 |
2,245,500 |
2,224,800 |
22% |
-1% |
Total Person Trips (BRMPO) |
16,147,700 |
18,163,500 |
18,164,100 |
12% |
0% |
Auto person trips |
13,229,000 |
14,670,800 |
14,638,200 |
11% |
0% |
Transit person trips |
1,069,900 |
1,239,500 |
1,293,400 |
16% |
4% |
Nonmotorized trips |
1,848,800 |
2,253,200 |
2,232,500 |
22% |
-1% |
Mode Choice |
|
|
|
|
|
Mode Share within BRMPO |
100% |
100% |
100% |
0% |
0% |
Auto share |
79% |
78% |
78% |
-1% |
0% |
Transit share |
7% |
8% |
8% |
1% |
0% |
Nonmotorized share |
13% |
14% |
14% |
1% |
0% |
Mode Share for all Trips to/from/within the BRMPO |
100% |
100% |
100% |
0% |
0% |
Auto share |
82% |
81% |
81% |
-1% |
0% |
Transit share |
7% |
7% |
7% |
0% |
0% |
Nonmotorized share |
11% |
12% |
12% |
1% |
0% |
Highway Results |
|
|
|
|
|
Total Vehicles Assigned in BRMPO |
11,810,200 |
13,180,700 |
13,180,700 |
12% |
0% |
Auto |
9,557,500 |
10,687,700 |
10,687,700 |
12% |
0% |
Trucks |
2,252,700 |
2,493,000 |
2,493,000 |
11% |
0% |
VMT in BRMPO |
77,848,100 |
82,358,600 |
82,450,200 |
6% |
0% |
Auto |
69,999,500 |
74,754,200 |
74,790,900 |
7% |
0% |
Trucks |
7,848,600 |
7,604,400 |
7,659,300 |
-3% |
1% |
VHT in BRMPO |
2,926,600 |
3,508,000 |
3,507,200 |
20% |
0% |
Auto |
2,718,000 |
3,306,000 |
3,303,700 |
22% |
0% |
Trucks |
208,600 |
202,000 |
203,500 |
-3% |
1% |
Average Speed in BRMPO |
26.60 |
23.48 |
23.51 |
-12% |
0% |
Auto |
25.75 |
22.61 |
22.64 |
-12% |
0% |
Trucks |
37.63 |
37.65 |
37.64 |
0% |
0% |
Average Trip Length |
7.32 |
6.99 |
7.00 |
-5% |
0% |
Congested VMT (Volume/Capacity > 0.75) |
|
|
|
|
|
BRMPO |
41,244,008 |
47,564,883 |
47,193,220 |
15% |
-1% |
Transit Results (Model) |
|
|
|
|
|
Transit Trips (Unlinked) |
1,459,100 |
1,736,400 |
1,799,500 |
19% |
4% |
Local Bus |
347,900 |
352,600 |
367,000 |
1% |
4% |
Express Bus |
20,800 |
20,400 |
22,100 |
-2% |
8% |
Bus Rapid Transit (Silver Line) |
33,300 |
70,700 |
70,800 |
112% |
0% |
Rapid Transit |
814,100 |
1,012,100 |
1,037,300 |
24% |
2% |
Commuter Rail |
126,800 |
145,200 |
155,000 |
15% |
7% |
Ferry |
5,200 |
7,600 |
7,500 |
46% |
-1% |
Other Modes |
111,000 |
127,800 |
139,800 |
15% |
9% |
Transit Trips (Linked) |
1,179,900 |
1,381,600 |
1,448,200 |
17% |
5% |
Walk Access Transit |
999,100 |
1,166,300 |
1,217,400 |
17% |
4% |
Drive Access Transit |
180,800 |
215,300 |
230,800 |
19% |
7% |
Average Transfer Rate |
1.26 |
1.28 |
1.27 |
2% |
-1% |
Notes: The BRMPO is comprised of 97 municipalities.
Linked Transit Trips are trips made between an origin and a destination that does not account for transfers between vehicles or modes.
Unlinked Transit Trips are trips made between an origin and a destination that accounts for transfers between vehicles or modes.
Nonmotorized trips are bicycle and pedestrian trips.
BRMPO = Boston Region Metropolitan Planning Organization. VHT = vehicle-hours traveled. VMT = vehicle-miles traveled.
Source: Boston Region MPO.
After the Needs Assessment was completed, the demographics and spatial distribution were updated. These updated demographics were used in the LRTP. This change in demographics is what has caused differences in various model outputs between the Needs Assessment and final LRTP.
Analyzing current patterns of demographic shifts and the Boston region’s vibrant economy, the 2040 demographic forecasts projected an increase in population (14 percent), households (21 percent), and employment (8 percent). This assumed level of demographic growth is estimated to produce approximately 18 million trips on an average weekday in the Boston metro area, regardless of modes. This is a 12.5 percent increase from the 2016 Base-Year conditions for the model area.
Projected changes in vehicle ownership from 2016 to 2040 show a greater number of one and two vehicles households and decline in three or more vehicle households in the region. Consequently, there is a small shift to transit use between 2016 Base Year and 2040 No-Build/Build conditions.
Among total person trips (to, from, and within the Boston region), transit and nonmotorized trips are expected to grow faster than auto trips. Nonmotorized trips are forecasted to have the greatest percentage increase of slightly more than 22 percent, from 1,848,800 trips in 2016 to 2,253,200 trips in the 2040 No-Build condition. Transit trips are expected to grow from 1,069,900 trips to 1,239,500 trips (16 percent), with a modest increase in auto person trips, from 13,229,000 in 2016 to 14,670,800 in 2040 (an 11 percent increase). These higher growth shares in nonmotorized and transit trips are a result of underlying land use allocation assumptions, as more households are located near transit services and other activity centers in a compact fashion. Figure 4-16 shows the change in share of automobile, transit, and nonmotorized trips in the Base Year, 2040 No-Build, and 2040 Build conditions. As transit and nonmotorized trips are expected to grow at faster rates than automobile trips, these modes have a slightly greater percentage of total trips made in the future year.
Figure 4-16
Mode Share Split – Person-Trips under 2016 Base Year, 2040 No-Build, and
2040 Build Conditions
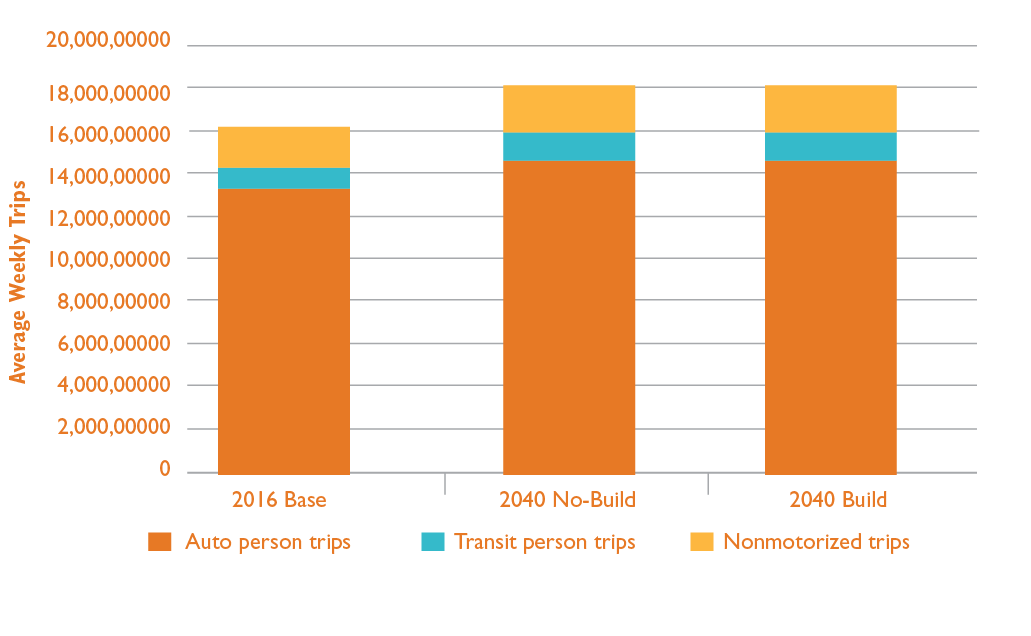
Source: Boston Region MPO.
As in the highway assignment portion of the model framework, transit ridership forecasts were not constrained by existing and proposed transit service capacity. This produced a true level of demands on highway and transit facilities. In the Base Year, the model set estimated 1,179,900 linked transit trips on a typical weekday. With an observed average transfer rate of 1.26, this translates to 1,459,100 unlinked trips. In the 2040 No-Build condition, the model estimated growth of more than 17 percent for these transit trips. Two factors contributed to this growth: assumed growth in overall population and associated demographic shifts (vehicle ownership), and changes in transit service supply (for example, due to the Green Line Extension to Union Square, Fairmount Line service improvements,and Silver line Gateway). Figure 4-17 shows how these additional transit trips are estimated to be allocated across various transit modes.
Figure 4-17
Transit Trips by Mode
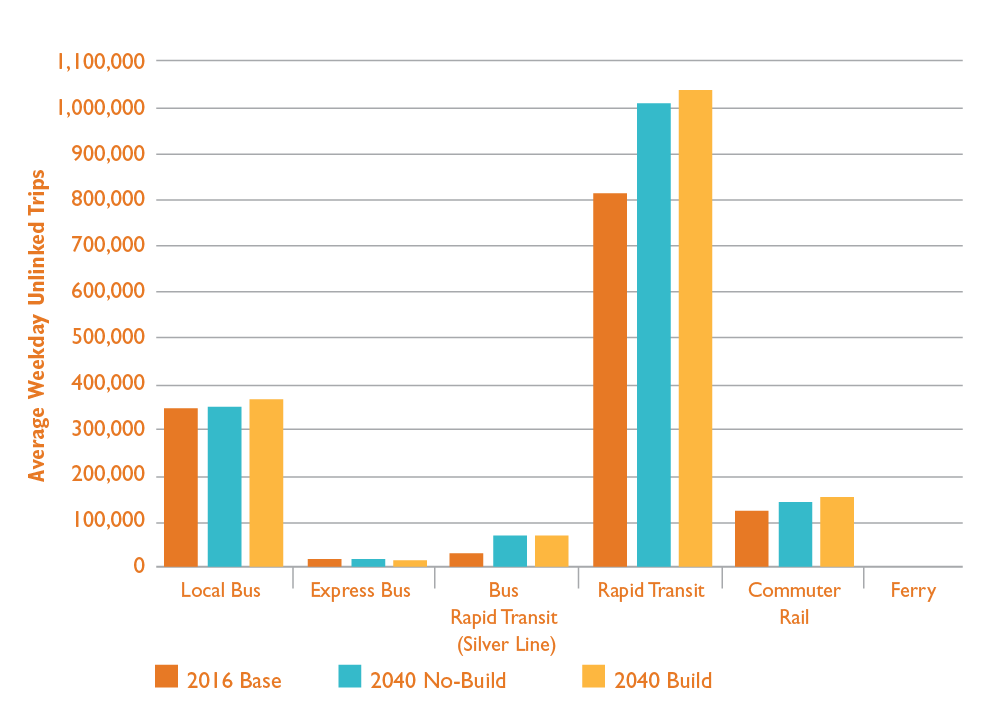
Source: Boston Region MPO.
In addition to overall growth in transit trips because of transit-conducive demographic growth, there is mode-specific growth that warrants further discussion. The number of unlinked trips on the bus rapid transit system is forecasted to grow by 37,400 trips (112 percent) in the 2040 No-Build condition. This is based on forecasted congestion on roadway corridors where bus rapid transit services are offered, such as those to South Boston and the corridor heading south to Dudley Square, and an extension of the Silver Line service from South Station and the Airport to Chelsea.
Rapid transit lines also are expected to grow significantly, from 814,100 trips in 2016 to 1,012,100 in 2040, a 24 percent increase. This is a result of new rapid transit services, including the Green Line Extension in Somerville and Medford, service enhancements for the Blue Line, and capacity expansions in a number of park-and-ride locations along the rapid transit service corridors. A new Inner Harbor ferry and water taxi services are being implemented to support the Encore Casino. This added capacity attracted new ferry trips, rising from 4,500 in 2012 to 7,600 in 2040.
Although the model forecasted auto mode share to decline compared to transit and nonmotorized modes, the model estimated a net increase in several metrics from highway assignments. This is because a large number of the trip-making population will continue to depend on automobiles, which results in growth of total vehicle trips (from 11.8 million to 13.1 million, or 12 percent) and total VMT (from 77.8 million to 82.4 million, or 6 percent). With this increased level of automobile and other vehicle (non-transit) activities, roadway links will remain congested. This is reflected in the larger growth in total VHT as compared to VMT. VHT is estimated to grow from 3 million in the 2016 Base Year to 3.5 million under 2040 No-Build conditions, leading to a decrease in average speed on roadway links (-12 percent). Freight trucks traverse the same roadway facilities as passenger automobiles, and their share of VHTs is estimated to decline at a rate of almost -3 percent.
The cumulative effects of major highway capacity projects on vehicle travel, as analyzed in the 2040 Build condition, is minimal. With more roadway capacity introduced, there is a slight decrease in VMT (-0.4 percent), and a decline in VHT (-2.1 percent). This reduction in vehicle travel time between Build and No-Build conditions is expected, as the Build condition consisted of few large infrastructure projects from the Major Infrastructure Program.
During the life of Destination 2040, the Boston Region Metropolitan Planning Organization (MPO) will continue its transition to a performance-based approach to making investments in the region’s transportation system. This chapter discusses the MPO’s performance-based planning and programming (PBPP) process. It also describes the MPO’s current set of performance measures and targets, and provides information about the current state of the region’s transportation system with respect to relevant measures. Finally, it explains how the recommended Destination 2040 plan will help the Boston Region MPO make progress toward its performance goals.
Over the past few decades, transportation agencies have been expanding the role of performance management—a strategic approach that uses data to help achieve desired outcomes—in their decision-making processes. Performance management is credited with improving project and program delivery, informing investment decision making, focusing staff on leadership priorities, and providing greater transparency and accountability to the public.
PBPP applies data and performance management principles to inform decision making. For the Boston Region MPO, these decisions focus on achieving desired outcomes for the Boston region’s multimodal transportation system. The purpose of PBPP is to ensure that transportation investment decisions, both for long-term planning and short-term funding, are oriented toward meeting established goals. Performance-based planning and programming activities include the following:
The MPO’s PBPP process is shaped by both federal transportation performance management requirements and the MPO’s goals and objectives, which are established as part of the MPO’s Long-Range Transportation Plan (LRTP).
The Moving Ahead for Progress in the 21st Century Act (MAP-21) directed states, MPOs, and public transportation providers to carry out a performance and outcome-based surface transportation program, and these requirements have been continued under the current federal transportation funding law, the Fixing America's Surface Transportation (FAST) Act. MAP-21 identified seven national goals for the nation’s highway system:
Table 5-1 shows the relationship between these national goal areas and the MPO’s goal areas. The MPO’s goals and related objectives are described in more detail in Chapter 1 of this document.
Table 5-1
National and Boston Region MPO Goal Areas
National Goal Area |
Boston Region MPO Goal Area |
Safety |
Safety |
Infrastructure Condition |
System Preservation and Modernization |
System Reliability |
Capacity Management/Mobility |
Congestion Reduction |
Capacity Management/Mobility |
Freight Movement/Economic Vitality |
Capacity Management/Mobility and Economic Vitality |
Environmental Sustainability |
Clean Air/Sustainable Communities |
Reduced Project Delivery Delays |
Not applicable |
Not applicable |
Transportation Equity |
MPO = Metropolitan Planning Organization.
Source: Boston Region MPO.
MAP-21 and the FAST Act’s federal PBPP mandate is also designed to help the nation’s public transportation systems provide high-quality service to all users, including people with disabilities, seniors, and individuals who depend on public transportation.
The US Department of Transportation (USDOT), in consultation with states, MPOs, and other stakeholders, has established measures in performance areas relevant to the aforementioned national goals through a series of federal rulemakings. Table 5-2 lists federally required performance measures for transit systems and Table 5-3 lists federally required performance measures for the highway system. These performance measures and relevant performance targets are discussed in more detail later in this chapter.
Table 5-2
Federally Required Transit Performance Measures
National Goal Area |
Transit Performance Area or Asset Category |
Performance Measures |
Relevant MPO Goal Area |
Safety |
Fatalities |
Total number of reportable fatalities and rate per total vehicle revenue-miles by mode |
Safety |
Safety |
Injuries |
Total number of reportable injuries and rate per total vehicle revenue-miles by mode |
Safety |
Safety |
Safety Events |
Total number of reportable events and rate per total vehicle revenue-miles by mode |
Safety |
Safety |
System Reliability |
Mean distance between major mechanical failures by mode |
Safety |
Infrastructure Condition |
Equipment |
Percent of vehicles that have met or exceeded their ULB |
System Preservation and Modernization |
Infrastructure Condition |
Rolling Stock |
Percent of revenue vehicles within a particular asset class that have met or exceeded their ULB |
System Preservation and Modernization |
Infrastructure Condition |
Infrastructure |
Percent of track segments with performance restrictions |
System Preservation and Modernization |
Infrastructure Condition |
Facilities |
Percent of facilities within an asset class rated below 3.0 on the Federal Transit Administration’s Transit Economic Requirements Model scale |
System Preservation and Modernization |
MPO = Metropolitan Planning Organization. ULB = Useful Life Benchmark.
Sources: National Public Transportation Safety Plan (January 2017), the Public Transportation Agency Safety Plan Rule (Title 49 Code of Federal Regulations [CFR] Part 673), and the Transit Asset Management Rule (49 CFR Part 625).
Table 5-3
Federally Required Roadway Performance Measures
National Goal Area |
Highway Performance Area |
Performance Measures |
Relevant MPO Goal Area |
Safety |
Injuries and Fatalities |
Number of fatalities Fatality rate per 100 million vehicle-miles traveled Number of serious injuries Serious injury rate per 100 million vehicle-miles traveled Number of nonmotorized fatalities and nonmotorized serious injuries |
Safety |
Infrastructure Condition |
Pavement Condition |
Percent of pavements on the Interstate System in good condition Percent of pavements on the Interstate System in poor condition Percent of pavements on the non-Interstate NHS in good condition Percent of pavements on the non-Interstate NHS in poor condition |
System Preservation and Modernization |
Infrastructure Condition |
Bridge Condition |
Percent of NHS bridges by deck area classified as in good condition Percent of NHS bridges by deck area classified as in poor condition |
System Preservation and Modernization |
System Reliability |
Performance of the NHS |
Percent of the person-miles traveled on the Interstate System that are reliable Percent of the person-miles traveled on the non-Interstate NHS that are reliable |
Capacity Management/Mobility |
System Reliability, Freight Movement and Economic Vitality |
Freight Movement on the Interstate System |
Truck Travel Time Reliability Index (for truck travel on interstate highways) |
Capacity Management/Mobility, Economic Vitality |
Congestion Reduction |
Congestion Mitigation and Air Quality |
Annual hours of peak hour excessive delay per capita (for travel on NHS roadways) Percentage of non-single-occupant vehicle travel |
Capacity Management/Mobility |
Environmental Sustainability |
Congestion Mitigation and Air Quality |
Total emissions reduction for applicable pollutants and precursors for CMAQ-funded projects in designated nonattainment and maintenance areas1 |
Clean Air/Sustainable Communities |
1 As of the Federal Highway Administration’s 2017 Congestion Mitigation and Air Quality Improvement Program performance requirements applicability determination, the Boston Region MPO area contains an area designated as in maintenance for carbon monoxide, so the MPO is currently required to comply with this performance measure requirement.
CMAQ = Congestion Mitigation and Air Quality Improvement. MPO = Metropolitan Planning Organization. NHS = National Highway System.
Sources: Highway Safety Improvement Program Rule (23 CFR 924), National Performance Management Measures Rule (23 CFR 490).
These federal performance measure rulemakings also identify key activities that agencies receiving federal transportation dollars must complete in order to integrate these federally required performance measures into their planning processes:
The MPO’s PBPP process must respond to the federal performance management requirements established under MAP-21 and the FAST Act, but it can also address other areas that pertain to its 3C responsibilities or relate to the MPO’s goals and objectives. For example, MAP-21 and the FAST Act do not specify transportation equity (TE) performance measures for states and MPOs to monitor. However, the MPO has established a TE goal to ensure that all people receive comparable benefits from, and are not disproportionately burdened by, MPO investments, regardless of race, color, national origin, age, income, ability, or sex.
The MPO’s TE goal and its associated objectives are rooted in several federal regulations and presidential executive orders, including Title VI of the Civil Rights Act of 1964, Executive Order 12898 (addressing environmental justice [EJ]), the Americans with Disabilities Act, and other USDOT orders. For more information on these laws and orders, see Chapter 6. To comply with these regulations, the MPO systematically addresses the concerns of populations that these regulations protect, referred to here as TE populations, throughout the MPO planning process, including when selecting projects for the LRTP and the TIP. Regular equity performance monitoring enables the MPO to better understand how TE populations in the region may be affected by transportation investment decisions, so that it can decide whether and how to adjust its investment approach.
To build a comprehensive PBPP practice, the MPO can also choose to monitor or set targets for additional performance measures, which are not federally required, that apply to its goal areas. For example, while the federally required reliability measures discussed in Table 5-3 apply to the MPO’s Capacity Management and Mobility goal, the MPO may wish to examine measures that account for non-NHS roadways or other travel modes. Over the coming years, the MPO will examine whether and how to incorporate other performance measures and practices into its PBPP process.
States, MPOs, and public transportation providers integrate federally required performance measures—and other measures, as desired—into their respective PBPP processes, which involve three key phases focused on (1) planning, (2) investing, and (3) monitoring and evaluating.
In the planning phase, agencies set goals and objectives for the transportation system, identify performance measures, and set performance targets that will guide their decision making. They identify and acquire data and conduct analyses necessary to support these processes. They also outline the frameworks they will use in key planning documents.
The Commonwealth creates performance-based plans for Massachusetts, such as the SHSP, TAMP, and MassDOT TAM Plan, along with modal plans— such as its Freight Plan, Bicycle Transportation Plan, and Pedestrian Transportation Plan— which include PBPP elements. Similarly, transit agencies, including the Massachusetts Bay Transportation Authority (MBTA), MetroWest Regional Transit Authority (MWRTA), and Cape Ann Transportation Authority (CATA), create TAM plans and PSTAPs that describe the data and processes these agencies will use to address transit state of good repair and safety needs. The Commonwealth is responsible for setting performance targets for the federally required roadway performance measures described in Table 5-3, while transit agencies must set targets for the measures described in Table 5-2. MassDOT's annual tracker report (available at massdottracker.com) describes the agencies targets for federally required and other performance measures, including measures pertaining to the MBTA and the commonwealth's RTAs.
Boston Region MPO activities in the planning phase include setting goals for the transportation system through its LRTP and establishing targets for federally required performance measures. To establish these targets, the MPO may elect to support performance targets set by the Commonwealth or public transit providers (depending on the measure), or it may set separate targets for the MPO area. MPOs typically have 180 days after a state establishes a set of performance targets to choose to support those state targets or to adopt separate targets for the MPO region. For transit safety and asset management targets, MPOs work with local transit providers to develop targets that are appropriate for the region. These agencies will update their performance targets based on defined cycles, which vary for different measures. To meet federal requirements,
In the investing phase, agencies use the PBPP frameworks established in the planning phase to create strategies for investing transportation funding. The MPO selects programs and projects that it will fund using its Regional Target funds and documents those decisions in the LRTP and TIP. The MPO’s LRTP identifies major infrastructure projects for funding over the next 20 years or more, and it establishes investment programs that will fund smaller-scale projects in those future years. The TIP specifies funds for all projects the MPO selects for a given five-year timeframe.5-1 Similarly, the Massachusetts Department of Transportation (MassDOT), the MBTA, CATA, and MWRTA follow their processes to size programs and the select projects for inclusion in the MassDOT Capital Investment Plan (CIP). The federally funded investments they include in the CIP are also documented in the STIP.
After making plans and investments, agencies take stock of their progress by reviewing and reporting on their outputs and performance outcomes. Activities in the monitoring and evaluating phase include tracking trends, collecting data to understand the results of investment decisions, and comparing targets to actual performance. At the statewide level, MassDOT reports performance to USDOT through a federal online performance management form and includes information about its federally required performance targets in the TIP. MassDOT’s Tracker website (massdottracker.com) )also includes detailed information about the agency’s targets and progress. Transit agencies report progress on TAM measures to the NTD each year. The MPO reports on performance in the LRTP and through its Congestion Management Process (CMP), as well as through other tools, such as the MPO’s Performance Dashboard. In this phase, the MPO may also assess the need for new data resources or methods to support its PBPP process, and may designate resources to address these needs in its Unified Planning Work Program.
Figure 5-1 summarizes the three phases of this process, with a focus on MPO activities taking place in each phase.
Figure 5-1
Phases in the MPO’s Performance-Based Planning and Programming Process
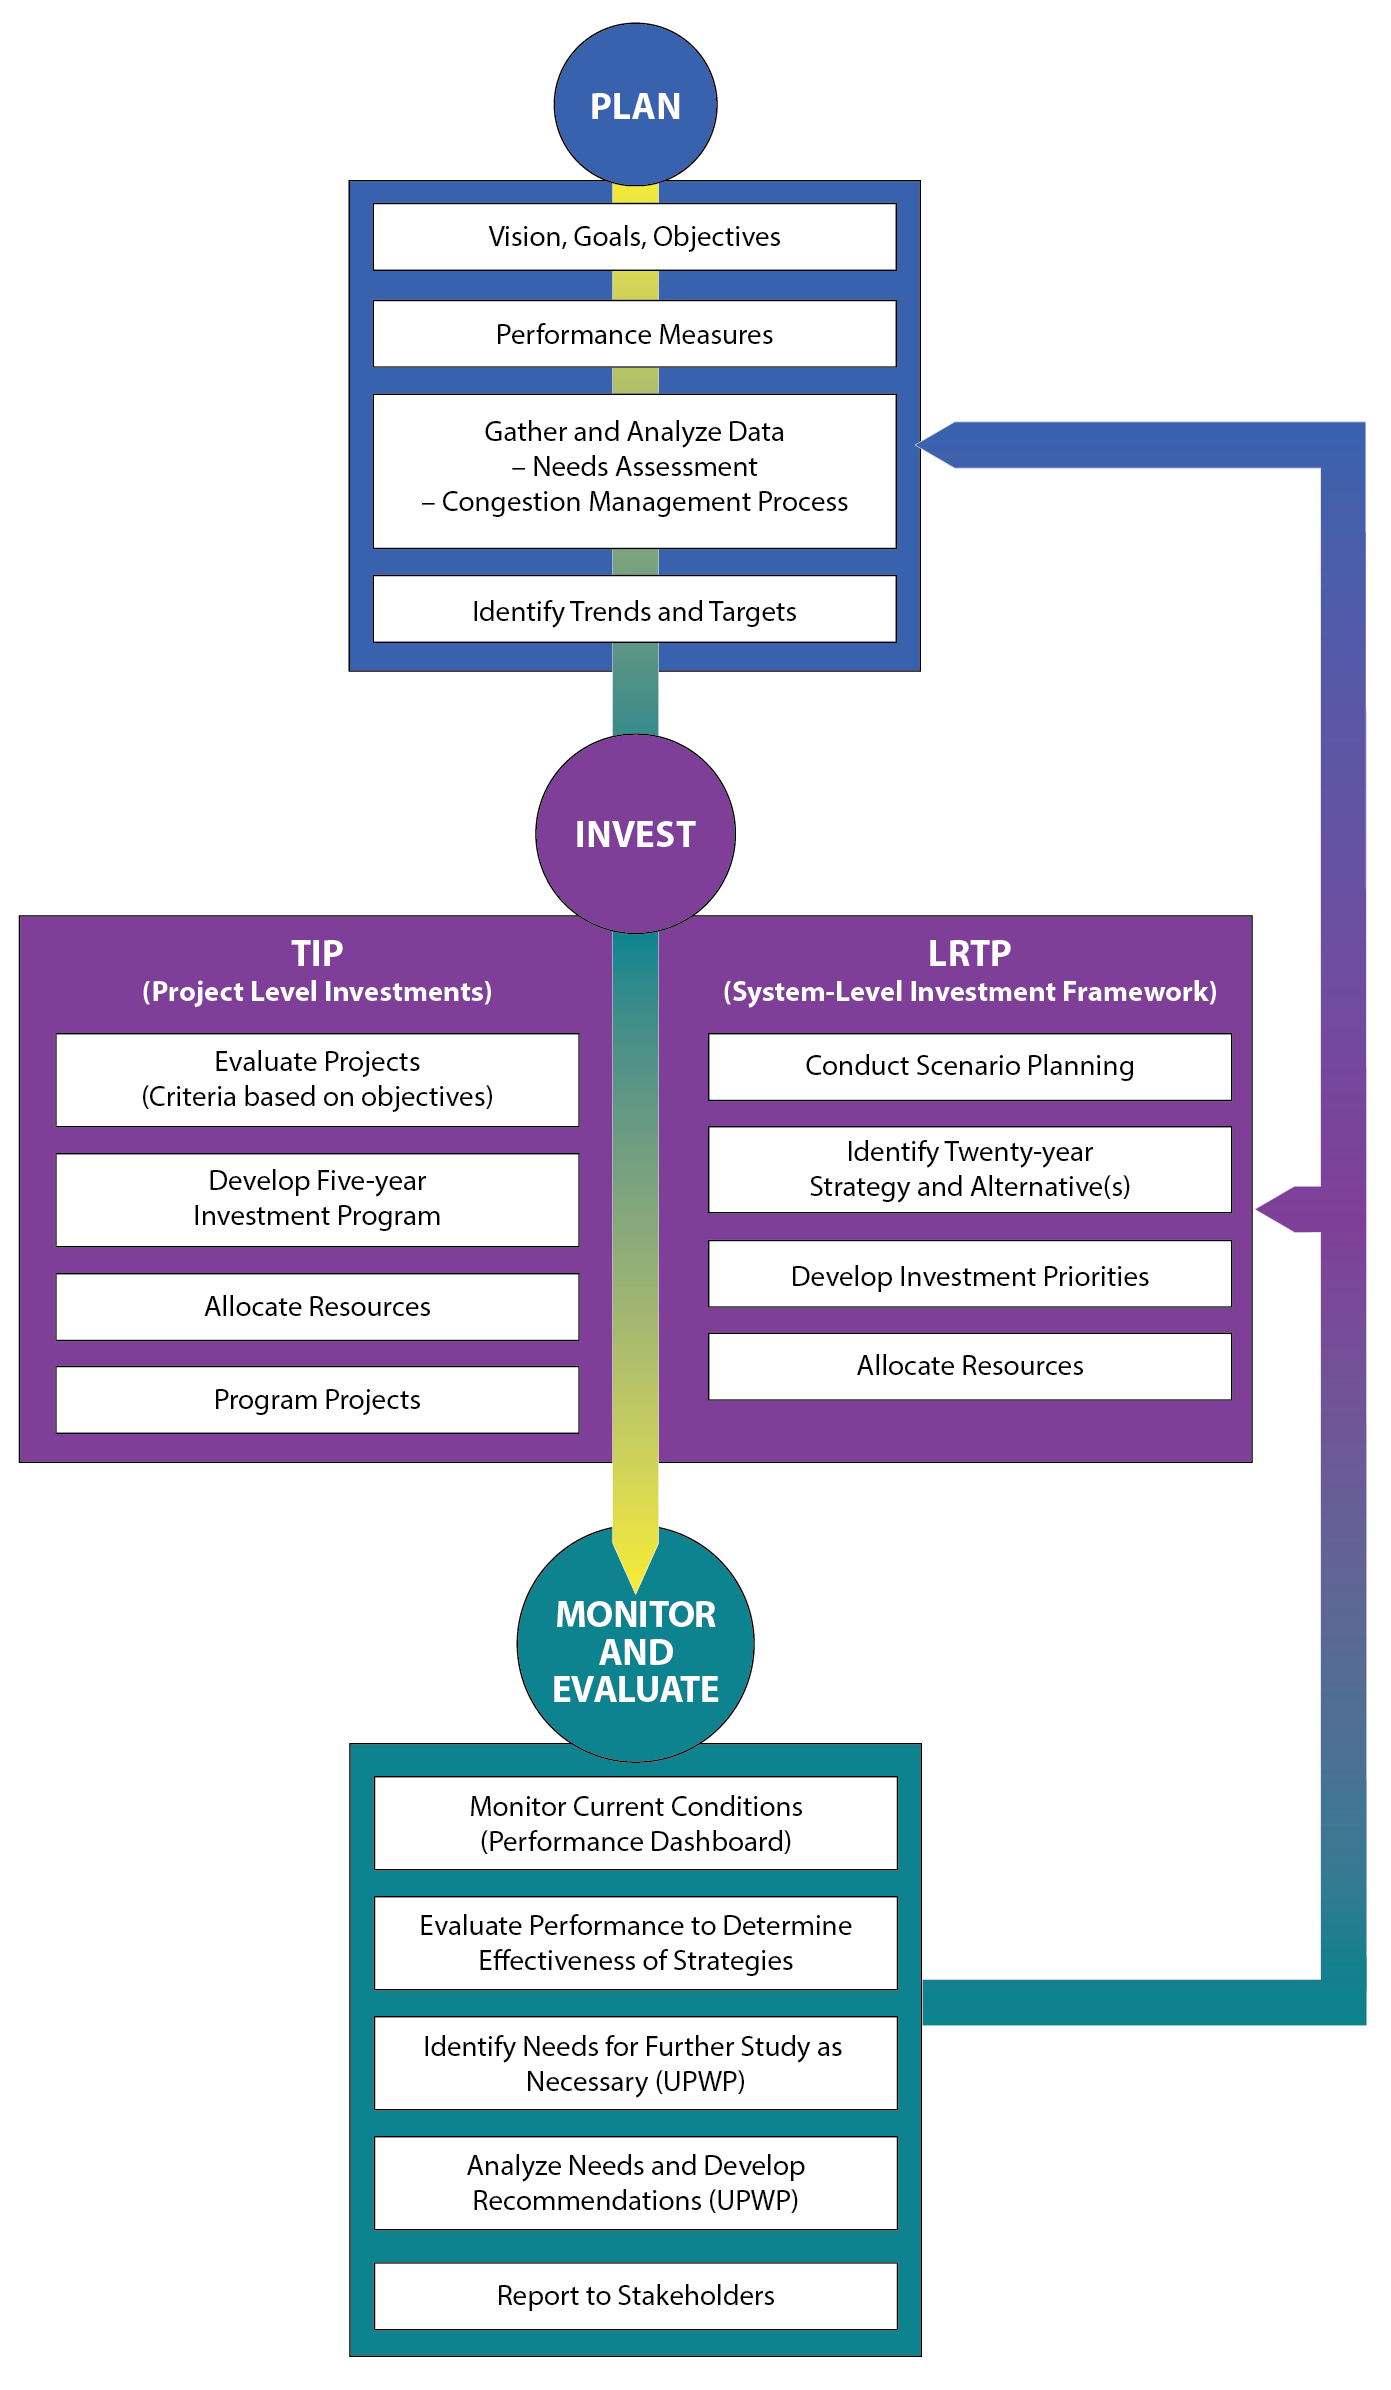
LRTP = Long-Range Transportation Plan. MPO = Metropolitan Planning Organization. TIP = Transportation Improvement Program. UPWP = Unified Planning Work Program.
Source: Boston Region MPO.
To support the activities discussed above, states, public transit operators, and MPOs must coordinate with one another and share information and data to ensure consistency across processes. In Massachusetts, these coordination responsibilities are outlined in the 2019 Performance-Based Planning and Programming Agreement between MassDOT, Massachusetts MPOs, transportation planning organizations, the MBTA, and regional transit authorities (RTAs) operating in Massachusetts.
Staff from Massachusetts MPOs, MassDOT staff, and other stakeholders coordinate on PBPP implementation through the Transportation Program Managers Group’s subcommittee on performance measures. For performance measures that states and MPOs track at the Boston UZA level, coordination responsibilities are documented in the 2018 Boston Urbanized Area Memorandum of Understanding.5-2
As previously mentioned, the Boston Region MPO’s LRTP plays several key roles in the MPO’s PBPP process, many of which fall into the planning phase.
Once the LRTP is completed and in effect, the MPO refers to it on an ongoing basis to support its PBPP process. The LRTP’s long-term investment strategies will inform the short-term capital investment decisions the MPO makes each year in the TIP, which describes the links between short-term capital investment priorities and the MPO’s performance goals, measures, and performance targets. The system performance report in the LRTP provides a snapshot in time that the MPO can use to benchmark its progress in improving both the transportation system and transportation performance outcomes. The MPO can also look to the detailed information in the Destination 2040 Needs Assessment (https://www.bostonmpo.org/lrtp_needs ) as it explores ways to broaden the set of performance measures that it monitors.
As of July 2018, FHWA and FTA published final rules for all performance measure rulemakings associated with the performance management mandate first included in MAP-21, and continued as part of the FAST Act. This System Performance section is the MPO’s first report on system performance since those federal rules were finalized. It provides information about plans, measures, baselines, and targets that are relevant to each MPO goal area and it concludes with a description of how Destination 2040’s investment strategies—including its investment programs and targets—may help support progress in MPO goal areas and federally required performance areas.5-3 While this section focuses specifically on federally required performance measures and targets, the corresponding goal area chapters in the Destination 2040 Needs Assessment present a variety of other metrics that characterize the state of the transportation system.
One of the MPO’s goals is that transportation by all modes will be safe. The MPO has committed to investing in projects and programs that aim to reduce the number and severity of crashes for all modes, and to reducing serious injuries and fatalities occurring on the transportation system. Similarly, the Massachusetts SHSP includes a long-term goal to move “towards zero deaths” by eliminating fatalities and serious injuries on the Commonwealth’s roadways and has set interim goals for 2022 reduce five-year average fatalities by 12 percent and serious injuries by 21 percent.5-4 In future years, the MPO will work more closely with the MBTA, CATA, and MWRTA to make safety-oriented investments and implement related initiatives as identified in their PTASPs.
The Commonwealth of Massachusetts and the MPO track traffic incidents, fatalities, and injuries involving motor vehicles using information from the Massachusetts Crash Data System and the National Highway Traffic Safety Administration’s (NHTSA) Fatality Analysis and Reporting System. These data inform the targets that the Commonwealth and the MPO must set each calendar year (CY) for five federally required roadway safety performance measures, which are also listed in Table 5-3:
These measures pertain to fatalities and serious injuries from traffic incidents and apply to all public roads. Values for these measures are expressed as five-year rolling annual averages. When establishing targets for these measures, the MPO can elect to support statewide targets set by the Commonwealth or set separate targets for the MPO region. The Commonwealth set its current set of roadway safety performance targets to reflect a 2015–19 rolling annual average, as required by FHWA. When setting these targets, the Commonwealth considered the following:
MassDOT was required to establish targets for all five measures for CY 2019 by August 31, 2018. The Boston Region MPO elected to support the Commonwealth’s CY 2019 roadway safety performance targets in February 2019, prior to its February 27, 2019, deadline. Figures 5-2 to 5-6 show statewide level trends for each performance measure along with the Commonwealth’s CY 2018 and current (CY 2019) performance targets. For context, the figures also show Boston region-specific values for each measure, including projected values for future years.
Figure 5-2 shows historic and projected values for the number of fatalities resulting from motor vehicle crashes, while Figure 5-3 shows the fatality rate per 100 million VMT. Actual fatalities and fatality rates have declined slightly for Massachusetts and for the Boston region specifically, based on recent five-year rolling annual averages, and while CY 2016 fatality data showed an increase at both geographic scales, draft data for CY 2017 shows values closer to the lower CY 2015 values. The Commonwealth considered this information when setting targets for lowering the number of fatalities. Meanwhile, VMT has been gradually increasing for both the Boston region and Massachusetts as a whole, which also supports historic and projected decreases in the fatality rate.
Figure 5-2
Fatalities from Motor Vehicle Crashes
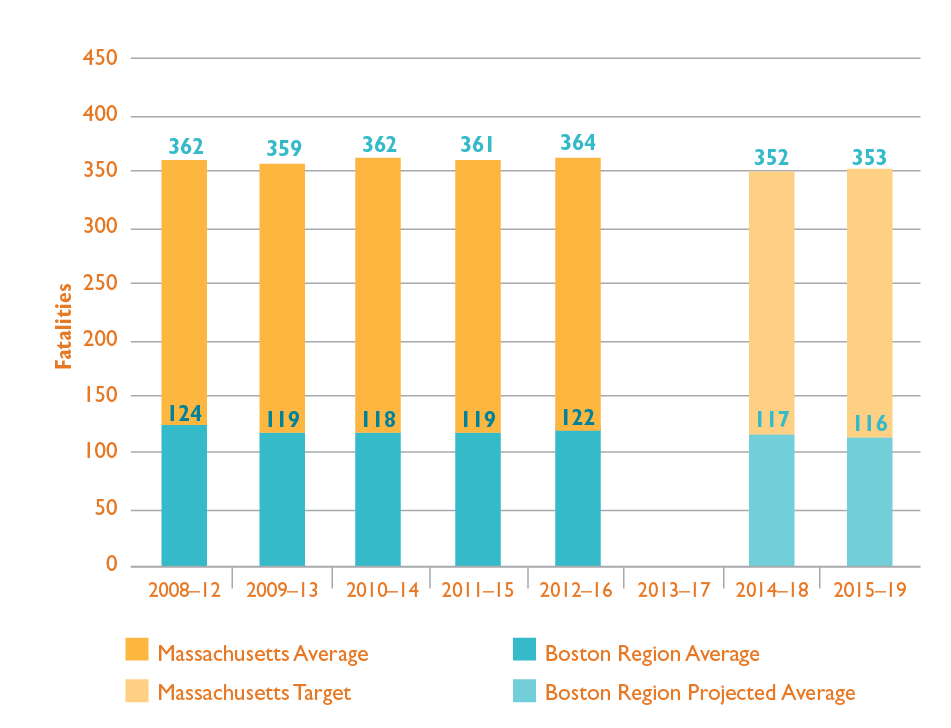
Note: Values reflect five-year rolling annual averages and have been rounded to the nearest integer. MPO staff developed projections for the Boston region using a linear trend line and a draft estimate of 103 fatalities for CY 2017.
CY = calendar year. MPO = Metropolitan Planning Organization.
Sources: National Highway Traffic Safety Administration Fatality Analysis and Reporting System, Massachusetts Department of Transportation, and the Boston Region MPO.
Figure 5-3
Fatality Rate per 100 Million Vehicle-Miles Traveled
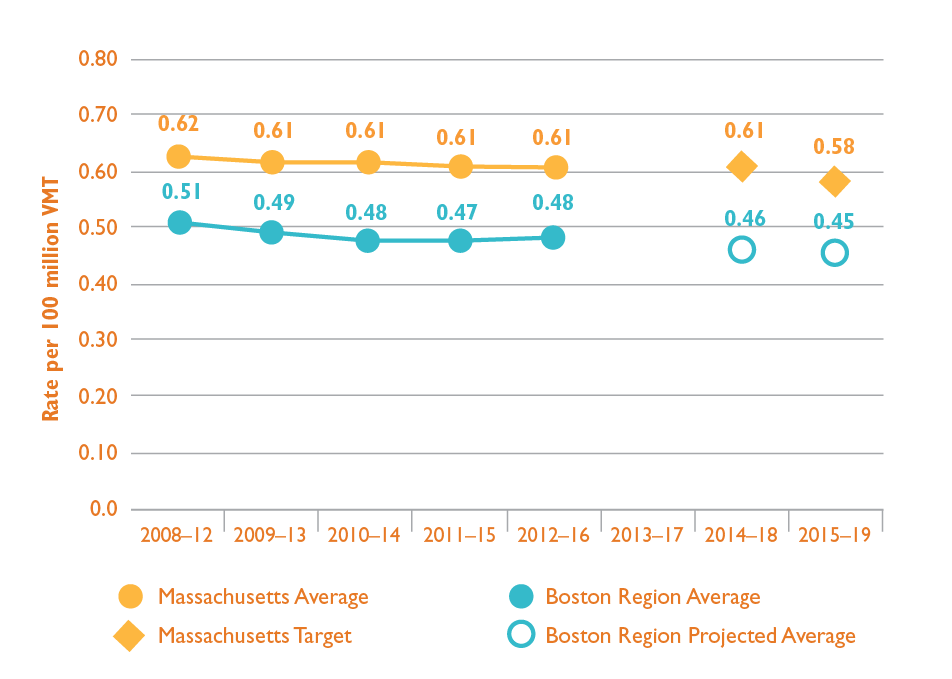
Note: Values reflect five-year rolling annual averages and have been rounded to the hundredth decimal place. MPO staff developed projections for the Boston region using a linear trend line, a draft estimate of 103 fatalities for CY 2017, and an estimate of CY 2017 VMT from MassDOT (approximately 25.5 billion VMT).
CY = calendar year. MassDOT = Massachusetts Department of Transportation. MPO = Metropolitan Planning Organization. VMT = vehicle-miles traveled.
Sources: National Highway Traffic Safety Administration Fatality Analysis and Reporting System, MassDOT, and the Boston Region MPO.
Figure 5-4 shows historic and projected values for the number of serious injuries resulting from motor vehicle crashes, and Figure 5-5 shows the serious injury rate per 100 million VMT.5-5 For both the Boston region and Massachusetts as a whole, serious injuries and serious injury rates have been decreasing over time and are projected to continue to decrease.
Figure 5-4
Serious Injuries from Motor Vehicle Crashes
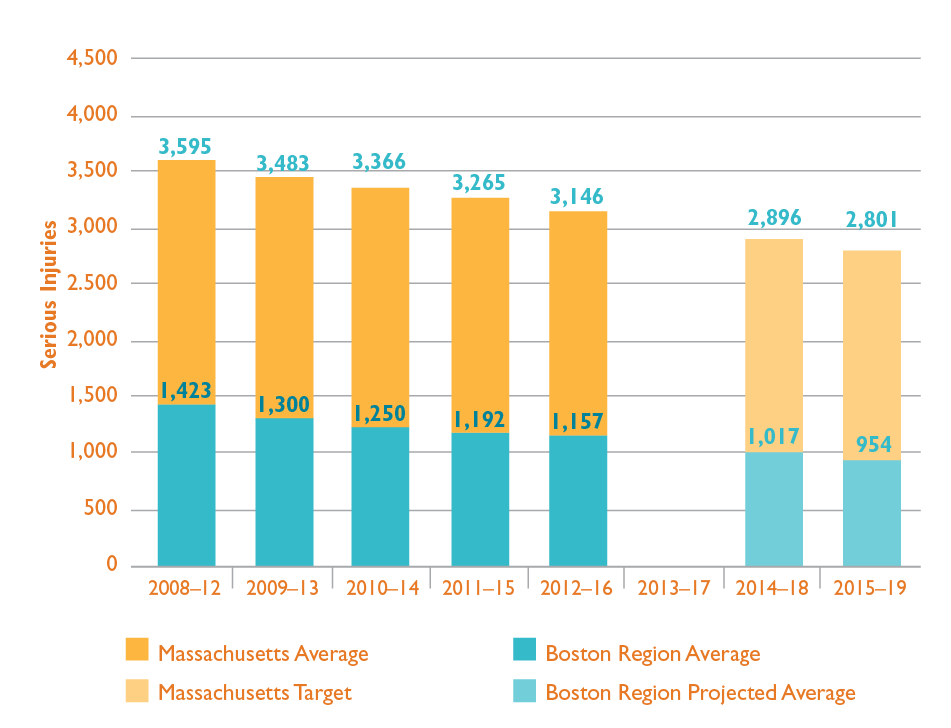
Note: Values reflect five-year rolling annual averages and have been rounded to the nearest integer. MPO staff developed projections for the Boston region using a linear trend line and a draft estimate of 938 serious injuries for CY 2017.
CY = calendar year. MPO = Metropolitan Planning Organization.
Sources: Massachusetts Crash Data System, Massachusetts Department of Transportation, and the Boston Region MPO.
Figure 5-5
Serious Injury Rate per 100 Million Vehicle-Miles Traveled
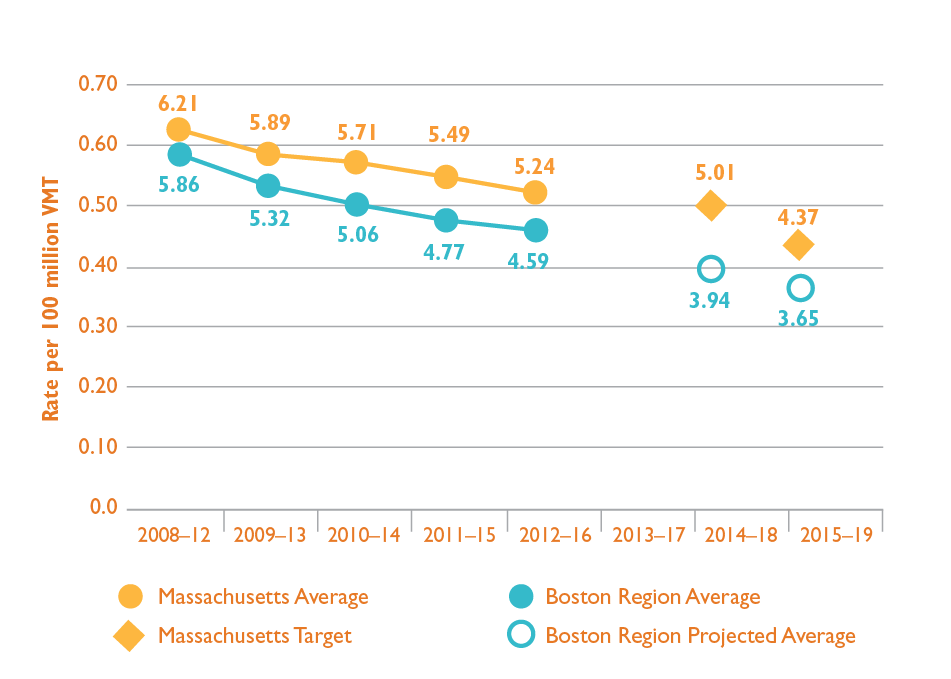
Note: Values reflect five-year rolling annual averages and have been rounded to the hundredth decimal place. MPO staff developed projections for the Boston region using a linear trend line, a draft estimate of 938 serious injuries for CY 2017, and an estimate of CY 2017 VMT from MassDOT (approximately 25.5 billion VMT).
CY = calendar year. MassDOT = Massachusetts Department of Transportation. MPO = Metropolitan Planning Organization. VMT = vehicle-miles traveled.
Sources: Massachusetts Crash Data System, MassDOT, and the Boston Region MPO.
Figure 5-6 shows historic and projected values for the number of fatalities and serious injuries experienced by people traveling by nonmotorized means for the Boston region and Massachusetts as a whole. This category reflects bicyclist and pedestrian fatalities and serious injuries, as well as those experienced by others traveling by nonmotorized modes (such as skateboarders). Unlike the prior measures, values for this measure have been increasing over time for both the Boston region and Massachusetts overall.
Figure 5-6
Nonmotorized Fatalities and Serious Injuries
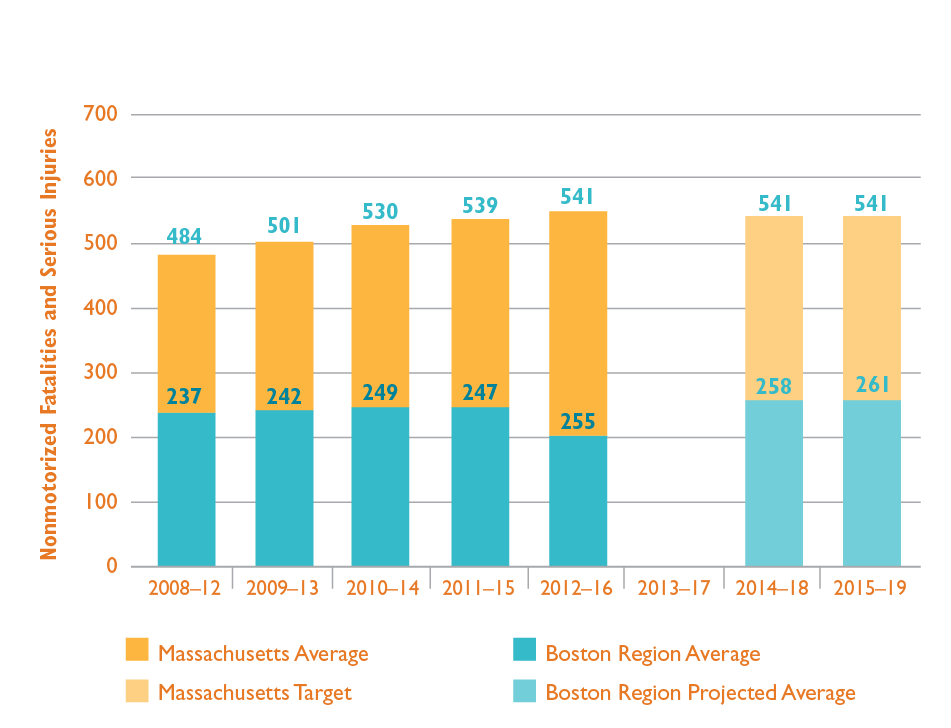
Notes: Values reflect five-year rolling annual averages and have been rounded to the nearest integer. MPO staff developed projections for the Boston region using a linear trend line, a draft estimate of 32 nonmotorized fatalities for CY 2017, and a draft estimate of 220 nonmotorized serious injuries for CY 2017.
CY = calendar year. MPO = Metropolitan Planning Organization.
Sources: National Highway Traffic Safety Administration Fatality Analysis and Reporting System, Massachusetts Crash Data System, Massachusetts Department of Transportation, and the Boston Region MPO.
Figures 5-7 and 5-8 provide insight about bicyclist, pedestrian, and other nonmotorized traveler fatalities and serious injuries. For both the Boston region and Massachusetts overall, pedestrian fatalities and serious injuries comprise most nonmotorized fatalities and serious injuries.
Figure 5-7
Nonmotorized Fatalities and Serious Injuries in Massachusetts by Mode
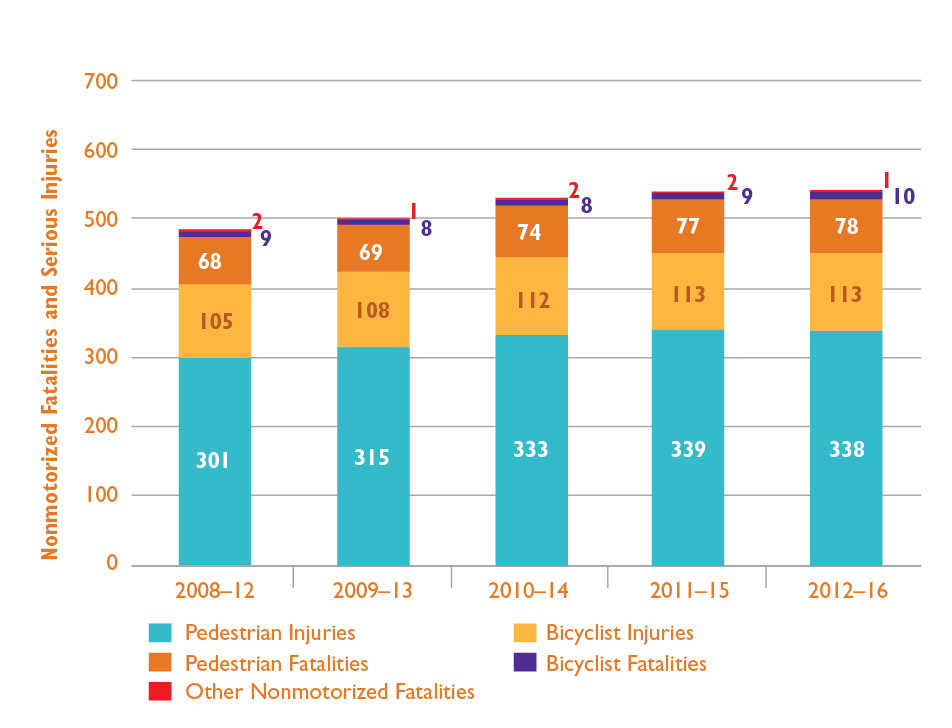
Note: All values have been rounded to nearest integer.
Sources: National Highway Traffic Safety Administration Fatality Analysis Reporting System, Massachusetts Crash Data System, MassDOT, and the Boston Region MPO.
Figure 5-8
Nonmotorized Fatalities and Serious Injuries in the Boston Region by Mode
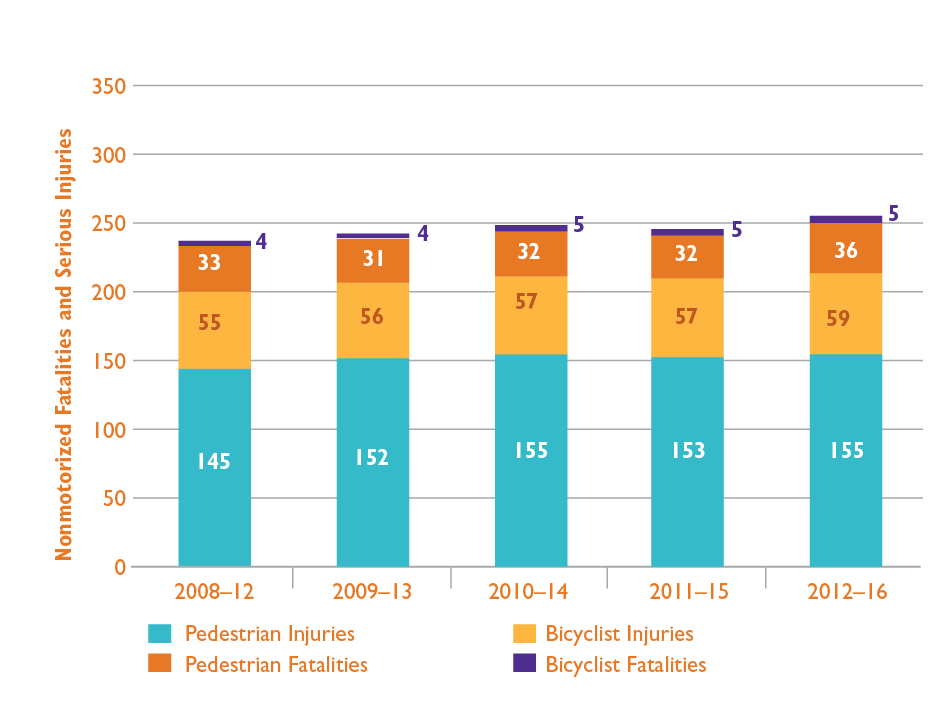
Note: All values have been rounded to nearest integer.
Sources: National Highway Traffic Safety Administration Fatality Analysis Reporting System, Massachusetts Crash Data System, Massachusetts Department of Transportation, and the Boston Region MPO.
MassDOT recognizes that its initiatives to increase nonmotorized travel throughout the Commonwealth have posed a challenge to concurrent activities to reduce nonmotorized fatalities and injuries. Rather than adopt a target that reflects an increased amount of nonmotorized fatalities and serious injuries, MassDOT has kept its nonmotorized performance targets to date approximately level with recent baselines. It plans to counter increasing trends in nonmotorized fatalities and serious injuries through investments and other initiatives that address safety for pedestrians, bicyclists, and others who travel by nonmotorized means.
Table 5-4 lists the Commonwealth’s 2012–16 rolling average values for the fatality and serious injury performance measures; these make up Massachusetts’ current roadway safety baselines for these measures. This table also lists the Commonwealth’s current (CY 2019) targets for the federally required roadway safety performance measures.
Table 5-4
Massachusetts Highway Safety Performance Baselines and CY 2019 Targets
Highway Safety Performance Measure |
Baseline: |
2019 Safety Measure Target (Expected 2015–19 Rolling Average) |
Number of fatalities |
363.80 |
353.00 |
Rate of fatalities per 100 million vehicle-miles traveled |
0.61 |
0.58 |
Number of serious injuries |
3145.80 |
2801.00 |
Rate of serious injuries per 100 million vehicle-miles traveled |
5.24 |
4.37 |
Number of nonmotorized fatalities and nonmotorized serious injuries |
540.80 |
541.00 |
Note: All values have been rounded to the hundredth place.
CY = calendar year.
Sources: National Highway Traffic Safety Administration Fatality Analysis Reporting System, Massachusetts Crash Data System, and MassDOT.
As previously mentioned, the MPO elected to support the Commonwealth’s CY 2019 roadway safety performance targets in February 2019. By electing to support the Commonwealth’s roadway safety targets, the MPO agrees to plan and program projects that contribute to achieving these targets.
Under FTA’s Public Transportation Agency Safety Plan Rule, which went into effect in July 2019, transit agencies will be responsible for developing PTASPs, which they must review and update annually. These plans, which transit agencies must produce by July 2020, will include targets for transit safety performance measures that are defined in the National Public Transportation Safety Plan. These measures, also listed in Table 5-2, include the following:
Once transit agencies develop their safety plans and performance targets, they must share them with state DOTs and MPOs, which will set targets for their states and MPO regions, respectively. Future MPO LRTPs will include information on federally required transit safety measure baselines and targets; however, general information on these topics is available in the Safety goal area chapter of the Destination 2040 Needs Assessment ( https://www.bostonmpo.org/lrtp_needs. )
The MPO’s goal for this area is to maintain and modernize the transportation system and plan for its resiliency. System preservation policies for the region must encompass bridges, pavement, sidewalks, and transit system assets. They must address existing maintenance and state-of-good-repair needs and necessary updates to infrastructure to meet customer needs, and they must also prepare for existing or future extreme conditions, such as sea level rise and flooding.
The Complete Streets projects, Intersection Improvements projects, and other projects that the MPO funds support asset condition improvements, which complement MassDOT and transit agencies’ more extensive state-of-good-repair and modernization projects. MassDOT uses information from its internal asset management systems to guide decisions about asset maintenance and modernization and considers investment priorities from its TAMP. 5-6 The TAMP is a federally required risk-based asset management plan that includes asset inventories, condition assessments, and investment strategies to improve the condition and performance of the NHS, particularly its bridges and pavements. Similarly, transit agencies that receive FTA funding must produce TAM plans that describe transit system assets and condition and the tools and investment strategies these agencies will use to improve them.
To meet federal performance monitoring requirements, states and MPOs must track and set performance targets for the condition of bridges on the NHS. FHWA’s bridge condition performance measures include the following:
These performance measures classify NHS bridge condition as good, fair, or poor based on the condition ratings of three bridge components: the deck, the superstructure, and the substructure.5-7 The lowest rating of the three components determines the overall bridge condition.5-8 The measures express the share of NHS bridges in a certain condition by deck area, divided by the total deck area of NHS bridges in the applicable geographic area (state or MPO).
Table 5-5 shows performance baselines for the condition of bridges on the NHS in Massachusetts and the Boston region. MassDOT analyzed the 2,246 bridges on the NHS in Massachusetts to understand their current condition with respect to the federal bridge condition performance measures. The Boston Region MPO performed a similar analysis on the 859 bridges on the NHS in the Boston region. According to these baseline values, the Boston region has a larger share of NHS bridge deck area considered to be in good condition, and a slightly smaller share of NHS bridge deck area considered to be in poor condition, compared to Massachusetts overall.
Table 5-5
Massachusetts and Boston Region NHS Bridge Condition Baselines
Geographic Area |
Total NHS Bridges |
Total NHS Bridge Deck Area (square feet) |
Percent of NHS Bridges in Good Condition |
Percent of NHS Bridges in Poor Condition |
Massachusettsa |
2,246 |
29,457,351 |
15.2% |
12.4% |
Boston regionb |
859 |
14,131,094 |
19.2% |
11.8% |
a Massachusetts baseline data is based on a MassDOT analysis conducted in 2018.
b Boston region comparison data is based on a Boston Region MPO analysis conducted in 2018.
MassDOT = Massachusetts Department of Transportation. MPO = metropolitan planning organization. NHS = National Highway System.
Sources: MassDOT and Boston Region MPO.
States must set performance targets for these NHS bridge performance measures at two-year and four-year intervals. For the first federal performance period, MassDOT was required to establish targets for bridge condition measures by May 20, 2018. Table 5-6 shows MassDOT’s NHS bridge performance targets. The two-year target reflects conditions as of the end of CY 2019, and the four-year target reflects conditions as of the end of CY 2021. These targets reflect anticipated conditions based on historic trends and planned bridge investments. As shown in the table, MassDOT expects there will be a small increase in the share of NHS bridge deck area in good condition by the end of CY 2021, while it expects that the share of NHS bridge deck area in poor condition in CY 2021 will be slightly lower than the baseline.
Table 5-6
MassDOT’s NHS Bridge Condition Targets
Federally Required Bridge Condition Performance Measure |
2018 Measure Value (Baseline) |
Two-Year Target |
Four-Year Target |
Percent of NHS Bridges [by deck area] that are in good condition |
15.2% |
15.0% |
16.0% |
Percent of NHS Bridges [by deck area] that are in poor condition |
12.4% |
13.0% |
12.0% |
a The two-year target reflects conditions as of the end of CY2019, and the four-year target reflects conditions as of the end of CY 2021.
CY = calendar year. MassDOT = Massachusetts Department of Transportation. NHS = National Highway System.
Source: MassDOT.
MPOs are required to set four-year bridge performance targets by either electing to support state targets or setting separate quantitative targets for the MPO area.
The Boston Region MPO elected to support MassDOT’s four-year targets for these measures in November 2018, prior to its November 16, 2018, deadline and it will work with MassDOT to achieve these targets. MassDOT’s Bridge Program, described in more detail in Chapter 3, is the Boston region’s primary funding source for bridge replacement or rehabilitation; however, the MPO’s Regional Target investments also contribute modestly to bridge improvements.
The USDOT performance management framework requires states and MPOs to monitor and set targets for the condition of pavement on NHS roadways, a network that includes the Interstate Highway System and other roadways of importance to the nation’s economy, defense, and mobility. Massachusetts has 3,204 lane-miles of interstate roadways, 1,154 lane-miles (or 36 percent) of which are in the Boston region. The state’s non-interstate NHS network is made up of 7,319 lane-miles of roadways, and the Boston region contains 2,559 (or 35 percent) of those lane-miles. Applicable federal performance measures include the following:
The interstate performance measures classify interstate pavements as in good, fair, or poor condition based on their International Roughness Index (IRI) value and one or more pavement distress metrics (cracking and/or rutting and faulting) depending on the pavement type (asphalt, jointed concrete, or continuous concrete). The FHWA sets thresholds for each metric that determine whether the metric value is good, fair, or poor, along with thresholds that determine whether the pavement segment as a whole is considered to be in good, fair, or poor condition.5-9 Non-interstate NHS pavements are subject to the same thresholds for IRI values. States will be required to collect data for the complementary distress metrics starting in 2020, and those data will be incorporated into future performance monitoring.
MassDOT uses information from its Pavement Management program to track the condition of Massachusetts’ NHS network.5-10 As with the bridge condition measures, MassDOT was required to set targets for these federal pavement condition measures by May 20, 2018. MassDOT’s targets are shown along with baseline data in Table 5-7. As with the NHS bridge condition performance targets, the two-year target reflects conditions as of the end of CY 2019, and the four-year target reflects conditions as of the end of CY 2021. While MassDOT has collected IRI data in past years, these federally required performance me asures also require other types of distress data that have not previously been required as part of pavement monitoring programs. Setting targets for these pavement condition measures has been challenging given the lack of complete historic data. MassDOT used past pavement indicators to identify trends and to set conservative targets. MassDOT will revisit its four-year target in in 2020 when more data is available.
Table 5-7
Massachusetts NHS Pavement Condition Baselines and MassDOT NHS Pavement Condition Performance Targets
Federally Required Pavement Condition Performance Measure |
2017 Measure Value (Baseline) |
Two-Year Target |
Four-Year Target |
Percent of Interstate Highway System pavements that are in good conditiona |
74.2% |
70.0% |
70.0% |
Percent of Interstate Highway System pavements that are in poor conditiona |
0.1% |
4.0% |
4.0% |
Percent of non-interstate NHS pavements that are in good condition |
32.9% |
30.0% |
30.0% |
Percent of non-interstate NHS pavements that are in poor condition |
31.4% |
30.0% |
30.0% |
a For the first federal performance monitoring period (2018–21), the Federal Highway Administration has only required states to report four-year targets for pavement condition on the Interstate Highway System. MassDOT has developed both two-year and four-year targets for internal consistency.
CY = calendar year. MassDOT = Massachusetts Department of Transportation. NHS = National Highway System.
Source: MassDOT.
MPOs are required to set four-year interstate pavement condition and non-interstate NHS pavement condition performance targets by either supporting state targets or setting separate quantitative targets for the region. The Boston Region MPO elected to support MassDOT’s four-year targets for these NHS pavement condition measures in November 2018, prior to its deadline of November 16, 2018. The MPO will work with MassDOT to meet these targets through its Regional Target investments. While the MPO has maintained a policy to not use its Regional Target discretionary funding for projects that only resurface pavement, it does fund roadway reconstruction projects that include pavement improvements, in addition to other design elements.
The Boston region includes three transit agencies that regularly receive FTA funds to provide service—the MBTA, CATA, and MWRTA. These agencies are responsible for meeting planning and performance-monitoring requirements under FTA’s TAM rule, which focuses on achieving and maintaining a state of good repair for the nation’s transit systems. Each year, they must submit progress reports and updated performance targets for TAM performance measures, which relate to transit rolling stock, nonrevenue service vehicles, facilities, and rail fixed guideway infrastructure. Transit agencies develop these performance targets based on their most recent asset inventories and condition assessments, along with their capital investment and procurement expectations, which are informed by their TAM plans. MBTA, MWRTA, and CATA share their asset inventory and condition data and their performance targets with the Boston Region MPO, so that the MPO can monitor and set TAM targets for the Boston region. These transit agencies may also use other indicators beyond the federally required TAM measures to monitor and address the condition of their assets.
The following subsections discuss the MPO’s current performance targets (adopted in March 2019) for each of the TAM performance measures, which are listed in Table 5-2. When setting these targets, the MPO adopted the MBTA, CATA, and MWRTA state fiscal year (SFY) 2019 TAM performance targets for July 2018 through June 2019. These agencies submitted these TAM targets to the National Transit Database in October 2018 and aggregated some of the information for asset subgroups.
FTA’s TAM performance measure for the state of good repair for rolling stock and equipment vehicles (service support, maintenance, and other nonrevenue vehicles) is the percent of vehicles that meet or exceed their useful life benchmark (ULB). This performance measure uses vehicle age as a proxy for state of good repair (which may not necessarily reflect condition or performance), with the goal being to bring this value as close to zero as possible. FTA defines ULB as “the expected lifecycle of a capital asset for a particular transit provider’s operating environment, or the acceptable period of use in service for a particular transit provider’s operating environment.” For example, FTA’s default ULB value for a bus is 14 years. When setting targets, each agency has discretion to use FTA-identified default ULBs for vehicles or to adjust ULBs with approval from FTA. The MBTA has used FTA default ULBs for its rolling stock targets and uses MBTA-defined ULBs, which are based on agency-specific usage and experience, for its equipment targets. CATA and MWRTA have selected ULBs from other sources.5-11
Table 5-8 describes SFY 2018 baselines and the MPO’s SFY 2019 targets for rolling stock, which refers to vehicles that carry passengers. As shown below, the MBTA, CATA, and MWRTA are improving performance for a number of rolling stock vehicle classes. Transit agencies can make improvements on this measure by expanding their rolling stock fleets or replacing vehicles within those fleets.
Table 5-8
SFY 2018 Measures and SFY 2019 Targets for Transit Rolling Stock
|
|
SFY 2018 Baseline |
SFY 2019 Targets |
||
Agency |
Asset Type |
Number of Vehicles |
Percent of Vehicles Meeting or Exceeding ULB |
Number of Vehicles |
Percent of Vehicles Meeting or Exceeding ULB |
MBTA |
Buses |
1,022 |
25% |
1,028 |
25% |
MBTA |
Light Rail Vehicles |
205 |
46% |
229 |
41% |
MBTA |
Heavy Rail Vehicles |
432 |
58% |
450 |
56% |
MBTA |
Commuter Rail Locomotives |
94 |
27% |
104 |
24% |
MBTA |
Commuter Rail Coaches |
426 |
0% |
429 |
0% |
MBTA |
Ferry Boats |
4 |
0% |
4 |
0% |
MBTA |
THE RIDE Paratransit Vehiclesa |
763 |
35% |
763 |
9% |
CATA |
Buses |
9 |
11% |
8 |
0% |
CATA |
Cutaway Vehiclesb |
23 |
13% |
23 |
0% |
CATA |
Trolleys (simulated)c |
2 |
100% |
2 |
100% |
MWRTA |
Cutaway Vehiclesb,d |
89 |
6% |
93 |
0% |
MWRTA |
Automobilesd |
9 |
0% |
9 |
0% |
a The MBTA’s THE RIDE paratransit vehicles data and targets reflect automobiles, vans, and minivans.
b The National Transit Database defines a cutaway vehicle as a vehicle in which a bus body is mounted on a van or light-duty truck chassis, which may be reinforced or extended. CATA uses nine of these vehicles to provide fixed-route services, and 14 of these vehicles to provide demand-response service.
c Simulated trolleys, also known as trolley-replica buses, have rubber tires and internal combustion engines, as opposed to steel-wheeled trolley vehicles or rubber-tire trolley buses that draw power from overhead wires.
d MWRTA uses cutaway vehicles to provide fixed-route and demand-response service, and uses autos to provide demand-response service.
CATA = Cape Ann Transportation Authority. MBTA = Massachusetts Bay Transportation Authority. MPO = Metropolitan Planning Organization. MWRTA = MetroWest Regional Transit Authority. SFY = state fiscal year. ULB = Useful Life Benchmark.
Sources: CATA, MBTA, MWRTA, and the Boston Region MPO.
Table 5-9 shows SFY 2018 baselines and the MPO’s SFY 2019 targets for transit equipment vehicles. MPO staff has aggregated targets for nonrevenue vehicle subtypes for each of the three transit agencies. Similar to transit rolling stock, transit agencies can make improvements on these measures by expanding their fleets or replacing vehicles within those fleets.
Table 5-9
SFY 2018 Measures and SFY 2019 Targets for Transit Equipment Vehicles
|
SFY 2018 Baseline |
SFY 2019 Targets |
||
Agency |
Number of Vehicles |
Percent of Vehicles Meeting or Exceeding ULB |
Number of Vehicles |
Percent of Vehicles Meeting or Exceeding ULB |
MBTAa |
1,676 |
20% |
1,676 |
22% |
CATA |
4 |
25% |
3 |
0% |
MWRTA |
12 |
50% |
12 |
50% |
a MBTA equipment includes both commuter rail and transit system nonrevenue service vehicles.
CATA = Cape Ann Transportation Authority. MBTA = Massachusetts Bay Transportation Authority. MPO = Metropolitan Planning Organization. MWRTA = MetroWest Regional Transit Authority. SFY = state fiscal year. ULB = Useful Life Benchmark.
Sources: CATA, MBTA, MWRTA, and the Boston Region MPO.
FTA assesses the condition for passenger stations, parking facilities, and administrative and maintenance facilities using the FTA Transit Economic Requirements Model (TERM) scale, which generates a composite score based on assessments of facility components. Facilities with scores below three are considered to be in marginal or poor condition (though this score is not a measure of facility safety or performance). The goal is to bring the share of facilities that meet this criterion to zero. Infrastructure projects focused on individual systems may improve performance gradually, while more extensive facility improvement projects may have a more dramatic effect on a facility’s TERM scale score.
Table 5-10 shows SFY 2018 measures and the MPO’s SFY 2019 targets for MBTA, CATA, and MWRTA facilities. The MBTA measures and targets only reflect those facilities that have undergone a recent on-site condition assessment. The number of facilities that the MBTA has not yet assessed is shown to provide a more comprehensive count of the MBTA’s assets.
Table 5-10
SFY 2018 Measures and SFY 2019 Targets for Transit Facilities
|
|
SFY 2018 Baseline |
SFY 2019 Targets |
||
Agency |
Facility Type |
Number of Facilities |
Percent of Facilities in Marginal or Poor Condition |
Number of Facilities |
Percent of Facilities in Marginal or Poor Condition |
MBTA |
Passenger–Assesseda |
96 |
13% |
96 |
11% |
MBTA |
Passenger– |
285 |
In progress |
286 |
TBD |
MBTA |
Administrative and Maintenance-Assessed |
156 |
68% |
156 |
63% |
MBTA |
Administrative and Maintenance–Not Assessed |
38 |
In progress |
38 |
TBD |
CATA |
Administrative and Maintenance |
1 |
0% |
1 |
0% |
MWRTA |
Administrative and Maintenance |
1 |
0% |
1 |
0% |
Note: Facilities are classified as being in marginal or poor condition based on FTA’s Transit Economic Requirements Model (TERM) scale. Facilities assigned a rating of less than three are considered to be in marginal or poor condition.
a Passenger facilities include stations and parking facilities.
CATA = Cape Ann Transportation Authority. FTA = Federal Transit Administration. MBTA = Massachusetts Bay Transportation Authority. MPO = Metropolitan Planning Organization. MWRTA = MetroWest Regional Transit Authority. N/A = not applicable. SFY = state fiscal year. TBD = To be determined.
Sources: CATA, MBTA, MWRTA, and the Boston Region MPO.
Table 5-11 describes SFY 2018 baselines and SFY 2019 targets for the condition of rail fixed guideways. The MBTA is the only transit agency in the Boston region with this type of asset. The performance measure that applies to these assets is the percentage of track that is subject to performance, or speed, restrictions. The MBTA samples the share of track segments with speed restrictions throughout the year. These performance restrictions reflect the condition of track, signal, and other supporting systems, which the MBTA can improve through maintenance, upgrades, and replacement and renewal projects. Again, the goal is to bring the share of MBTA track systems subject to performance restrictions to zero.
Table 5-11
SFY 2018 Measures and SFY 2019 Targets for MBTA Transit Fixed Guideway Infrastructure
|
|
SFY 2018 Baseline |
SFY 2019 Targets |
||
Agency |
Track Type |
Directional Route Miles |
Percent of Miles with Speed Restrictions |
Directional Route Miles |
Percent of Miles with Speed Restrictions |
MBTA |
Transit Fixed Guidewaya |
130.23 |
11% |
130.23 |
10% |
MBTA |
Commuter Rail Fixed Guideway |
663.84 |
1% |
663.84 |
1% |
Note: The term “directional route miles” represents the miles managed and maintained by the MBTA with respect to each direction of travel (for example, northbound and southbound), and excludes nonrevenue tracks such as yards, turnarounds, and storage tracks. The baseline and target percentages represent the annual average number of miles meeting this criterion over the 12-month reporting period.
a The MBTA’s Transit Fixed Guideway information reflects light rail and heavy rail fixed guideway networks.
MBTA = Massachusetts Bay Transportation Authority. MPO = Metropolitan Planning Organization. SFY = state fiscal year.
Sources: MBTA and the Boston Region MPO.
The MPO’s capacity management and mobility goal focuses on using existing facility capacity more efficiently and increasing transportation options.The MPO’s objectives in this area encompass a variety of modes and aspects of mobility, including access to and the accessibility of different transportation modes, connectivity between modes and systems, and support for reliable travel and congestion mitigation. Much of the Boston region is densely developed, which creates challenges to addressing these access, reliability, and congestion mitigation needs.
A number of different planning processes come together to address capacity management and mobility performance, issues, and needs. Through its CMP, the MPO conducts extensive analysis of congestion and mobility constraints in the region. Information gathered from recent CMP analyses is available in the Capacity Management and Mobility chapter of the Destination 2040 Needs Assessment. The MPO also produces periodic CMAQ performance plans that describe other congestion-oriented measures and targets and projects that may support decreased congestion and increased non-single-occupant-vehicle (non-SOV) travel. The MPO combines this work with ongoing system level analyses that support its long-range planning, which are also documented in the Destination 2040 Needs Assessment.
MassDOT conducts its own analyses of mobility performance and needs, which it documents in modal plans such as the Massachusetts Freight Plan, Bicycle Transportation Plan, Pedestrian Transportation Plan, MassDOT’s own CMAQ Performance Plan, and the MassDOT Tracker (massdottracker.com). MassDOT also recently conducted a study titled Congestion in the Commonwealth: Report to the Governor 2019, which highlighted reliability and access challenges created by worsening congestion in Massachusetts, discussed when and where congestion is occurring throught the Commonwealth, and reviewed possible solutions. More information is included in the LRTP Needs Assessment (Chapter 6: Capacity Management and Mobility). Meanwhile, the MBTA tracks and analyzes mobility metrics (including on the MBTA Back on Track Performance Dashboard (mbtabackontrack.com) and uses these to support planning processes, such asFocus40, its current long-term investment plan. The exchange and integration of these plans help agencies in the Boston region to coordinate to improve mobility across all modes of transportation.
The MPO examines a number of different federally required performance measures to understand congestion and mobility issues.
Table 5-3 highlights several federally required performance measures pertaining to the NHS system, including infrastructure condition and travel reliability. FHWA requires states and MPOs to monitor and set targets for two performance measures that pertain to all travelers on NHS roadways:
These measures capture (1) whether travel times on an NHS segment are consistent (reliability); and (2) the extent to which NHS users’ travel may be affected by those conditions (percent of person miles). Several component metrics make up this measure:
States or MPOs identify the person-miles of travel for each NHS segment and then divide the total person-miles on the relevant NHS network that are reliable by the total person-miles on the relevant NHS network. To support this analysis, FHWA provides travel-time and traffic-volume data as part of the National Performance Management Research Data Set (NPMRDS), in which travel time data is reported by traffic messaging channel (TMC) segments.
States are required to set two-year and four-year targets for these measures and were required to establish targets for the first federal performance period by May 20, 2018. When establishing baseline values and setting targets for Massachusetts’ interstate and non-interstate NHS networks, MassDOT only examined NPMRDS travel-time data from CY 2017 because the NPMRDS from prior years was assembled using different data collection methods and has some different features. Because historic data was limited, MassDOT considered FHWA guidance and recommendations for establishing initial targets with this limited historic data, and set its initial targets equal to CY 2017 baseline values.5-13
Table 5-12 shows MassDOT’s CY 2017 baselines and two-year and four-year targets for these measures. The Boston Region MPO, like all MPOs, was required to establish four-year targets for these measures by either supporting state targets or setting its own quantitative targets for the Boston region. In 2018, the MPO board voted to support the state’s four-year targets. Table 5-12 also shows CY 2017 baselines for the Boston region’s interstate and non-interstate NHS networks as a basis for comparison. As the table shows, the Boston region’s share of reliable person-miles traveled on its interstate and non-interstate NHS networks is lower than those values for Massachusetts as a whole.
Table 5-12
Travel Time Reliability Performance Baselines and Performance Targets
Network |
Measure |
Cumulative Traffic |
2017 Measure |
Two-Year Target |
Four-Year Target |
Massachusetts—Interstate Highway System |
Percent of person-miles on the Interstate Highway System that are reliable |
1,150 |
68.0% |
68.0% |
68.0% |
Massachusetts—Non-interstate NHS System |
Percent of person-miles on the Non-interstate NHS that are reliable |
5,257 |
80.0% |
80.0% |
80.0% |
Boston region—Interstate Highway System |
Percent of person-miles on the Interstate Highway System that are reliable |
354 |
47.2% |
n/a |
See Massachusetts target |
Boston region—Non-interstate NHS System |
Percent of person-miles on the Non-interstate NHS that are reliable |
1,799 |
69.0% |
n/a |
See Massachusetts target |
a The two-year target reflects conditions as of the end of CY 2019, and the four-year target reflects conditions as of the end of CY 2021.
CY = calendar year. n/a = not applicable. NHS = National Highway System.
Sources: National Performance Management Research Data Set, Cambridge Systematics, MassDOT, and the Boston Region MPO.
FHWA requires states and MPOs to track truck travel reliability on the Interstate System to better understand the performance of the nation’s freight system. The applicable measure in this case is the Truck Travel Time Reliability (TTTR) Index. Like the LOTTR, this measure compares longer (95th percentile) truck travel times to average (50th percentile) truck travel times. The greater the difference between these two travel times on an interstate segment the less reliable truck travel on that segment is considered to be. For each interstate segment, states and MPOs calculate TTTR Index values for different day and time periods and weight the segment length by the maximum applicable TTTR Index value.5-14 They then sum these weighted segment lengths for all Interstate segments and divide that total value by the length of the full Interstate network for the applicable geographic area. Like segment-specific TTTR Index values, the greater this aggregate value is, the more unreliable the network is with respect to truck travel.
As with the all-vehicle NHS reliability measures, MassDOT was required to set targets for truck travel time reliability by May 20, 2018. MassDOT calculated baseline TTTR Index values and established performance targets using CY 2017 truck travel time data included in the NPMRDS. As with the all-vehicle travel time reliability targets, MassDOT set its two-year and four-year targets equal to the CY 2017 baseline. Table 5-13 displays these values. The MPO board voted to support MassDOT’s four-year TTTR Index target in October 2018, prior to its deadline of November 16, 2018. Table 5-13 also includes the Boston region’s CY 2017 baseline index value. As the table shows, the Boston region’s TTTR Index baseline value is higher than the value for Massachusetts, indicating that truck travel on the region’s interstate network is generally less reliable than on Massachusetts’s interstates as a whole.
Table 5-13
Truck Travel Time Reliability Baselines and Performance Targets
Network |
Measure |
Cumulative Traffic |
2017 Measure |
Two-Year Target |
Four-Year Target |
Massachusetts—Interstate Highway System |
Truck Travel Time Reliability Index |
1,150 |
1.85 |
1.85 |
1.85 |
Boston Region—Interstate Highway System |
Truck Travel Time Reliability Index |
354 |
2.55 |
n/a |
See Massachusetts target |
a The two-year target reflects conditions as of the end of CY 2019, and the four-year target reflects conditions as of the end of CY 2021.
CY = calendar year. n/a = not applicable.
Sources: National Performance Management Research Data Set, Cambridge Systematics, MassDOT, and the Boston Region MPO.
MassDOT and the Boston Region MPO also examine mobility using measures they must monitor to meet CMAQ requirements. These measures are designed to help FHWA, states, and MPOs better understand the impacts of CMAQ investments, which are intended to contribute to air quality improvements and provide congestion relief. CMAQ traffic-congestion-related performance measures apply to UZAs that contain geographic areas designated as not attaining US Environmental Protection Agency (EPA) standards for criteria air pollutants and precursors from mobile sources (also known as nonattainment areas).5-15 The measures also apply to geographic areas that have a history of being in nonattainment and are thus required to maintain air quality monitoring and standard conformity processes (also known as maintenance areas).
States must be involved in setting targets for CMAQ traffic performance measures if (1) they have mainline highways on the NHS that cross part of a UZA with a population of more than one million; and (2) that UZA contains part of a nonattainment or maintenance area for relevant criteria pollutants. Similarly, MPOs must participate in target setting for the traffic congestion measures if (1) the region contains mainline highways on the NHS that cross part of a UZA with a population of more than one million; and (2) the part of the MPO area that overlaps the UZA contains part of a nonattainment or maintenance area for relevant criteria pollutants. Massachusetts and the Boston Region MPO each meet these respective criteria and, therefore, must be involved in monitoring and setting targets for traffic congestion performance measures for the Boston UZA.
The first of these CMAQ traffic congestion measures is annual hours of peak hour excessive delay (PHED) per capita, which estimates the excessive delay experienced by a UZA’s population from travel on the NHS during peak periods. States and MPOs calculate this measure using several component metrics:
The PHED per capita measure is calculated at the Boston UZA level by multiplying the hours of excessive delay during peak periods by the number of travelers during peak periods, and then dividing that total by the UZA population.
To understand baseline performance and set targets for this measure, MassDOT and NH DOT worked with analysts at Cambridge Systematics and, using 2017 NPMRDS data, calculated annual hours of PHED per capita for travel on the NHS in their respective portions of the Boston UZA.5-18 In 2018, the agencies in the Boston UZA that are subject to CMAQ performance monitoring requirements—MassDOT, the New Hampshire Department of Transportation (NH DOT), the Boston Region MPO, and the Northern Middlesex Council of Governments (NMCOG)—established two-year and four-year targets that maintain this 2017 baseline value for the annual hours of PHED per capita measure, as shown in Table 5-14. The Boston Region MPO included these targets along with targets for the non-SOV travel measure in its first CMAQ Performance Plan, which it submitted to MassDOT in September 2018.
Table 5-14
Boston UZA Baseline and Performance Targets for Annual Hours of Peak Hour Excessive Delay Per Capita
Geographic Area |
Massachusetts and |
Boston UZA Population (MA and NH only)a |
2017 Measure Value (Baseline) |
Two-Year Target |
Four-Year Target |
Boston Urbanized Area |
80,053,183 |
4,371,476 |
18.30 |
18.30 |
18.30 |
a Cambridge Systematics aggregated 2012–16 American Community Survey population estimates from the US Census Bureau at the block group level to estimate the population for the portion of the UZA in Massachusetts and New Hampshire, and then inflated this estimate for 2017 by applying information on expected population growth in the Boston Metropolitan Statistical area between 2016 and 2017.
b The two-year target reflects conditions as of the end of CY 2019, and the four-year target reflects conditions as of the end of CY 2021.
CY =calendar year. MA = Massachusetts. NH = New Hampshire. PHED = peak hours of excessive delay. UZA = urbanized area.
Sources: National Performance Management Research Data Set, US Census Bureau, Federal Highway Administration, MassDOT, the New Hampshire Department of Transportation, and Cambridge Systematics.
States and MPOs that meet applicability criteria for CMAQ performance requirements must also monitor and set targets for the share of non-SOV travel in applicable UZAs. The percent of non-SOV travel performance measure describes the extent to which people are using alternatives to single-occupancy vehicles to travel and, thus, helping to reduce traffic congestion and air pollution from mobile sources.
Collectively, MassDOT, NH DOT, the Boston Region MPO, and NMCOG used American Community Survey (ACS) data from the US Census Bureau to estimate the percent of workers age 16 and older who commuted to work using an option other than driving alone.5-19 ,5-20 Examples of non-SOV commuting options include, but are not limited to carpooling, taking transit, bicycling, or walking. These ACS five-year period estimates are rolling annual averages. Figure 5-9 shows how the percentage of workers using non-SOV commuting options in the Boston UZA has increased between 2012 (2008–12 ACS estimate) and 2016 (2012–16 ACS estimate). MassDOT calculated a linear trend line using these values for the Boston UZA and used that trend line to project expected values as of the end of CY 2019 (the expected 2015–19 ACS estimate) and CY 2021 (the expected 2017–21 ACS estimate). The agencies established these projected values as the Boston UZA targets for the percent of non-SOV travel. As Figure 5-9 shows, the share of non-SOV travel in the Boston UZA has been increasing steadily over time.
Figure 5-9
Historic Values and Performance Targets for the Percent of Non-SOV Travel in the Boston UZA
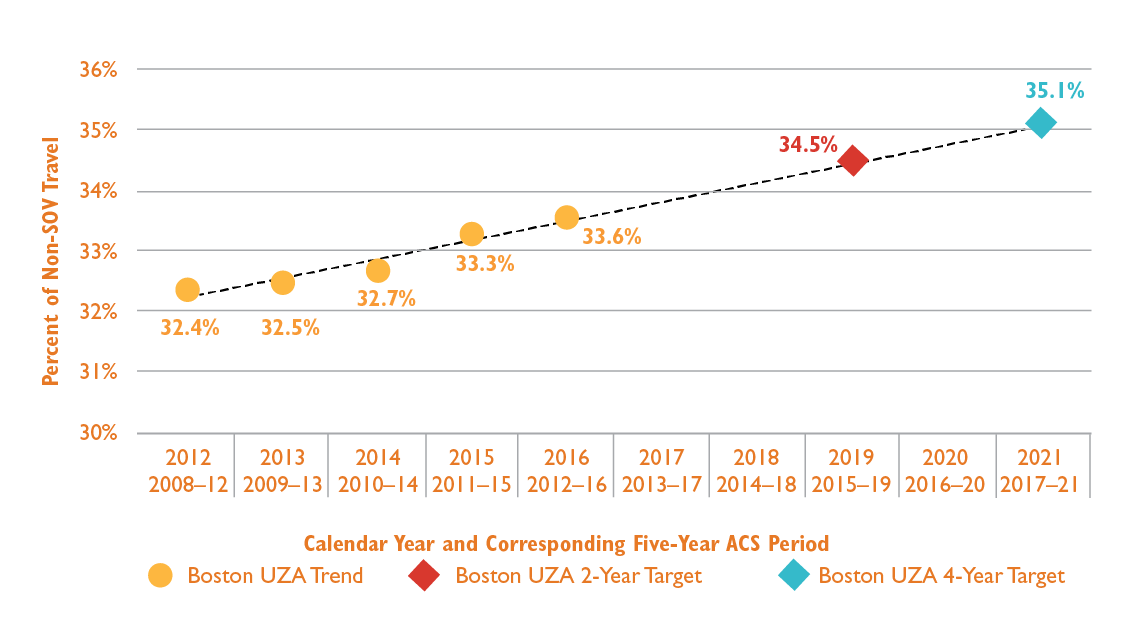
Note: The two-year target reflects conditions as of the end of CY 2019, and the four-year target reflects conditions as of the end of CY 2021.
ACS = US American Community Survey. CY = calendar year. SOV = single-occupant vehicle. UZA = urbanized area.
Sources: US Census Bureau, 2012–16 American Community Survey Five-Year Estimates; the Massachusetts Department of Transportation; and the New Hampshire Department of Transportation.
Table 5-15 lists the recent baseline and performance targets for this measure. It also includes a baseline value for non-SOV travel that is specific to the Boston region, which is a larger percentage than for the Boston UZA.
Table 5-15
Boston UZA Baseline and Performance Targets for Percent of Non-SOV Travel
Geographic Area |
2012–16 Measure Value (Baseline) |
Two-Year Target |
Four-Year Target |
Boston UZA |
33.6% |
34.5% |
35.1% |
Boston region (97 municipalities) |
38.4% |
n/a |
n/a |
a The two-year target reflects conditions as of the end of CY 2019, and the four-year target reflects conditions as of the end of CY 2021.
CY = calendar year. n/a = not applicable. SOV = single-occupancy vehicle. UZA = urbanized area.
Sources: MassDOT, NH DOT, the US Census American Community Survey, and the Boston Region MPO.
The MPO aims to support clean air and sustainable communities in the Boston region by creating an environmentally friendly transportation system, which it pursues by investing in projects that reduce greenhouse gases (GHGs) and other transportation-related pollutants, and otherwise minimize negative environmental impacts.
The MPO agrees that GHG emissions contribute to climate change. If climate change trends continue as projected, the conditions in the Boston region will include a rise in sea level coupled with storm-induced flooding, and warmer temperatures that would affect the region’s infrastructure, economy, human health, and natural resources. Massachusetts is responding to this challenge by taking action to reduce the GHGs produced in the state, including those generated by the transportation sector. To that end, Massachusetts passed its Global Warming Solutions Act (GWSA), which requires reductions of GHGs by 2020, and further reductions by 2050, relative to 1990 baseline conditions. To meet GWSA requirements, the MPO works with MassDOT and other stakeholders to anticipate the GHG impacts of projects included in the TIP, specifically by examining additions or reductions in carbon dioxide (CO2). More details on the MPO’s GHG tracking and evaluation processes are included in Chapter 7.
Transportation projects may also help reduce other air quality pollutants and precursors and can support reductions in CO2, volatile organic compounds (VOCs), nitrogen oxides (NOx) and carbon monoxide (CO) by improving traffic flow and bicycle and pedestrian travel. The Boston Region MPO contains a maintenance area for CO in Waltham, and also is required to track VOCs and NOx to meet EPA requirements. (More detailed information about the MPO’s air quality status and related requirements is available in Chapter 7.) The MPO tracks the air quality benefits of transportation projects to identify projects that may be eligible for CMAQ funds. As previously mentioned, FHWA also requires the Boston Region MPO to produce a CMAQ Performance Plan, which includes targets for the amount of emissions the MPO expects will be reduced because of CMAQ-funded projects in the region. As part of its CMAQ Performance Plans, the MPO must note how it expects its CMAQ-funded projects to support improvements in these performance measures, which reinforces the connection between planning, investments, and expected performance outcomes.
The federally required CMAQ emissions reduction measure, identified in Table 5-3, is the total emissions reduction for applicable pollutants and precursors for CMAQ-funded projects in designated nonattainment and maintenance areas. FHWA requires states and MPOs subject to these CMAQ performance management requirements to establish a baseline for this measure by identifying emissions reductions associated with any CMAQ-funded projects programmed in air quality nonattainment or maintenance areas between federal fiscal year (FFY) 2014 and FFY 2017. These states and MPOs were also required to set two-year and four-year targets for the emissions reductions expected from CMAQ-funded projects programmed in nonattainment or maintenance areas.
In the Boston Region MPO’s case, this CMAQ emissions performance measure would capture the anticipated carbon monoxide emissions reductions from any CMAQ-funded projects that the MPO has programmed specifically in the carbon monoxide maintenance area in Waltham.5-21 Table 5-16 shows the Boston Region MPO’s baseline and target values for this measure. Neither the MPO nor MassDOT programmed any CMAQ-funded projects in Waltham during FFYs 2014–17 and at the time of target setting, the MPO’s TIP did not reflect any CMAQ-funded projects programmed in Waltham in FFYs 2018–21. As a result, both the MPO’s baseline and target emission reduction values are equal to zero. The Boston Region MPO included these targets and targets for the non-SOV travel measure in its first CMAQ Performance Plan, which it submitted to MassDOT in September 2018. Looking ahead, the FFYs 2020–24 TIP and the recommended Destination 2040 plando not include any CMAQ-funded projects in Waltham.
Table 5-16
Boston Region MPO CMAQ Emissions Reduction Baseline and Performance Targets
Performance Measure |
FFYs 2014–17 Measure Value (Baseline) |
Two-Year Target |
Four-Year Target |
Daily kilograms of CO emissions reduction from CMAQ projects in Boston region nonattainment or maintenance areas |
0 |
0 |
0 |
CMAQ = Congestion Mitigation and Air Quality. CO = carbon monoxide. FFY = federal fiscal year. MPO = Metropolitan Planning Organization.
Source: Boston Region MPO.
The MPO seeks to ensure that the Boston region’s transportation network provides a strong foundation for economic vitality. Transportation investments can support economic vitality in a variety of ways, such as by supporting freight movement, improving connections to key freight and economic development sites, and supporting compact development. The MPO’s approach to addressing freight needs is guided in large part by the Massachusetts Freight Plan, which sets a vision and goals for the freight system in the Commonwealth. MassDOT’s performance goals for the freight system include the following5-22 :
The Massachusetts Freight Plan also identifies key freight facilities and needs, strategies to improve freight movement, and priority projects.
The Metropolitan Area Planning Council’s (MAPC) regional land use plan also identifies economic vitality goals and strategies that influence MPO investments. For example, a strategy in MAPC’s current regional land use plan,MetroFuture, is to coordinate transportation investments to guide economic growth in the region.5-23 MAPC worked with its state-level partners at the Executive Office of Housing and Economic Development and the Executive Office of Energy and Environmental Affairs, as well as municipalities, to identify locations throughout the region appropriate for building housing stock and siting employers. These agencies identified the infrastructure improvements required to support the outcomes planned for these local-, regional-, and state-level priority development areas, which help MAPC, the MPO, and state agencies to respond with their investments and technical assistance.
States and MPOs track the federally required truck travel time reliability measure for the Interstate Highway System, listed in Table 5-3, by using the Truck Travel Time Reliability Index. This measure has the most direct implications for the MPO’s Capacity Management and Mobility goal; however, this measure is also relevant to the Boston region’s economic vitality. More information about this measure is available in the Capacity Management and Mobility Performance section, particularly in Table 5-13.
As mentioned at the beginning of this chapter, the MPO’s goal with respect to TE is to ensure that all people receive comparable benefits from, and are not disproportionately burdened by MPO investments, regardless of race, color, national origin, age, income, ability, or sex. The MPO aims to ensure that all residents fairly share in the benefits and burdens of its transportation planning investments, have the opportunities to participate in the transportation planning process, and have a voice in the selection of transportation investments in their communities.
To this end, the MPO systematically integrates the transportation needs and interests of TE populations into its planning process and strives to address their concerns through the selection of transportation projects. TE populations include people who identify as minority; have limited English proficiency (LEP); are 75 years old or older or are 17 years old or younger; have a disability; or who are members of low-income households or transit-dependent households.5-24 These populations include those protected by federal laws and regulations, such as minorities and people with disabilities, as well as those not protected by federal laws or regulations but still of interest to the MPO from an equity standpoint because they have specific transportation needs (such as members of transit-dependent households).5-25
FHWA and FTA do not require states, MPOs, or transit agencies to monitor specific performance measures related to TE. However, as part of compliance with federal nondiscrimination and EJ mandates, these agencies must monitor how their investments, which are funded with federal transportation dollars, are distributed relative to TE populations. This monitoring helps ensure that these populations share in the benefits from MPO investments and are not unduly burdened by any potential adverse effects. The Boston Region MPO carries out what is required as well as additional analyses to monitor the distribution of MPO investments, including a Disparate Impact/Disproportionate Burden (DI/DB) analyses of MPO funded Regional Target projects and of MassDOT and MPO-funded regionally significant projects. (These analyses only include projects that change the capacity of the transportation network.)
When creating an LRTP, MPOs must conduct analyses to determine whether implementation in the aggregate of investments in the MPO region may result in potential future disparate impacts5-26 and disproportionate burdens on minority and low-income populations, respectively.5-27 The analyses determine whether these populations may receive disproportionately fewer benefits or more burdens as a result of programming these projects. The MPO has developed a DI/DB Policy (see Appendix C) that allows the MPO to make that assessment. The MPO’s analyses of the recommended Destination 2040 plan, which uses this policy, is included in Chapter 6. The results of these analyses help the MPO to consider opportunities to minimize, avoid, or mitigate potential future disparate impacts on minority populations and disproportionate burdens on low-income populations that may result from MPO-funded Destination 2040 investments.
As discussed in Chapter 4, the recommended investment alternative for Destination 2040 includes funding for both major infrastructure projects and MPO investment programs. As this LRTP is implemented and projects are included in the MPO's TIPs, the MPO will provide descriptions in TIP documents on how it anticipates these projects will support progress towards the MPO’s performance targets, both for federally required performance measures and other measures, as applicable. In advance of more detailed discussions in TIP documents, this section describes how the MPO’s recommended set of projects and programs can support improvements with respect to federally required performance measures.
Chapter 4 discusses the process the MPO followed to set aside funding for investment programs and to select a set of major infrastructure projects to receive MPO discretionary (Regional Target) dollars between FFY 2020 and FFY 2040. The MPO recommends allocating discretionary funding to 11 projects that add capacity to the transportation system and/or cost $20 million dollars or more. These include the nine projects included in Table 4-1 in Chapter 4, along with two projects that have received MPO discretionary funding from the MPO’s 2015 plan, Charting Progress to 2040—the Green Line Extension in Cambridge, Somerville and Medford, and the Highland Avenue/Needham Street project in Needham and Newton. The Green Line Extension project is under construction and the Highland Avenue/Needham Street project is scheduled to be advertised during FFY 2019; however, these projects will still receive funding from the MPO and the Commonwealth in the early years of the recommended Destination 2040 plan.
As mentioned, Chapter 4 includes detailed descriptions of the nine MPO-funded projects listed in Table 4-1, which highlight the relationships between each project’s features and the MPO’s safety, system preservation and modernization, capacity management and mobility, TE, and economic vitality goal areas. Related information is also available in Appendix B: Project Evaluation Methodology. This section summarizes how these nine MPO-programmed projects and the two MPO-supported projects under construction may help improve performance with respect to several federally required performance areas. MPO staff have analyzed how projects may support improved performance using available project data at the time of LRTP development.
This section also provides details on how MassDOT-funded projects located in the Boston region may also support improved performance in these areas. Chapter 4 includes descriptions of three of these MassDOT-funded projects: (1) the Cypher Street Extension project in Boston; (2) the Allston Multimodal Project in Boston; and (3) the reconstruction of Interstate 90 and Interstate 495 in Hopkinton and Westborough. This group of projects also includes the Burgin Parkway Connection project in Quincy, which is a project under construction that is being fully funded by MassDOT. Finally, this section makes references, when applicable, to two other projects that are partially in the Boston Region MPO area but are being funded in other MPOs' LRTPs: interchange improvements at Interstate 495 and Route 9 in Southborough and Westborough; and the first phase of the South Coast Rail Extension between Boston and Fall River, New Bedford, and Taunton. Both of these projects are described in Chapter 4.
The MPO considers the safety benefits of projects in both its LRTP and TIP selection processes by analyzing data on crash severity and frequency. These evaluation processes use Equivalent Property Damage Only (EPDO) values associated with crashes within the proposed project area. The EPDO index is used to assess the severity of crashes by assigning higher weighted values to crashes involving fatalities or injuries than those that only involve property damage.
The MPO also examines whether projects would improve safety conditions at MassDOT-identified Highway Safety Improvement Program (HSIP) crash cluster locations. MassDOT identifies crash clusters using a procedure for processing, standardizing, matching, and aggregating crash locations and data. MassDOT’s HSIP clusters are those that rank in the top five percent of crash clusters within each regional planning agency area based on their EPDO value.5-28 MassDOT creates a set of HSIP clusters that include all crashes involving motor vehicles, as well as sets of clusters that reflect motor vehicle crashes that involve bicyclists or pedestrians. Projects in locations that overlap HSIP clusters are eligible for funding through MassDOT’s HSIP program.
Table 5-17 shows the number of HSIP clusters, by type, that the MPO expects will be addressed by its recommended set of major infrastructure roadway projects. For this analysis, MPO staff used all mode HSIP clusters based on crash data from 2014–16 and HSIP bicycle and pedestrian clusters based on data from 2007–16. Six of the MPO’s major infrastructure roadway projects overlap one or more all-mode HSIP clusters, while three overlap one or more HSIP bicycle clusters, and two overlap one or more pedestrian clusters.
The MPO expects that the combination of safety countermeasures and improvements focused in priority locations will help the MPO and the Commonwealth progress towards reducing fatalities and serious injuries on the roadway network.
Table 5-17
HSIP Cluster Locations within MPO Major Infrastructure Roadway Project Areas
Cluster Type |
Number of Clusters |
All-mode HSIP cluster locationsa |
17 |
HSIP pedestrian cluster locationsb |
5 |
HSIP bicycle cluster locationsb |
2 |
Note: The group of projects reflected in this table does not include the Green Line Extension.
a All-mode HSIP clusters are based on crash data from 2014 to 2016.
b HSIP bicycle clusters and HSIP pedestrian clusters are based on data from 2007 to 2016.
HSIP = Highway Safety Improvement Program. MPO = Metropolitan Planning Organization.
Sources: Massachusetts Crash Data System, the Massachusetts Department of Transportation, and the Boston Region MPO.
In addition, MassDOT’s Allston Multimodal Project in Boston overlaps an all-mode HSIP cluster location, while MassDOT’s Burgin Parkway Connection project in Quincy overlaps one HSIP pedestrian cluster location.
The MPO examines how projects may improve the condition of the Boston region’s bridges and roadway pavement when developing the TIP and LRTP. The MPO uses both proposed project descriptions and data provided by MassDOT’s Bridge Section to understand the current condition of bridges proposed for improvement. Meanwhile, the MPO uses IRI information and data provided by project proponents to identify substandard pavement and awards points to projects that will improve these pavements.
Table 5-18 displays metrics that describe how the MPO-funded major infrastructure projects in Destination 2040 are expected to improve infrastructure on the region’s roadways. Table 5-18 also includes measures specific to NHS pavement and bridges, which pertain most directly to federally required performance measures. The MPO expects that these investments will help make progress towards statewide NHS bridge and pavement condition targets and will also help improve the overall condition of the region’s roadways and bridges.
Table 5-18
MPO Major Infrastructure Project Metrics Related to Roadway System Preservation and Modernization Performance
Metric |
Value |
Bridge structures improved |
11 structures |
NHS bridge structures improved |
7 structures |
New bridge structures to be constructed |
2 structures |
Lane-miles of substandard pavement improveda |
40 lane-miles |
Lane-miles of substandard NHS pavement improveda |
24 lane-miles |
Note: The group of projects reflected in this table does not include the Green Line Extension.
a Substandard pavement designations are based on data provided by MassDOT and project proponents and on MPO assessments conducted for TIP evaluations. The estimated lane-miles of substandard NHS pavement improved is based on the pavement condition assessment for the project and the MPO’s assessment of the portion of the project on the NHS.
MassDOT = Massachusetts Department of Transportation. MPO = Metropolitan Planning Organization. NHS = National Highway System. TIP = Transportation Improvement Program.
Source: MassDOT and Boston Region MPO.
MassDOT’s regionally significant roadway projects also contribute to infrastructure condition improvements in the Boston region. Its set of interchange improvement, pedestrian connection, and roadway reconstruction projects will improve bridge condition by rehabilitating, replacing, or constructing new bridge structures, and will improve pavement as part of reconstruction activities. Three of these MassDOT projects are located on the NHS and will improve NHS bridges and pavement. In addition to these roadway projects, the MPO and the Commonwealth’s investments in the Green Line Extension will add new or upgrade vehicles, facilities, and track to the region’s transit network, which will likely have a desirable effect on TAM performance measures. The Commonwealth’s investments in transit assets, including the first phase of South Coast Rail and the West Station component of the Allston/Interstate 90 project, may also support improved performance on TAM measures.
The MPO seeks to make investments that help manage capacity on the transportation network and improve mobility for travelers in a variety of ways. These investments include improving roadway design, adding capacity at bottleneck locations, or implementing traffic and operational improvements along congested or unreliable corridors. MPO staff examined whether MPO major infrastructure projects overlap segments on the NHS that are considered unreliable, based on 2017 NPMRDS data and federal travel time reliability performance thresholds. Staff found that seven MPO-selected projects that address mobility needs overlap NHS segments, and of these, four overlap NHS segments that are considered unreliable based on NPMRDS data and federally designated reliability performance thresholds. Similarly, three of MassDOT’s six projects that are wholly or partially in the Boston region overlap NHS segments that are considered unreliable and will address mobility needs at those locations. MPO staff hopes that these projects will reduce unreliable travel and excessive delays that people experience when traveling on the region’s transportation system, including on its NHS roadways.
The MPO and the Commonwealth consider how roadway improvement projects may enhance freight movement when making programming decisions. MassDOT’s Allston Multimodal and Cypher Street projects in Boston are located on Critical Urban Freight Corridors, while its interchange improvement projects at Interstate 95 and Interstate 495 in Hopkinton and Westborough and at Interstate 495 and Route 9 are also located on the National Highway Freight Network. Also, MassDOT’s Interstate 95/Interstate 495 interchange improvement project specifically addresses a freight bottleneck identified in the Massachusetts Freight Plan.
In order to manage capacity and improve mobility, the MPO also considers how projects may encourage people in the region to use non-SOV modes. When prioritizing projects funded with Regional Target dollars, the MPO uses evaluation criteria to assess how well each project expands transportation options (and mode choice) by enhancing bicycle and pedestrian accommodations and connections to transit. MassDOT and MBTA projects, as well as MPO support for these projects, can also support traveler shifts to non-SOV modes.
Of the 11 major infrastructure projects the MPO plans to fund, nine are expected to include improved or new bicycle and pedestrian accommodations. Meanwhile, at least four of MassDOT’s projects that fall wholly or partially in the Boston region are expected to include new or improved bicycle and/or pedestrian accommodations. These improvements range from bicycle lanes and shared-use paths incorporated into project corridors to pedestrian connections over rail lines or roadways. Chapter 4 includes descriptions of bicycle and pedestrian facilities planned for many of these projects. Collectively, these investments are expected to encourage people to travel by nonmotorized modes, and perhaps in doing so, reduce the share of trips they may make using SOVs.
Other MPO and Commonwealth investments may support an increase in non-SOV mode share by enhancing or supporting the region’s transit systems. Improvements included in roadway projects funded by the Commonwealth and/or MPO may support improved bus mobility or system connectivity, and may make transit a more attractive option compared to SOVs. For example, the Rutherford Avenue reconstruction project in Boston features exclusive bus lanes for expedited travel. Also, the MPO and transit agencies’ investments in enhancing and expanding the region’s rail networks may encourage people to increase their share of non-SOV travel. For instance, the Green Line Extension project, which supports the expansion of light-rail service to more areas within the Boston region, which may make transit a more attractive option for many trips within the region’s Inner Core. Similarly, the new West Station commuter rail stop (included in the Allston Multimodal Project) and the extension of commuter rail service through the South Coast Rail project will encourage people to use transit instead of personal vehicles when traveling to, from, or within the Boston region.
Various chapters in Destination 2040 discuss the estimated impacts of MPO major infrastructure projects and other regionally significant projects in the Boston region. Chapter 4 compares FFY 2016 baseline estimates for various metrics to (1) FFY 2040 “no-build” conditions, which account for projects that were constructed between FFYs 2016 and 2018, are currently under construction, have been advertised, or have been programmed in the FFY 2019 TIP; and (2) FFY 2040 “build” conditions, under which MPO and Commonwealth projects recommended for programming beyond FFY 2019 are built. Analyzed metrics include, but are not limited to, population; household and employment levels; trip activity by mode; mode share; VMT; numbers of roadway and transit trips; and expected VOC, NOx, and CO emissions. Chapter 6 includes the results of the MPO’s DI/DB analyses and Chapter 7 includes the estimated CO2 emissions reductions associated with MPO- and Commonwealth-funded projects.
The five MPO investment programs detailed in Chapter 4 may also help the MPO make progress towards federally required performance measures. Table 5-19 describes how TIP projects funded through these various programs may address relevant measures.
Table 5-19
Recommended Destination 2040 Investment Programs and Potential Performance Impacts
| Investment Program |
Potential Impacts related to Federally Required Performance Measures |
|---|---|
Intersection Improvements |
Roadway Safety: Intersection improvements may help reduce fatalities and injuries by updating roadway geometry, shortening crossing distances, and enhancing signals, lighting, signage, and bicycle and pedestrian accommodations. NHS Pavement Condition: Intersection projects on the NHS may improve pavement condition. NHS Travel Reliability and Congestion: Signal and geometry improvements at intersections on the NHS may support reliable travel and reduce congestion. Non-SOV Travel: Improved bicycle or pedestrian accommodations at intersections may encourage shifts in nonmotorized travel. Intersection improvements may also support the mobility of transit vehicles, which may make transit a more attractive travel option. Air Quality: Reduced congestion resulting from roadway and geometric improvements at intersections may help reduce emissions. |
Complete Streets |
Roadway Safety: Complete Streets projects that improve roadway geometry, upgrade signals and crossways, and/or add or enhance sidewalks and bicycle pedestrian facilities may help reduce fatalities and serious injuries. NHS Bridge and Pavement Condition: Complete Streets projects located on NHS roadways or bridges can improve these pavements or structures. NHS Travel Reliability and Congestion: Complete Streets projects that improve signals and geometry on NHS roadways may support reliable travel and reduce congestion. Non-SOV Travel: Bicycle, pedestrian, or transit-supporting improvements (such as dedicated bus lanes) that are included in Complete Streets projects may support shifts to non-SOV travel, especially if they support network connectivity and access to activity centers. Air Quality: Reduced congestion resulting from roadway and geometric improvements included in Complete Streets projects may help reduce emissions. Also, bicycle and pedestrian facility improvements may encourage people to shift to non-SOV modes, which can help reduce emissions. |
Bicycle Network and Pedestrian Connections |
Roadway Safety: New or improved bicycle and pedestrian facilities may help reduce fatalities and serious injuries, particularly for nonmotorized users. Non-SOV Travel: New or improved bicycle and pedestrian facilities may encourage shifts to non-SOV travel, especially if they support network connectivity and access to activity centers. Air Quality: Bicycle and pedestrian facility improvements may encourage nonmotorized travel, which can help reduce emissions. |
Community Connections |
Non-SOV Travel: Shuttle, parking improvement, and bicycle and pedestrian improvement-related projects funded through this program may encourage shifts to non-SOV travel, especially if these projects support access to activity centers. Air Quality: Projects funded through this program may encourage shifts to non-SOV modes, which can help reduce emissions. |
Transit Modernization |
TAM: Transit fleet and facility upgrades may improve asset performance on the TAM measures. Transit Safety: Improvements to transit facilities and vehicles may make conditions safer for transit customers, employees, and the general public. Non-SOV Travel: Modernizing transit facilities and vehicles may improve service and make transit more customer friendly, which in turn may encourage people to shift to non-SOV travel. Air Quality: Modern transit assets may help reduce emissions by encouraging non-SOV travel or by changing the amount or type of energy these assets use. |
Note: The MPO’s Major Infrastructure investment program, which includes the MPO’s regionally significant projects, is not included in this table.
MPO = Metropolitan Planning Organization. NHS = National Highway System. SOV = single-occupancy vehicle. TAM = Transit Asset Management.
Source: Boston Region MPO.
Performance improvements supported by these investment programs will be complemented by MassDOT and transit agency investments included in MassDOT’s CIP. These CIP programs are referenced in Chapter 3. The following list provides some examples of how these programs relate to federally required performance areas.
The three key phases in the MPO’s PBPP process, planning, investing, and monitoring and evaluating, were discussed earlier in this chapter. Destination 2040 relates to all three of these phases in this framework. First, it houses the MPO’s goals, objectives, measures, and current performance targets, which are all key components of the planning phase. Second, it creates a framework for the MPO to use to invest in the Boston region’s transportation system over the next 20 years—a framework designed to focus spending on the MPO’s goal areas. Finally, it contains an assessment of transportation system performance, which the MPO can use when conducting future monitoring and evaluation of progress.
In the coming years, the MPO will expand its PBPP practice by engaging in new activities in each of the three phases and building on the foundation set by Destination 2040. Future planning activities include the following:
To support its investment activities, the MPO will consider updates to the TIP project selection criteria to support its performance-oriented decision making. The MPO may also conduct scenario planning to understand how sets of projects may affect various performance areas, which may help it make tradeoffs when investing its discretionary funding.
In terms of monitoring and evaluation, the MPO will use available data to measure its progress and report to federal agencies, MassDOT, transit agencies, and the public. As mentioned previously, the MPO will update this system performance report in future LRTPs to include information about progress the MPO has made towards its performance targets, and to include updated targets, as appropriate. The MPO will also report on performance in other federally required plans and reports, including its CMAQ performance plan. In addition, the MPO will provide information on its PBPP web page (http://ctps.org/performance). This web page provides ongoing updates about the MPO’s target-setting activities, including trend analysis. It also provides a link to the MPO’s Performance Dashboard, which provides visualizations of the performance of the Boston region’s transportation system on a variety of transportation-related metrics.
The Commonwealth and the region’s transit agencies also have reporting and evaluation responsibilities. MassDOT and the Commonwealth’s Executive Office of Public Safety and Security report roadway safety target information annually to FHWA and NHTSA. MassDOT reports other statewide performance targets and related information to FHWA on a biennial basis via FHWA’s Performance Management form. The MBTA, MWRTA, and CATA must report their TAM targets to the National Transit Database, and in future years, these agencies will need to create and regularly submit PTASPs, which discuss their targets for transit safety performance measures. These reports generally include information about the progress that has been made with respect to performance measures and targets as compared to previous reports.
Going forward, the MPO will need to put the results of these reports and evaluations to use in its future planning and investment activities. As part of this work, the MPO will improve methods for understanding the impacts of MPO investments on various performance areas, including federally required performance areas and others identified by the MPO. Over time, the MPO expects that its actions in the PBPP, investment, and monitoring and evaluation phases will help ensure that the MPO’s investments are meeting its vision and goals for the region’s transportation system.
This chapter contains the federally required Title VI and environmental justice (EJ) analyses completed for the Recommended Plan programmed in the Long-Range Transportation Plan (LRTP), Destination 2040.6-1 The role of these analyses is to assess how the projects may affect the minority and low-income populations in the Boston region.6-2 The analyses include the mapping of projects funded by the Boston Region Metropolitan Planning Organization (MPO) in the Recommended Plan overlaid on areas where the minority and/or low-income populations exceed their regional thresholds, and disparate impact and disproportionate burden (DI/DB) analyses that determine whether minority and low-income populations may be disproportionately affected by the projects in the Recommended Plan that can be modeled in the aggregate.6-3
These analyses demonstrate the Boston Region MPO’s compliance with Title VI and EJ analytical requirements as they pertain to the LRTP. They also serve to assist the MPO in future decision making concerning minimizing, avoiding, or mitigating any potential future disparate impacts and disproportionate burdens that have been identified. Finally, they help the MPO meet its transportation equity goal.
The transportation needs of minority and low-income populations (as well as other transportation equity [TE] populations)6-4 considered during the development of Destination 2040 are described in the Destination 2040 Needs Assessment. Chapter 8 of the Needs Assessment, Transportation Equity Needs, describes the unmet transportation needs of these populations gathered from public outreach, as well as from data analyses that identify transportation service and infrastructure gaps for TE populations. While Chapter 8 of the Needs Assessment contributed to the programming and planning decisions in Destination 2040, this chapter focuses on the potential impacts of the MPO-funded projects in the Recommended Plan that resulted from that decision-making process.
Two federal mandates underpin the analyses in this chapter: Title VI of the Civil Rights Act of 1964 and the EJ Executive Order (EJ EO), Federal Actions to Address Environmental Justice in Minority Populations and Low-income Populations. As a recipient of federal funding from the Federal Transit Administration (FTA) and the Federal Highway Administration (FHWA), the MPO complies with their Title VI and EJ requirements.
Title VI of the Civil Rights Act prohibits discrimination on the basis of race, color, and national origin under any program or activity that receives federal financial assistance.6-5 This includes unintentional discrimination, which is referred to as disparate impact discrimination. FTA and FHWA require MPOs to conduct several Title VI analyses that apply to the Recommended Plan. These requirements are described in FTA’s Title VI Circular (C) 4702.1B and FHWA’sEnvironmental Justice Reference Guide, which provides guidance for its nondiscrimination program that covers Title VI and the EJ EO.
In 1994, President Clinton issued the EJ EO, which made achieving EJ part of the mission of the executive branch of the federal government. The EJ EO directs federal agencies to incorporate EJ principles into their activities. As part of doing so, they are required to identify and address any potential disproportionately high and adverse environmental and human health effects of their activities on minority populations and low-income populations. These requirements are described in FTA’s EJ Circular (C) 4703.1 and FHWA’s Environmental Justice Reference Guide.
The remainder of this chapter discusses the results of two analyses required by FTA and FHWA guidance:
The MPO’s approach to conducting these analyses began with identifying the share of the minority population and low-income population that lives within defined geographical areas, called transportation analysis zones (TAZ).6-6 First, for each TAZ, MPO staff identified the share of the population that meets the definition of minority and the share that meets the MPO’s definition of low-income. Then the share of each TAZ that belongs to the minority or low-income population is compared to that population’s regional threshold. The threshold for defining a minority population is the average percentage of the minority population for the Boston region, 28.2 percent. The threshold for defining a low-income population is 60 percent of the regional annual household income ($45,392).6-7 If the TAZ meets or exceeds the threshold for the minority population, and/or has an average household income that is equal to or less than the low-income threshold, it is considered a transportation equity zone (TEZ).6-8
Using the approach described above, MPO staff then mapped the minority and low-income TEZs in the Boston region. Figure 6-1 shows the projects in the Recommended Plan that are MPO funded overlaid on TAZs that meet the definition of minority and/or low-income TEZs. (Although the analysis is required only for the minority population, it is also completed for the low-income population to incorporate EJ principles more fully.) About 34 percent of TAZs in the MPO region are minority TEZs, about 10 percent are low-income TEZs, and about 9 percent are both minority and low-income TEZs.6-9 The analysis shows that 6 of the 11 MPO-funded projects in the Recommended Plan intersect with minority and/or low-income TEZs.
Figure 6-1
Recommended Plan Projects in Minority and Low-income Transportation Equity Zones
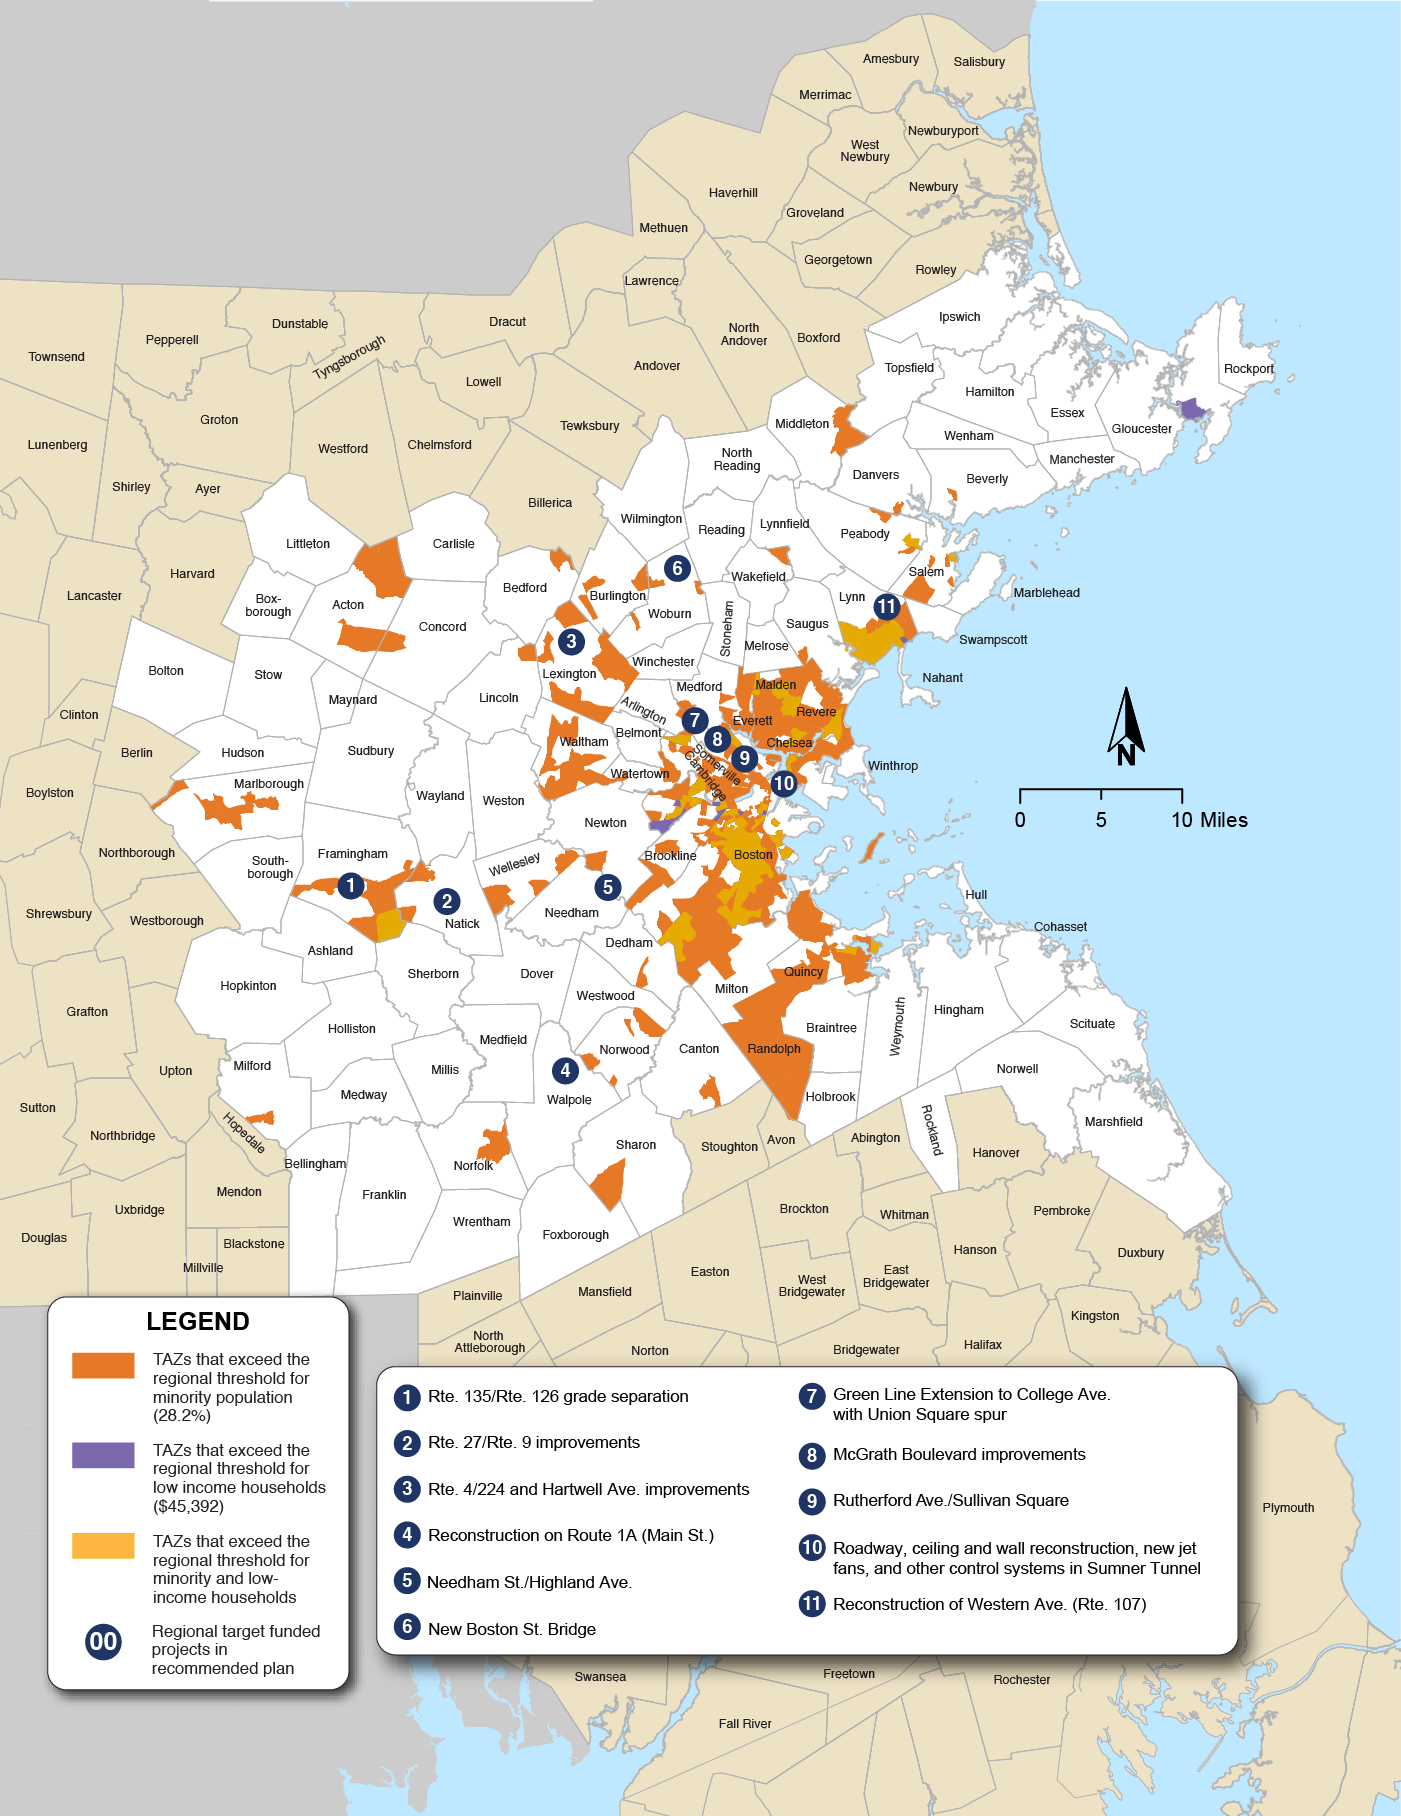
Notes: TEZs are determined as follows:
Criteria for low-income TEZs—A TAZ in which the median household income is less than or equal to 60 percent of the MPO’s region’s median household income ($45,392).
Criteria for minority TEZs—A TAZ in which the minority population is greater than or equal to the MPO region’s average minority population, 28.2%.
Criteria for minority and low-income TEZs—A TAZ that meets the definition for both minority TEZs and low-income TEZs.
TAZ = transportation analysis zone. TEZ = transportation equity zone.
Sources: 2010 US Census, 2010–14 American Community Survey, and the Boston Region MPO.
The DI/DB analyses identify potential future disparate impacts that may result from the modeled projects on minority populations, as well as potential future disproportionate burdens on low-income populations.6-10 Disparate impacts refer to potential future adverse effects that would disproportionately affect minority populations. Disproportionate burdens refer to potential future adverse effects that would disproportionately affect low-income populations. Adverse effects may be either a delay or denial of benefits or an imposition of burdens. The DI/DB analyses assessed a suite of 10 metrics for potential future disparate impacts or disproportionate burdens. The MPO’s draft DI/DB Policy describes how the MPO determines whether impacts are disparate or disproportionate (see Appendix C).
Federal regulations provide MPOs direction on how to conduct DI/DB analyses. Projects must be analyzed as a group and not individually. In addition, potential impacts must be analyzed for the entire minority or low-income population in the region. The analysis does not assess potential impacts to individual communities or municipalities. It also only assesses the impacts of the regionally significant projects in the Recommended Plan that are not already programmed in the Transportation Improvement Program (TIP) and that can be modeled—specifically, those that change the capacity of the transportation network. Those that do not change capacity are analyzed in the TIP, along with projects that are programmed in the other investment programs through the TIP.
MPO staff conducted two DI/DB analyses. The first analyzes only the MPO’s Regional Target-funded projects and the second analyzes MPO- and MassDOT-funded regionally significant projects that are within the Boston region. The projects that were included in the first DI/DB analysis include the following:
The projects that were included in the second DI/DB analysis are as follows:
For the purpose of the analyses, MPO staff assumed that the distribution of the minority population would remain unchanged in 2040 and that the growth rate would be the same as that forecast for the overall population in the region. For the low-income population, the analyses used a forecast of the distribution of various income categories in 2040.
The process for identifying potential future disparate impacts and disproportionate burdens involves comparing the projected impacts on minority populations to those on nonminority populations, and those on low-income populations to those on non-low-income populations. First, two scenarios are run using a regional travel demand model that analyzes these metrics to identify the projected impacts of the transportation network on each of the four populations. One scenario is run in which the transportation network in 2040 includes the modeled projects (build scenario), and one scenario is run where the transportation network in 2040 does not include them (no-build scenario).6-11
For each TAZ, the model produces results for each scenario for the following 10 metrics:
Then, the weighted regionwide average for each metric is calculated for the minority, nonminority, low-income, and non-low-income populations by TAZ. This is calculated for both the no-build and build scenarios. For example, for the minority population, the projected CO emissions per square mile, weighted by the entire minority population in the region, is calculated for both the no-build and build scenarios. The CO emissions per square mile for the no-build scenario are then subtracted from the CO emissions per square mile for the build scenario. This determines the change in CO emissions per square mile that is projected to occur in 2040 as a result of implementing the projects.
After completing this process for all populations, MPO staff applies the LRTP draft DI/DB Policy to determine whether there may be a potential disparate impact for the minority population or a disproportionate burden for the low-income population. In this example, the DI/DB Policy would compare the projected impact on the minority population to that on the nonminority population to determine whether there may be a potential future disparate impact for the minority population.
The MPO’s LRTP draft DI/DB Policy states how the MPO identifies and addresses potential future disparate impacts and disproportionate burdens that may result from the modeled projects. The policy enables the MPO to meet federal requirements in a clear and consistent manner, and it makes the MPO’s approach to identifying and addressing potential future disparate impacts and disproportionate burdens transparent to the public. Because of the similarities between FTA’s and FHWA’s EJ requirements to identify and address disproportionately high and adverse effects of MPO activities and their Title VI disparate impact requirements, the draft policy was developed to meet both.
The policy was used for the first time in Destination 2040. In federal fiscal year (FFY) 2018, MPO staff began the first of a two-phase effort to develop a DI/DB policy for the modeled projects. Over the course of a year, MPO staff conducted public outreach to get input on the policy and the metrics that staff could analyze for potential future disparate impacts and disproportionate burdens. Staff responded to this input by updating those metrics, as well as the DI/DB analysis methodology that is described in this chapter. This included identifying the forecasting error for each metric, which was critical for determining whether the impacts were outside the bounds of the uncertainty inherent to travel demand modeling. Subsequently, MPO staff developed this draft DI/DB Policy that allows the MPO to identify only those impacts that would likely be due to implementation of the modeled projects and avoid labeling impacts as disparate impacts or disproportionate burdens when they would likely be due to forecasting error.
The full draft DI/DB Policy can be found in Appendix C. In sum, it states that there would be a potential future disparate impact or disproportionate burden if
This section describes the results of the two DI/DB analyses. Tables 6-1 through 6-10 report the results for each evaluation metric. Table numbers followed by an “a” indicate that the results are for the MPO’s Regional Target-funded projects only, while table numbers followed by a “b” indicate that the results are for MPO- and MassDOT-funded regionally significant projects. (Both sets of projects refer only to those that can be modeled.) Each table includes the forecasting error (expressed as a percentage) that was calculated for each metric as part of the development of the draft DI/DB Policy and the no-build scenario results.6-14 They also show the range of values for the build scenario that is expected based on the forecasting error. (For example, if the no-build scenario result is 1,000 and the forecasting error is 10 percent, then the expected range of values would be 900 to 1,100.)
Finally, the tables show whether the analysis indicates a potential disparate impact or disproportionate burden. If the no-build scenario result for both the protected and non-protected populations falls within the expected range of values for the build scenario, then there is no disparate impact or disproportionate burden. This is because an overlap indicates that any difference between the build and no-build scenarios is likely due to model uncertainty, not the MPO projects that are being analyzed. It is statistically unlikely that the projects being analyzed disproportionately affect the protected population.
The MPO’s accessibility metrics are based on the number of destinations of various types (jobs, retail, education, and health care) by TAZ that are reachable within a given travel time by transit. The average number of destinations is then calculated for minority, nonminority, low-income, and non-low-income populations, based on their respective shares within each TAZ. These metrics use the number of total jobs, healthcare facilities, institutes of higher education, and retail opportunities as proxies for activity opportunities at destination TAZs. Travel times to jobs were updated to reflect average commute times for the MPO region as documented in the American Community Survey. Access to retail opportunities uses retail jobs as a proxy. Access to higher education uses enrollment data for two- and four-year institutes of higher education as a proxy. Access to health care uses the number of hospital beds as a proxy.
Tables 6-1a and 6-1b show the DI/DB analysis results for access to jobs, Tables 6-2a and 6-2b show the results for access to retail opportunities, Tables 6-3a and 6-3b show the results for access to higher education, and Tables 6-4a and 6-4b shows the results for access to healthcare facilities. The results of the DI/DB analysis of the MPO’s Regional Target-funded projects show that the differences for all four metrics between the build and no-build scenarios are within the forecasting error. Therefore, the analysis indicates that there are no potential disparate impacts or disproportionate burdens for these metrics.
The analysis for the MPO- and MassDOT-funded regionally significant projects also shows that likely there will not be any disparate impacts or disproportionate burdens. The results for two other metrics show there likely will be a positive impact in terms of access to healthcare facilities for minority and nonminority populations and for low-income and non-low-income populations, and access to jobs for minority and nonminority populations. In both cases, the minority or low-income population is projected to benefit more than their respective nonminority or non-low-income populations.
Table 6-1-a
DI/DB Analysis Results for Access to Jobs by Transit—MPO-Funded Regional Target Projects
| Population |
Forecasting Error |
No-build Scenario Result |
Range of Expected Values for the Build Scenario |
Disparate Impact or Disproportionate Burden? |
|---|---|---|---|---|
Minority |
3.3% |
481,608 |
462,864 to 494,455 |
No |
Nonminority |
6.2% |
265,441 |
247,563 to 280,289 |
|
Low-income |
3.7% |
404,775 |
387,326 to 417,090 |
No |
Non-low-income |
5.0% |
305,360 |
288,423 to 318,783 |
Notes: The no-build and build scenarios are for the year 2040. Access to jobs is calculated for those within a 60-minute transit trip and is reported in number of jobs.
DI/DB = Disparate impact and disproportionate burden.
Source: Boston Region MPO.
Table 6-1-b
DI/DB Analysis Results for Access to Jobs by Transit—MPO- and MassDOT-Funded Regionally Significant Projects
| Population |
Forecasting Error |
No-build Scenario Result |
Range of Expected Values for the Build Scenario |
Disparate Impact or Disproportionate Burden? |
|---|---|---|---|---|
Minority |
3.3% |
481,608 |
481,771 to 514,653 |
No |
Nonminority |
6.2% |
265,441 |
249,984 to 281,899 |
|
Low-income |
3.7% |
404,775 |
403,167 to 434,148 |
No |
Non-low-income |
5.0% |
305,360 |
301,338 to 333,058 |
Notes: The no-build and build scenarios are for the year 2040. Access to jobs is calculated for those within a 60-minute transit trip and is reported in number of jobs.
DI/DB = Disparate impact and disproportionate burden.
Source: Boston Region MPO.
Table 6-2a
DI/DB Analysis Results for Access to Retail Opportunities by Transit—MPO-Funded Regional Target Projects
| Population |
Forecasting Error |
No-build Scenario Result |
Range of Expected Values for the Build Scenario |
Disparate Impact or Disproportionate Burden? |
|---|---|---|---|---|
Minority |
9.1% |
52,609 |
47,538 to 57,056 |
No |
Nonminority |
16.6% |
29,522 |
24,485 to 34,232 |
|
Low-income |
10.2% |
44,513 |
39,731 to 48,757 |
No |
Non-low-income |
13.7% |
33,810 |
29,013 to 38,224 |
Notes: The no-build and build scenarios are for the year 2040. Access to retail opportunities is calculated for those within a 60-minute transit trip and are reported in number of retail jobs.
DI/DB = Disparate impact and disproportionate burden.
Source: Boston Region MPO.
Table 6-2b
DI/DB Analysis Results for Access to Retail Opportunities by Transit—MPO- and MassDOT-Funded Regionally Significant Projects
| Population |
Forecasting Error |
No-build Scenario Result |
Range of Expected Values for the Build Scenario |
Disparate Impact or Disproportionate Burden? |
|---|---|---|---|---|
Minority |
9.1% |
52,609 |
49,695 to 59,645 |
No |
Nonminority |
16.6% |
29,522 |
25,778 to 36,040 |
|
Low-income |
10.2% |
44,513 |
41,583 to 51,030 |
No |
Non-low-income |
13.7% |
33,810 |
30,512 to 40,200 |
Notes: The no-build and build scenarios are for the year 2040. Access to retail opportunities is calculated for those within a 60-minute transit trip and are reported in number of retail jobs.
DI/DB = Disparate impact and disproportionate burden.
Source: Boston Region MPO.
Table 6-3a
DI/DB Analysis Results for Access to Higher Education by Transit—MPO-Funded Regional Target Projects
| Population |
Forecasting Error |
No-build Scenario Result |
Range of Expected Values for the Build Scenario |
Disparate Impact or Disproportionate Burden? |
|---|---|---|---|---|
Minority |
3.5% |
50,776 |
48,897 to 52,444 |
No |
Nonminority |
6.0% |
29,372 |
27,563 to 31,082 |
|
Low-income |
3.4% |
44,968 |
43,358 to 46,410 |
No |
Non-low-income |
5.6% |
33,692 |
32,065 to 35,157 |
Notes: The no-build and build scenarios are for the year 2040. Access to higher education is calculated for those within a 40-minute transit trip and is reported in number of students enrolled.
DI/DB = Disparate impact and disproportionate burden.
Source: Boston Region MPO.
Table 6-3b
DI/DB Analysis Results for Access to Higher Education by Transit—MPO- and MassDOT-Funded Regionally Significant Projects
| Population |
Forecasting Error |
No-build Scenario Result |
Range of Expected Values for the Build Scenario |
Disparate Impact or Disproportionate Burden? |
|---|---|---|---|---|
Minority |
3.5% |
50,776 |
49,947 to 53,571 |
No |
Nonminority |
6.0% |
29,372 |
28,336 to 31,954 |
|
Low-income |
3.4% |
44,968 |
44,493 to 47,625 |
No |
Non-low-income |
5.6% |
33,692 |
32,573 to 35,912 |
Notes: The no-build and build scenarios are for the year 2040. Access to higher education is calculated for those within a 40-minute transit trip and is reported in number of students enrolled.
DI/DB = Disparate impact and disproportionate burden.
Source: Boston Region MPO.
Table 6-4a
DI/DB Analysis Results for Access to Healthcare Facilities by Transit—MPO-Funded Regional Target Projects
| Population |
Forecasting Error |
No-build Scenario Result |
Range of Expected Values for the Build Scenario |
Disparate Impact or Disproportionate Burden? |
|---|---|---|---|---|
Minority |
3.2% |
987 |
950 to 1,013 |
No |
Nonminority |
5.8% |
563 |
529 to 594 |
|
Low-income |
3.3% |
892 |
859 to 918 |
No |
Non-low-income |
4.5% |
641 |
610 to 667 |
Notes: The no-build and build scenarios are for the year 2040. Access to healthcare facilities is calculated for those within a 60-minute transit trip and is reported in number of hospital beds.
DI/DB = Disparate impact and disproportionate burden.
Source: Boston Region MPO.
Table 6-4b
DI/DB Analysis Results for Access to Healthcare Facilities by Transit—MPO- and MassDOT-Funded Regionally Significant Projects
| Population |
Forecasting Error |
No-build Scenario Result |
Range of Expected Values for the Build Scenario |
Disparate Impact or Disproportionate Burden? |
|---|---|---|---|---|
Minority |
3.2% |
987 |
1,003 to 1,069 |
No |
Nonminority |
5.8% |
563 |
554 to 622 |
|
Low-income |
3.3% |
892 |
898 to 959 |
No |
Non-low-income |
4.5% |
641 |
640 to 701 |
Notes: The no-build and build scenarios are for the year 2040. Access to healthcare facilities is calculated for those within a 60-minute transit trip and is reported in number of hospital beds.
DI/DB = Disparate impact and disproportionate burden.
Source: Boston Region MPO.
The mobility metrics are used to evaluate the door-to-door travel time for trips produced in and attracted to MPO TAZs. Average travel times are then calculated for minority, nonminority, low-income, and non-low-income populations, based on their respective shares within each TAZ. Trips attracted to TAZs are those that are generated by non-household land uses (such as retail, employment, health care, and education) within the MPO region. They can originate from either households within the MPO region or from outside of the region.6-15 Trips produced in TAZs are those trips generated by households (trip generation varies based on household income, number of cars, and the number of people in the household, among other characteristics). The trips can end either within another TAZ in the region or outside of the region.
Tables 6-5a, 6-5b, 6-6a, and 6-6b show the DI/DB analysis results for the transit trip attraction and production metrics. Tables 6-7a, 6-7b, 6-8a, and 6-8b show the results for the highway trip attraction and production metrics. The results for the DI/DB analysis for both the MPO-funded Regional Target projects and MPO- and MassDOT-funded regionally significant projects for all four of the mobility metrics show that the changes between the build and no-build scenarios fall within the forecasting error. Therefore, both analyses indicate that neither disparate impacts nor disproportionate burdens are likely to occur.
Table 6-5a
DI/DB Analysis Results for Average Transit Travel Times: Trip Attractions—MPO-Funded Regional Target Projects
| Population |
Forecasting Error |
No-build Scenario Result |
Range of Expected Values for the Build Scenario |
Disparate Impact or Disproportionate Burden? |
|---|---|---|---|---|
Minority |
14.5% |
47.8 |
40.9 to 54.7 |
No |
Nonminority |
12.0% |
51.8 |
45.3 to 58.3 |
|
Low-income |
13.0% |
49.5 |
43.0 to 55.9 |
No |
Non-low-income |
12.2% |
51.5 |
45.2 to 57.7 |
Notes: The no-build and build scenarios are for the year 2040. Travel times are in minutes.
DI/DB = Disparate impact and disproportionate burden.
Source: Boston Region MPO.
Table 6-5b
DI/DB Analysis Results for Average Transit Travel Times: Trip Attractions—MPO- and MassDOT-Funded Regionally Significant Projects
| Population |
Forecasting Error |
No-build Scenario Result |
Range of Expected Values for the Build Scenario |
Disparate Impact or Disproportionate Burden? |
|---|---|---|---|---|
Minority |
14.5% |
47.8 |
39.4 to 52.8 |
No |
Nonminority |
12.0% |
51.8 |
43.4 to 55.8 |
|
Low-income |
13.0% |
49.5 |
41.4 to 53.8 |
No |
Non-low-income |
12.2% |
51.5 |
43.3 to 55.3 |
Notes: The no-build and build scenarios are for the year 2040. Travel times are in minutes.
DI/DB = Disparate impact and disproportionate burden.
Source: Boston Region MPO.
Table 6-6a
DI/DB Analysis Results for Average Transit Travel Times: Trip Productions—MPO-Funded Regional Target Projects
| Population |
Forecasting Error |
No-build Scenario Result |
Range of Expected Values for the Build Scenario |
Disparate Impact or Disproportionate Burden? |
|---|---|---|---|---|
Minority |
17.3% |
46.9 |
38.7 to 55.0 |
No |
Nonminority |
15.5% |
51.4 |
43.4 to 59.3 |
|
Low-income |
16.1% |
49.0 |
41.1 to 56.8 |
No |
Non-low-income |
15.7% |
50.9 |
42.9 to 58.9 |
Notes: The no-build and build scenarios are for the year 2040. Travel times are in minutes.
DI/DB = Disparate impact and disproportionate burden.
Source: Boston Region MPO.
Table 6-6b
DI/DB Analysis Results for Average Transit Travel Times: Trip Productions—MPO- and MassDOT-Funded Regionally Significant Projects
| Population |
Forecasting Error |
No-build Scenario Result |
Range of Expected Values for the Build Scenario |
Disparate Impact or Disproportionate Burden? |
|---|---|---|---|---|
Minority |
17.3% |
46.9 |
37.3 to 52.9 |
No |
Nonminority |
15.5% |
51.4 |
41.5 to 56.8 |
|
Low-income |
16.1% |
49.0 |
39.5 to 54.6 |
No |
Non-low-income |
15.7% |
50.9 |
41.1 to 56.4 |
Notes: The no-build and build scenarios are for the year 2040. Travel times are in minutes.
DI/DB = Disparate impact and disproportionate burden.
Source: Boston Region MPO.
Table 6-7a
DI/DB Analysis Results for Average Highway Travel Times: Trip Attractions—MPO-Funded Regional Target Projects
| Population |
Forecasting Error |
No-build Scenario Result |
Range of Expected Values for the Build Scenario |
Disparate Impact or Disproportionate Burden? |
|---|---|---|---|---|
Minority |
13.9% |
19.1 |
16.4 to 21.8 |
No |
Nonminority |
13.1% |
19.0 |
16.5 to 21.6 |
|
Low-income |
13.2% |
18.8 |
16.3 to 21.3 |
No |
Non-low-income |
13.2% |
19.0 |
16.5 to 26.1 |
Notes: The no-build and build scenarios are for the year 2040. Travel times are in minutes.
DI/DB = Disparate impact and disproportionate burden.
Source: Boston Region MPO.
Table 6-7b
DI/DB Analysis Results for Average Highway Travel Times: Trip Attractions—MPO- and MassDOT-Funded Regionally Significant Projects
| Population |
Forecasting Error |
No-build Scenario Result |
Range of Expected Values for the Build Scenario |
Disparate Impact or Disproportionate Burden? |
|---|---|---|---|---|
Minority |
13.9% |
19.1 |
16.4 to 21.7 |
No |
Nonminority |
13.1% |
19.0 |
16.5 to 21.5 |
|
Low-income |
13.2% |
18.8 |
16.3 to 21.2 |
No |
Non-low-income |
13.2% |
19.0 |
16.5 to 21.5 |
Notes: The no-build and build scenarios are for the year 2040. Travel times are in minutes.
DI/DB = Disparate impact and disproportionate burden.
Source: Boston Region MPO.
Table 6-8a
DI/DB Analysis Results for Average Highway Travel Times: Trip Productions—MPO-Funded Regional Target Projects
| Population |
Forecasting Error |
No-build Scenario Result |
Range of Expected Values for the Build Scenario |
Disparate Impact or Disproportionate Burden? |
|---|---|---|---|---|
Minority |
13.2% |
19.1 |
16.6 to 21.6 |
No |
Nonminority |
13.2% |
19.0 |
16.5 to 21.6 |
|
Low-income |
13.1% |
18.8 |
16.4 to 21.3 |
No |
Non-low-income |
13.3% |
19.0 |
16.5 to 21.6 |
Notes: The no-build and build scenarios are for the year 2040. Travel times are in minutes.
DI/DB = Disparate impact and disproportionate burden.
Source: Boston Region MPO.
Table 6-8b
DI/DB Analysis Results for Average Highway Travel Times: Trip Productionss—MPO- and MassDOT-Funded Regionally Significant Projects
| Population |
Forecasting Error |
No-build Scenario Result |
Range of Expected Values for the Build Scenario |
Disparate Impact or Disproportionate Burden? |
|---|---|---|---|---|
Minority |
13.2% |
19.1 |
16.5 to 21.5 |
No |
Nonminority |
13.2% |
19.0 |
16.5 to 21.5 |
|
Low-income |
13.1% |
18.8 |
16.3 to 21.2 |
No |
Non-low-income |
13.3% |
19.0 |
16.5 to 21.5 |
Notes: The no-build and build scenarios are for the year 2040. Travel times are in minutes.
DI/DB = Disparate impact and disproportionate burden.
Source: Boston Region MPO.
The two environmental metrics are congested VMT and CO emissions per square mile. While the other metrics evaluate the impacts affecting users of the roadway or transit system, these metrics assess the VMT and CO impacts on residents. Both are calculated based on highway trips, not transit trips. The CO metric assesses the CO emissions per square mile within each TAZ. The congested VMT metric assesses the volume-to-capacity ratio on the roads within or adjacent to each TAZ; those with a ratio of 0.75 or greater are considered congested.
Tables 6-9a and 6-9b show the DI/DB analysis results for congested VMT per square mile and Tables 6-10a and 6-10b show the results for CO emissions per square mile. The results for the DI/DB analysis for both the MPO-funded Regional Target projects and MPO- and MassDOT-funded regionally significant projects show that the projected differences for both metrics are within the forecasting error. Therefore, both analyses indicate that neither disparate impacts nor disproportionate burdens are likely to occur for these metrics.
Table 6-9a
DI/DB Analysis Results for Congested VMT—MPO-Funded Regional Target Projects
| Population |
Forecasting Error |
No-build Scenario Result |
Range of Expected Values for the Build Scenario |
Disparate Impact or Disproportionate Burden? |
|---|---|---|---|---|
Minority |
16.3% |
110,490 |
89,797 to 124,772 |
No |
Nonminority |
22.6% |
81,396 |
61,390 to 97,241 |
|
Low-income |
16.5% |
102,537 |
83,379 to 116,331 |
No |
Non-low-income |
20.3% |
92,044 |
71,169 to 107,423 |
Notes: The no-build and build scenarios are for the year 2040. Congested VMT is determined by analyzing the volume-to-capacity ratio on the roads within each TAZ. Those with a ratio of 0.75 or greater are considered congested.
DI/DB = Disparate impact and disproportionate burden. VMT = vehicle-miles traveled.
Source: Boston Region MPO.
Table 6-9b
DI/DB Analysis Results for Congested VMT—MPO- and MassDOT-Funded Regionally Significant Projects
| Population |
Forecasting Error |
No-build Scenario Result |
Range of Expected Values for the Build Scenario |
Disparate Impact or Disproportionate Burden? |
|---|---|---|---|---|
Minority |
16.3% |
110,490 |
90,759 to 126,108 |
No |
Nonminority |
22.6% |
81,396 |
62,184 to 98,498 |
|
Low-income |
16.5% |
102,537 |
84,761 to 118,259 |
No |
Non-low-income |
20.3% |
92,044 |
71,992 to 108,665 |
Notes: The no-build and build scenarios are for the year 2040. Congested VMT is determined by analyzing the volume-to-capacity ratio on the roads within each TAZ. Those with a ratio of 0.75 or greater are considered congested.
DI/DB = Disparate impact and disproportionate burden. VMT = vehicle-miles traveled.
Source: Boston Region MPO.
Table 6-10a
DI/DB Analysis Results for CO Emissions—MPO-Funded Regional Target Projects
| Population |
Forecasting Error |
No-build Scenario Result |
Range of Expected Values for the Build Scenario |
Disparate Impact or Disproportionate Burden? |
|---|---|---|---|---|
Minority |
11.9% |
184 |
158 to 201 |
No |
Nonminority |
17.2% |
134 |
109 to 154 |
|
Low-income |
12.6% |
172 |
147 to 189 |
No |
Non-low-income |
15.4% |
150 |
123 to 168 |
Notes: The no-build and build scenarios are for the year 2040. CO emissions are per square mile and are reported in kilograms.
CO = Carbon monoxide. DI/DB = Disparate impact and disproportionate burden.
Source: Boston Region MPO.
Table 6-10b
DI/DB Analysis Results for CO Emissions—MPO- and MassDOT-Funded Regionally Significant Projects
| Population |
Forecasting Error |
No-build Scenario Result |
Range of Expected Values for the Build Scenario |
Disparate Impact or Disproportionate Burden? |
|---|---|---|---|---|
Minority |
11.9% |
184 |
160 to 203 |
No |
Nonminority |
17.2% |
134 |
110 to 156 |
|
Low-income |
12.6% |
172 |
149 to 192 |
No |
Non-low-income |
15.4% |
150 |
125 to 171 |
Notes: The no-build and build scenarios are for the year 2040. CO emissions are per square mile and are reported in kilograms.
CO = Carbon monoxide. DI/DB = Disparate impact and disproportionate burden.
Source: Boston Region MPO.
The MPO’s DI/DB analyses found that both the MPO’s Regional Target-funded projects and the MPO- and MassDOT-funded regionally significant projects that can be modeled in the Recommended Plan, in the aggregate, would likely not result in any potential future disparate impacts or disproportionate burdens. This means that no further action is required by the MPO.
In FFY 2020, MPO staff will conduct a study to develop thresholds for each metric that will allow the MPO to determine when a potential impact to the minority or low-income populations would be significantly greater than the potential impact to the nonminority or non-low-income population, respectively. Federal guidance states that disparate impacts and disproportionate burdens are those impacts where the minority or low-income population may be affected significantly more than the nonminority or non-low-income population. The study will define the meaning of significantly more for each metric. When the study is completed, MPO staff will update the draft DI/DB Policy to reflect the findings, and subsequently seek MPO endorsement.
This chapter presents information about the air quality analyses required by both federal and state legislation for the Boston Region Metropolitan Planning Organization’s (MPO) Long-Range Transportation Plan (LRTP), Destination 2040. The first section documents the MPO’s air quality conformity determination for the 1997 ozone National Ambient Air Quality Standards (NAAQS) and carbon monoxide (CO) NAAQS. There is a discussion of the applicable conformity requirements according to the latest regulations, regional designation status, legal considerations, and federal guidance. The second section outlines the legislation and regulations requiring carbon dioxide (CO2) emission reductions in the transportation sector, including the Global Warming Solutions Act and Title 310 of the Code of Massachusetts Regulations, Section 60.05 (310 CMR 60.05), as it applies to the Massachusetts Department of Transportation (MassDOT).
The 1990 Clean Air Act Amendments (CAAA) require MPOs within nonattainment and maintenance areas to perform air quality conformity determinations prior to the approval of LRTPs and Transportation Improvement Programs (TIPs), and at such other times as required by regulation.
A nonattainment area is a location that the US Environmental Protection Agency (EPA) has designated as not meeting certain air quality standards. A maintenance area is a location formerly designated as a nonattainment area that now meets the standards and has been redesignated as maintaining the standard. A conformity determination shows that highway and transit plans, programs, and projects are consistent with the State Implementation Plan (SIP) for attaining the air quality standards. The CAAA requirement to perform a conformity determination ensures that federal funding supports transportation activities that are consistent with air quality goals.
CAAA Section 176(c) (Title 42, United States Code [USC], Section 7506 [c]) requires that federally funded or approved highway and transit activities are consistent with (“conform to”) the purpose of the SIP, such that Federal Highway Administration (FHWA) and Federal Transit Administration (FTA) funding and approvals are awarded to highway and transit activities that will not
The EPA’s transportation conformity rules establish the criteria and procedures for determining whether metropolitan transportation plans (i.e. LRTPs), TIPs, and federally supported highway and transit projects conform to the SIP (Title 40, Code of Federal Regulations [CFR], Parts 51.390 and 93).
The Commonwealth of Massachusetts was previously classified as a nonattainment area for ozone and was divided into two nonattainment areas. The Eastern Massachusetts ozone nonattainment area included Barnstable, Bristol, Dukes, Essex, Middlesex, Nantucket, Norfolk, Plymouth, Suffolk, and Worcester counties. The Western Massachusetts ozone nonattainment area included Berkshire, Franklin, Hampden, and Hampshire counties. In both areas, the 1990 CAAA required the Commonwealth to reduce its emissions of volatile organic compounds and nitrogen oxides (NOx), the two major precursors to ozone formation, to achieve attainment of the ozone standard.
The 1970 Clean Air Act defined a one-hour NAAQS for ground-level ozone. The 1990 CAAA further classified degrees of nonattainment of the one-hour standard based on the severity of the monitored levels of the pollutant. The Commonwealth was classified as being in serious nonattainment for the one-hour ozone standard and was required to be in attainment by 1999. The attainment date was later extended, first to 2003 and then to 2007.
In 1997, the EPA proposed a new, eight-hour ozone standard that replaced the one-hour standard effective June 15, 2005. Scientific research had shown that ozone could affect human health at lower levels and over longer exposure times than one hour. The new standard was challenged in court and, after a lengthy legal battle, the courts upheld it. The new standard was finalized in June 2004. The new eight-hour standard is 0.08 parts per million (ppm), averaged over eight hours, and not to be exceeded more than once per year. Nonattainment areas were again further classified based on the severity of the eight-hour values. Both Eastern and Western Massachusetts were classified as being in moderate nonattainment for the eight-hour standard.
In March 2008, the EPA published revisions to the eight-hour ozone NAAQS establishing a level of 0.075 ppm, (Volume 73, Federal Register [FR], page 16438; March 27, 2008). In 2009, EPA announced it would reconsider this standard because it fell outside of the range recommended by the Clean Air Scientific Advisory Committee. However, EPA did not take final action on the reconsideration and kept the standard at 0.075 ppm.
After reviewing data from monitoring stations in Massachusetts, EPA sent a letter on December 16, 2011, proposing that only Dukes County be designated as a nonattainment area for the new proposed 0.075 ozone standard. The Commonwealth concurred with these findings.
On May 21, 2012, the final rule (77 FR 30088) was published in the Federal Register, defining the 2008 NAAQS at 0.075 ppm. A second rule (77 FR 30160) published on May 21, 2012, revoked the 1997 ozone NAAQS effective July 20, 2013.
Also on May 21, 2012, the Federal Register published the air quality designation areas for the 2008 NAAQS. In this Federal Register, Dukes County was the only area in the Commonwealth designated as a nonattainment area. All other Massachusetts counties were designated as in attainment or unclassified for the 2008 standard. On March 6, 2015, the EPA published the Final Rulemaking, “Implementation of the 2008 National Ambient Air Quality Standards (NAAQS) for Ozone: State Implementation Plan Requirements; Final Rule” (80 FR 12264), effective April 6, 2015. This rulemaking confirmed the removal of transportation conformity to the 1997 ozone NAAQS.
However, on February 16, 2018, the United States Court of Appeals for the District of Columbia Circuit inSouth Coast Air Quality Mgmt. District v. EPA(“South Coast II,” 882 F.3d 1138) held that transportation conformity determinations must be made in areas that were designated either as nonattainment or maintenance areas for the 1997 ozone NAAQS and attainment areas for the 2008 ozone NAAQS when the 1997 ozone NAAQS was revoked.
On November 29, 2018, the EPA issuedTransportation Conformity Guidance for the South Coast II Court Decision(EPA-420-B-18-050, November 2018) that addresses how transportation conformity determinations can be made in these areas. According to the guidance, both Eastern and Western Massachusetts, along with several other areas across the country, are now defined as orphan nonattainment areas—areas that were designated as nonattainment areas for the 1997 ozone NAAQS at the time of its revocation (80 FR 12264, March 6, 2015) and were designated as attainment areas for the 2008 ozone NAAQS in the EPA’s original designations rule for this NAAQS (77 FR 30160, May 21, 2012). Conformity determinations are now required in these areas after February 16, 2019.
As a result of the South Coast II court ruling and the subsequent federal guidance, transportation conformity for the 1997 ozone NAAQS is required after February 16, 2019, for both of Massachusetts’ orphan areas. This ruling was intended as an “anti-backsliding” measure to ensure that areas do not revert to nonattainment status. Therefore, the Boston Region MPO's LRTP, Destination 2040, must conform to the 1997 ozone NAAQs.
The transportation conformity regulation in 40 CFR 93.109 sets forth the criteria and procedures for determining conformity. The conformity criteria for TIPs and LRTPs include the following: fiscal constraint (93.108), latest planning assumptions (93.110), latest emissions model (93.111), consultation (93.112), transportation control measures (93.113(b) and (c)), and emissions budget and/or interim emissions (93.118 and/or 93.119).
Transportation conformity for TIPs and LRTPs for the 1997 ozone NAAQS can be demonstrated without a regional emissions analysis, per 40 CFR 93.109(c). This provision states that the regional emissions analysis requirement applies one year after the effective date of EPA’s nonattainment designation for a NAAQS and until the effective date of revocation of such NAAQS for an area. The 1997 ozone NAAQS revocation was effective on April 6, 2015, and the South Coast II court ruling upheld the revocation. As no regional emission analysis is required for this conformity determination, there is no requirement to use the latest emissions model, budget, or interim emissions tests.
Therefore, transportation conformity for the 1997 ozone NAAQS for the Boston Region MPO’s LRTP can be demonstrated by showing that the remaining requirements in 40 CFR 93.109 have been met. The following requirements are detailed in Section 2.4 of EPA’s guidance and are addressed below:
The use of the latest planning assumptions in 40 CFR 93.110 of the conformity rule generally applies to regional emissions analyses. In the 1997 ozone NAAQS areas, this requirement applies to assumptions about transportation control measures (TCMs) in an approved SIP (see the section titled Timely Implementation of Transportation Control Measures below).
The consultation requirements in 40 CFR 93.112 were addressed for interagency consultation and public consultation. Interagency consultation was conducted with FHWA, FTA, United States EPA Region 1, the Massachusetts Department of Environmental Protection (DEP), and the other Massachusetts MPOs. The most recent conformity consultation meeting was held on March 6, 2019, which focused on understanding the latest conformity-related court rulings and resulting federal guidance. This ongoing consultation is conducted in accordance with the following items:
Public consultation was conducted consistent with planning rule requirements in 23 CFR 450. Both 23 CFR 450.324 and 310 CMR 60.03(6)(h) require that the development of the TIP, LRTP, and related certification documents provide an adequate opportunity for public review and comment. Section 450.316(b) also establishes the outline for MPO public participation programs. The Boston Region MPO’s Public Participation Plan was formally adopted in October 2014 and is available at https://www.ctps.org/public_involvement. The Public Participation Plan ensures that the public will have access to the TIP and LRTP and all supporting documentation, provides for public notification of the availability of the TIP and LRTP, ensures the public’s right to review the document and comment thereon, provides a 21-day public review period prior to the adoption of the TIP and a 30-day public review period prior to the adoption of the LRTP and related certification documents.
The public review period for this conformity determination commenced on July 25, 2019. During the 30-day public review period, all comments received were incorporated into this LRTP. This allowed sufficient opportunity for public comment of the draft document and for MPO members to address the public comments. The public review period closed on August 23, 2019 and the Boston Region MPO endorsed this air quality conformity determination on August 29, 2019. These procedures comply with the associated federal requirements.
TCMs were submitted to the EPA as SIP revisions in 1979 and 1982, and as part of the Central Artery/Tunnel (CA/T) project. The TCMs in the 1979 and 1982 submissions were accomplished through construction of ongoing projects or implementation of ongoing programs.
The TCMs submitted as part of the mitigation for the CA/T project have been documented in the LRTP as recommended or completed projects, except for the Fairmount Line Improvement Project and the Green Line Extension project.
MassDOT works with the DEP to implement TCMs documented in the SIP. The Boston Region MPO will continue to include relevant projects in the LRTP and TIP, including those projects implemented to provide equal or better emissions outcomes when the primary TCMs do not meet deadlines, until the process for completing all active TCMs has concluded. When the process has been completed, the MPO will amend the LRTP and future TIPs and their conformity determinations to document any changes (including any interim projects or programs).
The status of the TCMs has been updated in the SIP Transit Commitments Status Report, which MassDOT submitted to the DEP in July 2018. Highlights from the report are presented below. For a detailed description of the status of these projects, please visit the MassDOT website at https://www.mass.gov/files/documents/2018/08/02/SIP18ComStatReport.pdf.
The Four Corners and Newmarket stations on the Fairmount commuter rail line opened for service on July 1, 2013. All change orders have been paid and the project is officially closed out. The Talbot Avenue Station opened in November 2012.
The station at Blue Hill Avenue had been the subject of significant community controversy over the past seven years. Redesign of the station reached the 100 percent design phase and those plans were submitted to MassDOT in March 2016. In October 2016, MassDOT updated the public on the design plans and the next steps toward implementing the project. The project team advanced the project with the understanding that continued coordination with the community was paramount.
Construction began in spring 2017, and the station opened in March 2019.
MassDOT and the Massachusetts Bay Transportation Authority (MBTA) prepared a Petition to Delay and an Interim Emission Offset Plan to be implemented for the duration of the delay of the Fairmount Line Improvement Project. MassDOT estimated the amount of emission reduction that would be expected from the implementation of the new Fairmount Line stations. With input from Fairmount Line stakeholders, MassDOT proposed offset measures that would meet emission reduction targets while the project remains under construction. The measures include providing shuttle bus service in Boston connecting Andrew Square to Boston Medical Center and increasing service on MBTA bus Route 31, which serves the Boston neighborhoods of Dorchester and Mattapan. These measures were implemented on January 2, 2012, and are currently in place.
Funding Source: The Commonwealth
The Green Line Extension project is a top transportation priority of the Commonwealth and the largest expansion of the MBTA rapid transit system in decades. This project will extend the MBTA Green Line from a relocated Lechmere Station in East Cambridge to College Avenue in Medford, with a branch to Union Square in Somerville. The project is a collaborative effort of MassDOT and the MBTA, with the MBTA taking the lead in design, engineering, construction, and project management.
The project includes the relocation of the existing commuter rail tracks, the construction of 4.7 miles of new Green Line tracks and systems, one relocated station (Lechmere) and six new stations (Union Square, College Avenue, Ball Square, Magoun Square, Gilman Square, and East Somerville), and a new vehicle maintenance facility.
Construction of the project has been phased. Initial construction started in 2013. The first phase was funded entirely by the Commonwealth of Massachusetts. The FTA then approved funding for the project through the New Starts Program of its Capital Investment Grants Program; a Full Funding Grant Agreement (FFGA), which committed nearly $1 billion in federal funds to the project, was announced in January 2015.
Late in 2015, MassDOT launched a review and decided that the project should be redesigned. The revised total program cost was estimated at nearly $2.3 billion. (This total value includes monies that have already been spent.) There was a difference of approximately $300 million between the last official program cost of $1.992 billion, as stated in the FFGA, and the revised estimate of $2.289 billion. To make up the difference, the Boston Region MPO committed $157 million in federal highway funding to the project, the cities of Cambridge and Somerville committed a total of $75 million ($50 million from Somerville and $25 million from Cambridge), and MassDOT committed approximately $64 million. In June 2017, the MassDOT Board of Directors voted to transfer the latter funds to the MBTA for the project. The FTA found that the redesigned project is consistent with the FFGA and this determination allows MassDOT and the MBTA to use federal monies to fund the project.
The 2016 redesign of the Green Line Extension project modified many design elements and proposed changes to the project implementation methods, but the redesign maintains the core functionality of the project and provides the same benefits. As with the original project design, the revised design consists of a 4.7-mile extension of the existing Green Line light rail service to College Avenue in Medford and Union Square in Somerville. It includes the relocation of existing commuter and freight rail track, construction of light rail track and systems, construction or rehabilitation of viaduct structures, and implementation of new power systems, signals, and communications equipment. The revised design includes the same stations in the same locations as originally planned.
Factors that affect the potential number of transit trips that would be generated and the air quality benefits that would be achieved because of this new light rail extension are the same for the redesign concept as originally proposed. These factors include the number and location of stations, platform size, hours of service, and frequency of service. (The Somerville Community Path was not considered in determining the number of transit trips the new rail line would generate.)
The Green Line Extension, as redesigned, will still provide trains travelling on six-minute headways in the weekday peak period, eight to 11 minutes in the weekday off-peak period, 13 to 14 minutes on weekday evenings, and eight to 10 minutes on weekends.
The project, as described in its environmental documents, included planning, design, and engineering for the proposed extension of the Somerville Community Path between Lowell Street and Inner Belt Road near East Somerville Station; however, there was no commitment to construct the path. After the completion of the state and federal environmental review processes, the MBTA decided to incorporate the construction of the path into the Green Line Extension project. However, the MBTA did not commit to build the Community Path as part of its mitigation for delays in the construction timeline for the extension.
While the elimination of the Community Path would result in the greatest savings, MassDOT and the MBTA believe the path is an important element of the project and a commitment to the communities along the Green Line corridor. Therefore, the Community Path was redesigned so that it will cost less while still maintaining its core functionality. In December 2017, the MBTA issued a notice to proceed to the selected contractor to build the Green Line Extension project, including the Community Path to Lechmere Station. That element is now part of the project under contract.
MassDOT has committed substantial resources to the Green Line Extension project and has transitioned the project from the planning and environmental review phases to design, engineering, and eventual construction, while completing the tasks associated with applying for federal New Starts funding.
By filing an Expanded Environmental Notification Form, procuring multiple design consultants, and publishing Draft Environmental Impact Reports and Final Environmental Impact Reports (FEIR), MassDOT met the first four interim milestones established by the Massachusetts SIP for the Green Line Extension project.
By completing the design, securing all permits and approvals, executing the FFGA, and acquiring the necessary property for the project, MassDOT met the fifth interim milestone, which states, “On or before 18 months after MEPA’s issuance of a certificate on an FEIR or an SEIR, MassDOT must complete final design, apply for all necessary permits, funds and grants, file any required legislation, and initiate all public and private land acquisition.”7-2
Milestones for project completion have been established and made part of the design-build contract. The milestones will be incorporated into that contract. By establishing these milestones, MassDOT has met the sixth and final interim milestone found in the SIP regulation, which states, “Upon completion of all of the above milestones, DEP and MassDOT shall establish a schedule for project construction and deadlines for project completion.”
In the 2011 SIP Status Report, MassDOT reported that the Green Line Extension project would not be completed by the legal deadline of December 31, 2014.
The time line for overall project completion represents a substantial delay beyond the current SIP deadline of December 31, 2014. This delay triggered the need to provide interim emission reduction offset measures for the period of the delay (beginning January 1, 2015). These offset measures would have to bring about emission reductions equal to or greater than those projected for the Green Line Extension, as specified in the SIP regulation, for the period of the delay.
Working with the Central Transportation Planning Staff, MassDOT and the MBTA calculated the reductions of non-methane hydrocarbon, CO, and NOx required as mitigation for the delay.
In June 2012, MassDOT released a list of potential mitigation ideas received from the public that could be used as offset measures. In the summer and fall of 2012, MassDOT elicited public comments on these potential measures. The MBTA created an internal working group to determine a final portfolio of interim mitigation measures to implement by December 31, 2014, the legal deadline for implementation of the Green Line Extension.
This work resulted in a recommendation to implement the following three interim mitigation measures, which collectively would meet the emission reduction targets for the project:
MassDOT submitted a Petition to Delay to the DEP on July 22, 2014. The petition further expands on the analysis and determination of the interim offset measures. The DEP conditionally approved MassDOT’s request to delay the project and the implementation of the above mitigation measures. Both the Petition to Delay and the Conditional Approval are available on MassDOT’s website. These measures went into effect at the beginning of 2015 and will remain in place for as long as necessary.
Funding Source: The Commonwealth, Federal Transit Administration via the FFGA, the Boston Region MPO, the City of Cambridge, and the City of Somerville
Former MassDOT Secretary Richard Davey approved construction of the permitted Russia Wharf Ferry Terminal in South Boston and a $460,000 ferry-service startup subsidy in October 2012. The 2005 facility plans and specifications were revised to meet the latest MassDOT Highway Division standards. The bid package was issued in the fall of 2013. A contractor was selected and the notice to proceed was issued in April 2014. Pre-construction activities progressed, but contractual issues associated with the project design led MassDOT to decide to rebid the contract.
There is no regularly scheduled passenger water transportation service in South Boston, nor are there any plans to provide such a service. The City of Boston, however, is undertaking design and engineering work to address the Old Northern Avenue Bridge and will consider ferry vessel clearance. The City received a grant in 2012 to purchase two ferry vessels for use in Boston’s inner harbor, and these vessels could serve the Russia Wharf Ferry Terminal. The Massachusetts Convention Center Authority (MCCA) is working with the City of Boston, MassDOT, and other agencies to develop a business plan for potential ferry service from Lovejoy Wharf to the South Boston waterfront, as recommended in the 2015South Boston Waterfront Sustainable Transportation Plan. This business plan will include current and future demand projections for ferry ridership, the number and size of ferries needed to satisfy the demand, and the cost for this service. Once the business plan is completed, the MCCA could take over the City of Boston’s grant to help with future costs.
Funding Source: The Commonwealth
Transportation conformity requirements in 40 CFR 93.108 state that TIPs and LRTPs must be fiscally constrained consistent with United States Department of Transportation’s metropolitan planning regulations in 23 CFR part 450. The Boston Region MPO LRTP, Destination 2040 is consistent with the required fiscal constraints, as demonstrated in Chapter 3.
The requirement to perform a conformity determination for CO for several cities in the Boston region has expired. On April 1, 1996, the EPA classified the Cities of Boston, Cambridge, Chelsea, Everett, Malden, Medford, Quincy, Revere, and Somerville as in attainment (in compliance) for CO emissions. Subsequently, a CO maintenance plan was set up through the Massachusetts SIP to ensure that emission levels did not increase. While the maintenance plan was in effect, past TIPs and LRTPs included an air quality conformity analysis for these communities. As of April 1, 2016, however, the 20-year maintenance period for this CO maintenance area expired and transportation conformity is no longer required for this pollutant in these communities. This ruling is documented in a letter from the EPA dated May 12, 2016.
On April 22, 2002, the City of Waltham was redesignated as being in attainment for CO emissions with an EPA-approved limited-maintenance plan. In areas that have approved limited-maintenance plans, federal actions requiring conformity determinations under the EPA’s transportation conformity rule are considered to satisfy the budget test (as budgets are not treated as being constraining in these areas for the length of the initial maintenance period). Any requirements for future project-level conformity determinations for projects located within this community will continue to use a hot-spot analysis to ensure that any new transportation projects in this area do not cause or contribute to violations of the NAAQS for CO.
The Boston Region MPO has prepared this conformity determination for the 1997 ozone NAAQS in accordance with the EPA’s and the Commonwealth’s latest conformity regulations and guidance. This conformity determination process demonstrates that the Destination 2040 LRTP meets the Clean Air Act and Transportation Conformity Rule requirements for the 1997 ozone NAAQS, and has been prepared following all the guidelines and requirements of these rules during this period.
Therefore, the implementation of the Boston Region MPO’s LRTP is consistent with the air quality goals of, and in conformity with, the Massachusetts SIP.
The largest environmental challenge transportation planners in the Boston region face is the need to reduce greenhouse gas (GHG) emissions that contribute to climate change. Climate change will likely have significant impacts on the Boston region if climate trends continue as projected. In order to minimize the negative impacts, the MPO is taking steps to decrease the region’s carbon footprint and to simultaneously adapt our transportation system to minimize damage from natural hazards. The MPO strongly considers projects and strategies that protect and enhance the environment, promote energy conservation, and improve the quality of life in the region.
The Commonwealth has enacted regulations to reduce greenhouse gases from all sectors, including transportation. This section outlines the legislation and regulation pertinent to the MPO’s responsibility to contribute to emissions reductions. It also documents the GHG emissions that would be produced from the implementation of projects in this LRTP and other MPOs’ LRTPs in the Commonwealth.
The Global Warming Solutions Act (GWSA) was enacted in August 2008. The act requires a 25 percent reduction of GHG emissions from 1990 levels by 2020 and an 80 percent reduction from 1990 levels by 2050. This policy directive was developed in accordance with the GWSA. Its three goals are as follows:
Subsequently, the DEP established a regulation called the Global Warming Solutions Act Requirements for the Transportation Sector and the Massachusetts Department of Transportation (310 CMR 60.05). The purpose of this regulation is to assist the Commonwealth in achieving its adopted GHG emission reduction goals by the following means:
The Boston Region MPO is involved in helping to achieve MassDOT’s goals. The MPO is most directly involved in helping to achieve GHG emissions reductions through prioritizing and programming an appropriate balance of roadway, transit, bicycle, and pedestrian investments. The MPO also will assist by supporting smart growth development patterns through the creation of a balanced multimodal transportation system. The Boston MPO’s Clean Air and Sustainable Communities goal and related objectives guides the selection of projects for both the LRTP and TIP to further the MPO’s vision for a sustainable, healthy, livable, and economically vibrant region. The MPO’s focus on this goal also will help MassDOT to achieve its policy directive goals. The MPO’s objective is to reduce GHG emissions generated in the region by all transportation modes as outlined in the GWSA.
The MPO is contributing to the statewide implementation of MassDOT’s policy directive in a number of other ways:
MassDOT coordinated with MPOs and the staffs of regional planning agencies to implement GHG tracking and evaluate the development of each MPO’s federal fiscal year (FFY) 2012 and 2016 LRTPs. This collaboration continued during the development of the MPOs’ FFY 2020 LRTPs and FFYs 2020–24 TIPs. Working together, MassDOT and the MPOs have attained the following milestones:
MassDOT’s statewide estimates of CO2 emissions resulting from the collective list of all recommended projects in all the Massachusetts LRTPs combined are presented below. The latest planning assumptions, including updated socio-economic projections for the Commonwealth, were incorporated during the calculation of those estimates.
Table 7-1
Massachusetts Statewide Carbon Dioxide Emission Estimates
Year |
CO2 Action Emissions |
CO2 Baseline Emissions |
Difference (Action – Base) |
2016 |
86,035.6 |
86,035.6 |
Not applicable |
2020 |
75,675.6 |
75,865.9 |
-190.3 |
2040 |
54,484.2 |
54,702.2 |
-218.0 |
Note: The emissions estimates are based on tons of carbon dioxide per summer day.
CO2 = carbon dioxide.
Source: Massachusetts Department of Transportation.
As shown in Table 7-1, collectively all the projects programmed in the LRTPs in the 2020 Action scenario provide a statewide reduction of more than 190 tons of CO2 per day compared to the baseline case. The 2040 Action scenario estimates a reduction of 218 tons of CO2 emissions compared to the baseline case.
These results demonstrate that the transportation sector is expected to make positive progress toward meeting the GHG reduction targets and complying with the requirements of the GWSA. MassDOT and the MPOs will continue to advocate for steps needed to accomplish the Commonwealth’s long-term goals for greenhouse gas reductions.
This analysis estimates only the expected emissions of projects that are included in the statewide travel demand model (larger, regionally significant projects). The emissions impacts of many other types of projects that cannot be accounted for in the model (such as bicycle and pedestrian facilities, shuttle services, and intersection improvements) are evaluated in the regional TIPs with either “qualitative” assessments of likely CO2 change or actual quantitative estimates listed for each project.
To monitor and evaluate the GHG impacts of TIP projects, MassDOT and the MPOs have developed approaches for identifying the anticipated GHG emission impacts of different project types. All projects funded through the TIP have been sorted into two main categories for analysis: projects with quantified impacts and projects with assumed impacts. Projects with quantified impacts consist of projects programmed in the LRTP that would add capacity to the transportation system and projects programmed in the TIP that underwent a Congestion Mitigation and Air Quality spreadsheet analysis. Projects with assumed impacts include those that would be expected to produce a minor decrease or increase in emissions and that would be assumed to have no CO2 impact. A detailed description of project evaluations included in the TIP is cited in Appendix B of the FFY 2020–2024 TIP (http://www.bostonmpo.org/Drupal/tip). The collective GHG reduction from the projects programmed in the Boston Region MPO’s TIP is approximately 13,600 tons per year.
Working closely with MassDOT, the Boston Region MPO will continue to report on its actions to comply with the GWSA and help meet the GHG reduction targets. As part of this activity, the MPO will provide further public information on the topic and will advocate for steps needed to accomplish the MPO’s and state’s goals for greenhouse gas reductions.
In addition to mitigation measures, the MPO acknowledges the importance of adaptation measures to moderate potential damage from climate change impacts. The Boston Region MPO’s System Preservation and Modernization goal focuses the MPO on selecting projects that improve the ability of the transportation system to withstand extreme conditions. Projects that improve evacuation routes or access routes to facilities that support emergency response earn higher ratings in the project evaluation process. Similarly, the evaluation process rewards projects that protect against sea-level rise and flooding, meet current seismic design standards, and protect critical infrastructure. These criteria will help identify future transportation investments to address the impacts of climate change.
The Destination 2040 Long-Range Transportation Plan (LRTP) provides a 20-year vision for transportation in the Boston Metropolitan area and creates the framework that the Metropolitan Planning Organization (MPO) will use to set its priorities for future federally funded transportation planning studies and capital improvement projects. With adoption by the MPO and approval by the Federal Highway Administration and the Federal Transit Administration, the Destination 2040 LRTP will guide the MPO in its decision making over the next four years. Each year, the MPO will identify priority studies and capital projects that support Destination 2040’s goals and objectives and program those studies and projects in the MPO’s Unified Planning Work Program (UPWP) and its Transportation Improvement Program (TIP), respectively. The LRTP, UPWP, and the TIP make up the set of federally required certification documents produced by the MPO.
The completed Destination 2040 LRTP is a culmination of activities that began with the Needs Assessment in 2017, which documents needs and issues that the MPO expects will affect the region’s transportation system over the next 20 years. The MPO incorporated findings from the Needs Assessment into the various phases of the long-range plan, including updates to the MPO’s vision, goals, and objectives; re-examination of the investment programs that guide funding decisions; and selection of regionally significant capital projects that must be programmed in the LRTP. The detailed information in the Needs Assessment will continue to be an important resource for the MPO as it takes steps to implement Destination 2040 through the UPWP, the TIP, and its performance-based planning and programming (PBPP) process.
The UPWP is the planning element of the MPO’s set of certification documents and is guided by the visions, goals, objectives, and investment framework established in the LRTP. The UPWP prioritizes federal transportation planning funding for both the Central Transportation Planning Staff (CTPS), which is the staff to the Boston MPO, and the Metropolitan Area Planning Council (MAPC), which is the regional planning agency for the Boston region. It includes work programs, studies, and other activities that these two agencies will conduct during the course of a federal fiscal year (FFY), which runs from October 1 through September 30. UPWP-funded task categories include the following:
The outputs of the work programmed in the UPWP assist with numerous aspects of the transportation planning process, as laid out in the vision of the LRTP. These may include the following:
MPO staff annually develops the UPWP over the course of the FFY with guidance from the MPO’s UPWP Committee. Detailed information about the UPWP is available at www.ctps.org/upwp.
The TIP is the implementation arm of the LRTP and prioritizes funding for transportation infrastructure projects throughout the metropolitan area. Each year, the MPO evaluates and selects projects that will receive federal dollars for construction over the next five FFYs and programs them in the TIP. The development of the TIP is guided by the vision, goals, objectives, and investment framework established in the LRTP. The transportation infrastructure investments funded in the TIP are categorized by the following investment programs established in the LRTP:
Detailed information about the TIP is available at www.ctps.org/tip.
Destination 2040 allocates funding for major infrastructure projects in the Boston region. Major infrastructure projects are those that cost more than $20 million and/or would add capacity to the transportation network. These projects are required to be listed in the LRTP. Destination 2040 also lists the specific capital investment programs that are funded in the TIP. If over the next four years, the MPO decides to program a major infrastructure project or add a new investment program in the TIP that is not listed in Destination 2040, an amendment to the LRTP will be required.
Chapter 5 (Systems Performance Report) describes the three phases of the MPO’s PBPP process: (1) planning, (2) investing, and (3) monitoring and evaluating.
Planning: During this phase, the MPO identifies performance measures and targets that it will use to assess its progress in achieving its LRTP-based vision, goals, and objectives. Chapter 5 describes the federally required performance measures that the MPO will monitor, and the current set of MPO performance targets that it will use to check its progress. Moving forward, the MPO will establish and track additional performance measures that relate to its goals and objectives, including through its Congestion Management Process (CMP).
Investing: As discussed previously, the MPO will allocate its funds to studies and transportation projects through the UPWP and TIP, its key implementation tools. When making choices about how to spend its dollars, the MPO will consider how candidate projects and studies address its goals, objectives, and performance measures, where applicable.
Monitoring and Evaluating: As the MPO invests its funds, it will continually review and report on its progress with respect to its performance measures. Chapter 5 of Destination 2040 defines the baseline state of the Boston region’s transportation system using federally required performance measures, and future LRTPs will compare progress to this baseline. The MPO will provide updates on its performance targets annually in its TIP, which will also describe how it expects TIP projects will support progress on performance measures and achieve performance targets. Finally, the MPO will use other tools to describe performance, including its Performance Dashboard and its CMP Express Highway and Arterial Roadway Performance Dashboard (all available at bostonmpo.org/applications). Collectively, these activities will help the MPO understand whether its investments are moving the region’s transportation system in a desirable direction, and to make adjustments when needed.
More information about the MPO’s PBPP activities is available at bostonmpo.org/performance.
As described above, the MPO’s LRTP, TIP, and UPWP direct funds to planning studies and projects aimed at improving the region’s transportation system and meeting established goals and objectives. The MPO’s relatively new focus on PBPP will allow it to measure progress made towards regional transportation goals and to decide whether and how to modify its investment decisions in response to performance. Figure 8-1 illustrates this feedback relationship between planning, investing, and monitoring.
Figure 8-1
MPO Planning Process
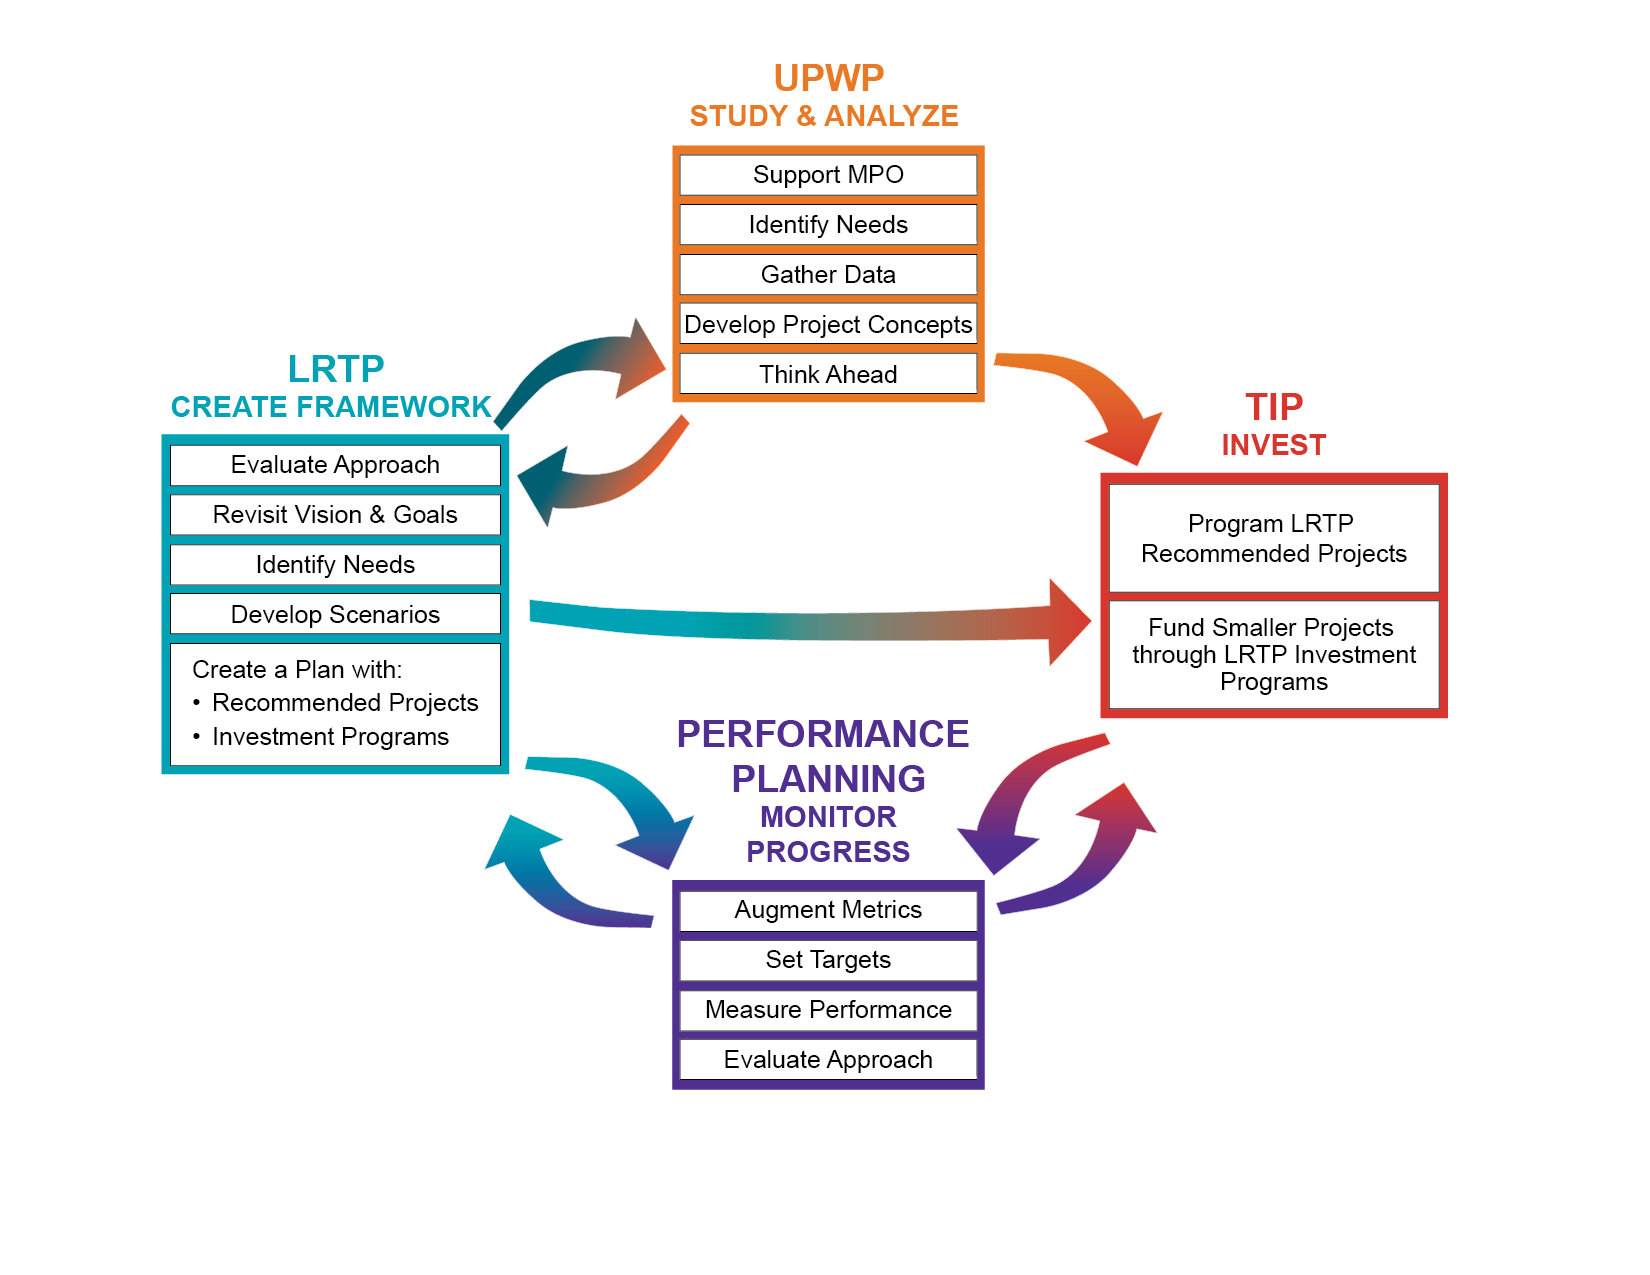
LRTP = long-range transportation plan. MPO = Metropolitan Planning Organization. TIP = Transportation Improvement Program. UPWP = Unified Planning Work Program.
Source: Boston Region MPO.
To achieve Destination 2040’s vision for the Boston region’s transportation system, the MPO will need to work with its partner agencies and other stakeholders on an ongoing basis. The MPO will continue to work with Massachusetts Department of Transportation (MassDOT), the Massachusetts Bay Transportation Authority (MBTA), and the regional transit authorities, which describe their planned investments in MassDOT’s five-year , to implement a comprehensive set of investments that address the region’s transportation safety, state of good repair, mobility, and other needs. The MPO will also build and maintain relationships with the region’s municipalities, other transit providers, and other stakeholders to find solutions and take advantage of opportunities that support a sustainable, healthy, livable, and economically vibrant region.
The MPO updates the LRTP every four years, but opportunities to provide information on transportation needs and to participate in the MPO’s planning process are ongoing. The MPO invites the public to participate in the transportation planning process in a variety of ways as identified below.
The following are ways for the public to stay informed about the MPO transportation planning process:
The following are ways for the public to get involved in the MPO transportation planning process:
ES-1 A DI/DB analysis is conducted for MPO-funded regional Target projects and for MassDOT and MPO-funded regionally significant projects. Both analyses include only those that would change the capacity of the transportation network and so can be modeled.
ES-2 A disparate impact is an effect from a facially neutral policy or practice that disproportionately affects members of a group based on their race, color, or national origin, where the recipient’s policy or practice lacks a substantial legitimate justification and where there exists one or more alternatives that would serve the same legitimate objectives but with a less disproportionate effect on the basis of race, color, or national origin.
A disproportionate burden refers to a neutral policy or practice that disproportionately affects low-income populations more than non-low-income populations. A finding of a disproportionate burden requires the recipient to evaluate alternatives and mitigate burdens where practicable.
1-1 The MPO added climate resiliency improvements under the Complete Streets program based on input received during the development of the Needs Assessment for Destination 2040. Staff will further define this program through work performed as part of the UPWP, MPO investment program sizing, and LRTP and TIP project selection criteria revisions. The MPO will build on efforts underway by other entities including municipalities and state agencies..
1-2 A disparate impact is a facially neutral policy or practice that results in impacts that disproportionately affects members of a group based on their race, color, or national origin, where the recipient’s policy or practice lacks a substantial legitimate justification and where there exists one or more alternatives that would serve the same legitimate objectives but with less disproportionate effect on the basis of race, color, or national origin. A disproportionate burden refers to a neutral policy or practice that disproportionately affects low-income population’s more than non-low-income populations. A finding of a disproportionate burden requires the recipient to evaluate alternatives and mitigate burdens where practicable.
2-1 More information can be found in Chapter 5–System Performance Report.
3-1 U.S. Department of Transportation Research and Innovative Technology Administration John A. Volpe National Transportation Systems Center, Fiscal Constraint in Long-Range Transportation Planning: Best Practices Case Studies, 2012. Accessed on June 22, 2019 at https://www.planning.dot.gov/documents/fiscalConstraint_rpt.pdf, pg. 4.
3-2 The Boston Region MPO defines a major infrastructure project as one that costs more than $20 million and/or adds capacity to the existing system through the addition of a travel lane, construction of an interchange, the extension of a commuter rail or rapid transit line, or the procurement of additional (not replacement) public transportation vehicles. For more information, see Chapter 4.
3-3 U.S. Department of Transportation Research and Innovative Technology Administration John A. Volpe National Transportation Systems Center, Fiscal Constraint in Long-Range Transportation Planning: Best Practices Case Studies, pg. 4.
3-4 U.S. Department of Transportation Federal Highway Administration. “Fixing America’s Surface Transportation Act or ‘FAST Act:’ Summary of Highway Provisions.” Accessed June 22, 2019 at https://www.fhwa.dot.gov/fastact/summary.cfm.
3-5 U.S. Department of Transportation Federal Highway Administration. “Fixing America’s Surface Transportation Act or ‘FAST Act:’ Apportionment.” Accessed June 22, 2019 at https://www.fhwa.dot.gov/fastact/factsheets/apportionmentfs.cfm.
3-6 U.S. Department of Transportation Federal Highway Administration. Funding Federal-aid Highways. January 2017. Accessed July 10, 2019 at https://www.fhwa.dot.gov/policy/olsp/fundingfederalaid/FFAH_2017.pdf, pg. 34.
3-7 U.S. Congressional Research Service. Funding and Financing Highways and Public Transportation. June 7, 2019. Accessed June 22, 2019 at https://crsreports.congress.gov/product/pdf/R/R45350, pg. 1.
3-8 U.S. Congressional Research Service. Funding and Financing Highways and Public Transportation, pg. 1.
3-9 U.S. Congressional Research Service. Funding and Financing Highways and Public Transportation., pg. ii.
3-10 U.S. Department of Transportation Federal Highway Administration. “Fixing America’s Surface Transportation Act or ‘FAST Act:’ Summary of Highway Provisions.”
3-11 Two construction contracts included in the Accelerated Bridge Program have been terminated and their remaining scope has been transferred to other projects. See Massachusetts Department of Transportation. “Accelerated Bridge Program (ABP) Update.” Accessed June 22, 2019 at https://www.mass.gov/service-details/accelerated-bridge-program-abp-update.
3-12 Massachusetts Department of Transportation. 2020-2024 Capital Investment Plan. June 2019. Accessed June 25, 2019 at https://www.mass.gov/service-details/capital-investment-plan-cip.
3-13 Congressional Research Service. Federal Public Transportation Program: In Brief. May 14, 2019. Accessed June 26, 2019 at https://fas.org/sgp/crs/misc/R42706.pdf, pg. 2.
3-14 US Department of Transportation Federal Transit Administration. “FTA Circular 9030.1E: Urbanized Area Formula Program: Program Guidance and Application Instructions.” January 16, 2014. Accessed July 10, 2019 at https://www.transit.dot.gov/sites/fta.dot.gov/files/docs/FINAL_FTA_circular9030.1E.pdf, pg. E-1.
3-15 Massachusetts Bay Transportation Authority. “Capital Needs Assessment: Presentation to the Fiscal Management and Control Board.” May 13, 2019. Accessed June 26, 2019 at https://cdn.mbta.com/sites/default/files/fmcb-meeting-docs/2019/05-may/2019-05-13/originals/2019-05-13-fmcb-H-capital-needs-assessment.pdf, pg. 13.
3-16 Massachusetts Bay Transportation Authority. “Capital Needs Assessment: Presentation to the Fiscal Management and Control Board,” pg. 14.
3-17 Massachusetts Bay Transportation Authority. “Capital Needs Assessment: Presentation to the Fiscal Management and Control Board,” pg. 24.
3-18 Ibid, 24.
3-19 MetroWest Regional Transit Authority. MetroWest Regional Transit Authority Transit Asset Management Plan. Revised September 2018. pg. 16.
3-20 Massachusetts Legislature. Chapter 359 of the Acts of 2014, amending Chapter 10, Section 35T. Accessed July 2, 2019 at https://malegislature.gov/Laws/SessionLaws/Acts/2014/Chapter359.
4-1 A transportation analysis zone (TAZ) is a sub-division of communities
5-1 The Boston Region MPO defines a major infrastructure project as one that costs more than $20 million and/or adds capacity to the existing system through the addition of a travel lane, construction of an interchange, the extension of a commuter rail or rapid transit line, or the procurement of additional (not replacement) public transportation vehicles. For more information, see Chapter 4.
5-2 Urbanized Areas (UZAs) are defined by the US Census Bureau to represent the urban cores of metropolitan areas. The Boston UZA includes the 97 municipalities in the Boston Region MPO and includes portions of neighboring MPOs in eastern Massachusetts, New Hampshire, and Rhode Island.
5-3 The MPO has not yet set targets for the transit safety performance measures as described in Table 5-2. The Public Transportation Agency Plan Final Rule goes into effect in July 2019, and transit agencies must develop their initial PTASPs and performance targets by July 2020. Once targets are available from the Boston region’s public transit providers, the MPO will set targets for the region.
5-4 Massachusetts Strategic Highway Safety Plan, 2018, pg. I, available at https://www.mass.gov/files/documents/2019/01/18/dot_SHSP_2018.pdf
5-5 MassDOT defines serious injuries as incapacitating injuries, which it identifies through incident reporting by police and vehicle operators using the Commonwealth of Massachusetts Motor Vehicle Crash Operator Report.
5-6 MassDOT’s first TAMP will be finalized in 2019.
5-7 National Bridge Inventory data is used to rate these components on a scale of zero (worst) to nine (best). The FHWA has classified these bridge ratings into good (seven, eight, or nine on the scale), fair (five or six), or poor (four or less).
5-8 Culverts are assigned an overall condition rating.
5-9 FHWA’s IRI thresholds for good, fair, and poor condition differ from those currently used by the MPO. For federally required NHS pavement condition performance measures, IRI values considered good are those less than 95; those considered fair are between 95 and 170; and those considered poor are greater than 170.
5-10 MassDOT continues to measure pavement quality and set atatewide short-term and long term targets in the MassDOT Trucker using the Pavement Service Ability Index (PSI) which is a different index than IRI.
5-11 CATA used useful life criteria as defined in FTA Circular 5010.1E (Award Management Requirements) for ULB values. MWRTA used useful life criteria as defined in MassDOT’s Fully Accessible Vehicle Guide and in FTA Circular 5010.1E for ULB values.
5-12 States and MPOs must calculate LOTTR values for four time periods: weekdays from 6:00 AM to 10:00 AM, weekdays from 10:00 AM to 4:00 PM, weekdays from 4:00 PM to 8:00 PM, and weekend days from 6:00 AM to 8:00 PM.
5-13 FHWA, “Frequently Asked Questions: Target Setting,” https://www.fhwa.dot.gov/tpm/faq.cfm#targ, accessed September 14, 2018.
5-14 States and MPOs must calculate TTTR Index values for five time periods: weekdays from 6:00 AM to 10:00 AM, weekdays from 10:00 AM to 4:00 PM, weekdays from 4:00 PM to 8:00 PM, weekend days from 6:00 AM to 8:00 PM, and all days from 8:00 PM to 6:00 AM.
5-15 A precursor is a chemical compound that reacts with other chemical compounds in the presence of solar radiation to form pollutants.
5-16 FHWA requires state DOTs and MPOs to use 60 percent of the posted speed limit for the segment or 20 miles per hour, whichever is greater.
5-17 FHWA requires states and MPOs to use the period from 6:00 AM to 10:00 AM to represent the morning peak period, but allows these agencies to choose either 3:00 PM to 7:00 PM or 4:00 PM to 8:00 PM to represent the evening peak period. MassDOT and NH DOT selected the period from 3:00 PM to 7:00 PM to represent the evening peak period for the Boston UZA.
5-18 Rhode Island was not included in the calculation of this measure because it does not include any portion of the Boston UZA’s NHS network. See FHWA’s Applicability Determination: CMAQ Traffic Congestion and CMAQ On-Road Mobile Source Emissions Measures (23 CFR 490.707 and 490.807), and Change Log: Applicability Determination for CMAQ Measures,” May 22, 2018.
5-19 US American Community Survey, “Commuting Characteristics by Sex,” American Community Survey Five-Year Estimates.
5-20 FHWA allows States and MPOs to measure non-SOV travel using US Census American Community Survey estimates of the percentage of workers who commute to work using modes other than driving alone (such as taking a carpool, vanpool, or public transit; bicycling; walking; or telecommuting); travel surveys that reveal mode choices; or sample of continuous counts of travelers using different modes.
5-21 FHWA assesses the CMAQ performance management requirements that apply to states and MPOs every two years. FHWA conducted its most recent assessment in August 2017, at which time the MPO was only subject to emissions performance management requirements for its carbon monoxide maintenance area in Waltham. FHWA will conduct its next assessment by October 1, 2019, after which the MPO may be subject to requirements for other pollutants or precursors. More details about the MPO’s air quality conformity status are available in Chapter 7.
5-22 Massachusetts Department of Transportation, Massachusetts Freight Plan, 2017. Available at mass.gov/service-details/freight-plan, pgs. 1-5 to 1-6.
5-23 For more information about MetroFuture, visit www.mapc.org/get-involved/metrofuture-our-regional-plan/.
5-24 People who identify as minorities are those who identify as Hispanic or Latino/a/x and/or a race other than white.
5-25 MPO staff identifies TE populations using US Census and American Community Survey data. Staff tabulates LEP status for the population age five and older, and tabulates disability status for the noninstitutionalized population. The low-income threshold for the Boston region is set using the region’s median household income, which is $75,654, according to the 2010–14 American Community Survey data. The Boston region’s low-income threshold is 60 percent of this value, which is $45,392.
5-26 A disparate impact is a facially neutral policy or practice that results in impacts that disproportionately affects members of a group based on their race, color, or national origin, where the recipient’s policy or practice lacks a substantial legitimate justification and where there exists one or more alternatives that would serve the same legitimate objectives but with a less disproportionate effect on the basis of race, color, or national origin.
5-27 A disproportionate burden refers to a neutral policy or practice that disproportionately affects low-income populations more than non-low-income populations. A finding of a disproportionate burden requires the recipient to evaluate alternatives and mitigate burdens where practicable.
5-28 For crash clusters based on2014–16 or 2007–16 data, MassDOT adjusted the EPDO weighting scheme to reflect costs associated with crashes. For more information, see MassDOT 2016 Top Crash Location Report, December 2016, https://www.mass.gov/files/documents/2019/03/01/dot-2016TopCrashLocationsRpt.pdf, pages 4-6.
6-1 The Recommended Plan consists of regionally significant projects, including those that are financed by MPO Regional Target funds. Regionally significant projects are those that change the capacity of the transportation network and/or cost more than $20 million.
6-2 A minority person is one who identifies as American Indian or Alaska Native; Asian; Native Hawaiian or other Pacific Islander; Black or African American; some other race other than White; and/or Hispanic or Latino/a/x. A low-income person is one who lives in a household in which the annual household income is less than or equal to 60 percent of the Boston region’s average of $75,654. This threshold equals $45,392. It reflects the high cost of living in the Boston region.
6-3 A DI/DB analysis is conducted for both regionally significant Target-funded projects that can be modeled, as well as for all regionally significant projects that can be modeled.
6-4 The MPO considers TE populations to include those protected by federal laws and regulations and those that have specific transportation needs beyond federally protected groups. Specifically, TE populations include the following demographic groups:
People who identify as minority, have limited English proficiency, are 75 years of age or older or 17 years of age or younger, or who have a disability; and,
People who are members of low-income households or transit-dependent households.
6-5 These protections were subsequently clarified to include people with limited English proficiency through Executive Order 13166, Improving Access to Services for Persons with Limited English Proficiency, which was signed on August 11, 2000.
6-6 The TAZ is the unit of geography most commonly used in regional travel demand models. The spatial extent of TAZs typically ranges from very large (less densely developed) areas in suburban communities to as small as city blocks or buildings in (more densely developed) central business districts. The MPO region is divided into 1,901 TAZs.
6-7 Minority and low-income status are derived from the 2010 US Census and the 2010–14 American Community Survey, respectively.
6-8 These thresholds were developed based on federal guidance. The FTA Title VI Circular states that a predominantly minority area is one where the share of the minority population exceeds the average in the region. It also states that a predominantly low-income area is one where the share of the low-income population exceeds the average in the region.
6-9 Individual maps of TEZs for each population can be found in Chapter 8 of the Needs Assessment.
6-10 A disparate impact is a facially neutral policy or practice that results in impacts that disproportionately affect members of a group based on their race, color, or national origin, where the recipient’s policy or practice lacks a substantial legitimate justification and where there exists one or more alternatives that would serve the same legitimate objectives but with a less disproportionate effect on the basis of race, color, or national origin.
A disproportionate burden refers to a neutral policy or practice that disproportionately affects low-income populations more than non-low-income populations. A finding of a disproportionate burden requires the recipient to evaluate alternatives and mitigate burdens where practicable.
6-11 The modeling region includes all of Massachusetts, Rhode Island, and southeastern New Hampshire, in addition to the MPO region. This allows travel demand modeling analyses to account for trips that originate in or end outside of the MPO region. Model results are only reported for the MPO region’s 1,901 TAZs.
6-12 Accessibility metrics only analyze public transit trips; there is a high degree of uncertainty in modeling highway trips, so accessibility by highway metrics were not used in this analysis. The access to jobs and retail metrics were updated in this LRTP to reflect the unweighted average travel times to jobs reported in the American Community Survey. Given a lack of data about average travel times to healthcare facilities and higher education, travel time thresholds remained at 40 minutes.
6-13 Highway trips consist of automobile and truck trips taken on any road in the MPO region. It does not include bus trips.
6-14Note that in the tables, the no-build results are the same for both the MPO Regional Target-funded projects analysis and the analysis of the MassDOT- and MPO-funded regionally significant projects. This is because the same no-build scenario was used in both analyses.
6-15 Trips ending or originating outside of the MPO region are only those within the modeled area, which includes all of Massachusetts and Rhode Island, as well as southern New Hampshire. Only surface transportation trips are included—air travel is not.
7-1 The memorandum of understanding was being updated at the time of this publication.
7-2 MEPA = Massachusetts Environmental Policy Act. SEIR = Supplemental Environmental Impact Report.