
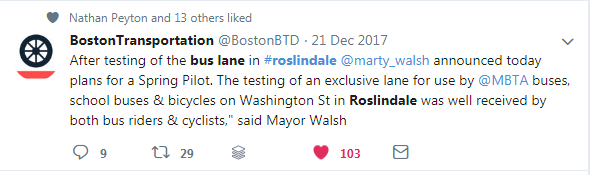
On June 7, following a four-week pilot, the City of Boston announced the permanent installation of a bus lane on Washington Street between Roslindale Square and the Forest Hills MBTA station. This corridor was identified as a candidate for a bus lane through MPO staff work, which examined corridors in the Boston region where buses are routinely delayed in traffic.
The installation of dedicated lanes for buses is a promising strategy for improving the reliability and speed of bus service at a relatively low cost. Some transit advocates, transit service providers, and municipal officials in the Boston region are supportive of expanding the network of bus lanes; however, implementing a bus lane requires a significant amount of collaboration between the transit operators and the entities that own the roadways and signals on which they operate. Implementation is further complicated by the need to carve out space on roadways for the dedicated bus lane. This is usually accomplished by eliminating on-street parking and sometimes a travel lane; neither option is popular with motorists. And any change that comes at the expense of the ease of parking can be a hard sell for politicians and officials.
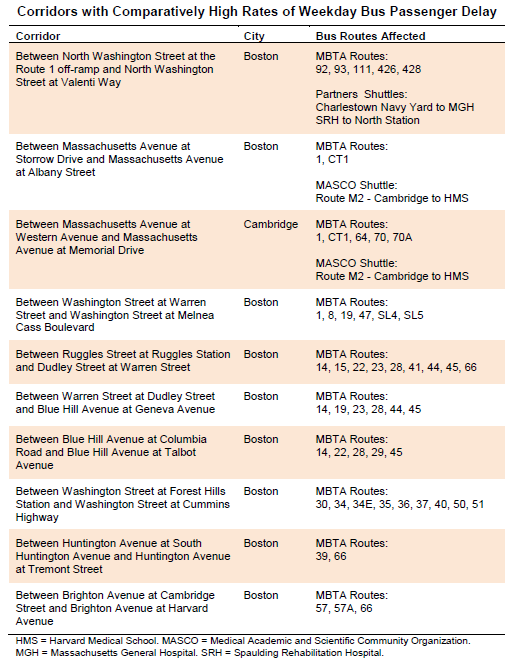
high rates of weekday bus passenger delay.
Despite these challenges, bus lanes are being put into place in the Boston region. A pop-up bus lane tested by the City of Everett
in December of 2016 was well received by bus riders and transit advocates, and was made permanent within a year.
Improvements to the bus network in the Boston region are a major facet of Focus40, the Massachusetts Department of Transportation’s (MassDOT) strategic 25-year investment plan for the MBTA. As part of Focus40 efforts, MassDOT asked the Boston Region Metropolitan Planning Organization’s (MPO) staff to identify locations where dedicated bus lanes could provide the most benefit to riders.
“The idea was to have us look at the entire region to see where bus passengers are experiencing the most delay, and where it makes sense to focus bus lane efforts,” said Nick Hart, an analyst who worked on the study.
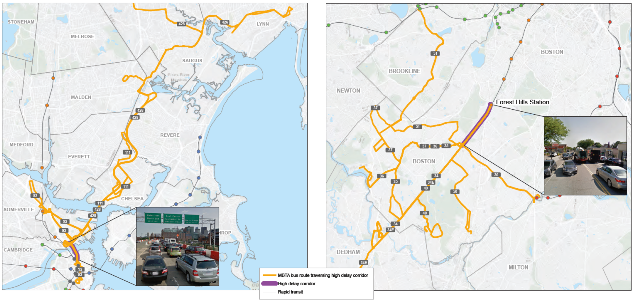
Hart and Jonathan Belcher, who co-authored the study, used traffic speed and bus passenger count data to identify roadways across the bus network where riders experience significant delays as a result of traffic. The study revealed ten corridors that could benefit from dedicated bus lanes; the corridors are located in Boston and Cambridge.
One of the locations identified in the study was the Washington Street corridor in Roslindale. As a result of the study findings, the MBTA and the City of Boston tested a bus lane on the corridor using traffic cones for two days in December 2017. The response from bus passengers (and some bicyclists and motorists) was generally positive, prompting the City to conduct a four-week pilot beginning on May 7, 2018. The pilot was deemed a success, and on June 4 the MBTA’s Fiscal and Management Control Board (FMCB) committed to work with the City to make the bus lane permanent. The City officially announced that the bus lane would be made permanent three days later.
Part of MassDOT’s strategy for replicating the success of the Roslindale bus lane is anticipating the concerns that residents, businesses, and motorists have about losing dedicated parking. MPO staff are finishing a follow-up study designed specifically to assess traffic and parking on seven of the initially identified roadway segments (and a roadway segment in Chelsea, where three of the MBTA’s key bus routes operate in tandem). This new study will inform city planners and officials of the potential effects of restricting on-street parking on these segments during the morning rush hour, hopefully providing municipal stakeholders the resources they need to coordinate the reallocation of existing roadway space for bus lanes and address the possible impacts of bus lanes on parking.
both identified as corridors where buses experience significant delays.
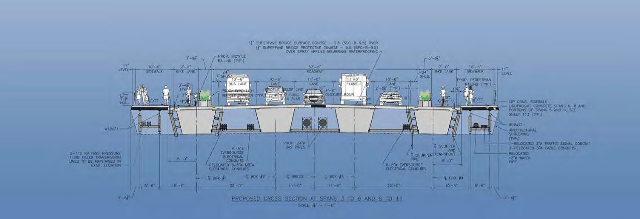
In addition to the Roslindale pilot, MassDOT worked with the City of Boston to re-evaluate the initial designs for the reconstruction of the North Washington Street Bridge, which connects the North End and Charlestown neighborhoods.
“At the time of the study, the design sketches didn’t include bus lanes, but given the amount of delay passengers were experiencing on the routes that traverse the bridge, MassDOT felt it would be beneficial to add one. The new designs show that you can create a lane for buses and still have plenty of space for people to walk and bike across the bridge,” said Hart.
Because MassDOT is responsible for the maintenance and repair of the North Washington Street Bridge facilities, changing the
Street Bridge in the early 1900s.
design to include room for a bus lane on that section of the corridor could be done relatively quickly. Streetcars operated on the North Washington Street Bridge from 1900 until 1949, when they were replaced by buses. As a result of the findings from this study, transit vehicles will have a dedicated right-of-way on the bridge for the first time in more than 70 years.
Recently, the Barr Foundation’s BostonBRT initiative awarded grants of $100,000 to several municipalities in the Greater Boston area—Cambridge and Watertown, Everett, and Arlington—to advance bus lane projects. A pilot on Mount Auburn Street in Cambridge and Watertown is planned for late summer 2018. The pilot is partly spearheaded by Tegin Teich, a transportation planner for the City of Cambridge and a member of the board of the Boston Region MPO representing the Regional Transportation Advisory Council.
The Roslindale pilot shows that, with a concerted effort to foster coordination between agencies and an emphasis on data collection—not to mention vocal transit ridership—it is possible to implement dedicated bus lanes that ultimately may ease congestion for all transportation modes. The more transit-supportive strategies cities and towns can implement on roadways, the more new transit riders may be attracted, and the more compact, walkable, transit-oriented neighborhoods can flourish.